Abstract
Objective:
To evaluate trends in glaucoma procedures in the US Medicare population and to evaluate which physicians are performing newer procedures.
Design:
Analysis of publicly available claims and payment data.
Subjects:
Surgeons and beneficiaries enrolled in US Medicare between 1994 and 2017.
Methods:
Data regarding payments to physicians by the Centers for Medicare and Medicaid Services (CMS) were downloaded for the years 2012-2017. Data regarding claims to CMS by physicians were requested and processed between 1994 and 2017. Procedure counts from both data sets were then normalized for changes in the Medicare population with 1995 as the baseline. The normalized volumes of procedures over time were visualized, as were geographic distributions of surgeons and their volume of procedures.
Main Outcome Measures:
Trends in procedure counts over time, geographic distribution of surgeons and their volume of procedures.
Results:
The number of trabeculectomies continues to decline and is now similar to the number of tubes. Use of the relatively new trabecular bypass shunts has increased rapidly. Surgeons performing these procedures are less likely to be performing traditional glaucoma surgeries as well. The number of laser-based cyclodestruction procedures increased after introduction of the endoscopic technique and again with the introduction of “micropulse”. The procedure counts obtained with physician payment data are consistently lower than those from claims data given the limitations of the payment data.
Conclusions:
Glaucoma practice patterns change each time a new device or procedure is introduced. Collectively, the new Micro-invasive glaucoma surgery (MIGS) procedures have rapidly increased in their utilization such that they now account for a significant majority of glaucoma surgeries. Given the almost complete lack of comparative data to inform surgeon choices regarding these procedures, it will be important that randomized studies are carried out to fill this gap.
Keywords: glaucoma, surgery, Medicare, claims, payment
Precis
The distribution of glaucoma surgeries performed in the US Medicare population has changed rapidly with recent introduction of new procedures. Surgeons performing the newer procedures tend to perform fewer traditional glaucoma surgeries.
Introduction
The introduction of so-called Micro-Invasive Glaucoma Surgeries (MIGS) is likely the most important change in glaucoma management over the past several years. This is a heterogeneous group of procedures variously designed to decrease aqueous inflow (cyclophotocoagulation), bypass the trabecular meshwork (trabecular bypass shunts, new techniques for goniotomy), filter aqueous to the supra-choroidal space, or filter aqueous to the sub-conjunctival space without a reservoir. Given many of the new devices are approved to be implanted at the time of cataract surgery and others are merely best done at that time, these procedures appear to be targeted at surgeons who may not have previously been performing glaucoma procedures. This fact alone is likely to alter the distribution of procedures performed to treat glaucoma.
Prior studies have demonstrated changes over time in the glaucoma procedures performed on patients in the US covered by Medicare. 1, 2 Approval of new devices and new medications has altered, sometimes dramatically, the number and types of laser and incisional procedures performed. Given recent additions to the procedures available to treat glaucoma and in the data available to track those procedures, an update to prior work seems warranted.
A second important recent change is the availability, since 2012, of physician payment data from the Centers for Medicare & Medicaid Services (CMS). These data are different from those used in prior studies in that procedures and payments can be attributed to individual physicians. One key limitation of the new CMS payment data is that they only include payments to providers who were paid for at least 10 of any given procedure. This limitation is imposed to limit re-identification of patients who might have received treatment from a physician performing a low volume of a given procedure.
The total numbers found in the payment data will therefore be an under-estimate of the actual value with the difference being based on the number of physicians doing a given procedure infrequently. Some earlier studies of glaucoma procedures in this population relied on Medicare claims data to describe changes in surgical procedures over time. 3–5 Other studies relied on aggregated data for discrete CPT codes from the Part B National Summary Data File (formerly the Part B Extract & Summary System). 1, 2
Given these the new glaucoma procedures and new data from CMS, we set out to study changes in glaucoma surgical management in the Medicare population over time. Given we can now readily study glaucoma procedures performed by individual physicians, we also wanted to determine how the various procedures were distributed geographically, and as a proportion of all glaucoma surgeries performed by surgeons. Finally, it is also important to compare the numbers of procedures identified using the new physician payment data as compared to the CMS claims summary data.
Methods
This study did not require approval by an institutional review board as it relies only data made publicly available by CMS and therefore does not constitute human subjects research.
Medicare enrollment counts by type of plan – traditional (Part B) versus managed care (Part C) – were extracted from Medicare Trustees Reports. 6 These counts were used to calculate normalization factors that were applied to the numbers of procedures performed in a given year with 1995 serving as the baseline for comparison (normalization factor = 1). Since both the claims and payment data are derived only from traditional Medicare, normalization included a factor representing the proportion of all Medicare enrollees who were in traditional as opposed to managed care (Part C) plans. We further normalized the procedure counts based on the total number enrolled in Medicare Part B (non-hospital) so that any increases would not be due to growth of the US Medicare population alone. A similar approach has been used in work done outside the US where investigators report rates of procedures per capita.7–11
Data regarding payments to physicians by the Centers for Medicare and Medicaid Services (CMS) were downloaded for the years 2012-2017. 12 Payment data were only included if they were assigned to an entity type of “individual” as opposed to “organization” and the primary specialty of the provider was ‘Ophthalmology’. Payment data for the following glaucoma procedures were then extracted from the overall data for each year based on CPT code: laser trabeculoplasty (65855), trabeculectomy (66170, 66172), aqueous drainage device to subconjunctival space with external reservoir (66179, 66180), external cyclophotocoagulation (66710), endoscopic cyclophotocoagulation (66711), laser iridotomy (66761), aqueous drainage device to subconjunctival space without reservoir, external approach (0192T, 66183), aqueous drainage device to subconjunctival space without reservoir, internal approach (0449T), trabecular bypass device without reservoir, internal approach (0191T), and aqueous drainage device to supra-ciliary space without reservoir (0474T). When evaluating MIGS procedures, the categories defined in the AGS position statement were used and only for devices approved for use during the time covered by the data: endoscopic cyclophotocoagulation (66711), trabecular bypass implants (iStent, 0191T), and subconjunctival drainage devices without a reservoir (Xen, 0449T).
Procedure volumes based on claims data from years 1994 to 2017 for the same procedures above were extracted from a more extensive version of the National Summary Data File obtained directly from CMS and manually cleaned. 13 The procedure counts from both data sets were then normalized by multiplying the value for each year by the normalization factor above. The normalized volumes of procedures over time were then visualized.
To characterize the geographic distribution of surgeons performing a given procedure along with their overall glaucoma surgical volume and proportion of cases of a that type, geographic locations of physicians were generated using the postal codes in the payment data linked to the longitude and latitude of each zip code. 14 Each surgeon was then represented by a circle plotted near that geographic location with a radius proportional to that surgeon’s total surgical volume and color indicating the proportion of all procedures that were of a given type.
When calculating ratios of a given procedure to the total number of glaucoma procedures performed by a surgeon, the total number of procedures was calculated using the following CPT codes: 65820, 65850, 65855, 66170, 66172, 66174, 66175, 66179, 66180, 66184, 66185, 66710, 66711, 66761, 66762, 0191T, 0192T, 66183, 0474T, 0449T. In the 2016 data, trabeculectomy data for one provider were excluded as (s)he was listed as having done more than 1100 trabeculectomies and had performed 0 in the prior two years.
Differences between the proportions of traditional and MIGS procedures were evaluated with Student’s t-test.
All statistical analyses and data visualization were done using R version 4.0.2 (R Foundation).
Results
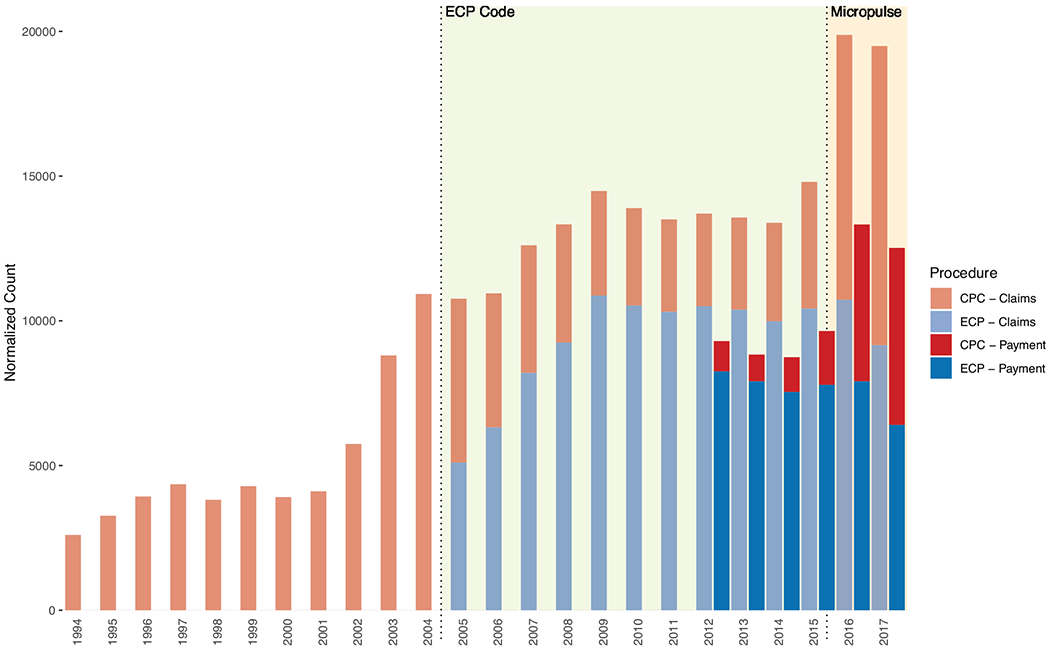
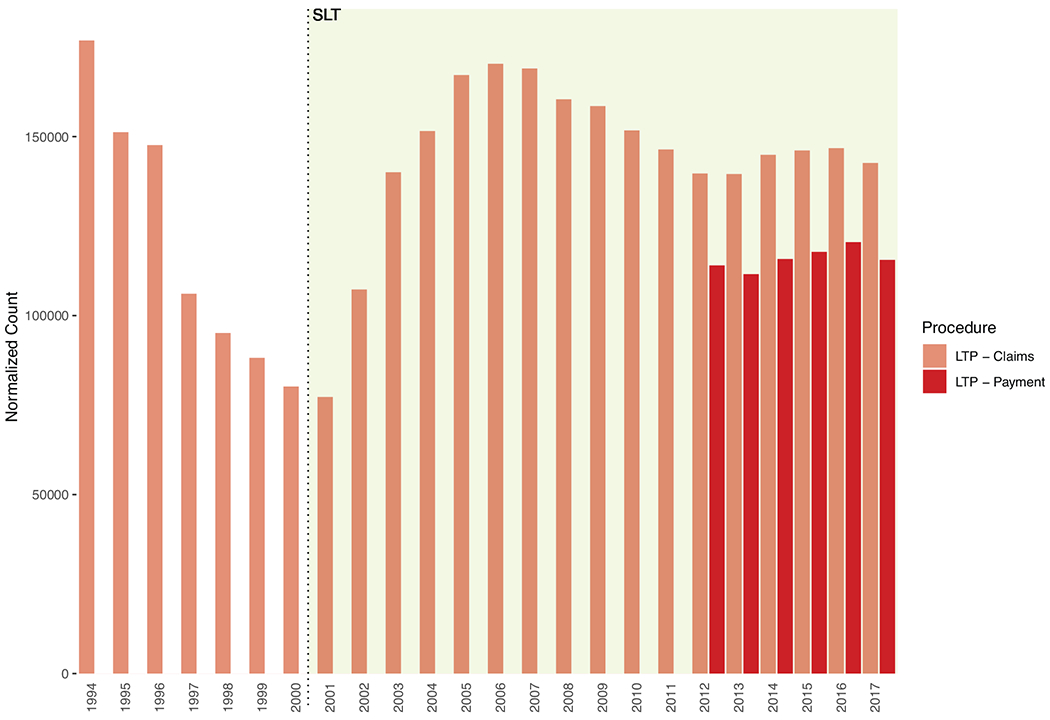
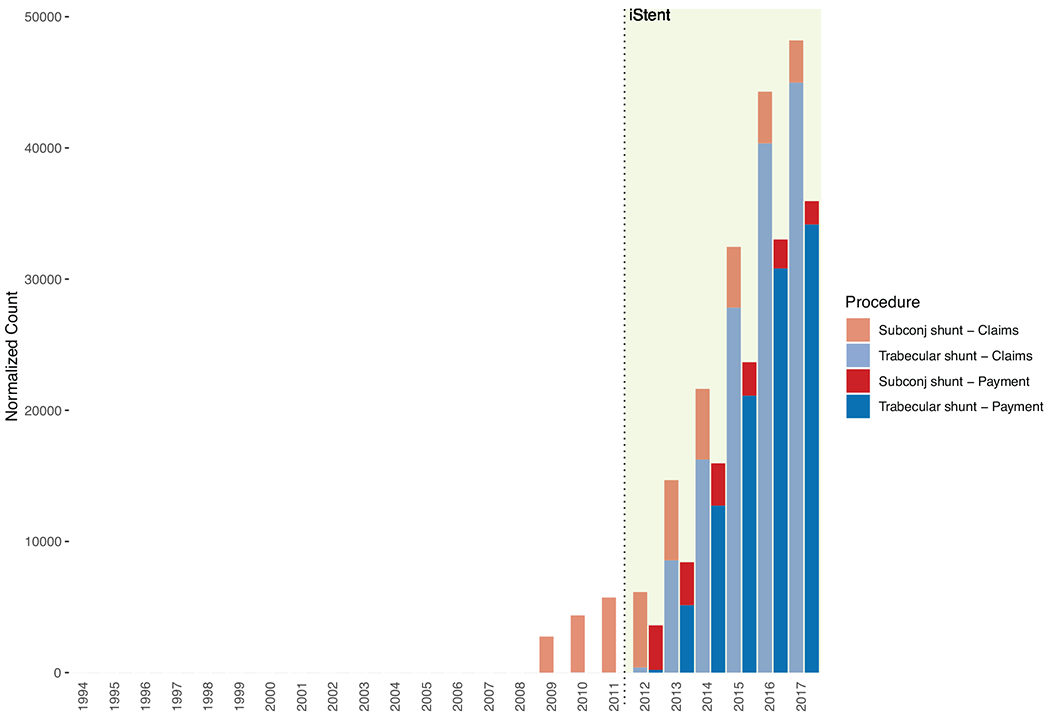
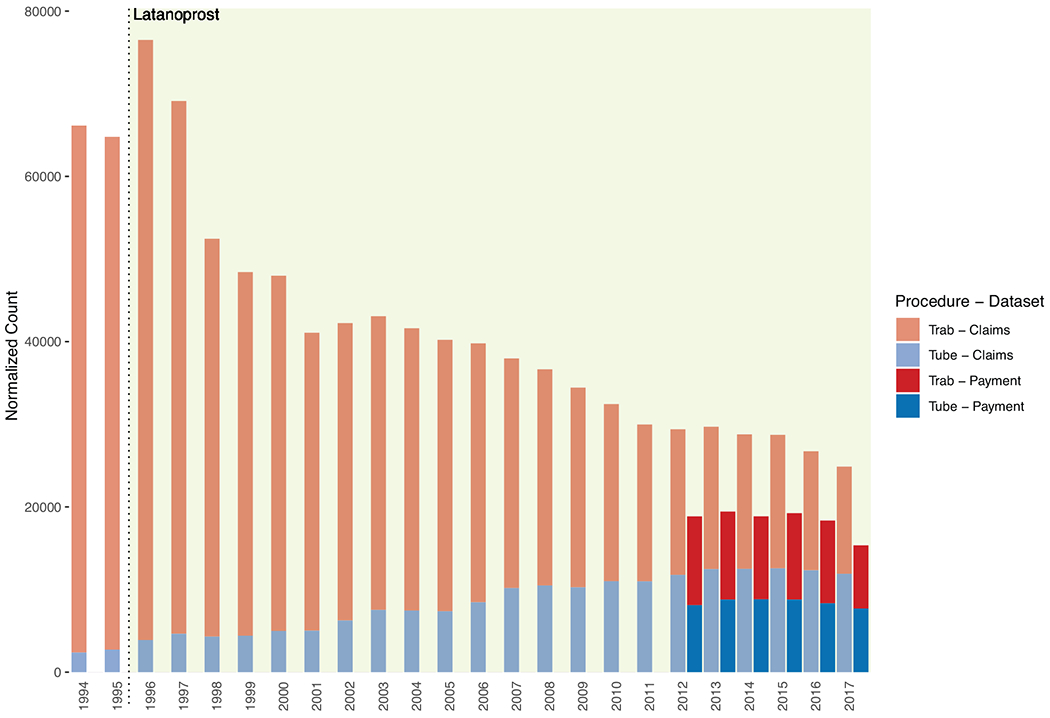
The normalized number of trabeculectomies, continues its decline from a peak in 1996 (Figure 1). Similarly, the number of aqueous shunts to external reservoirs is now about the same number as trabeculectomies after steady growth over more than a decade (Figure 1). Laser trabeculoplasty declined steadily until the introduction of Selective Laser Trabeculoplasty (SLT) in 2001, after which it grew rapidly before declining somewhat between 2005 and 2013 when it began to increase in frequency again (Figure 2). Ablation of the ciliary body with laser has been increasing steadily since 2002 and was driven by a steady increase in the use of endoscopic laser (Figure 3). External cyclophotocoagulation was, in fact, in decline until about 2013 and then increased significantly in 2016.
Figure 1:
Barplot of trabeculectomies and aqueous shunts to external reservoirs over time. The data from 1994 to 2011 were derived from a universe of Medicare claims data and the values from 2012-2017 from both Medicare claims and the CMS payment data to individual physicians. The era of latanoprost is indicated by the highlighted background starting in 1996.
Figure 2:
Barplot of laser trabeculoplasty over time. The data from 1994 to 2011 were derived from a universe of Medicare claims data and the values from 2012-2017 from both Medicare claims and the CMS payment data to individual physicians. The era of selective laser trabeculoplasty (SLT) is indicated by the highlighted background starting in 2001.
Figure 3:
Barplot of ciliary body ablation procedures over time. External and endoscopic were not distinguished before 2005. The data from 1994 to 2011 were derived from a universe of Medicare claims data and the values from 2012-2017 from both Medicare claims and the CMS payment data to individual physicians. The era of a new code for endoscopic ciliary ablation is indicated by the highlighted background starting in 2005 and the introduction of the new external laser and probe is indicated by the highlighted background starting in 2016.
The use of aqueous shunts to the subconjunctival space without a reservoir implanted ab externo (ExPRESS) grew slowly between 2009 and 2012 and has since declined. On the other hand, the use of trabecular bypass devices placed ab interno (iStent) has increased dramatically such that they are now the most common incisional glaucoma procedure (Figure 4).
Figure 4:
Barplot of subconjunctival aqueous shunts placed ab externo and trabecular bypass shunts placed ab interno (iStent). The data from 1994 to 2011 were derived from a universe of Medicare claims data and the values from 2012-2017 from both Medicare claims and the CMS payment data to individual physicians. The approval of the iStent device is indicated by the highlighted background starting in 2012.
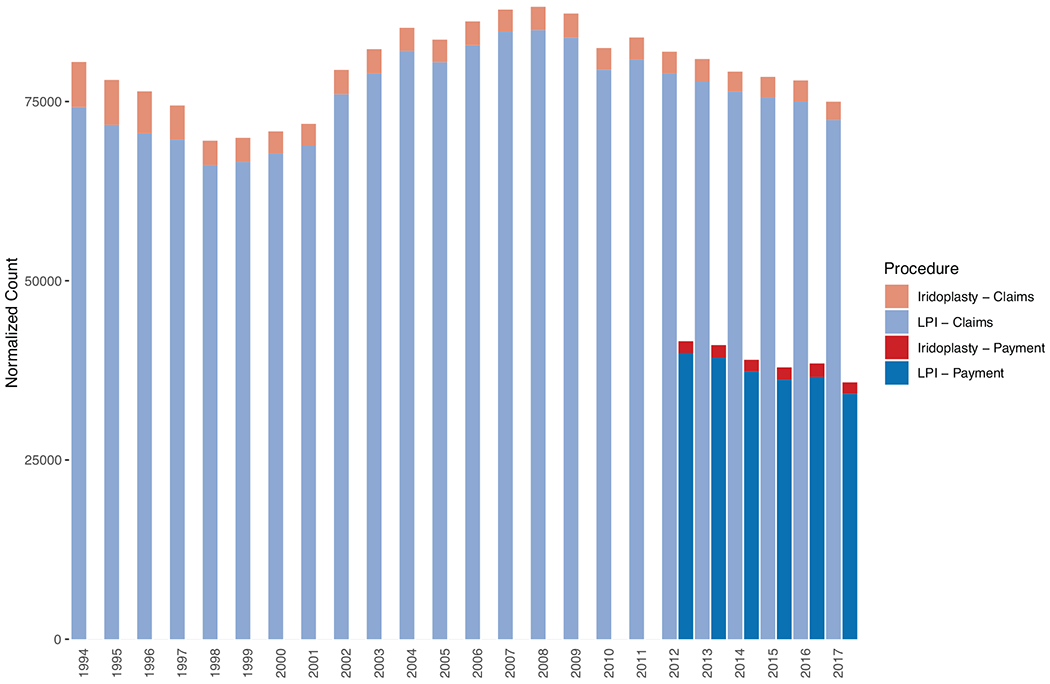
Laser iridotomy increased somewhat between 2000 and 2004 and then remained relatively stable. Laser iridoplasty declined in use between 1994 and 2000 and has remained relatively stable since (Figure 5). Relevant changes in available therapeutics and procedure coding are listed in Table 1 and are also indicated where appropriate in Figures 1–5.
Figure 5:
Barplot of laser iridotomy and laser iridoplasty. The data from 1994 to 2011 were derived from a universe of Medicare claims data and the values from 2012-2017 from both Medicare claims and the CMS payment data to individual physicians.
Table 1.
Introduction of relevant glaucoma therapeutics and procedure codes between 1994 and 2017.
| Date | Therapeutic or coding change |
|---|---|
| 1996 | Brimonidine, latanoprost approved |
| 1998 | Brinzolamide approved |
| 2001 | Introduction of Selective Laser Trabeculoplasty (SLT) |
| 2003 | ExPRESS aqueous shunt approved (0192T, later 66183) |
| 2005 | Distinct codes available for endoscopic (66711) and trans-scleral (66710) cyclophotocoagulation |
| 2012 | iStent trabecular bypass shunt approved (0191T) |
| 2016 | CyPass supra-ciliary shunt approved (0474T) |
| 2016 | New laser and probe for “micropulse” cyclophotocoagulation |
| 2017 | XEN sub-conjunctival shunt approved (0449T) |
For all the procedures evaluated, the normalized counts were significantly lower using the payment data compared to the claims data but mirrored the same trends. The ratio of the procedure count from payment data to the count from claims data ranged from 0.49 for laser iridotomy to 0.62 for trabeculectomy to 0.70 for trabecular bypass devices to 0.81 for laser trabeculoplasty.
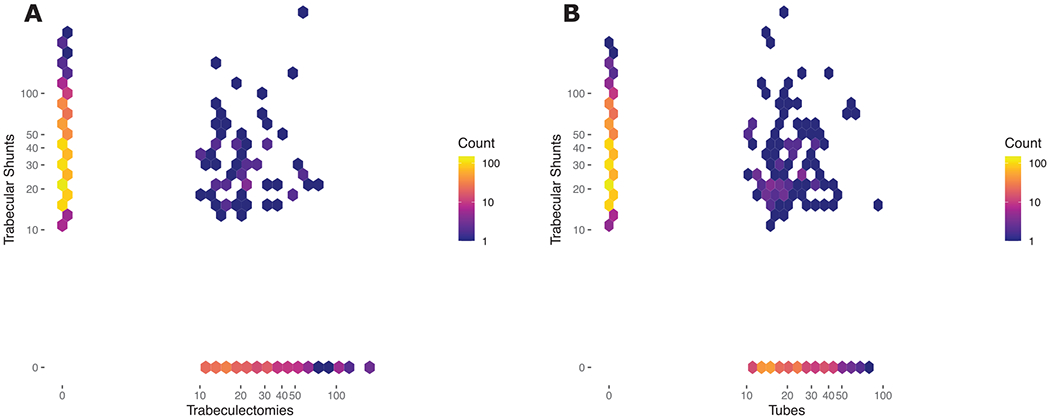
In 2017, the median number/proportion of all glaucoma surgeries, performed by surgeons performing at least 10 of each, that were trabeculectomy was 20/0.22, that were tube shunts was 18/0.21, and that were trabecular shunts was 28/0.5. The differences between the proportions of trabeculectomies and trabecular shunts and between tubes and trabecular shunts were both statistically significant (p<0.001). The distribution of the number of trabecular shunts versus trabeculectomies and the same for trabecular shunts versus tubes performed by individual surgeons is visualized in Figure 6.
Figure 6:
Two-dimensional histogram of A) the number of trabecular shunts versus the number of trabeculectomies and B) the number of trabecular shunts versus the number of tubes performed by individual surgeons. The color of each hexagon is proportional to the number of surgeons with volumes in that range. Note both the axis and color scales have been transformed with log10.
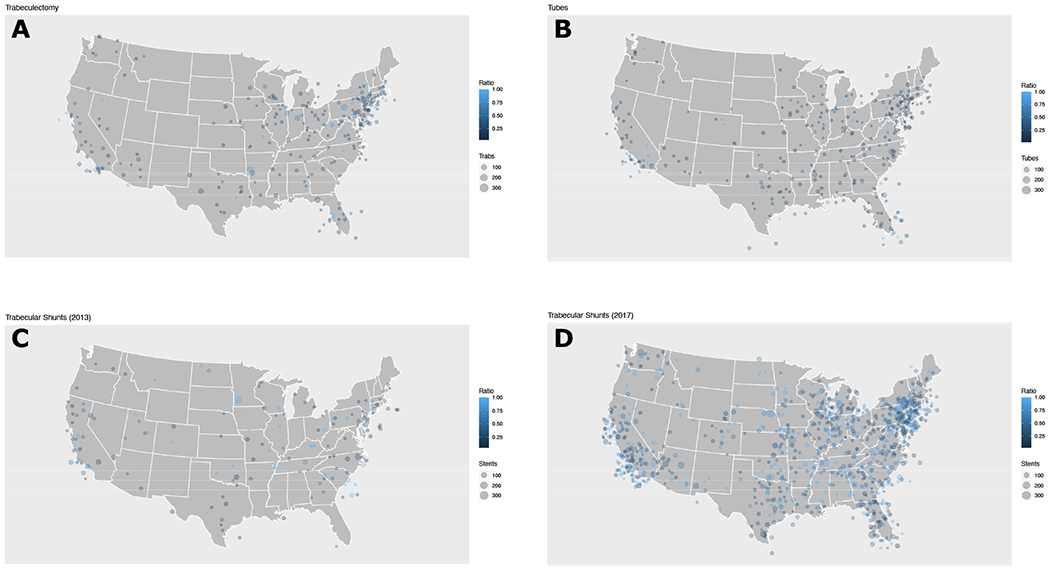
The geographic distributions of trabeculectomies, tube shunts, and trabecular shunts as a proportion of all glaucoma procedures by surgeon in 2017 are visualized in Figure 7. Also included in Figure 7C is the distribution of trabecular shunts in 2013 which helps to demonstrate the rapid expansion in the number of surgeons performing those procedures between 2013 and 2017. The fact that trabecular shunts make up a larger proportion of total glaucoma surgery volume by surgeons performing that procedure is reflected in the fact that more circles are light blue in Figure 7D (as compared to tubes and trabeculectomies in Figure 7A and B).
Figure 7:
Geographic plots of number of surgeries performed (proportional to area of circles) and the proportion of all glaucoma procedures represented by each procedure for that surgeon (more blue = higher proportion) for A) trabeculectomy in 2017, B) tube shunts in 2017, C) trabecular bypass shunts in 2013, and D) trabecular bypass shunts in 2017. The location of each circle has been displaced by a small random amount to help visualize data in locations with multiple providers.
Discussion
The most impressive change in glaucoma surgery volumes has been in the use of trabecular bypass shunts placed ab interno. Since approval of the iStent device in 2012, this procedure has quickly become the most common incisional surgery for glaucoma with almost 50000 (normalized) performed in this group in 2016 and 2017. This is approximately double the number of trabeculectomies and traditional tube shunts combined. It will be interesting to see how the distribution of new procedures changes once data become available for the other categories of devices that have been approved more recently and for which data are not yet available in this population.
The long-term decline in the number of trabeculectomy procedures that started after the introduction of the prostaglandin analogs in 1996 has continued. The increase in the use of aqueous shunts to external reservoirs (tubes) stopped around 2013. Comparing the numbers of tubes and trabeculectomies performed by individual surgeons, most surgeons are performing a combination of both while only a few perform predominately one or the other. This contrasts with the comparison of the numbers of trabecular shunts to trabeculectomies where there are many surgeons who perform only one or the other of these procedures (note hexagons along the axes in Figure 6). The fact that non-glaucoma specialists are driving adoption of MIGS has also been shown by Rathi et al. using a sample of the Medicare claims data. 5 Setting aside the definition of a glaucoma specialist in that work, those results also demonstrated two different groups performing primarily traditional glaucoma versus primarily MIGS procedures. Also similar to our findings is the fact that the overall number of glaucoma procedures in the Medicare population has increased in recent years but that increase has been due to the very rapid expansion of MIGS procedures in the face of a steady decline in traditional procedures.
An analysis of glaucoma procedures at the state and regional level found differences in the rates of glaucoma procedures and the proportion that were of a given type based on geography. 15 Our analysis did not include such geographic differences but does illustrate similar differences in the types of procedures performed at the surgeon level.
The rapid growth in laser trabeculoplasty that occurred after the introduction of SLT was followed by a period of decline until about 2013, after which is began to increase again. After a period of growth in the early 2000’s, laser iridotomy stabilized. The more dramatic difference in iridotomy and irodoplasty numbers between the claims data and the payment data (starting in 2012) is likely be due to the fact that the payment data only include procedures performed at least 10 times by a given provider, suggesting that there are more surgeons performing only a few of these each year.
Laser ablation of the ciliary body has been growing steadily since 2002, driven by rapid growth in the use of endoscopic laser to perform the procedure. The number of external cyclophotocoagulation procedures performed was declining until 2014 and increased sharply in 2016, corresponding to the release of a new instrument and technique for the procedure (so called micropulse).
The long-term changes in “classic” glaucoma procedures including aqueous shunts to external reservoirs and trabeculectomies have stabilized in the few years leading up to 2017 (latest date for which data are available). In contrast, the rapid increase in procedures classified as “micro-invasive” such as endoscopic cyclophotocoagulation and trabecular bypass shunts has resulted in them collectively accounting for 69% of incisional glaucoma procedures in 2017. It will be interesting to see how the distribution of procedures changes as data for even more recently approved devices become available. Still missing from available studies is any evidence regarding the comparative effectiveness of these newer procedures with one another or with the classic procedures. Such evidence will be critically important as surgeons are faced with more and more choices when deciding which procedure will be best for a given patient.
An important caveat for the data underlying these analyses is that they are only available for people enrolled in traditional (government managed) Medicare. During the timeframe of the analyses above, the proportion of all people in Medicare Advantage (privately managed) plans has increased significantly from 10% in 1995 to 37% in 2017 (Supplemental Figure). This increase in the proportion of enrollees who are in the privately managed plans means that the numbers of procedures performed each year is increasingly underestimated using either of the data sets from CMS. One would also expect the number of procedures performed to increase over time simply based on increasing enrollment in the Medicare program. To control for these two factors, we believe some normalization is important and we have done so to accommodate both changes.
Another potential issue with any billing and claims data is misuse of procedure codes by physicians or office staff tasked with submitting claims to payors. We identified one such potential situation when we excluded a single provider who performed more than 1100 trabeculectomies in a single year but did not have anywhere near that number before or after that time. Smaller-scale errors are difficult or impossible to identify from the claims data alone. The degree to which any such errors are systematic, and therefore introduce bias, is not clear.
One of the goals of this work was to compare the results obtained using claims and payment data. In all cases, the normalized count of procedures was lower using the payment data than the claims data. This is likely due to the fact the payment data exclude any provider performing fewer than 10 of a given procedure in a year. Therefore, if many providers perform this procedure infrequently, their numbers will not appear in the total and could account for the sometimes-large gaps noted. This difference does not mean that the payment data cannot be used but it is important for future work relying on those data to account for the inherent bias toward lower procedure counts.
These results are similar to the trends in glaucoma procedures from other studies of the US population and from other countries. In particular, the decline in trabeculectomy has been noted in prior studies from the US 3, 4, Canada 7, Great Britain 8, France 9, and Australia 10, 11. The same trend has also shown up in surveys of American Glaucoma Society Members over time. 16, 17 Other trends that have also been demonstrated outside the US include the growth in the rate of tube shunts, cyclodestruction by laser, and laser trabeculoplasty.
Based on these results, glaucoma practice patterns change each time a new device or procedure is introduced. Collectively, the new MIGS procedures have rapidly increased in their utilization such that they now account for a significant majority of glaucoma surgeries. Given the almost complete lack of comparative data to inform surgeon choices regarding these procedures, it will be important that randomized studies are carried out to fill this gap.
Supplementary Material
Supplemental Figure: Barplot of Medicare enrollment over time for both traditional (government managed) and so-called Advantage (private, managed care) plans. The line represents the normalization factor used to account for changes in overall Medicare enrollment and the proportion enrolled in traditional (versus managed care) plans.
Acknowledgments
Financial Support: Research at the Wilmer Eye Institute is supported by core grant EY001765 from the National Eye Institute and by Research to Prevent Blindness. A. Lee was supported by career development awards K23EY029246 from the National Eye Institute and Research to Prevent Blindness. The funding organizations had no role in the design or conduct of this research.
Conflict of Interest: Boland – Carl Zeiss Meditec: consulting. Lee - support from the US Food and Drug Administration, grants from Santen, Carl Zeiss Meditec, and Novartis, personal fees from Genentech, Topcon, and Verana Health, outside of the submitted work; This article does not reflect the opinions of the Food and Drug Administration. Corcoran - Corcoran Consulting Group provides consulting to physicians and industry regarding clinical billing and compliance.
Footnotes
Publisher's Disclaimer: This is a PDF file of an unedited manuscript that has been accepted for publication. As a service to our customers we are providing this early version of the manuscript. The manuscript will undergo copyediting, typesetting, and review of the resulting proof before it is published in its final form. Please note that during the production process errors may be discovered which could affect the content, and all legal disclaimers that apply to the journal pertain.
References
- 1.Ramulu PY, Corcoran KJ, Corcoran SL, et al. Utilization of various glaucoma surgeries and procedures in Medicare beneficiaries from 1995 to 2004. Ophthalmology 2007;114:2265–70. [DOI] [PubMed] [Google Scholar]
- 2.Arora KS, Robin AL, Corcoran KJ, et al. Use of Various Glaucoma Surgeries and Procedures in Medicare Beneficiaries from 1994 to 2012. Ophthalmology 2015;122:1615–24. [DOI] [PubMed] [Google Scholar]
- 3.Paikal D, Yu F, Coleman AL. Trends in glaucoma surgery incidence and reimbursement for physician services in the Medicare population from 1995 to 1998. Ophthalmology 2002;109:1372–6. [DOI] [PubMed] [Google Scholar]
- 4.Schmier JK, Covert DW, Lau EC, et al. Trends in Annual Medicare Expenditures for Glaucoma Surgical Procedures From 1997 to 2006. Archives of ophthalmology (1960) 2009;127:900–5. [DOI] [PubMed] [Google Scholar]
- 5.Rathi S, Andrews CA, Greenfield DS, et al. Trends in Glaucoma Surgeries Performed by Glaucoma Subspecialists versus Nonsubspecialists on Medicare Beneficiaries from 2008 through 2016. Ophthalmology 2020;. [DOI] [PMC free article] [PubMed] [Google Scholar]
- 6.Centers for Medicare and Medicaid Services. Trustees reports (current and prior) https://www.cms.gov/Research-Statistics-Data-and-Systems/Statistics-Trends-and-Reports/ReportsTrustFunds/TrusteesReports; Retrieved 6 August 2020.
- 7.Campbell RJ, Trope GE, Rachmiel R, et al. Glaucoma laser and surgical procedure rates in Canada: a long-term profile. Canadian Journal of Ophthalmology 2008;43:449–53. [DOI] [PubMed] [Google Scholar]
- 8.Murphy C, Ogston S, Cobb C, et al. Recent trends in glaucoma surgery in Scotland, England and Wales. British Journal of Ophthalmology 2015;99:308–12. [DOI] [PubMed] [Google Scholar]
- 9.Bron AM, Mariet A, Benzenine E, et al. Trends in operating room-based glaucoma procedures in France from 2005 to 2014: a nationwide study. British Journal of Ophthalmology 2017;101:1500–4. [DOI] [PubMed] [Google Scholar]
- 10.Kerr NM, Kumar HK, Crowston JG, et al. Glaucoma laser and surgical procedure rates in Australia. British Journal of Ophthalmology 2016;100:1686–91. [DOI] [PubMed] [Google Scholar]
- 11.Newman AR, Andrew NH. Changes in Australian practice patterns for glaucoma management. Clinical & experimental ophthalmology 2018;47:571–80. [DOI] [PubMed] [Google Scholar]
- 12.Centers for Medicare and Medicaid Services. Medicare provider utilization and payment data: Physician and other supplier https://www.cms.gov/Research-Statistics-Data-and-Systems/Statistics-Trends-and-Reports/Medicare-Provider-Charge-Data/Physician-and-Other-Supplier; Retrieved 6 August 2020.
- 13.Centers for Medicare and Medicaid Services. Part B national summary data file (previously known as BESS) https://www.cms.gov/Research-Statistics-Data-and-Systems/Downloadable-Public-Use-Files/Part-B-National-Summary-Data-File/Overview; Retrieved 6 August 2020.
- 14.United States Census Bureau. ZIP code tabulation areas (ZCTAs) https://www.census.gov/programs-surveys/geography/guidance/geo-areas/zctas.html; Retrieved 6 August 2020.
- 15.Ma AK, Lee JH, Warren JL, et al. GlaucoMap – Distribution of Glaucoma Surgical Procedures in the United States. Clinical ophthalmology 2020;14:2551–60. [DOI] [PMC free article] [PubMed] [Google Scholar]
- 16.Vinod K, Gedde S, Feuer W, et al. Practice Preferences for Glaucoma Surgery: A Survey of the American Glaucoma Society. Journal of Glaucoma 2017;26:687–93. [DOI] [PMC free article] [PubMed] [Google Scholar]
- 17.Desai MA, Gedde SJ, Feuer WJ, et al. Practice Preferences for Glaucoma Surgery: A Survey of the American Glaucoma Society in 2008. Ophthalmic surgery, lasers & imaging 2011;42:202–8. [DOI] [PubMed] [Google Scholar]
Associated Data
This section collects any data citations, data availability statements, or supplementary materials included in this article.
Supplementary Materials
Supplemental Figure: Barplot of Medicare enrollment over time for both traditional (government managed) and so-called Advantage (private, managed care) plans. The line represents the normalization factor used to account for changes in overall Medicare enrollment and the proportion enrolled in traditional (versus managed care) plans.


