Abstract
Introduction
Psoriasis Area Severity Index (PASI) assessment is complex and time-consuming. A simpler assessment measure more sensitive to changes in symptom severity and predictive of patients’ quality of life (Dermatology Life Quality Index, DLQI) is needed. This study aims to evaluate the Optimal Psoriasis Assessment Tool (OPAT) as an alternative to PASI.
Methods
This integrated analysis of three UNCOVER trials (NCT01474512, NCT01597245, and NCT01646177) randomized patients (N = 3866) with moderate-to-severe psoriasis to subcutaneously administered ixekizumab 80 mg Q2W or Q4W, or placebo or etanercept 50 mg Q2W. Pearson correlations were computed for clinical and patient-reported measures with PASI and DLQI.
Results
As the correlations with PASI and BSA were high and not much higher when adding severity, body surface area (BSA) was used for the clinical measure. BSA was the main measure influencing OPAT. Week 12 regression analyses results showed that PASI had a higher correlation with BSA combined with patient assessments than with BSA alone. Sensitivity analyses were also completed for PASI 75 and 90. For DLQI, correlations with the combined measures were even stronger than with BSA alone. A comprehensive model selection procedure was conducted, which illustrated that the two-term models are preferred.
Conclusion
The OPAT is a simple and time-saving alternative to PASI. It can be derived using BSA and patient-reported assessments having strong correlation with PASI and moderate correlation with DLQI.
Supplementary Information
The online version contains supplementary material available at 10.1007/s13555-021-00544-6.
Keywords: OPAT, Psoriasis, PASI
Key Summary Points
| Why carry out this study? |
| Psoriasis Area Severity Index (PASI) is the most common disease severity measure used in clinical trials. PASI assessment is a complex and time-consuming measure, requiring collection of 16 measurements and performance of 13 calculations, and is therefore generally not used in real-world practice. |
| A simpler assessment measure which is more sensitive to changes in symptom severity and predictive of patients’ quality of life is therefore needed to assist dermatologists in patient management and could facilitate value-based payment agreements between payers and pharmaceutical manufacturers. |
| What was learned from the study? |
| The findings of this analysis show that the Optimal Psoriasis Assessment Tool (OPAT) could be an alternative to PASI that requires only body surface area (BSA) and a single patient-reported outcome. |
| The OPAT could be easily incorporated into real-world practice using a digital calculation tool. |
Digital Features
This article is published with digital features, including a summary slide, to facilitate understanding of the article. To view digital features for this article go to https://doi.org/10.6084/m9.figshare.14496078.
Introduction
Psoriasis is an inflammatory disease with a chronic course, which is often associated with various serious comorbidities and compromised health-related quality of life (HRQoL) [1, 2]. Patients with psoriasis may experience low self-esteem, feelings of shame and frustration, and frequently report seriously compromised social life, difficulties at work and in daily activities, and suicidal ideation in more serious cases [3].
Quantifying the severity of psoriasis in a consistent and clinically meaningful way is important when conducting clinical research. Although several psoriasis severity tools have been used over the past few decades, no instrument meets all validity criteria [4]. The most commonly used instrument, the Psoriasis Area Severity Index (PASI), was introduced in an etretinate trial for psoriasis in 1978 [5].
PASI is widely considered the gold standard measure of disease severity and is frequently used as a primary efficacy endpoint in clinical trials of moderate-to-severe psoriasis [6]; however, it does have several limitations. Assessment of disease severity by clinicians unfamiliar with the PASI technique can lead to large intra- and inter-rater variability in scores, thus leading to more subjective measurements of treatment efficacy [7]. One of the biggest issues with PASI is that it was arbitrarily created without consideration of how erythema, induration, scale, and body surface area (BSA) should be combined to produce a meaningful metric. Also, the BSA component (area score) is nonlinear. As a complex index to measure psoriasis severity, PASI assessment is time-consuming, cumbersome, and difficult to interpret [8, 9]. In particular, for PASI assessment, an evaluator assigns erythema, induration, desquamation, and area scores to each of four body sections (head/neck, trunk, upper extremities, and lower extremities), measures BSA in these four body sections, and then mathematically calculates a score that ranges from 0 to 72. Consequently, PASI assessments and scores are typically not used in real-world practice.
In recent years, the US Food and Drug Administration (FDA) has not accepted PASI as a standalone efficacy endpoint and has required a static Physician Global Assessment (PGA) for most late phase clinical trials of psoriasis therapies [8, 9]. The most commonly used versions of PGA assess only plaque qualities, as they measure degrees of erythema, induration, and desquamation representing the entire body. Most PGA instruments do not provide an overall measure of psoriasis severity because they do not explicitly account for BSA involvement. For example, a patient with extensive BSA involvement (i.e., 30%) could have the same PGA score as a patient with limited BSA involvement (i.e., 1% BSA), even if the degrees of lesion erythema, induration, and desquamation are the same.
The use of PASI by health care payers in the USA is very limited, especially for establishing eligibility criteria and access for biologics, whereby BSA is generally used. Furthermore, value-based agreements between biologics manufacturers and health care payers have been limited to nonclinical measures (e.g., persistence or drug survival) [10].
The impact of psoriasis on patients’ quality of life is substantial. Thus, an assessment of the impact of treatment should reflect improvements in both objective clinical assessments and patients’ subjective assessments of the impact of treatment on their quality of life. Hence, there is a need for a simpler assessment measure that is more sensitive to changes in symptom severity and patient assessment, and predictive of patients’ HRQoL (Dermatology Life Quality Index, DLQI). Physicians will have more interest in a real-world, simple, and useful tool (e.g., Optimal Psoriasis Assessment Tool [OPAT]) that could serve as a substitute for PASI in the treatment of patients with psoriasis. The objectives of this study are to evaluate the potential of OPAT as an alternative to PASI, based on simple and more relevant clinical measures and patient outcomes, which are correlated with PASI and DLQI.
Methods
Data Source
We analyzed data from the UNCOVER-1, -2, and -3 trials to investigate an alternative to PASI assessments for psoriasis disease severity based on clinical and patient-reported outcome (PRO) measures. The alternative clinical measures included the product of BSA and overall “worst” sum of severity measures based on PASI, and BSA alone. PRO measures included patient-reported itch numeric rating scale (NRS), patient-reported skin pain, and a patient global assessment of disease severity (PatGA).
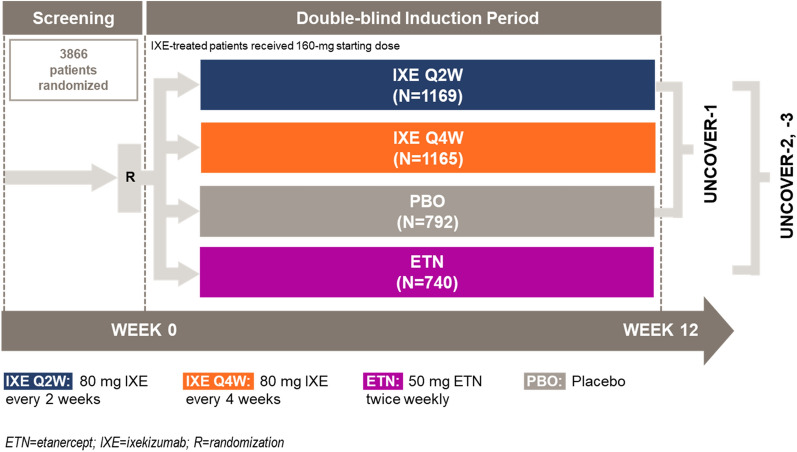
Eligibility criteria and study designs of individual studies have been described earlier [11, 12]. Figure 1 shows the study design of all the UNCOVER trials. In this integrated analysis of three UNCOVER trials, intent-to-treat patients (N = 3866) with moderate-to-severe psoriasis in the 12-week induction period were randomized to subcutaneous 80-mg ixekizumab injection once every 2 weeks (Q2W) (n = 1169) or once every 4 weeks (Q4W) (n = 1165) after an initial 160-mg starting dose, or placebo (n = 792) or etanercept 50 mg biweekly (n = 740; UNCOVER-2, -3). For the analyses, imputation of missing data was not performed and all patients with available data were included.
Fig. 1.
Study design
The studies were approved by the ethical review board at each participating site before the start of the study. The trials conform with Good Clinical Practices, International Council for Harmonization, local laws and regulations, and were conducted in accordance with the Declaration of Helsinki principles. All patients enrolled provided written informed consent before participating in the trials.
Statistical Analysis
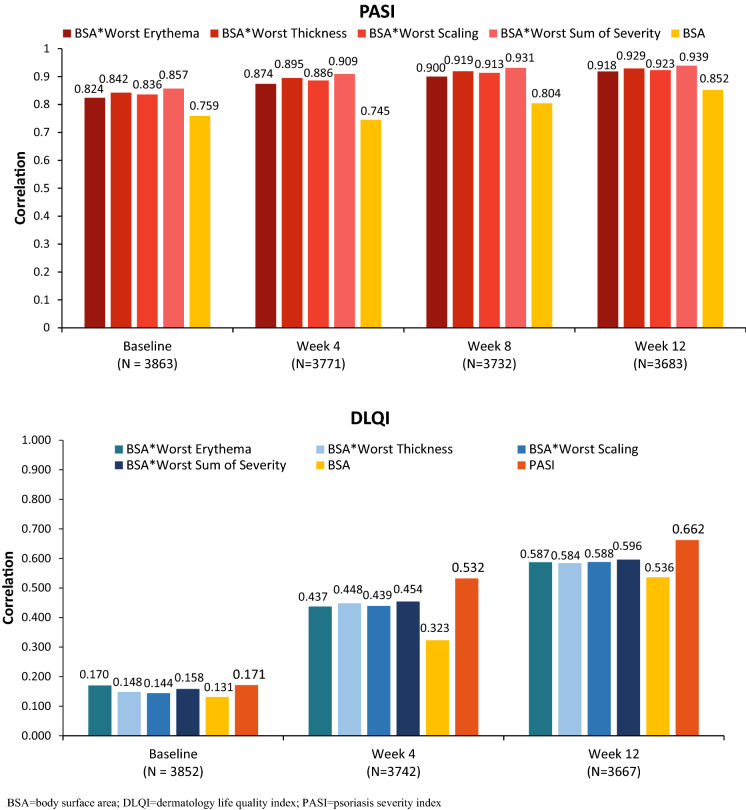
Correlation analyses were performed to investigate the relationship between the product of BSA and severity components (overall worst scaling, overall worst erythema, overall worst thickness, and sum of the three worst overall scores) and PASI, and between BSA alone and PASI. On the basis of pre-analyses, Pearson correlation coefficients were high between PASI and BSA alone (r = 0.745–0.852), and between PASI and the product of BSA with each symptom severity and worst sum of severity measures (r = 0.824–0.939). Given that the worst symptom severity measures are based on the PASI assessment and to reduce the number of measures in creating a more relevant assessment tool, BSA alone was selected for further analyses and development of the OPAT.
Pearson correlations were computed for patient-reported measures (skin pain, itch, and PatGA) with PASI and DLQI at baseline and at weeks 4, 8, 12 (PASI) and weeks 4 and 12 (DLQI). The standard ordinary least-squares regression model using two variables (BSA and one of the patient assessment measures) was used to assess PASI and DLQI at baseline and week 12 with √(R2) results presented.
The predicted value produced by the regression model was defined as proxy PASI score. Sensitivity analyses were completed, the proxy scores versus actual PASI results were plotted, and the concordance rates were assessed for the proxy score measures versus PASI at week 12. These analyses were utilized to develop a simpler tool (i.e., OPAT) that is more sensitive to changes in symptom severity, incorporates patient self-assessment, and is predictive of patients’ quality of life based on DLQI.
A variety of regression models adjusted for BSA and patient assessments (itch, PatGA, or skin pain) were used for evaluation at week 12 followed by a comprehensive model selection procedure using least-squares regression modeling of PASI and DLQI total scores. This process involved fitting 18 models with different independent variables including individual or combinations of BSA, the patient assessment variables (itch, PatGA, or skin pain), and the interactions between BSA and patient assessment variables (see supplementary materials).
Results
Patient Demographics
In this pooled analysis of 3866 patients, the average age was 45.5 years, 67.8% were male, and 92.6% were white. Mean baseline values for PASI and DLQI were 20.2 and 12.5, respectively. Baseline demographics and disease characteristics are shown in Table 1.
Table 1.
Baseline demographics and disease characteristics
| PBO (N = 792) | ETN (N = 740) | IXE Q4W (N = 1165) | IXE Q2W (N = 1169) | |
|---|---|---|---|---|
| Age, years (SD) | 46.2 (12.8) | 45.5 (13.3) | 45.4 (13.1) | 45.1 (12.9) |
| Male, n (%) | 560 (70.7) | 505 (68.2) | 791 (67.9) | 766 (65.5) |
| Race, white, n (%) | 726 (91.7) | 682 (92.7) | 1072 (92.3) | 1092 (93.5) |
| Weight, kg (SD) | 91.6 (23.5) | 92.5 (23.4) | 92.1 (23.5) | 90.8 (22.7) |
| Body mass index, kg/m2 | 30.5 (7.2) | 31.0 (7.4) | 30.7 (7.2) | 30.4 (7.1) |
| Psoriasis duration, years (SD) | 19.1 (12.1) | 18.5 (12.1) | 18.9 (12.4) | 18.7 (12.1) |
| PASI (SD) | 20.57 (8.5) | 19.90 (7.5) | 20.40 (7.5) | 20.08 (7.9) |
| Itch NRS score, mean (SD) | 6.8 (2.6) | 6.4 (2.6) | 6.6 (2.6) | 6.8 (2.5) |
ETN etanercept, IXE ixekizumab, N number of patients in the analysis population, n number of patients in the specified category, NRS numeric rating scale, PBO placebo, Q2W once every 2 weeks, Q4W once every 4 weeks, SD standard deviation
Correlation Analyses
The patient-assessed measures of skin pain, itch, and PatGA were significantly correlated with both PASI and DLQI. Similarly, the correlation of BSA with PASI and DLQI was also established.
PASI and BSA were significantly (p < 0.001) correlated with each other at baseline (r = 0.759), week 4 (r = 0.745), week 8 (r = 0.804), and week 12 (r = 0.852) (Fig. 2a). There was a significant correlation between PASI and the product of BSA with worst scaling (r = 0.836–0.923), worst sum of severity (r = 0.857–0.939), worst erythema (r = 0.824–0.918), and worst thickness (r = 0.842–0.929) at baseline and weeks 4, 8, and 12 (Fig. 2a). Similarly, BSA alone was also significantly correlated with DLQI total score from baseline (r = 0.131; p < 0.001) to week 12 (r = 0.536; p < 0.001) (Fig. 2b).
Fig. 2.
a PASI correlations with simpler clinically assessed measures; b DLQI correlations with physician’s assessment measures
The correlations of DLQI with patient-assessed measures were higher than that with PASI for itch NRS and skin pain (itch NRS, 0.771 vs 0.695 at week 12; skin pain, 0.749 vs 0.635 at week 12), and similar for PatGA (PatGA, 0.748 vs 0.753) at week 12 (Fig. 3). The correlations at week 12 were higher than baseline for both PASI (skin pain, 0.154 vs 0.635; itch NRS, 0.128 vs 0.695; PatGA, 0.186 vs 0.753) and DLQI (skin pain, 0.507 vs 0.749; itch NRS, 0.490 vs 0.771; PatGA, 0.350 vs 0.748). Correlations between DLQI and the product of BSA with worst erythema, thickness, scaling or sum of severity at week 12 ranged from 0.584 to 0.596 (Fig. 2b).
Fig. 3.
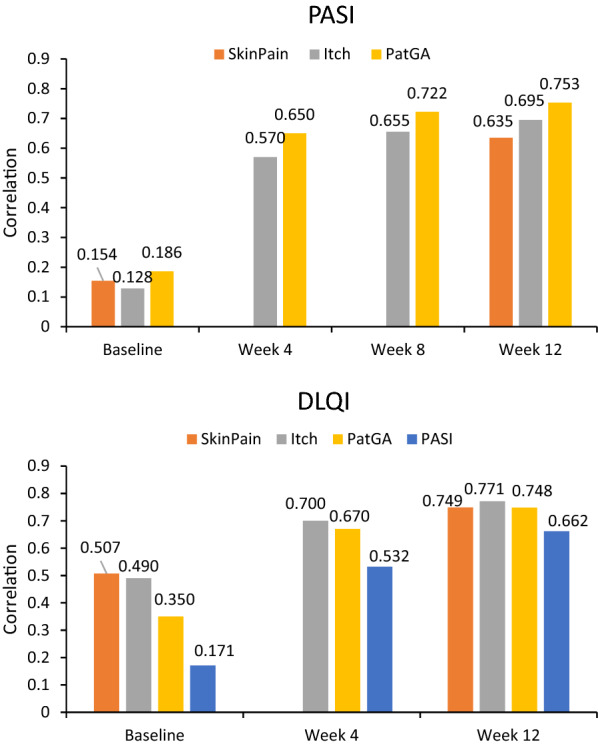
PASI (and DLQI) correlations of patient-assessed measures with PASI as reference
Sensitivity and Specificity Analyses for Prediction
Model with BSA and Itch
For the ordinary least-squares (OLS) regression model with BSA and itch, Table 2 shows sensitivity and specificity of the association between the percentage change in proxy PASI score with PASI 75 and PASI 90 at week 12. For PASI 75, a 73% change in proxy PASI score provides the maximum association (based on Youden index), whereas an 83% change in proxy PASI score had the maximum association for PASI 90.
Table 2.
Percentage improvement in proxy PASI score
| Model terms | Percentage improvement in PASI | Sensitivity (%) | Specificity (%) | PPV (%) | NPV (%) |
|---|---|---|---|---|---|
| BSA, itch | PASI 75 | 87.5 | 91.3 | 94.8 | 80.1 |
| PASI 90 | 88.0 | 83.2 | 82.2 | 88.7 | |
| BSA, PatGA | PASI 75 | 88.6 | 91.0 | 94.7 | 81.5 |
| PASI 90 | 81.4 | 92.1 | 90.1 | 84.8 |
BSA body surface area, NPV negative predictive value, PatGA patient global assessment of disease severity, PPV positive predictive value
Sensitivity, specificity, positive predictive value, and negative predictive value were very high (greater than or equal to 80%) for both PASI 75 and PASI 90. PASI 75 had a sensitivity of 87.5% whereas PASI 90 had a sensitivity of 88.0%.
Model with BSA and PatGA
For the OLS model with BSA and PatGA, Table 2 shows sensitivity and specificity of the association between the percentage change in proxy PASI score with PASI 75 and PASI 90 at week 12. For PASI 75, a 71% change in proxy PASI score provides the maximum association (based on Youden index), whereas an 89% change in proxy PASI score had the maximum association for PASI 90.
Sensitivity, specificity, positive predictive value, and negative predictive value were very high (greater than or equal to 81%) for both PASI 75 and PASI 90. PASI 75 had a sensitivity of 88.6% whereas PASI 90 had a sensitivity of 81.4%.
Concordance/Discordance
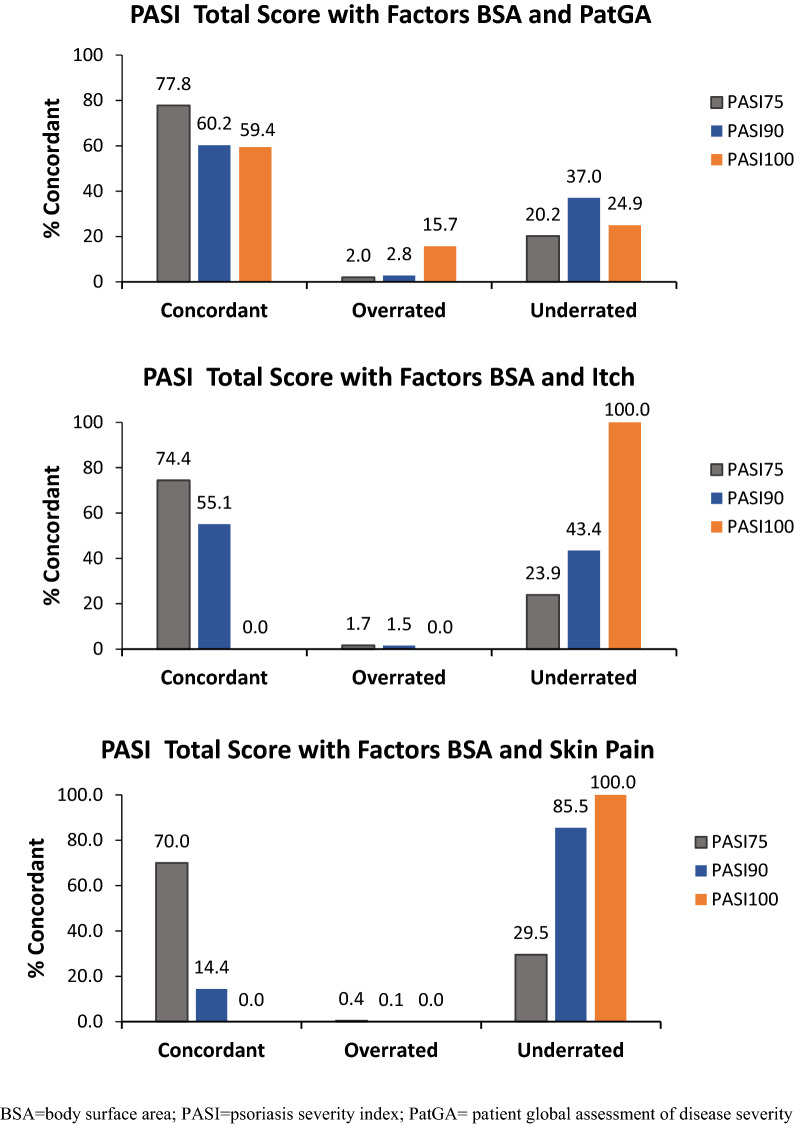
The concordance summaries showed high concordance rates for PASI 75 and PASI 90, as shown for the models with PatGA (77.8% and 60.2%) and itch (74.4% and 55.1%) for PASI 75 and PASI 90, respectively, as shown in Fig. 4.
Fig. 4.
Concordance rates by residual BSA severity at week 12 in proxy BSA (all treatment arms)
Models with BSA and itch, and BSA and PatGA were similar in terms of percentage improvement in proxy PASI score and sensitivity (Table 2). Furthermore, the most severe patients at baseline who had good responses (PASI 75 and PASI 90) after 12 weeks often continued to have BSA involvement greater than 10%, suggesting that relying on BSA changes alone does not fully capture the benefit or amount of clinical improvement.
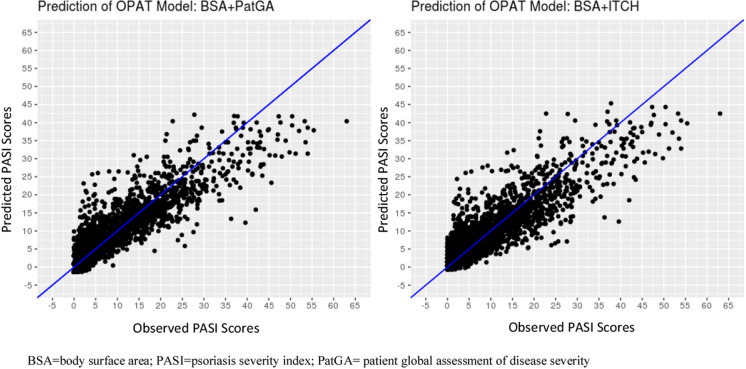
In assessing these models, the scatterplots (Fig. 5) visually displayed the alignment of the proxy PASI versus PASI. The concordance summaries showed very high concordance rates for PASI 75 and PASI 90, especially for the models with PatGA and itch.
Fig. 5.
Predicted vs observed PASI scores
Model Comparison Based on Regression Analysis
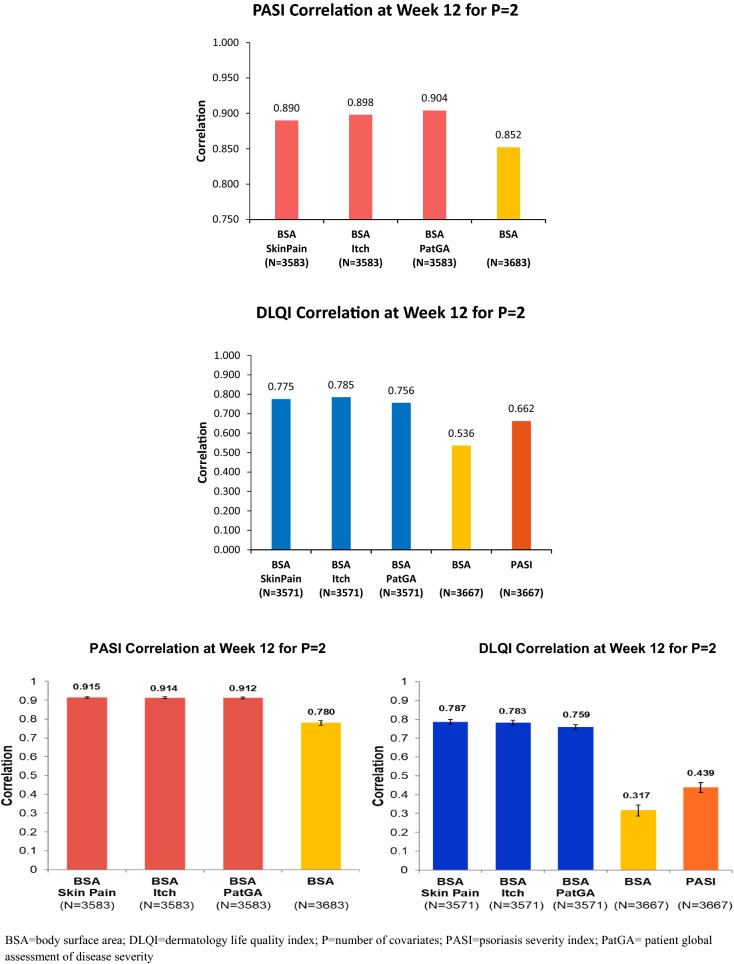
At week 12, the correlations between PASI and BSA combined with patient assessments [PatGA ( = 0.904), itch NRS ( = 0.898), and skin pain ( = 0.890)] were higher than between PASI and BSA alone [ = 0.852 (Fig. 6)].
Fig. 6.
PASI (and DLQI) correlations with combined clinical and patient assessments at week 12
In case of DLQI total score, the correlations with BSA combined with the same measures [PatGA ( = 0.756), itch NRS ( = 0.785), and skin pain ( = 0.775)] were stronger than with BSA alone ( = 0.536) or with PASI (Corr = 0.662) at week 12. The proxy PASI versus actual PASI results were plotted for each of the two-parameter models. In addition, for each model, the concordance rates were summarized for the proxy measure versus PASI.
For the overall population at week 12, of the 18 models tested for PASI (Supplementary Table 1), the results for the MAE, PRESS, and RMSE from overall datasets ranged from 2.12 to 4.02, 12.61 to 34.62, and 3.52 to 5.87, respectively. MAE, sqrt(PRESS), and RMSE represented percentage errors of up to 5.6%, 8.2%, and 8.2%, respectively, for the overall PASI range. In the PASI models, out of the three patient assessment variables, those models with PatGA had the best performance with respect to common model selection criteria (AIC, BIC, or RMSE in validation dataset), followed by itch and skin pain. In the DLQI models (Supplementary Table 2), MAE, PRESS, and RMSE from overall datasets ranged from 2.21 to 3.62, 11.98 to 26.42, and 3.42 to 5.14, respectively. Percentage errors for MAE, sqrt(PRESS), and RMSE were up to 12.1%, 17.1%, and 17.1%, respectively, for the overall DLQI range. The DLQI model with itch had the best performance, followed by skin pain and PatGA.
As shown in Supplementary Tables 1 and 2, the most complicated models with BSA, itch, PatGA, skin pain, and their interaction terms have the smallest AIC, BIC, or RMSE for the validation dataset. A summary of estimated coefficients of selected models is presented in Tables 3 and 4. However, the best two-term models [i.e., BSA + PatGA (R2 = 0.82), and BSA + itch (R2 = 0.81) for PASI and BSA + itch (R2 = 0.62) for DLQI] or three-term models [i.e., BSA + PatGA + BSA × PatGA (R2 = 0.84) for PASI and BSA + itch + skin pain (R2 = 0.65) for DLQI] are still preferred, as they showed minor differences in R2 and RMSE in comparison to the most complicated models.
Table 3.
Summary of coefficients (estimates) of selected models (without interaction and without higher order terms) for PASI at week 12
| Number of terms | Model | Terms | Estimate | Standard error | t value | p value |
|---|---|---|---|---|---|---|
| 1 | PASITS = BSA | Intercept | 0.913 | 0.097 | 9.37 | < 0.0001 |
| BSA | 0.490 | 0.005 | 97.52 | < 0.0001 | ||
| 2 | PASITS = BSA + PatGA | Intercept | − 1.358 | 0.096 | − 14.10 | < 0.0001 |
| BSA | 0.359 | 0.005 | 69.84 | < 0.0001 | ||
| PatGA | 2.241 | 0.053 | 42.08 | < 0.0001 | ||
| 3 | PASITS = BSA + PatGA + skin pain | Intercept | − 1.160 | 0.096 | − 12.07 | 0.0231 |
| BSA | 0.356 | 0.005 | 70.36 | < 0.0001 | ||
| PatGA | 1.720 | 0.069 | 24.94 | < 0.0001 | ||
| Skin pain | 0.043 | 0.004 | 11.60 | < 0.0001 | ||
| 4 | PASITS = BSA + PatGA + skin pain + itch | Intercept | − 1.184 | 0.096 | − 12.37 | < 0.0001 |
| BSA | 0.355 | 0.005 | 70.52 | < 0.0001 | ||
| PatGA | 1.414 | 0.085 | 16.65 | < 0.0001 | ||
| Skin pain | 0.031 | 0.004 | 7.23 | < 0.0001 | ||
| Itch | 0.283 | 0.046 | 6.10 | < 0.0001 |
BSA body mass index, PatGA patient global assessment of disease severity
Table 4.
Summary of coefficients (estimates) of selected models (without interaction and without higher-order terms) for DLQI at week 12
| Number of terms | Model | Terms | Estimate | Standard error | t value | p value |
|---|---|---|---|---|---|---|
| 1 | DLQITS = BSA | Intercept | 2.116 | 0.105 | 20.11 | < 0.0001 |
| BSA | 0.205 | 0.005 | 37.81 | < 0.0001 | ||
| 2 | DLQITS = BSA + itch | Intercept | 0.014 | 0.086 | 0.16 | 0.872 |
| BSA | 0.066 | 0.005 | 14.00 | < 0.0001 | ||
| Itch | 1.387 | 0.025 | 55.32 | < 0.0001 | ||
| 3 | DLQITS = BSA + itch + skin pain | Intercept | 0.210 | 0.082 | 2.57 | 0.0103 |
| BSA | 0.057 | 0.004 | 12.69 | < 0.0001 | ||
| Itch | 0.852 | 0.035 | 24.23 | < 0.0001 | ||
| Skin pain | 0.081 | 0.004 | 20.59 | < 0.0001 | ||
| 4 | DLQITS = BSA + itch + skin pain + PatGA | Intercept | − 0.175 | 0.088 | − 1.98 | 0.048 |
| BSA | 0.041 | 0.005 | 8.75 | < 0.0001 | ||
| Itch | 0.581 | 0.043 | 13.56 | < 0.0001 | ||
| Skin pain | 0.073 | 0.004 | 18.74 | < 0.0001 | ||
| PatGA | 0.840 | 0.078 | 10.73 | < 0.0001 |
BSA body mass index, DLQI Dermatology Life Quality Index, PatGA patient global assessment of disease severity
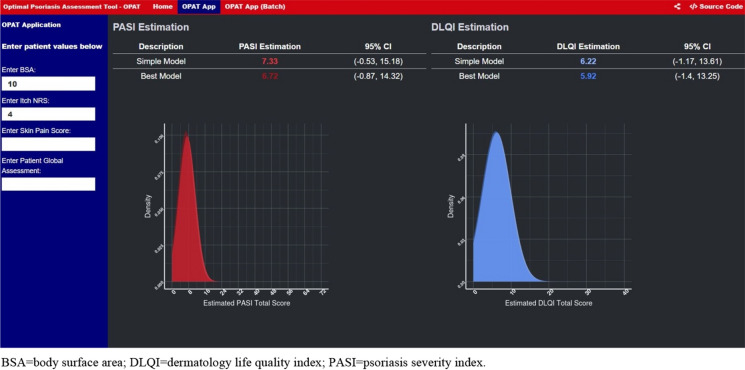
A sample digital prototype of OPAT is presented in Fig. 7.
Fig. 7.
Digital prototype of OPAT
Discussion
Health care payers and dermatologists are paying more attention to assessment of patient severity outcomes or improvements. In clinical settings (mostly randomized clinical trials), the most common measure used is PASI. However, a recent systematic review evaluating the variation between PASI and PGA scores used in clinical trials showed a high variability when measuring the same results [13]. This study highlights the need for more consistent and reliable outcome for measuring biologic therapeutic efficacy. PASI is rarely used in the real world and it does not adequately reflect patients’ quality of life; therefore, an alternative to PASI with potential for use in clinical practice is needed.
Currently, two proxy measures to PASI are receiving significant attention as potential outcome measures for use in clinical practice and are tied to effective treatment. First, the BSA measurement has been suggested as a target goal by the National Psoriasis Foundation in a recent publication [14]. The target responses were defined by a consensus panel of dermatologists with specific expertise in psoriasis treatment. BSA 75, BSA 90, and BSA 100 could be used in similar manner as PASI 75, PASI 90, and PASI 100 [15]. Secondly, the International Dermatology Outcomes Measures (IDEOM) has worked to develop and validate measures for skin diseases by using the Delphi survey process [16]. The consensus opinion for IDEOM is focused on the BSA × sPGA measurement, which captures more clinical information than BSA alone, as a potential outcome that can be used consistently across clinical trials and in real-world practice [17]. Although these two proxy measures (BSA and BSA × sPGA) appear to show promising results, neither one considers any patient-reported assessments of disease impact.
In this study, we pursued a more holistic approach for assessing an alternative to PASI by combining a clinical assessment with a PRO measure using a large, integrated database from three clinical trials (n = 3866). Statistical analyses revealed high correlations between OPAT inputs (BSA and PROs) to both PASI and DLQI scores. Regression modeling was used to analyze multiple model specifications (including BSA plus one, two, or three PROs, as well as interaction terms and other higher-order terms). On the basis of model fit parameters, models with BSA and one PRO performed well (BSA and PatGA had the best fit, in general, although not much more than itch and skin pain). The two-term and three-term models were the preferred ones, as they had minor differences in R2 and RMSE as compared to the most complicated models with eight terms. The concordance rates between OPAT model predictions and observed PASI 75, PASI 90, and PASI 100 scores were highest in the model using BSA and PatGA, followed by the model with BSA and itch, and provide additional support for the performance of the OPAT model.
Thus, our use of both BSA and a patient-reported assessment for the OPAT is an important step toward a viable alternative to PASI in real-world clinical practice.
The digital prototype demonstrates the practical potential for health care providers in the implementation of the OPAT, as the BSA measure and a single PRO would be entered resulting in quick, real-time estimates of disease severity and the impact on patients’ HRQoL. A prototype for a potential interactive, digital version of OPAT was created on the basis of the regression models with the best statistical fit for predicting PASI scores, and for predicting DLQI scores. The graphical software program (R-shiny) was used to create the prototype (Fig. 7).
PASI is considered as the gold standard measure of psoriasis severity and the most common disease severity measure used in clinical trials. However, the PASI assessment is complex and time-consuming, requiring collection of 16 measurements and performance of 13 calculations, and is generally not used by community dermatologists. In this study we evaluated the use of OPAT that requires only two inputs: BSA and a single PRO measure (itch, PatGA, or skin pain) to predict PASI. Therefore, OPAT is a simpler and time-saving method for dermatologists and health care providers to measure psoriasis severity.
The limitations of these analyses were that it was performed on a moderate-to-severe psoriasis population (BSA ≥ 10); thus, the performance of OPAT in patients with less than 10% BSA involvement is not known. Additional validation in terms of replication in other patient populations with other biologic treatments in both randomized clinical trials and real-world databases is needed. Another limitation of this tool is that the population in this study could be different than in a clinical practice setting. Additional analysis on real-world data would allow the generalization of the results.
Conclusion
Our study demonstrates how using only two data inputs, BSA and a single PRO measure, can strongly predict a full PASI assessment, and quality of life on over 3800 patients from three randomized clinical trials. In addition, we presented a prototype for the user-friendly OPAT application for dermatologists and health care providers with input selection, prediction results, and density distributions for predicted PASI and DLQI scores. The OPAT provides an alternative to PASI to measure disease severity in a simple, practical, and time-saving manner. The OPAT can be easily incorporated into real-world clinical practice via a digital calculation tool.
Supplementary Information
Below is the link to the electronic supplementary material.
Acknowledgements
Funding
This work and journal’s Rapid Service Fees were supported by Eli Lilly and Company.
Authorship
All named authors meet the International Committee of Medical Journal Editors (ICMJE) criteria for authorship for this article, take responsibility for the integrity of the work as a whole, and have given their approval for this version to be published.
Author Contributions
Craig Leonardi acquired data for the analysis, analyzed the data, and interpreted the data, Kyoungah See and Russel Burge conceived and designed the work, and interpreted the data, Gaia Gallo, Missy McKean-Matthews, Ying Zhang, Orin Goldblum, and Lotus Mallbris analyzed the data, and interpreted the data. All authors provided critical revisions and approved the final manuscript.
Medical Writing
Ananya Biswas, an employee of Eli Lilly Services India Pvt. Ltd., India, provided assistance in writing the manuscript. Editorial assistance in the preparation of this article was provided by Elsa Mevel, PhD, an employee of Eli Lilly. Medical writing and editorial assistance were founded by Eli Lilly.
Prior Presentation
Portions of this work were presented at the 2019 Society for Investigative Dermatology—77th Annual Meeting, May 8–11, 2019.
Disclosures
Dr. Leonardi received honoraria serving as a consultant for Celgene Corporation and Dermira; received honoraria as a speaker for AbbVie, Amgen, Celgene Corporation, Eli Lilly and Company, Novartis, and Sun Pharmaceuticals Ltd; received other financial benefits as a principal investigator for Actavis, Amgen, Boehringer Ingelheim, Celgene Corporation, Cellceutix, Coherus Biosciences, Corrona, Dermira, Eli Lilly and Company, Galderma Laboratories LP, Glenmark Generics Inc, Janssen Pharmaceuticals Inc, Leo Pharma Inc, Novartis, Novella, Pfizer Inc, Sandoz a Novartis Company, Sienna Biopharmaceuticals, Stiefel (a GSK company), UCB, and Warner Chillcott; and receiving honoraria as an advisory board member for AbbVie, Amgen, Boehringer Ingelheim, Eli Lilly and Company, Janssen Pharmaceuticals Inc, Leo Pharma A/S, Ortho Dermatologics, Pfizer Inc, Sandoz (a Novartis Company), and UCB.
Compliance with Ethics Guidelines
The studies were approved by the ethical review board at each participating site before the start of the study. The trials conform with Good Clinical Practices, International Council for Harmonization, local laws and regulations, and were conducted in accordance with the Declaration of Helsinki principles. All patients enrolled provided written informed consent before participating in the trials.
Data Availability
Lilly provides access to all individual participant data collected during the trial, after anonymization, with the exception of pharmacokinetic or genetic data. Data are available to request 6 months after the indication studied has been approved in the USA and EU and after primary publication acceptance, whichever is later. No expiration date of data requests is currently set once data are made available. Access is provided after a proposal has been approved by an independent review committee identified for this purpose and after receipt of a signed data sharing agreement. Data and documents, including the study protocol, statistical analysis plan, clinical study report, blank or annotated case report forms, will be provided in a secure data sharing environment. For details on submitting a request, see the instructions provided at http://www.vivli.org. The authors would like to thank the studies participants for their involvement in the trial.
References
- 1.Greb JE, Goldminz AM, Elder JT, et al. Psoriasis. Nat Rev Dis Primers. 2016;2:16082. doi: 10.1038/nrdp.2016.82. [DOI] [PubMed] [Google Scholar]
- 2.Wu JJ. Contemporary management of moderate to severe plaque psoriasis. Am J Manag Care. 2017;23(21 Suppl):S403–S416. [PubMed] [Google Scholar]
- 3.Wu JJ, Feldman SR, Koo J, Marangell LB. Epidemiology of mental health comorbidity in psoriasis. J Dermatol Treat. 2018;29(5):487–495. doi: 10.1080/09546634.2017.1395800. [DOI] [PubMed] [Google Scholar]
- 4.Duffin KC, Papp KA, Bagel J, Levi E, Chen R, Gottlieb AB. Evaluation of the physician global assessment and body surface area composite tool for assessing psoriasis response to apremilast therapy: results from ESTEEM 1 and ESTEEM 2. J Drugs Dermatol. 2017;16(2):147–153. [PubMed] [Google Scholar]
- 5.Fredriksson T, Pettersson U. Severe psoriasis—oral therapy with a new retinoid. Dermatologica. 1978;157(4):238–244. doi: 10.1159/000250839. [DOI] [PubMed] [Google Scholar]
- 6.National Clinical Guideline Centre . National Institute for Health and Clinical Excellence: guidance. Psoriasis: assessment and management of psoriasis. London: Royal College of Physicians; 2012. [Google Scholar]
- 7.Fink C, Alt C, Uhlmann L, Klose C, Enk A, Haenssle HA. Intra- and interobserver variability of image-based PASI assessments in 120 patients suffering from plaque-type psoriasis. J Eur Acad Dermatol Venereol. 2018;32(8):1314–1319. doi: 10.1111/jdv.14960. [DOI] [PubMed] [Google Scholar]
- 8.Manalo IF, Gilbert KE, Wu JJ. An updated survey for the 2007–2013 period of randomized controlled trials for psoriasis: treatment modalities, study designs, comparators, outcome measures and sponsorship. J Eur Acad Dermatol Venereol. 2015;29(10):1945–1950. doi: 10.1111/jdv.13089. [DOI] [PubMed] [Google Scholar]
- 9.Bozek A, Reich A. The reliability of three psoriasis assessment tools: psoriasis area and severity index, body surface area and physician global assessment. Adv Clin Exp Med. 2017;26(5):851–856. doi: 10.17219/acem/69804. [DOI] [PubMed] [Google Scholar]
- 10.Mahendraratnam N, Sorenson C, Richardson E, et al. Value-based arrangements may be more prevalent than assumed. Am J Manag Care. 2019;25(2):70–76. [PubMed] [Google Scholar]
- 11.Papp KA, Leonardi CL, Blauvelt A, et al. Ixekizumab treatment for psoriasis: integrated efficacy analysis of three double-blinded, controlled studies (UNCOVER-1, UNCOVER-2, UNCOVER-3) Br J Dermatol. 2018;178(3):674–681. doi: 10.1111/bjd.16050. [DOI] [PubMed] [Google Scholar]
- 12.Reich K, Pinter A, Lacour JP, et al. Comparison of ixekizumab with ustekinumab in moderate-to-severe psoriasis: 24-week results from IXORA-S, a phase III study. Br J Dermatol. 2017;177(4):1014–1023. doi: 10.1111/bjd.15666. [DOI] [PubMed] [Google Scholar]
- 13.Wu AG, Conway J, Barazani L, Roy B, Cline A, Pereira F. Is clear always clear? Comparison of Psoriasis Area and Severity Index (PASI) and the Physician's Global Assessment (PGA) in psoriasis clearance. Dermatol Ther (Heidelb) 2020;10(5):1155–1163. doi: 10.1007/s13555-020-00435-2. [DOI] [PMC free article] [PubMed] [Google Scholar]
- 14.Armstrong AW, Siegel MP, Bagel J, et al. From the Medical Board of the National Psoriasis Foundation: treatment targets for plaque psoriasis. J Am Acad Dermatol. 2017;76(2):290–298. doi: 10.1016/j.jaad.2016.10.017. [DOI] [PubMed] [Google Scholar]
- 15.Wu JJ, No DJ, Amin M. BSA75, BSA90, and BSA100: new clinical tools for measuring improvement in psoriasis. Cutis. 2017;99(6):418. [PubMed] [Google Scholar]
- 16.Perez-Chada LM, Singh S, Callis-Duffin K, et al. International Dermatology Outcome Measures (IDEOM) group 2016 new york meeting: meeting summary and data from the psoriasis working group. J Drugs Dermatol. 2017;16(8):770–777. [PubMed] [Google Scholar]
- 17.Merola JF, Amato DA, See K, et al. Evaluation of sPGA × BSA as an outcome measure and treatment target for clinical practice. J Invest Dermatol. 2018;138(9):1955–1961. doi: 10.1016/j.jid.2018.01.041. [DOI] [PubMed] [Google Scholar]
Associated Data
This section collects any data citations, data availability statements, or supplementary materials included in this article.
Supplementary Materials
Data Availability Statement
Lilly provides access to all individual participant data collected during the trial, after anonymization, with the exception of pharmacokinetic or genetic data. Data are available to request 6 months after the indication studied has been approved in the USA and EU and after primary publication acceptance, whichever is later. No expiration date of data requests is currently set once data are made available. Access is provided after a proposal has been approved by an independent review committee identified for this purpose and after receipt of a signed data sharing agreement. Data and documents, including the study protocol, statistical analysis plan, clinical study report, blank or annotated case report forms, will be provided in a secure data sharing environment. For details on submitting a request, see the instructions provided at http://www.vivli.org. The authors would like to thank the studies participants for their involvement in the trial.


