

Abstract
Reliable biomarkers are of great significance for the treatment and diagnosis of hepatocellular carcinoma (HCC). This study identified potential prognostic epithelial–mesenchymal transition related lncRNAs (ERLs) by the cancer genome atlas (TCGA) database and bioinformatics.
The differential expression of long noncoding RNA (lncRNA) was obtained by analyzing the lncRNA data of 370 HCC samples in TCGA. Then, Pearson correlation analysis was carried out with EMT related genes (ERGs) from molecular signatures database. Combined with the univariate Cox expression analysis of the total survival rate of hepatocellular carcinoma (HCC) patients, the prognostic ERLs were obtained. Then use “step” function to select the optimal combination of constructing multivariate Cox expression model. The expression levels of ERLs in HCC samples were verified by real-time quantitative polymerase chain reaction.
Finally, we identified 5 prognostic ERLs (AC023157.3, AC099850.3, AL031985.3, AL365203.2, CYTOR). The model showed that these prognostic markers were reliable independent predictors of risk factors (P value <.0001, hazard ratio [HR] = 2.400, 95% confidence interval [CI] = 1.667–3.454 for OS). In the time-dependent receiver operating characteristic analysis, this prognostic marker is a good predictor of HCC survival (area under the curve of 1 year, 2 years, 3 years, and 5 years are 0.754, 0.720, 0.704, and 0.662 respectively). We analyzed the correlation of clinical characteristics of these prognostic markers, and the results show that this prognostic marker is an independent factor that can predict the prognosis of HCC more accurately. In addition, by matching with the Molecular Signatures Database, we obtained 18 ERLs, and then constructed the HCC prognosis model and clinical feature correlation analysis using 5 prognostic ERLs. The results show that these prognostic markers have reliable independent predictive value. Bioinformatics analysis showed that these prognostic markers were involved in the regulation of EMT and related functions of tumor occurrence and migration.
Five prognostic types of ERLs identified in this study can be used as potential biomarkers to predict the prognosis of HCC.
Keywords: epithelial–mesenchymal transition, hepatocellular carcinoma, long noncoding RNA, prognosis, the cancer genome atlas
1. Introduction
Liver cancer is one of the most common malignant tumors in the world. The number of deaths due to liver cancer ranks the fourth in the world.[1] Hepatocellular carcinoma accounts for the majority of liver cancer cases, and the number of hepatocellular carcinoma (HCC) patients in China accounts for more than half of the world's cases.[2] Alcoholism, aflatoxin B1, diabetes, hepatitis B virus (HBV) infection, nonalcoholic fatty liver (NAFLD) and obesity are the main risk factors for HCC.[3] Although the management of HCC has improved in recent years, the overall prognosis is still poor,[4] so it is urgent to develop new diagnosis and treatment strategies.
Noncoding RNAs (ncRNAs) are RNAs that do not participate in protein coding. NcRNAs containing more than 200 nucleotides are defined as long-chain noncoding RNAs (lncRNAs). A large number of studies have shown that lncRNAs are involved in the pathophysiological process of various diseases,[5] and this is also proved by more and more researchers in HCC.[6]
Epithelial–mesenchymal transition (EMT) is a physiological process involving the transformation of epithelial cells into stromal cells. This transformation enhances the ability of invasion, metastasis and anti-apoptosis of cells, and helps to promote the growth and metastasis of HCC cells.[7] Many studies have reported that many kinds of lncRNAs regulate the occurrence and development of EMT by targeting EMT transcription factors. For example, lnc-GNAT1–1 can inhibit the expression of snail to inhibit EMT,[8] lncRNA-CC3 directly targets snail to promote the EMT process,[9] and lncRNA-ZFAS1 can induce EMT in cancer cells by competitive binding of corresponding miRNA to ceRNA network.[10] At the same time, many studies have shown that these abnormal expression of lncRNA can affect the prognosis of HCC by participating in EMT process, and it is valuable for predicting the prognosis of HCC.[1,8–12] Although some EMT related lncRNAs (ERLs) have been reported in HCC, there is little knowledge in this area, and there are still a large number of lncRNA and HCC EMT relationship is not clear. In this study, we used high throughput HCC data from the cancer genome atlas (TCGA) to identify ERLs with prognostic value through bioinformatics analysis, in order to find the ERLs with prognostic value for HCC.
2. Materials and method
2.1. Data source and clinical samples
The publicly shared dataset of 370 patients with HCC was downloaded from the TCGA data portal (https://portal.gdc.cancer.gov/, accessed August 20, 2019), including all kinds of gene expression data and corresponding clinical information. Data retrieval and application complied with the TCGA publication guidelines and data access policies. In addition, HCC and para-cancerous tissues were collected from 6 patients, immediately frozen in liquid nitrogen and stored at – 80°C. Informed consent was obtained from participants before this study. The ethics committee of the First Affiliated Hospital of Guangxi Medical University approved the study.
2.2. Epithelial–mesenchymal transition related lncRNAs screening
The lncRNA and mRNA expression profiles of HCC cohort were extracted from the RNA sequencing dataset of TCGA. Meanwhile, a series of ERLs were retrieved from the Molecular Signatures Database v7.0 (molecular signatures database; Hallmark_epithelial_mesenchymal_transition; http://www.broadinstitute.org/gsea/msigdb/index.jsp). These ERGs expression data were extracted from the dependent mRNA data.
The limma software package of R platform was used to screen the differentially expressed lncRNAs (DELs), Samples with a P value of <.05 and log fold change (log|FC)| of >1 were considered DELs.
LncRNA does not encode protein itself, but it affects the co-expression of the related encoded protein mRNA through the target. The co-expression relationship between DELs and ERGs was evaluated by performing Pearson correlation analysis. Pearson correlation coefficient (| R | > 0.4, P < .001) between lncRNAs and ERGs was used to identify ERLs. These lncRNAs were considered as significant ERLs.
2.3. Construction of prognostic signature
Univariate Cox regression analysis between the expression levels of ERLs and the survival time of patients with HCC was performed through the “survival” package (version 2.44) on the R (version 3.6.1) to describe the role of ERLs on HCC survival prediction. ERLs with a P value <.01 were identified as prognostic ERLs, the expression level was significantly related to the survival time of HCC patients. the prognostic ERLs selected by the “step” function were fitted into a multivariate Cox regression analysis with survival time as the dependent variable. A risk score model of prognostic signature was constructed by the linear combination of the expression levels of the ERLs with the multivariate Cox regression coefficient (β) as the weight. The risk score of each patient with HCC was calculated by the following formula: risk score = expressionlncRNA1 × βlncRNA1 + expressionlncRNA2 × βlncRNA2 +…+expressionlncRNAn × βlncRNAn[13]. The HCC cohort was divided into high- and low-risk groups based on this prognostic model by setting the median risk score as cut-off. A time-dependent receiver operating characteristic (ROC) curve was generated by applying the “survivalROC” R package (version 1.0.3) to estimate the predictive accuracy of this prognostic signature.[13]
2.4. Evaluation of ERL-based prognostic signature
To evaluate the predictive value of ERL based prognostic markers for HCC patients. Therefore, joint effect analysis was performed to investigate the association between the prognostic signature and clinicopathologic characteristics in HCC. Prognostic nomogram for predicting survival rate was constructed through risk score and clinicopathologic characteristics. Principal component analysis was performed to determine the profile distribution patterns of grouped cases.
2.5. Bioinformatics analysis
The co-expressed ERGs were analyzed for gene ontology (GO) terms and Kyoto Encyclopedia of Genes and Genomes (KEGG) database pathways by applying the David online websit (DAVID v6.8, https://david.ncifcrf.gov/, accessed November 1, 2019), which is a widely used bioinformatics resource.[14] GO analysis and KEGG analysis reveals the enriched pathway of co-expressed ERGs. P value <.05 was considered statistically significant in GO and KEGG analyses. Gene set enrichment analysis (GSEA, version 4.0.1, http://www.broadinstitute.org/gsea/index.jsp) was performed to explore the distinct functional phenotypes between the high- and low-risk groups. The molecular signatures database of C2 (c2.cp.kegg.v7.0.symbols.gmt) and C5 (c5.all.v7.0.symbols.gmt) was applied to GSEA. A nominal P value <.05 and false discovery rate < 0.05 were considered statistically significant in GSEA.
2.6. Real-time quantitative PCR
According to the manufacturer's protocol, total RNA was extracted with RNAiso Plus reagent (Takara, Japan), and reverse-transcripted into complementary DNA using PrimeScriptTMRT reagent Kit with gDNA Eraser (Takara, Japan). TB Green○R Premix Ex TaqTM II Kit (Takara, Japan) was used for real-time PCR in ABI7500 real-time PCR system (Applied Biosystems). The primer sequence is shown in Table 1. Each cDNA sample was repeated 3 times.
Table 1.
The primer sequences of 5 ERLS.
| AC023157.3 | F primer (5’-3’) | GTCTGTTGTTTGTATGCTGAGTTC |
| R primer (5’-3’) | TTGTCTGACCCAAGTGTTCG | |
| AC099850.3 | F primer (5’-3’) | AATATGGAAACAGGAACAGGAC |
| R primer (5’-3’) | GGAAATCTCAAAACCCAAAGG | |
| AL031985.3 | F primer (5’-3’) | ACACCTATTCAACTTCCCCATT |
| R primer (5’-3’) | CCAAGGATTCCCCTAAACATC | |
| AL365203.2 | F primer (5’-3’) | TTGCCTCATTTCATGGTCTG |
| R primer (5’-3’) | GCCCCTGTTTTGATTCCTAT | |
| CYTOR | F primer (5’-3’) | TGGGAGATGAAACAGGAAGC |
| R primer (5’-3’) | CAGACAAATGGGAAACCGAC |
2.7. Statistical analysis
Kaplan–Meier survival analysis by log-rank test was used to compare the survival status of patients with HCC between the high- and low-risk groups. P value <.05 was considered significant. Survival curves, ROC curves, and heat maps were plotted by the R platform. Statistical analysis was performed using SPSS version 22.0 (IBM Corporation, Armonk, NY, USA).
3. Results
3.1. Epithelial–mesenchymal transition related lncRNAs screening
Comprehensive gene annotation was downloaded from the Ensembl Genomes (http://ensemblgenomes.org/, accessed November 5, 2017).[15] Of the 5268 lncRNAs obtained from the RNA sequence data set, 2994 met the standard of mean value greater than 1. The heat map and volcano map of DELs are shown in Figure 1. These lncRNAs were allowed to conduct Pearson correlation analysis with ERG expression data, lncRNA with correlation coefficient R greater than 0.4 was used for univariate regression analysis.
Figure 1.

The distribution of differential expression of lncRNA in HCC and normal tissues. Note: (A) Scatter diagram of differential expression of lncRNA in HCC and normal tissues, (B) Heat Map of differential expression of lncRNA in HCC and normal tissues.
3.2. Construction of the ERL-based prognostic signature
A univariate regression analysis was performed to examine the association between ERLs and the OS of patients with HCC. ERLs with a P value <.001 were regarded as prognostic ERLs. A total of 18 ERLs were identified (see, Supplemental Digital Content Table S1, which demonstrates ERLs identified by Pearson correlation analysis; see, Supplemental Digital Content Table S2, which demonstrates the univariate survival analysis results of the ERLs). After selecting the optimal combination through the “step” function, the following 5 prognostic ERLs are used to build the prognosis model: AC023157.3, AC099850.3, AL031985.3, AL365203.2, CYTOR. The Kaplan–Meier curve and expression scatter diagram of 5 prognostic ERLs are shown in Figure 2. In univariate analysis, 5 prognostic ERLs divided HCC patients into high-risk group and low-risk group according to the expression. Survival analysis showed that the high-risk group had a worse prognosis.
Figure 2.

Kaplan–Meier curves of the survival time of the 5 prognostic ERLs in HCC. Note: The 5 prognostic ERLs include (A) AC023157.3, (B) AC099850.3, (C) AL031985.3, and (D) AL365203.2, (E) CYTOR.
In the multivariate risk model, the median survival time of the high-risk group was significantly lower than that of the low-risk group (1,005 vs 3,125 days for high-risk vs low-risk), and the risk of death was significantly increased (P value <.0001, hazard ratio [HR] = 2.400, 95% confidence interval [CI] = 1.667–3.454 for OS, Fig. 3A, B, D). The results of ROC correlated with time show that the prediction ability of the model is better. Area under the curve of 1 year, 2 years, 3 years, and 5 years are 0.754, 0.720, 0.704, and 0.662 respectively (Fig. 3F). The 5 ERLs of prognostic signature identified from Cox regression analysis are show in Table 2. Clinical and pathologic characteristics of HCC patients and prognostic analysis are show in Table 3, and the expression of 5 ERLs in high and low risk groups is shown in Figure 4.
Figure 3.

The risk score model analysis of the 5 prognostic ERL's signature. Note: (A)The rank of risk score, (B) survival outcome, and (C) expression heat map of the 5 prognostic ERLs between the high- and low-risk groups. (D) Kaplan–Meier curves for the high- and low-risk groups. (E) Time-dependent ROC analysis based on the risk score of patients with HCC.
Table 2.
The 5 ERLs of prognostic signature identified from Cox regression analysis.
| lncRNA symbol | Ensemble ID | Hazard ratio∗ | P value∗ | Coefficient† |
| AL365203.2 | ENSG00000273038 | 1.654 | <.001 | 0.211 |
| CYTOR | ENSG00000222041 | 1.330 | <.001 | 0.187 |
| AC023157.3 | ENSG00000276900 | 1.844 | <.001 | 0.487 |
| AL031985.3 | ENSG00000260920 | 3.204 | <.001 | 0.609 |
| AC099850.3 | ENSG00000265303 | 1.523 | <.001 | 0.198 |
Table 3.
Clinical and pathologic characteristics of HCC patients and prognostic analysis.
| Variables | Count of events/total (n = 370) | MST (days) | HR (95% CI) | P value |
| Age (yr) | 70/232 | 2456 | 1 | .160 |
| ≤65 | 56/138 | 1490 | 1.288 (0.904-1.834) | |
| >65 | ||||
| Gender | 48/121 | 1560 | 1 | .362 |
| Female | 78/249 | 2486 | 0.845 (0.588–1.214) | |
| Male | ||||
| Serum AFP (ng/mL)∗ | 60/213 | 2456 | 1 | .852 |
| ≤400 | 21/64 | 2486 | 1.049 (0.633–1.738) | |
| >400 | ||||
| Child-Pugh grade† | 57/216 | 2542 | 1 | .077 |
| A | 9/22 | 1005 | 1.872 (0.924–3.795) | |
| B / C | ||||
| Ishak fibrosis score‡ | 29/74 | 2456 | 1 | .847 |
| 0 | 7/31 | 1791 | 0.757 (0.325–1.762) | |
| 1 / 2 | 6/28 | NA | 0.686 (0.281–1.675) | |
| 3 / 4 | 2/9 | 1386 | 0.720 (0.170–3.056) | |
| 5 | 17/69 | NA | 0.750 (0.408–1.380) | |
| 6 | ||||
| Tumor stage§ | 41/171 | 2532 | 1 | <.001 |
| I | 25/85 | 1852 | 1.436 (0.871–2.369) | |
| II | 47/90 | 770 | 2.751 (1.803–4.198) | |
| III / IV | ||||
| Histologic grade|| | 18/55 | 2116 | 1 | .786 |
| G1 | 58/177 | 1685 | 1.148 (0.676–1.950) | |
| G2 | 41/121 | 1622 | 1.180 (0.676–2.060) | |
| G3 | 5/12 | NA | 1.825 (0.648–5.140) | |
| G4 | ||||
| MVI¶ | 59/206 | 2131 | 1 | .185 |
| No | 34/108 | 2486 | 1.331 (0.870–2.034) | |
| Yes | ||||
| Radical resection# | 106/323 | 2116 | 1 | .003 |
| R0 | 17/40 | 837 | 2.137 (1.276–3.581) | |
| R1 / R2 / RX | ||||
| Risk index | 46/185 | 3125 | 1 | <.001 |
| Low | 80/185 | 1005 | 2.400 (1.667–3.454) | |
| High |
Figure 4.
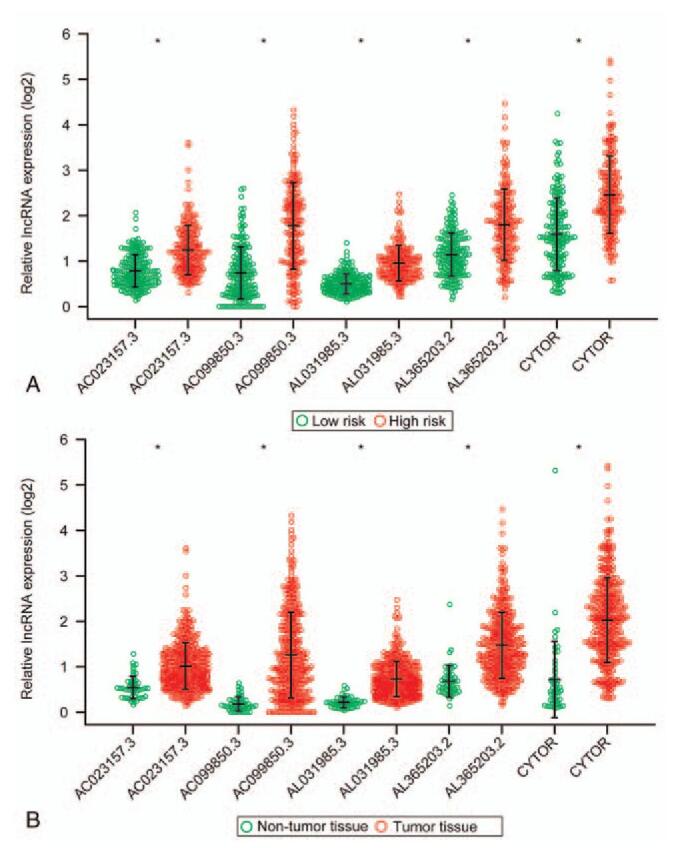
Expression levels of the 5 prognostic ERLs in high- and low-risk groups. ∗P < .05.
3.3. Stratified and joint effects analysis.
Stratified and combined effect analysis was performed to assess the predictive power of 5 prognostic ERLs for HCC under different clinical conditions. Median survival time of high-risk score group decreased in different degrees compared with low-risk score group, which was not related to the good clinical phenotype grading in most clinical conditions, especially in tumor grading. In the clinical condition of AFP, when the AFP value is greater than 400, the high and low risk groups do not show the difference of prognosis. In the analysis results, the group with high risk score and poor clinical factors showed shorter survival time and higher risk of death. The combined effect analysis of 5 prognostic ERLs showed that it had a good predictive value of clinical results. Combined with clinical phenotypes, these 5 prediction markers show more accurate prediction ability in HCC (Table 4, Figs. 5 and 6).
Table 4.
Joint effects survival analysis of clinicopathologic characteristics and the ERLs signature risk score in HCC patients.
| Groups | Risk | Variables | Count of events/total (n = 370) | MST (days) | HR (95% CI) | P value |
| Age (yr) | ||||||
| A1 | Low risk | ≤65 | 28/114 | NA | 1 | |
| A2 | Low risk | >65 | 18/71 | 2131 | 0.940 (0.514–1.720) | .841 |
| A3 | High risk | ≤65 | 42//118 | 2456 | 1.900 (1.175–3.073) | .009 <.001 |
| A4 | High risk | >65 | 38/67 | 711 | 3.064 (1.872–5.015) | |
| Gender | ||||||
| G1 | Low risk | Female | 18/55 | 2116 | 1 | |
| G2 | Low risk | Male | 28/130 | NA | 0.674 (0.369–1.233) | .201 |
| G3 | High risk | Female | 30/66 | 1135 | 1.791 (0.995–3.225) | .052 |
| G4 | High risk | Male | 50/119 | 837 | 1.868 (1.083–3.222) | .025 |
| Serum AFP (ng/mL)∗ | ||||||
| S1 | Low risk | ≤400 | 29/120 | 3125 | 1 | |
| S2 | Low risk | >400 | 5/26 | NA | 0.623 (0.236–1.644) | .339 |
| S3 | High risk | ≤400 | 31/93 | 2456 | 1.818 (1.088–3.037) | .022 |
| S4 | High risk | >400 | 16/38 | 931 | 2.229 (1.199–4.143) | .011 |
| Child-Pugh grade† | ||||||
| C1 | Low risk | A | 25/125 | 3125 | 1 | |
| C2 | Low risk | B/C | 5/13 | 1624 | 2.170 (0.826–5.698) | .116 |
| C3 | High risk | A | 32/93 | 1694 | 2.216 (1.308–3.753) | .003 |
| C4 | High risk | B/C | 4/9 | 612 | 4.660 (1.551–14.002) | .006 |
| Ishak fibrosis score‡ | ||||||
| I1 | Low risk | 0 | 10/40 | 3125 | 1 | |
| I2 | Low risk | 1/2/3/4/5/6 | 18/82 | NA | 1.014 (0.454–2.265) | .974 |
| I3 | High risk | 0 | 19/34 | 931 | 2.710 (1.255–5.848) | .011 |
| I4 | High risk | 1/2/3/4/5/6 | 14/55 | NA | 1.675 (0.711–3.942) | .238 |
| T1 | Tumor stage§ | |||||
| T2 | Low risk | I | 20/108 | NA | 1 | |
| T3 | Low risk | II | 6/32 | NA | 1.109 (0.445–2.764) | .824 |
| T4 | Low risk | III/IV | 14/32 | 1210 | 2.775 (1.389–5.543) | .004 |
| T5 | High risk | I | 21/63 | 2456 | 2.313 (1.251–4.277) | .008 |
| T6 | High risk | II | 19/53 | 1149 | 2.833 (1.501–5.349) | .001 |
| High risk | III/IV | 33/58 | 558 | 4.951 (2.821–8.688) | <.001 | |
| Histologic grade|| | ||||||
| H1 | Low risk | G1 | 10/38 | 2116 | 1 | |
| H2 | Low risk | G2 | 24/97 | 3125 | 0.989 (0.470–2.081) | .977 |
| H3 | Low risk | G3/ G4 | 11/48 | NA | 0.897 (0.380–2.116) | .804 |
| H4 | High risk | G1 | 8/17 | 2532 | 2.193 (0.848–5.671) | .105 |
| H5 | High risk | G2 | 34/80 | 1005 | 2.186 (1.073–4.452) | .031 |
| H6 | High risk | G3/ G4 | 35/85 | 899 | 2.327 (1.144–4.734) | .020 |
| MVI|| | ||||||
| M1 | Low risk | No | 27/119 | 3125 | 1 | |
| M2 | Low risk | Yes | 11/47 | NA | 1.394 (0.683–2.843) | .361 |
| M3 | High risk | No | 32/87 | 1372 | 2.590 (1.526–4.396) | <.001 |
| M4 | High risk | Yes | 23/61 | 1490 | 2.418 (1.380–4.238) | .002 |
| Radical resection | ||||||
| R1 | Low risk | R0 | 41/171 | 3125 | 1 | |
| R2 | Low risk | R1 + R2 + RX | 4/10 | 837 | 3.999 (1.379–11.596) | .011 |
| R3 | High risk | R0 | 65/152 | 1005 | 2.426 (1.638–3.594) | <.001 |
| R4 | High risk | R1 + R2 + RX | 13/30 | 837 | 3.416 (1.816–6.425) | <.001 |
Figure 5.

Joint effect survival analysis of survival time stratified by risk score and clinicopathologic characteristics. Note: (A) Age, (B) Gender, (C) Serum AFP, (D) Child-Pugh grade, (E) Ishak fibrosis score, (F) Tumor stage, and (G) Histologic grade, (H) MVI, (I) Radical resection.
Figure 6.

Prognostic nomogram for predicting the 1-, 3-, and 5-years survival rates with risk score and clinicopathologic characteristics.
3.4. Principal component analysis analysis
Principal component analysis was used to study 5 prognosis ERLs, complete ERG data set, complete ERL data set in high-risk group and low-risk group showed different EMT status. The results show that the distribution direction of high-risk and low-risk groups is usually different, and the ERLs high-risk group and low risk group are obviously different. This shows that there is a difference in EMT between high and low risk groups of ERG and ERL, while the EMT status of specific 5 high risk groups of ERL has a greater difference (Fig. 7).
Figure 7.

PCA between high- and low-risk groups. Note: (A) the 198 ERG set, (B) the 206 ERL set, (C) the 5 ERLs’ prognostic signature.
3.5. Bioinformatics analysis of function and pathway
Gene ontology (GO) and Kyoto Encyclopedia of Genes and Genomes (KEGG) analysis were used to explore the biological functions and signaling pathways involved in 5 prognostic ERLs. A total of 29 ERGs related to 5 prognostic ERLs were analyzed by GO and KEGG. Go analysis showed that these ERGs were significantly enriched in the changes of extracellular matrix, cell migration function and cell adhesion function (Fig. 8A, B, C). This was confirmed by KEGG analysis, which showed that the extracellular matrix receptor interaction pathway and Pl3k-akt signaling pathway was significantly enriched (Fig. 8D). GSEA results in high and low risk groups are more likely to be related to cell cycle, chromosome remodeling and repair of biological processes (Fig. 9). Bioinformatics analysis showed that these prognostic ERLs had significant effects on the biological functions and pathways of EMT, cell cycle and chromosome changes in HCC.
Figure 8.

Functional and pathway enrichment analyses of the co-expressed ERGs of the 5 prognostic ERLs. Note: (A) result of biological process (BP), (B) result of Cellular Component (CC), (C) result of molecular function, (D) result of Encyclopedia of Genes and Genomes (KEGG) pathways.
Figure 9.

GSEA of C2 and C5 gene sets between high- and low-risk groups. Note: GSEA results of (A–E) C2 gene set and (F–I) C5 gene set.
3.6. Clinical validation of long noncoding RNA levels of 5 genes
We analyzed 6 pairs of HCC tissues and adjacent controls to verify the mRNA levels of 5 genes. The results showed that the expression of all 5 genes was relatively high in tumor (Fig. 10). Our experimental results are consistent with the data analysis.
Figure 10.

Verification of lncRNA levels of 5 prognostic ERLs in 6 pairs of HCC tissues and adjacent tissues. Note: ∗∗∗ represents P < .001.
4. Discussion
Epithelial cells are usually very tightly connected, which can form an important body defense barrier. Interstitial cells are adjacent to epithelial cells, with loose tissue and lack of cell polarity. EMT is a physiological process involving the transformation of epithelial cells into stromal cells, which enhances the ability of invasion, metastasis and anti-apoptosis of various cells.[16] This physiological process has 2 sides, different types of EMT can promote wound healing, tissue regeneration and fibrosis, which is also of great significance in the development of embryo.[17] Tumor cells can enhance their migration and invasion ability through EMT, invade blood vessels and lymphatic vessels, and have distant metastasis through circulatory system. Early studies on biomarkers of EMT in HCC showed that the expression of E-cadherin was down regulated, which was significantly related to intrahepatic metastasis and capsule invasion of cancer cells.[18] EMT is also associated with microvascular invasion in HCC, Overexpression of EMT related transcription factor FOXC1 promotes microvascular invasion of HCC.[19]
LncRNA can activate or inhibit tumor related signaling pathways, destroy the dynamic balance of cells, and participate in the regulation of tumor proliferation, apoptosis, invasion and metastasis by binding with mRNA and protein.[11,20] EMT inducible transcription factors mainly include Twist, Snail, Slug, and Zeb, these cytokines can directly or indirectly participate in the metastasis of cancer cells through different signal cascades, including Akt signal sensor and activator of transcription 3, MAPK pathway and Wnt pathway, and ERLs interacts with these EMT related factors to participate in EMT regulation.[21] In recent years, many lncRNAs have been confirmed to promote the proliferation, invasion and metastasis of HCC cells through the positive regulation of EMT process.[22] LncRNA-HULC has been shown to play a role as a competitive endogenous RNA in HCC, promoting the progression and metastasis of HCC by influencing the regulation of miR-200a-3p on Zeb-1 expression.[23] LncRNA HOYAIR enhances EMT through HOTAIR-mir-23b-3p-Zeb-1 pathway and promotes invasion and migration of hepatoma cells.[24] The expression level of lncRNA-CCAT2 was found to be positively correlated with lymph node metastasis and vascular invasion, which regulated the EMT process induced by Snail 2 and promoted the progression of HCC.[25] In addition to influencing EMT induced transcription factors, lncRNA also acts on some important signaling pathways in EMT. LncRNA-OGFRP1 can promote the EMT process by regulating Akt and Wnt/β-catenin signaling pathway, which can enhance the proliferation of hepatoma cells.[26] The overexpression of lncRNA-n335586 in HBV related hepatocarcinoma can significantly promote the migration and invasion of hepatocarcinoma cells, and It can affect the EMT process by affecting the lncRNA-n335586/miRNA 924/CKMT1A axis.[27] As mentioned above, lncRNA plays an important regulatory role in the EMT process of HCC, and also has an important value in the treatment and prognosis prediction of HCC patients. Therefore, it is necessary to identify prognostic ERLs.
In this study, we used HCC data from TCGA database. TCGA is a large comprehensive database containing high-throughput genetic material sequencing, clinical characteristics and other data. By using univariate regression analysis and Pearson correlation analysis, we determined 18 ERLs, and finally determined 5 prognostic ERLs by “step” function, which are used to build HCC prognosis model. ERLs shows good predictability in the model, and ROC analysis shows that the model has excellent accuracy in the prediction of survival over time. Among the 5 prognostic ERLs, AC099850.3 has been reported as an important node of lncRNA-miRNA-mRNA-ceRNA network of tongue squamous cell carcinoma in previous studies, which is significantly related to the overall survival rate of tongue squamous cell carcinoma.[28] Abnormally high expression of CYTOR was found in various tumor tissues,[29] The expression of CYTOR was found to be abnormally high in many kinds of tumor tissues. Relevant research shows that CYTOR is involved in the pathological process of many cancers, such as tongue squamous cell carcinoma, breast cancer, gallbladder cancer, kidney cancer, hepatocellular carcinoma, colon cancer, etc.[30–39] In breast cancer and tongue squamous cell carcinoma, CYTOR was found to be related to the overall survival time of patients, especially in breast cancer,[38,39] CYTOR was also related to tumor recurrence.[38] In the meantime, some studies show that x participates in the regulation of EMT, which is consistent with our results.[35,36] The remaining 3 ERLs included in the prognosis model in this study have not been reported in the past literature, and the specific mechanism of EMT in HCC needs further experimental exploration. In addition, we verified that 5 ERLS were highly expressed in HCC tissues by real-time quantitative polymerase chain reaction.
The results of combined effect analysis of prognostic ERLs indicate that they are important independent prognostic factors for HCC. We established the nomogram of the prediction model, and the results showed that the risk score based on these prognostic ERLs played a leading role in the prediction of HCC prognosis. Compared with most other clinical features, prognostic ERLs shows better and more accurate predictive power.
Bioinformatics analysis of 5 prognostic ERLs showed their biological functions and signal pathways involved in HCC. We used 29 prognostics related ERGs for go and KEGG analysis, and the results were consistent with the prediction. These genes were mainly enriched in cell migration, adhesion and the function of extracellular matrix changes, which also confirmed that these prognostics lncRNAs mainly affect the prognosis of HCC patients by regulating and participating in the EMT process of HCC. Many lncRNA have been found to participate in different biological functions of EMT. CCAT2 can promote EMT of HCC by regulating vimentin, E-cadherin and transcription factor Snail2.[25,40] LncRNA ROR can promote EMT of HCC by hypoxia/miR-145/ZEB2 signal axis.[41,42] LncRNA ATB can not only promote the up regulation of transcription factors ZEB1 and ZEB2 of EMT, but also increase the stability of mRNA of IL-11, interact with them, autocrine IL-11, trigger Stat3 Signal transduction is involved in the migration of HCC cells.[43,44] LncRNA Hottip can enhance the invasion and metastasis of HCC by inhibiting the expression of mirna-125b,[45] and spry4-it1 can activate mitogen-activated protein ki-nase (MAPK) signal pathway, and enhance the ability of apoptosis, proliferation and metastasis.[46] Most of these lncRNAs are directly or indirectly involved in the EMT process of HCC, and the enrichment function of ERGs in this study is very similar to them. It is worth mentioning that Pl3k-akt signaling pathway stands out in KEGG analysis. Research shows that Pl3k-akt signaling pathway can affect epidermal growth factor receptor (EGFR) and hepatocyte growth factor receptor (HGFR/cMet) signaling, which is of great significance for the migration of HCC cells.[47] GSEA analysis results of high and low risk groups showed that cell cycle and chromosome change function were enriched, which was also reflected in GO and KEGG analysis results. In a word, the functional analysis of ERLs shows the relationship between ERLs and EMT, cell cycle change, cell migration and other functions related to prognosis of HCC. The specific mechanism needs further experimental exploration.
In this study, we selected the optimal ERLs combination to construct the prognosis model through the “step” function, and then made a hierarchical analysis of the prediction prognosis model construction and clinical characteristics, which paid more attention to the value of these molecular markers in the prognosis prediction of patients with HCC than the previous ERLs research in HCC.[48] There are still several defects in this study. First, the HCC data from TCGA can not represent the whole HCC population, and a single data source may have the deviation of genetic data. Secondly, a part of clinical information from TCGA database is missing, which leads to the lack of some clinical features in the joint effect analysis in this study. Despite these shortcomings, this study identified some ERLs with prognostic value in HCC, which is valuable for studying EMT process and predicting prognosis of HCC.
5. Conclusion
In this study, we conducted intensive analysis of HCC data from TCGA. By matching with the Molecular Signatures Database, we obtained 18 ERLs, and then constructed the HCC prognosis model and clinical feature correlation analysis using 5 prognostic ERLs. The results show that these prognostic markers have reliable independent predictive value. Bioinformatics analysis showed that these prognostic markers were involved in the regulation of EMT and related functions of tumor occurrence and migration, which affected the prognosis of HCC patients. The 5 prognostic types of ELRs identified in this study can be used as potential biomarkers for studying EMT process, predicting prognosis and clinical treatment of HCC patients.
Acknowledgments
Thanks for all the participants in this study.
Author contributions
Conceptualization: Bang-Hao Xu, Le-Qun Li.
Data curation: Bang-Hao Xu, Tao Luo.
Formal analysis: Bang-Hao Xu, Le-Qun Li.
Investigation: Jing-Hang Jiang, Zhi-Jun Jiang, Xin-Yu Liu.
Methodology: Bang-Hao Xu, Xin-Yu Liu.
Project administration: Le-Qun Li.
Software: Jing-Hang Jiang, Tao Luo, Zhi-Jun Jiang.
Supervision: Le-Qun Li.
Validation: Jing-Hang Jiang, Zhi-Jun Jiang.
Visualization: Tao Luo, Xin-Yu Liu.
Writing – original draft: Bang-Hao Xu.
Writing – review & editing: Le-Qun Li.
Supplementary Material
Supplementary Material
Footnotes
Abbreviations: ERG = epithelial–mesenchymal transition related gene, ERL = epithelial–mesenchymal transition related lncRNAs, GO = gene oncology, GSEA = gene set enrichment analysis, HCC = hepatocellular carcinoma, KEGG = Kyoto Encyclopedia of Genes and Genomes, lncRNA = long noncoding RNA, ROC = receiver operating characteristic, TCGA = the cancer genome atlas.
How to cite this article: Xu BH, Jiang JH, Luo T, Jiang ZJ, Liu XY, Li LQ. Signature of prognostic epithelial–mesenchymal transition related long noncoding RNAs (ERLs) in hepatocellular carcinoma. Medicine. 2021;100:30(e26762).
This work was supported by the National Natural Science Foundation of China (No. 81560387, 81902983), the Guangxi Natural Science Foundation of China (No. 2018GXNSFBA050030), “Medical Excellence Award” funded by the creative research development grant from the first affiliated hospital of Guangxi Medical University (No.180327), the Guangxi medical and health technology development and application project (No. S2019097, S2018100) and the Emergency and Medical Rescue Talent Small Highland in Guangxi Zhuang Autonomous Region·Open Topics of Key Laboratory for Emergency Medicine in Guangxi Universities (No. GXJZ201501).
The authors have no conflicts of interests to disclose.
The datasets generated during and/or analyzed during the current study are publicly available.
Supplemental digital content is available for this article.
F primer = forward primer, R primer = reverse primer.
ERLs = epithelial–mesenchymal transition related noncoding RNAs, HCC = hepatocellular carcinoma.
Data from the univariate Cox regression analysis in HCC cohort.
Data from the multivariate Cox regression analysis in HCC cohort.
HCC = hepatocellular carcinoma, MST = media survival time, HR = hazard ratio.
93 patients’ data were unavailable.
132 patient's data were unavailable.
159 patient's data were unavailable.
24 patients’ data were unavailable.
5 patients’ data were unavailable.
56 patients’ data were unavailable.
7 patients’ data were unavailable.
HCC = hepatocellular carcinom, MST = media survival time, HR = hazard ratio.
93 patients’ data were unavailable.
132 patient's data were unavailable.
159 patient's data were unavailable.
24 patients’ data were unavailable.
5 patients’ data were unavailable.
56 patients’ data were unavailable.
7 patients’ data were unavailable.
References
- [1].Bray F, Ferlay J, Soerjomataram I, Siegel RL, Torre LA, Jemal A. Global cancer statistics 2018: GLOBOCAN estimates of incidence and mortality worldwide for 36 cancers in 185 countries. CA Cancer J Clin 2018;68:394–424. [DOI] [PubMed] [Google Scholar]
- [2].Liao X, Yang C, Huang R, et al. Identification of potential prognostic long non-coding RNA biomarkers for predicting survival in patients with hepatocellular carcinoma. Cell Physiol Biochem 2018;48:1854–69. [DOI] [PubMed] [Google Scholar]
- [3].Abdel-Hamid NM, Abass SA, Mohamed AA, Muneam Hamid D. Herbal management of hepatocellular carcinoma through cutting the pathways of the common risk factors. Biomed Pharmacother 2018;107:1246–58. [DOI] [PMC free article] [PubMed] [Google Scholar]
- [4].El-Serag HB, Kanwal F. Epidemiology of hepatocellular carcinoma in the United States: where are we? Where do we go? Hepatology 2014;60:1767–75. [DOI] [PMC free article] [PubMed] [Google Scholar]
- [5].Bhan A, Soleimani M, Mandal S S. Long noncoding RNA and cancer: a new paradigm. Cancer Res 2017;77:3965–81. [DOI] [PMC free article] [PubMed] [Google Scholar]
- [6].Parasramka MA, Maji S, Matsuda A, Yan IK, Patel T. Long non-coding RNAs as novel targets for therapy in hepatocellular carcinoma. Pharmacol Ther 2016;161:67–78. [DOI] [PMC free article] [PubMed] [Google Scholar]
- [7].Lamouille S, Xu J, Derynck R. Molecular mechanisms of epithelial-mesenchymal transition. Nat Rev Mol Cell Biol 2014;15:178–96. [DOI] [PMC free article] [PubMed] [Google Scholar]
- [8].Ye C, Shen Z, Wang B, et al. A novel long non-coding RNA lnc-GNAT1-1 is low expressed in colorectal cancer and acts as a tumor suppressor through regulating RKIP-NF-(B-Snail circuit. J EXP CLIN CANC RES 2016;35:187. [DOI] [PMC free article] [PubMed] [Google Scholar]
- [9].Jiang B, Sun R, Fang S, et al. Lnc-CC3 increases metastasis in cervical cancer by increasing Slug expression. Oncotarget 2016;7:41650–61. [DOI] [PMC free article] [PubMed] [Google Scholar]
- [10].Li T, Xie J, Shen C, et al. Amplification of long noncoding RNA ZFAS1 promotes metastasis in hepatocellular carcinoma. Cancer Res 2015;75:3181–91. [DOI] [PubMed] [Google Scholar]
- [11].A B, M S. Long noncoding RNA and cancer: a new paradigm. Cancer Res 2017;77(15):3965–81. [DOI] [PMC free article] [PubMed] [Google Scholar]
- [12].Liao X, Yang C, Rui H, et al. Identification of Potential Prognostic Long Non-Coding RNA Biomarkers for Predicting Survival in Patients with Hepatocellular Carcinoma. Cellular Physiol Biochem 2018;48:1854–69. [DOI] [PubMed] [Google Scholar]
- [13].Liao X, Huang K, Huang R, et al. Genome-scale analysis to identify prognostic markers in patients with early-stage pancreatic ductal adenocarcinoma after pancreaticoduodenectomy. Onco Targets Therapy 2017;10:4493–506. [DOI] [PMC free article] [PubMed] [Google Scholar]
- [14].Dennis G, Jr, Sherman BT, Hosack DA, et al. DAVID: database for annotation, visualization, and integrated discovery. Genome biology 2003;4:p3. [PubMed] [Google Scholar]
- [15].Kersey PJ, Allen JE, Armean I, et al. Ensembl Genomes 2016: more genomes, more complexity. Nucleic Acids Res 2016;44(D1):D574–580. [DOI] [PMC free article] [PubMed] [Google Scholar]
- [16].Yang J, Antin P, Berx G, et al. Guidelines and definitions for research on epithelial-mesenchymal transition. Nature Reviews Molecular Cell Biology 2020;21:341–52. [DOI] [PMC free article] [PubMed] [Google Scholar]
- [17].Leptin M. Twist and snail as positive and negative regulators during Drosophila mesoderm development. Genes Dev 1991;5:1568–76. [DOI] [PubMed] [Google Scholar]
- [18].Zhai B, Yan HX, Liu SQ, Chen L, Wu MC, Wang HY. Reduced expression of E-cadherin/catenin complex in hepatocellular carcinomas. World J Gastroenterol 2008;14:5665–73. [DOI] [PMC free article] [PubMed] [Google Scholar]
- [19].Xu ZY, Ding SM, Zhou L, et al. FOXC1 contributes to microvascular invasion in primary hepatocellular carcinoma via regulating epithelial-mesenchymal transition. Int J Biological Sci 2012;8:1130–41. [DOI] [PMC free article] [PubMed] [Google Scholar]
- [20].Wong CM, Tsang FH, Ng IO. Non-coding RNAs in hepatocellular carcinoma: molecular functions and pathological implications. Nat Rev Gastroenterol Hepatol 2018;15:137–51. [DOI] [PubMed] [Google Scholar]
- [21].Tania M, Khan MA, Fu J. Epithelial to mesenchymal transition inducing transcription factors and metastatic cancer. Tumour Biol 2014;35:7335–42. [DOI] [PubMed] [Google Scholar]
- [22].Gupta M, Chandan K, Sarwat M. Role of microRNA and long non-coding RNA in hepatocellular carcinoma. Curr Pharmaceutical Design 2020;26:415–28. [DOI] [PMC free article] [PubMed] [Google Scholar]
- [23].Li SP, Xu HX, Yu Y, et al. LncRNA HULC enhances epithelial-mesenchymal transition to promote tumorigenesis and metastasis of hepatocellular carcinoma via the miR-200a-3p/ZEB1 signaling pathway. Oncotarget 2016;7:42431–46. [DOI] [PMC free article] [PubMed] [Google Scholar]
- [24].Yang T, He X, Chen A, Tan K, Du X. LncRNA HOTAIR contributes to the malignancy of hepatocellular carcinoma by enhancing epithelial-mesenchymal transition via sponging miR-23b-3p from ZEB1. Gene 2018;670:114–22. [DOI] [PubMed] [Google Scholar]
- [25].Xu Y, Wang B, Zhang F, et al. Long non-coding RNA CCAT2 is associated with poor prognosis in hepatocellular carcinoma and promotes tumor metastasis by regulating Snail2-mediated epithelial-mesenchymal transition. Onco Targets Therapy 2017;10:1191–8. [DOI] [PMC free article] [PubMed] [Google Scholar]
- [26].Chen W, You J, Zheng Q, Zhu YY. Downregulation of lncRNA OGFRP1 inhibits hepatocellular carcinoma progression by AKT/mTOR and Wnt/(-catenin signaling pathways. Cancer Management Res 2018;10:1817–26. [DOI] [PMC free article] [PubMed] [Google Scholar]
- [27].Fan H, Lv P, Mu T, et al. LncRNA n335586/miR-924/CKMT1A axis contributes to cell migration and invasion in hepatocellular carcinoma cells. Cancer Lett 2018;429:89–99. [DOI] [PubMed] [Google Scholar]
- [28].Zhou RS, Zhang EX, Sun QF, et al. Integrated analysis of lncRNA-miRNA-mRNA ceRNA network in squamous cell carcinoma of tongue. BMC Cancer 2019;19:779. [DOI] [PMC free article] [PubMed] [Google Scholar]
- [29].Li M, Wang Q, Xue F, Wu Y. lncRNA-CYTOR works as an oncogene through the CYTOR/miR-3679-5p/MACC1 Axis in colorectal cancer. DNA Cell Biol 2019;38:572–82. [DOI] [PubMed] [Google Scholar]
- [30].Feng S, Zhang J, Su W, et al. Overexpression of LINC00152 correlates with poor patient survival and knockdown impairs cell proliferation in lung cancer. Scientific Rep 2017;7:2982. [DOI] [PMC free article] [PubMed] [Google Scholar]
- [31].Wu Y, Tan C, Weng WW, et al. Long non-coding RNA Linc00152 is a positive prognostic factor for and demonstrates malignant biological behavior in clear cell renal cell carcinoma. Am J Cancer Res 2016;6:285–99. [PMC free article] [PubMed] [Google Scholar]
- [32].Wang Y, Liu J, Bai H, Dang Y, Lv P, Wu S. Long intergenic non-coding RNA 00152 promotes renal cell carcinoma progression by epigenetically suppressing P16 and negatively regulates miR-205. Am J Cancer Res 2017;7:312–22. [PMC free article] [PubMed] [Google Scholar]
- [33].Deng X, Zhao XF, Liang XQ, Chen R, Pan YF, Liang J. Linc00152 promotes cancer progression in hepatitis B virus-associated hepatocellular carcinoma. Biomed Pharmacother 2017;90:100–8. [DOI] [PubMed] [Google Scholar]
- [34].Yu Y, Yang J, Li Q, Xu B, Lian Y, Miao L. LINC00152: a pivotal oncogenic long non-coding RNA in human cancers. Cell Prolif 2017;50:e12349. [DOI] [PMC free article] [PubMed] [Google Scholar]
- [35].Cai Q, Wang Z, Wang S, et al. Long non-coding RNA LINC00152 promotes gallbladder cancer metastasis and epithelial-mesenchymal transition by regulating HIF-1via miR-138. Open biology 2017;7:160247. [DOI] [PMC free article] [PubMed] [Google Scholar] [Retracted]
- [36].Zhao J, Liu Y, Zhang W, et al. Long non-coding RNA Linc00152 is involved in cell cycle arrest, apoptosis, epithelial to mesenchymal transition, cell migration and invasion in gastric cancer. Cell Cycle (Georgetown, Tex) 2015;14:3112–23. [DOI] [PMC free article] [PubMed] [Google Scholar]
- [37].Yu J, Liu Y, Guo C, et al. Upregulated long non-coding RNA LINC00152 expression is associated with progression and poor prognosis of tongue squamous cell carcinoma. J Cancer 2017;8:523–30. [DOI] [PMC free article] [PubMed] [Google Scholar]
- [38].Van Grembergen O, Bizet M, de Bony EJ, et al. Portraying breast cancers with long noncoding RNAs. Sci Advances 2016;2:e1600220. [DOI] [PMC free article] [PubMed] [Google Scholar]
- [39].Cai Q, Wang ZQ, Wang SH, et al. Upregulation of long non-coding RNA LINC00152 by SP1 contributes to gallbladder cancer cell growth and tumor metastasis via PI3K/AKT pathway. Am J Translat Res 2016;8:4068–81. [PMC free article] [PubMed] [Google Scholar]
- [40].Ling H, Spizzo R, Atlasi Y, et al. CCAT2, a novel noncoding RNA mapping to 8q24, underlies metastatic progression and chromosomal instability in colon cancer. Genome Res 2013;23:1446–61. [DOI] [PMC free article] [PubMed] [Google Scholar]
- [41].Pan Y, Li C, Chen J, et al. The emerging roles of long noncoding RNA ROR (lincRNA-ROR) and its possible mechanisms in human cancers. Cellular Physiol Biochemistry 2016;40:219–29. [DOI] [PubMed] [Google Scholar]
- [42].Li C, Lu L, Feng B, et al. The lincRNA-ROR/miR-145 axis promotes invasion and metastasis in hepatocellular carcinoma via induction of epithelial-mesenchymal transition by targeting ZEB2. Scientific Rep 2017;7:4637. [DOI] [PMC free article] [PubMed] [Google Scholar] [Retracted]
- [43].Xiao H, Zhang F, Zou Y, Li J, Liu Y, Huang W. The function and mechanism of long non-coding RNA-ATB in cancers. Frontiers Physiol 2018;9:321. [DOI] [PMC free article] [PubMed] [Google Scholar]
- [44].Fan YH, Ji CX, Xu B, Fan HY, Cheng ZJ, Zhu XG. Long noncoding RNA activated by TGF-in human cancers: a meta-analysis. Clin Chimica Acta 2017;468:10–6. [DOI] [PubMed] [Google Scholar]
- [45].Wang KC, Yang YW, Liu B, et al. A long noncoding RNA maintains active chromatin to coordinate homeotic gene expression. Nature 2011;472:120–4. [DOI] [PMC free article] [PubMed] [Google Scholar]
- [46].Khaitan D, Dinger ME, Mazar J, et al. The melanoma-upregulated long noncoding RNA SPRY4-IT1 modulates apoptosis and invasion. Cancer Res 2011;71:3852–62. [DOI] [PubMed] [Google Scholar]
- [47].Li Y, Huang X, Zhang J, Li Y, Ma K. Synergistic inhibition of cell migration by tetraspanin CD82 and gangliosides occurs via the EGFR or cMet-activated Pl3K/Akt signalling pathway. Int J Biochem Cell Biol 2013;45:2349–58. [DOI] [PubMed] [Google Scholar]
- [48].Zhang Z, Wang S, Liu W. EMT-related long non-coding RNA in hepatocellular carcinoma: a study with TCGA database. BIOCHEM BIOPH RES CO 2018;503:1530–6. [DOI] [PubMed] [Google Scholar]
Associated Data
This section collects any data citations, data availability statements, or supplementary materials included in this article.