

Abstract
BACKGROUND:
Fabry disease (FD) is an X-linked lysosomal storage disease resulting in tissue accumulation of sphingolipids. Key myocardial processes that lead to adverse outcomes in FD include storage, hypertrophy, inflammation, and fibrosis. These are quantifiable by multiparametric cardiovascular magnetic resonance. Recent developments in cardiovascular magnetic resonance perfusion mapping allow rapid in-line perfusion quantification permitting broader clinical application, including the assessment of microvascular dysfunction. We hypothesized that microvascular dysfunction in FD would be associated with storage, fibrosis, and edema.
METHODS:
A prospective, observational study of 44 FD patients (49 years, 43% male, 24 [55%] with left ventricular hypertrophy [LVH]) and 27 healthy controls with multiparametric cardiovascular magnetic resonance including vasodilator stress perfusion mapping. Myocardial blood flow (MBF) was measured and its associations with other processes investigated.
RESULTS:
Compared with LVH− FD, LVH+ FD had higher left ventricular ejection fraction (73% versus 68%), more late gadolinium enhancement (85% versus 15%), and a lower stress MBF (1.76 versus 2.36 mL/g per minute). The reduction in stress MBF was more pronounced in the subendocardium than subepicardium. LVH− FD had lower stress MBF than controls (2.36 versus 3.00 mL/g per minute; P=0.002). Across all FD, late gadolinium enhancement and low native T1 were independently associated with reduced stress MBF. On a per-segment basis, stress MBF was independently associated with wall thickness, T2, extracellular volume fraction, and late gadolinium enhancement.
CONCLUSIONS:
FD patients have reduced perfusion, particularly in the subendocardium with greater reductions with LVH, storage, edema, and scar. Perfusion is reduced even without LVH suggesting it is an early disease marker.
Keywords: cardiomyopathies, Edema, fibrosis, lysosomal storage diseases
Fabry disease (FD) is an X-linked lysosomal storage disease caused by mutations in the gene encoding the α-GLA (α-galactosidase A) enzyme. This results in the inability to break down sphingolipids and their accumulation in organs including the heart, skin, kidneys, and brain.1 Myocardial deposition of sphingolipids is gradual, taking decades, causing left ventricular (LV) hypertrophy (LVH) and often arrhythmias, heart failure, and death.2,3 Treatment includes oral chaperone therapy (OCT) or intravenous enzyme replacement therapy (ERT) to restore enzymatic activity, reduce sphingolipids, and prevent organ dysfunction.4–6 Multiparametric cardiovascular magnetic resonance (CMR) can characterize several processes within the cardiac FD phenotype development with an initial sphingolipid storage phase, detected as low myocardial T1,7 triggered LVH with focal, and then more widespread inflammation leading to fibrosis.8 Inflammation and fibrosis typically start in the basal inferolateral wall and can be visualized with late gadolinium enhancement (LGE)9,10 with edema detected using T2 mapping and inferred as inflammation and myocyte death by detected troponin release.11 LVH, apparently from triggered hypertrophy is more marked in males and often results pseudonormalization in myocardial T1.8 These following processes: storage, cell response, inflammation, and fibrosis are consistent with other organ involvement in FD. FD also causes endothelial storage and microvascular dysfunction,12,13 but this has not been well characterized in the FD heart.
Noninvasive imaging can quantify tissue perfusion—myocardial blood flow (MBF, mL/g per minute) at rest and during vasodilator stress to detect microvascular dysfunction. Positron emission tomography (PET) has been the gold standard modality14 but is limited by inferior spatial resolution, ionizing radiation use, availability, and does not provide multiparametric detail.15,16 Recently, quantitative perfusion CMR has been developed with perfusion mapping17 where fully automated analysis occurs inline on the scanner using the Gadgetron framework18,19 generating perfusion maps similar to T1 or T2 maps—but where each pixel color represents local flow in milliliters per gram per minute. Initial validation results (eg, against PET and coronary angiography) are good20,21 and intersubject repeatability is similar to the published PET literature..22,23 CMR perfusion mapping, being fast and free from ionizing radiation, has potential in a wide range of circumstances. In hypertrophic cardiomyopathy, microvascular dysfunction is known to occur, increasing with LVH and LGE and may be early, before hypertrophy.24,25 Microvascular dysfunction in hypertrophic cardiomyopathy is linked to adverse outcomes.26 In FD, myocardial perfusion is reported as reduced in PET studies27 and not changed by ERT,28,29 but the studies to date have been small and the relationship of such changes to storage, hypertrophy, inflammation, and scar is unknown.
In this study, we recruited FD patients for multiparametric CMR including vasodilator perfusion mapping for microvascular dysfunction. We hypothesized that microvascular dysfunction is an early marker in FD and would be associated with storage, fibrosis, and edema.
METHODS
The data that support the findings of this study are available from the corresponding author on reasonable request. The study was approved by the National Health Service Research Ethics Committee and Health Research Authority and conducted in accordance with the Declaration of Helsinki. All subjects provided written, informed consent. Forty-four patients with FD and a healthy control cohort (27 subjects) were recruited. All subjects underwent multiparametric CMR. FD exclusion criteria were aged <18 years, ischemic heart disease, severe chronic kidney disease (estimated glomerular filtration rate <30 mmol/L), contraindication to magnetic resonance imaging or adenosine. Patient cardiovascular history, symptoms, and ERT status were assessed at the time of the CMR with a questionnaire. The healthy control cohort were volunteers who had no cardiac symptoms, medications, or comorbidities.
CMR Scans
CMR scans were performed at 1.5 Tesla (Aera, Siemens Healthcare, Erlangen, Germany) using a standard clinical protocol.30 The protocol consisted of cine imaging, native T1 mapping (using a modified look-locker inversion recovery sequence), T2 mapping, stress and rest perfusion, late gadolinium enhancement (LGE), and postcontrast T1 mapping. Synthetic extracellular volume fraction (ECV) was derived from the native and postcontrast T1 maps.31 T1, T2, and ECV mapping were performed for basal, mid, and apical short axis and 3 long axis slices.
Vasodilator stress perfusion was performed using a standard clinical approach. Adenosine (140 μg/kg per minute, increased to 175 μg/kg per minute for a further 2 minutes if <10% heart rate increase or no symptoms) was infused.30,32 A gadolinium-based contrast agent (gadoterate meglumine, Dotarem; Guerbet, Paris, France) was injected into a peripheral vein at 4 mL/s during peak vasodilator stress at a dose of 0.05 mmoL/kg. Sixty images were acquired for basal, mid, and apical LV short-axis slices. It was retrospectively confirmed that splenic switch off was achieved, indicating adequate stress.33 Rest perfusion images were acquired subsequently after an interval of 6 to 10 minutes. Perfusion mapping implemented using the Gadgetron streaming software image reconstruction framework is previously described.17,18
CMR Analysis
CMR was analyzed using commercially available software (CVI42; Circle Cardiovascular Imaging, Calgary, AB, Canada). For parametric map analysis, endo- and epicardial contours were manually drawn and the right ventricular insertion points identified. The borders were offset by 10% and a 16 segment American Heart Association model34 created for each parameter (eg, T1, T2, stress, and rest MBF, ECV), along with a global mean value (mean across all segments). In addition, to measure possible transmural gradients, stress MBF was split into endocardial and epicardial MBF by adjusting the offsets to 50% of the myocardium. Normal ranges for T1 and T2 are sequence and scanner dependent. Normal ranges at our center have been established in accordance with the current Society for Cardiovascular Magnetic Resonance consensus statement.35
LV volume analysis was performed by contouring each short axis slice in diastole and systole. Papillary muscles were excluded from the LV volume and included as LV mass. The maximal diastolic wall thickness was measured. LVH was defined as a maximum wall thickness >12 mm, as measured by CMR.36
LGE was assessed for each myocardial segment. A region of interest was manually drawn in visually normal myocardium and LGE identified automatically for pixels 5 SDs above the mean signal intensity of the normal myocardium.37 The presence or absence of LGE was then noted for each segment and globally.
Statistical Analysis
Statistical analysis was performed in SPSS (IBM SPSS statistics, Version 25.0). Continuous variables are presented as mean±SD; categorical as absolute values and percentages. Patients were divided into those with and without LVH and analyzed compared with volunteers using ANOVA or Kruskal-Wallis for parametric and nonparametric variables, respectively, and χ2 for categorical variables. Pairwise comparisons between groups were performed using Bonferroni adjustment. A P of <0.05 and was considered significant.
A simple linear regression analysis was performed to determine the factors that contribute to stress MBF. Subsequently, the variables that were significantly associated were used in a multiple linearregression analysis. The analysis was performed on a per patient basis, inputting the age, sex, treatment status, indexed EDV, indexed LV mass, left ventricular ejection fraction, mean T1, T2, ECV, the presence of LGE and LVH. An analysis was also performed on a per segment basis. In this analysis, the effect of each CMR variable on stress MBF was considered on an American Heart Association segment basis. Wall thickness, native T1, T2, ECV, and percentage of LGE were treated as continuous variables. A mixed effects linear regression controlled for subject dependency.
RESULTS
Forty-four patients (19 males; 43%), mean age 49 years were recruited. A total of 30 patients (44%) were on treatment (ERT or OCT [9 patients]). Twenty-four patients (55%) had LVH, and 23 patients (52%) were positive for LGE. Compared with controls, patients had higher indexed LV mass (90.6 versus 52.3 g/m2; P<0.001), ejection fraction (70% versus 65%; P=0.007), lower septal T1 (959 versus 1015 ms; P<0.001), and higher septal T2 (49.3 versus 47.5 ms; P=0.025; Table 1). The control cohort (n=27) were age matched to the FD patients who did not have LVH (38.1 versus 42.3 years; P=0.264). Patients with LVH were older than those without LVH (54.6 versus 42.3 years; P=0.006) and a greater proportion were male (62.5% versus 20%; P=0.003). They had a higher ejection fraction (72.8% versus 66.7%; P=0.03) and a higher LV mass (117.4 versus 58.43 g/m2; P<0.001) than patients without LVH (Table 2). Compared with controls, a greater proportion of LVH-negative patients were females but no other significant differences (Table 2). Of the LVH-negative patients, 7 (35%) had low septal T1 (based on 1 septal segment classification). The cardiac phenotype of patients on ERT was more advanced than those on no therapy, with higher LV mass (115 versus 60 g/m2), lower T1 (933 versus 1000 ms), and a higher proportion of LGE (77% versus 21%). The OCT group was a mixture of patients who had previously been on long-term ERT (all patients on ERT had been receiving therapy for >1 year) and new-starters, with the shortest duration of therapy 6 months (the drug has only been recently introduced). Their cardiac phenotype was intermediate between ERT and no therapy patients: LV mass, 77 g/m2; T1, 959 ms; LGE, 38%.
Table 1.
Characteristics of Patients with FD and Controls
| Fabry Disease | Controls | P-Value | |
|---|---|---|---|
| n=44 | n=27 | ||
| Age, y | 49.0±13.5 | 38.1±11.8 | 0.001 |
| Male, n (%) | 19 (43.2) | 14 (51.8) | 0.484 |
| Height, cm | 170.3±10.5 | 173.2±10.3 | 0.265 |
| Weight, kg | 72.2±13.1 | 77.2±14.7 | 0.137 |
| BSA | 1.8±0.20 | 1.9±0.21 | 0.061 |
| ERT/OCT, n (%) | 30 (68.2) | 0 (0) | <0.001 |
| LVEDVi, mL/m2 | 81.9±18.9 | 78.1±14.3 | 0.367 |
| LVESVi, mL/m2 | 26.0±12.5 | 26.8±6.3 | 0.757 |
| LVEF (%) | 70.1±9.6 | 65.5±4.2 | 0.007 |
| LV mass indexed, g/m2 | 90.6±41.0 | 52.3±9.3 | <0.001 |
| LVH, n (%) | 24 (54.5) | 0 (0) | <0.001 |
| LGE, n (%) | 23 (52.3) | 0 (0) | <0.001 |
| Septal T1, ms | 959.1±60.6 | 1015.2±32.0 | <0.001 |
| Septal T2, ms | 49.3±3.3 | 47.5±2.4 | 0.024 |
| Septal ECV (%) | 25.7±2.4 | 24.3±2.6 | 0.025 |
| Stress MBF, mL/g per min | 2.04±0.56 | 3.00±0.76 | <0.001 |
| Rest MBF, mL/g per min | 0.85±0.26 | 0.86±0.26 | 0.848 |
Characteristics of FD patients and controls. Data are presented as mean±SD unless stated. BSA indicates body surface area; ECV, extracellular volume fraction; ERT, enzyme replacement therapy; FD, Fabry disease; LGE, late gadolinium enhancement; LV, left ventricular; LVEDVi, left ventricular end diastolic volume indexed for BSA; LVEF, left ventricular ejection fraction; LVESVi, left ventricular end systolic volume indexed for BSA; LVH, left ventricular hypertrophy; MBF, myocardial blood flow; and OCT, oral chaperone therapy.
Table 2.
A Comparison Between FD Patients With and Without Left Ventricular Hypertrophy and Controls
| FD LVH± | FD LVH− | Controls | P Value for trend | |
|---|---|---|---|---|
| (n=24) | (n=20) | (n=27) | ||
| Age, y | 54.6±10.9*,† | 42.3±13.4 | 38.1±11.8 | <0.001 |
| Male, n (%) | 15 (62.5)* | 4 (20) | 14 (51.8) | 0.015 |
| BSA | 1.85±0.21 | 1.83±0.19 | 1.93±0.21 | 0.166 |
| ERT/OCT, n (%) | 23 (96)* | 7 (35) | N/A | <0.001 |
| LVEDVi, mL/m2 | 83.1±24.0 | 80.3±10.3 | 78.1±14.3 | 0.380 |
| LVESVi, mL/m2 | 25.7±15.4 | 26.4±8.1 | 26.8±6.3 | 0.201 |
| LVEF (%) | 72.8±9.5*,† | 66.7±8.8 | 65.5±4.2 | 0.001 |
| LV mass indexed, g/m2 | 117.4±37.2*,† | 58.4±11.3 | 52.3±9.3 | <0.001 |
| LGE, n (%) | 20 (83.3)* | 3 (15) | 0 | <0.001 |
| Septal T1, ms | 936.5±60.7† | 985.0±50.1 | 1015.2±32.0 | <0.001 |
| Septal T2, ms | 50.4±3.8† | 47.8±1.7 | 47.5±2.4 | 0.009 |
| Septal ECV (%) | 25.9±2.6 | 25.5±2.1 | 24.3±2.6 | 0.072 |
| Stress MBF, mL/g per min | 1.76±0.49*,† | 2.36±0.44 | 3.00±0.76* | <0.001 |
| Rest MBF, mL/g per min | 0.77±0.16 | 0.93±0.33 | 0.86±0.26 | 0.188 |
The FD patients are split into those with left ventricular hypertrophy (LVH+) and those without (LVH-). Data are presented as mean ± SD unless stated. The P Value for trend is calculated using ANOVA or Kruskal-Wallis for parametric and nonparametric variables, respectively, and χ2 for categorical variables. Pairwise comparisons between groups performed using Bonferroni adjustment. BSA indicates body surface area; ECV, extracellular volume fraction; ERT, enzyme replacement therapy; FD, Fabry disease; LGE, late gadolinium enhancement; LV, left ventricle; LVEDVi, left ventricular end diastolic volume indexed for BSA; LVEF, left ventricular ejection fraction; LVESVi, left ventricular end systolic volume indexed for BSA; LVH, left ventricular hypertrophy; MBF, myocardial blood flow; and OCT, oral chaperone therapy.
P<0.05 vs FD LVH−.
P<0.05 vs controls.
Cardiovascular risk factors were similar between LVH-positive and -negative patients with only atrial fibrillation being statistically higher in the LVH-positive group 5 (21%) versus 0 patients (0%); P=0.02. Hypertension was present in 4 (17%) versus 3 patients (15%), P=0.88; hyperlipidemia 4 (17%) versus 1 patient (5%), P=0.21; renal impairment 3 (13%) versus 1 patient (5%), P=0.40; stroke 1 (4%) versus 2 patients (10%), P=0.46 for LVH-positive and LVH-negative patients, respectively. Similarly, a minority of patients had symptoms. The most common was palpitations, which was present in 8 (33%) LVH-positive and 4 (20%) LVH-negative patients. Six (25%) of the LVH-positive patients and 1 (5%) of the LVH negative patients complained of breathlessness. Four (17%) LVH-positive patients and 2 (10%) LVH-negative patients complained of chest pain. The majority of patients were New York Heart Association functional class I (30/44, 68%), 12 patients were class II (27%), and 2 (5%) patients had mobility limited by musculoskeletal problems.
Global stress MBF was lower in FD than controls (2.04 versus 3.00 mL/g per minute; P<0.001), but there was no difference in rest MBF (0.85 versus 0.86; P=0.85). Stress MBF was lower when there was LVH (1.76 versus 2.36 mL/g per minute; P=0.005), but stress MBF was also lower in LVH-negative FD compared with controls (2.36 versus 3.00 mL/g per minute; P=0.002; Figures 1 and 2). It is possible that chest pain and breathlessness may have been symptoms of microvascular dysfunction, and these patients had a lower stress MBF than those with no symptoms (1.68 versus 2.11 mL/g per minute; P=0.039).
Figure 1. Multiparametric cardiovascular magnetic resonance assessment in patients with Fabry disease (FD) and controls.

Left to right—steady-state free precession cines, native T1 maps, T2 maps, stress myocardial blood flow (MBF) maps, late gadolinium enhancement (LGE). A, Healthy control—no left ventricular hypertrophy (LVH), normal T1, normal T2, normal stress MBF, no LGE. B, FD, no LVH, low T1 (sphingolipid storage), normal T2, no LGE. C, FD patient with severe LVH, storage (some pseudonormalization of T1 in LGE areas), high T2 in LGE areas, and extensive LGE. MBF falls with increasing disease severity, particularly in the endocardium.
Figure 2. Box and whisker plots demonstrating stress myocardial blood flow (MBF) in Fabry disease (FD) and controls.
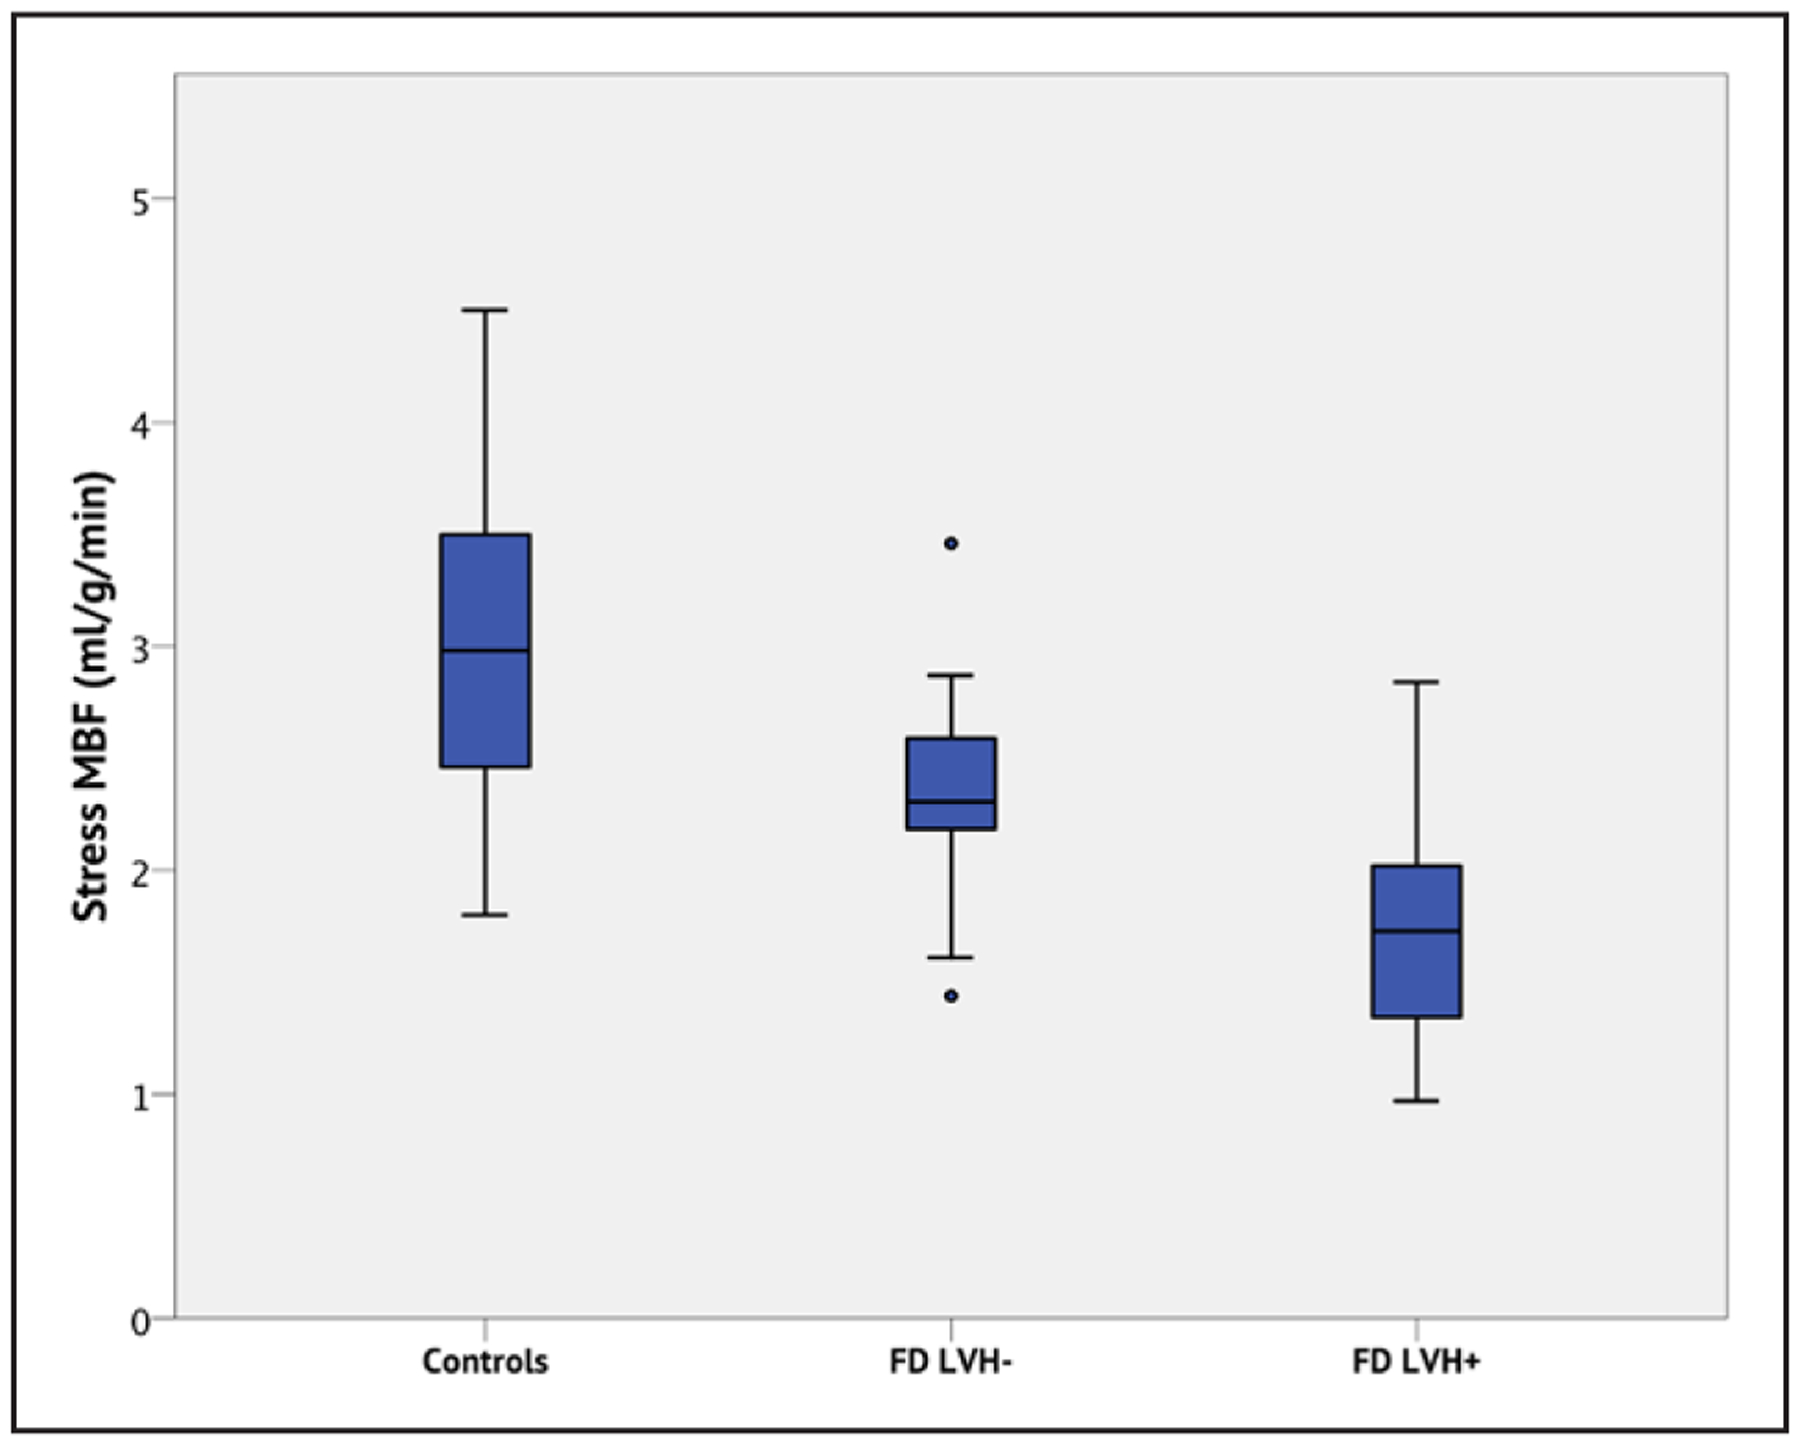
Each box displays the median and interquartile ranges (IQR) for MBF. The whiskers represent 1.5× the IQR. Outliers (>1.5× the IQR) are indicated by the circles. Controls have higher MBF than FD patients, even without left ventricular hypertrophy (LVH; P=0.002), and FD patients with LVH have lower stress MBF than FD LVH− (P=0.005) and controls (P<0.001).
Stress MBF in FD was lower in the endocardium than epicardium (1.84 versus 2.13 mL/g per minute; P=0.022) but not in controls (3.10 versus 2.85 mL/g per minute; P=0.271). However, this was only significant in patients with LVH (1.88 versus 1.50 mL/g per minute; P=0.013); in LVH-negative patients, epicardial and endocardial stress MBF was not significantly different (2.44 versus 2.25 mL/g per minute; P=0.2078; Figure 3).
Figure 3. Endocardial (orange) and epicardial (blue) stress myocardial blood flow (MBF) in Fabry disease (FD) and controls.

Each box displays the median and interquartile ranges (IQR) for MBF. The whiskers represent 1.5× the IQR. Outliers (>1.5× the IQR) are indicated by the circles. There is an epicardial to endocardial perfusion gradient in FD patients with left ventricular hypertrophy (LVH+; P=0.013). There is no significant gradient in healthy controls (P=0.271) or FD patients without LVH (LVH−; P=0.208).
To predict FD global stress MBF, a simple linear regression analysis was performed including age, sex, ERT/OCT treatment, indexed EDV, ejection fraction, indexed LV mass, presence of LGE, LVH (yes/no), T1, T2, and ECV. Of these, age, T1, T2, ECV, LGE, and LVH were significantly associated and used for the multivariate model. In this, independently associated variables were (order of association strength) the presence of LGE and low T1 (R2 for the model 0.572; P<0.001; Table 3).
Table 3.
Multiple Linear Regression Model for the Dependent Variable Global Stress MBF
| β | SE | 95% CI Lower Bound | 95% CI Upper Bound | P Value | |
|---|---|---|---|---|---|
| Constant | 1.239 | 1.458 | −1.731 | 4.210 | 0.402 |
| Age, y | −0.009 | 0.007 | −0.022 | 0.005 | 0.190 |
| LVH | 0.089 | 0.205 | −0.986 | 0.105 | 0.668 |
| T1 | 0.003 | 0.001 | 0.000 | 0.006 | 0.040 |
| T2 | −0.013 | 0.025 | −0.066 | 0.028 | 0.426 |
| LGE | −0.546 | 0.220 | −0.986 | −0.105 | 0.017 |
| ECV | −0.031 | 0.029 | −0.081 | 0.033 | 0.394 |
Global stress MBF was independently influenced by a low T1 time and the presence of LGE. Age, T1, T2, and ECV were continuous variables; LGE was a categorical variable. R2 0.572 for the model. P<0.001. ECV indicates extracellular volume fraction; LGE, late gadolinium enhancement; LVH, left ventricular hypertrophy; and MBF, myocardial blood flow.
To predict FD segmental stress MBF (including 704 segments), a multivariate model included wall thickness, native T1, T2, ECV, and LGE, controlling for within subject dependency. The thickest myocardium was associated with the lowest stress MBF (Figure 4). In addition, high T2, high ECV, and the presence of LGE were independently associated with a lower myocardial stress MBF (Table 4).
Figure 4. Box and whisker plots demonstrating stress myocardial blood flow (MBF) in each myocardial segment compared with wall thickness.

Each box displays the median and interquartile ranges (IQR) for MBF. The whiskers represent 1.5× the IQR. Outliers 1.5× to 3× the IQR are indicated by the circles and >3× IQR by the star. As wall thickness increases, the stress MBF falls (P<0.001).
Table 4.
Mixed Effects Linear Regression Model, Controlling for Within Subject Dependency, for the Dependent Variable Segmental Stress MBF
| β | SE | 95% CI Lower Bound | 95% CI Upper Bound | P Value | |
|---|---|---|---|---|---|
| Intercept | 2.630 | 0.526 | 1.597 | 3.662 | <0.001 |
| Wall thickness | −0.031 | 0.006 | −0.043 | −0.020 | <0.001 |
| T1 | −0.000 | 0.000 | −0.001 | 0.001 | 0.662 |
| T2 | −0.013 | 0.005 | −0.023 | −0.003 | 0.009 |
| ECV | 0.021 | 0.005 | 0.010 | 0.031 | <0.001 |
| LGE | −0.005 | 0.002 | −0.043 | −0.020 | 0.002 |
Wall thickness, native T1, T2, ECV, and percentage LGE per segment were treated as continuous variables. Wall thickness, T2, ECV, and LGE were independently associated with stress MBF. ECV indicates extracellular volume fraction; LGE, late gadolinium enhancement; and MBF, myocardial blood flow.
DISCUSSION
These data show that patients with Fabry disease have lower stress MBF than healthy controls even in those patients without LVH. Perfusion appears to track disease severity with LVH, inflammation (elevated T2), and scar (elevated ECV and LGE) being associated with reduced segmental MBF (Figure 1).
While there have been a few small studies to date that have used quantitative PET to measure MBF in patients with FD, this is the first in which CMR has been used to quantify perfusion in the context of a multiparametric assessment. Furthermore, this is the largest study of perfusion in FD across all modalities and for the first time includes LVH-negative patients with an age-matched control group. Our results support the PET findings that found reduced stress perfusion in FD.28,29 These studies also sought treatment effect, and although 1 study was negative, the other found a correlation between pretreatment relative wall thickness and posttreatment changes in flow reserve, hypothesizing that patients treated early may gain more benefit from ERT. Such findings could be explored in greater detail using multiparametric CMR as it enables quantification of LVH, storage, inflammation, and fibrosis in addition, now, to perfusion.7,9,11
The findings of our study suggest that this reduction in stress MBF occurs early in the FD disease course and is related to features of myocardial disease severity. This early reduction in stress MBF is interesting. The current study did not have the statistical power to detect if it was associated with myocardial storage before LVH—further work will be needed. It is, however, possible that abnormalities in microvascular perfusion, if related to endothelial storage and dysfunction, could precede myocyte storage and be the earliest sign of myocardial involvement in FD. Another explanation could be that our detection of myocardial storage with low T1 has a threshold effect whereby a certain amount of storage needs to occur before T1 lowers, but our imaging is more sensitive to detect MBF abnormalities. Such dysfunction may also contribute to FD patient symptoms that are hard to pin down, such as fatigue and reduced cardiopulmonary exercise test performance. Endothelial cells may be more amenable or faster to de-sphingation (clearance of sphingolipids) than myocytes (a scenario familiar in the kidney with podocytes38) so the investigation of ERT effect in preLVH disease would be particularly interesting mechanistically. This in turn could be a useful surrogate end point in drug studies and may provide insights into drivers of hypertrophy and basal lateral inflammation/scar.
Structural changes in the myocardial microvasculature have been explored using biopsy. Chimenti et al39 compared endomyocardial biopsies of 13 FD patients with angina to a control cohort of FD patients with no chest pain. Although the endothelial cells were swollen and proliferating because of storage, arteriolar luminal narrowing was also because of hypertrophy and hyperplasia of the smooth muscle cells and increased fibrosis within the intimal and medial layers. In addition, this pattern was more often associated with perivascular myocardial fibrosis surrounding the most affected vessels. There was less luminal narrowing in those patients without angina. The results of our study are consistent with such processes. We have shown noninvasively that myocardial segments with increased hypertrophy, sphingolipid deposition (low T1), and fibrosis (high ECV and LGE) have the lowest myocardial perfusion. There is currently no treatment proven to be effective in microvascular dysfunction in either Fabry disease or hypertrophic cardiomyopathy. With the use of perfusion mapping, it would now be possible to assess the efficacy of ERT/OCT on improving the microvasculature. In another model of LVH—hypertension, there is the suggestion that the combination of angiotensin-converting enzyme inhibitors and thiazide diuretics improves microvascular function, and this has been shown in hypertensive rat models and small human studies40,41
CMR has another advantage over PET with the resolution to better discriminate transmyocardial perfusion gradients. Here, FD impairment in perfusion was more pronounced in the subendocardium. It has been shown in healthy animal models that vasodilatory flow in the subendocardium is relatively reduced compared with the subepicardium, and this is more pronounced in heart failure models because of chronic subendocardial fibrosis.42 It is, therefore, plausible that a chronic fibrosis that preferentially affects the subendocardium is responsible for the more pronounced perfusion abnormalities in FD patients with LVH, and this would fit with the described histological findings.
Limitations
This is a single time-point observational study with inherent limitations. While the perfusion abnormalities detected likely reflect microvascular dysfunction, other explanations such as a specific impaired response to adenosine cannot be ruled out. In addition, without biopsy, we make assumptions that the CMR tissue characterization from these patients reflects storage, edema, and fibrosis. This is, however, consistent with previous studies.
Conclusions
CMR perfusion mapping permits the detection of impaired myocardial perfusion in FD patients compared with healthy controls, even before the onset of LVH. Global perfusion impairment is associated with storage and LGE, with regional impairment associated also with T2 and LVH. Microvascular dysfunction is clearly an early disease marker and may be a useful parameter to distinguish the relative contribution of storage in vascular cells, particularly endothelium versus myocytes. Perfusion mapping readily allows the quantification of MBF in Fabry disease patients in a way that can be readily integrated within the clinical workflow and may be useful as a marker in clinical studies.
CLINICAL PERSPECTIVE.
Fabry disease is a slowly progressive multisystem storage disease. Progressive cardiac involvement is the primary cause of premature death. Therapy is available but expensive. Myocardial phenotype development and pathways is not well understood, and the impact of treatment and the timing of initiation is uncertain. Recently, cardiovascular magnetic resonance has begun to unravel phenotype development because, as well as hypertrophy and fibrosis (using late gadolinium enhancement), storage can now be measured (using T1 mapping) and edema/inflammation (using T2 mapping). Microvascular dysfunction is also thought to play a role. Cardiovascular magnetic resonance perfusion mapping can now quantify this—both concurrently with the other assessments and without using ionizing radiation, more easily permitting the assessment of early disease.
We performed multiparametric cardiovascular magnetic resonance in Fabry disease including perfusion mapping. Compared with healthy volunteers, patients with Fabry disease had reduced stress myocardial blood flow. This occurred even before hypertrophy. It was most marked subendocardially, was worse when there was storage and, regionally, where there was fibrosis. This implies that microvascular dysfunction is an early disease feature and could contribute to the progression from storage to fibrosis (and hence heart failure and arrhythmia). Because it may relate to endothelial rather than myocyte storage, it may be more readily treatable and is a candidate surrogate end point in therapeutic trials of enzyme and novel therapies.
Acknowledgments
This research received support directly and indirectly from the Biomedical Research Centre at University College London and Barts Heart Centre.
Sources of Funding
This study was supported by a Clinical Training Research Fellowship (Dr Knott) from the British Heart Foundation. This study is part of the Fabry400 study, which is funded by an investigator-led research grant from Genzyme.
Footnotes
Disclosures
None.
REFERENCES
- 1.Zarate YA, Hopkin RJ. Fabry’s disease. Lancet. 2008;372:1427–1435. doi: 10.1016/S0140-6736(08)61589-5 [DOI] [PubMed] [Google Scholar]
- 2.Eng CM, Fletcher J, Wilcox WR, Waldek S, Scott CR, Sillence DO, Breunig F, Charrow J, Germain DP, Nicholls K, Banikazemi M. Fabry disease: baseline medical characteristics of a cohort of 1765 males and females in the Fabry Registry. J Inherit Metab Dis. 2007;30:184–192. doi: 10.1007/s10545-007-0521-2 [DOI] [PubMed] [Google Scholar]
- 3.Waldek S, Patel MR, Banikazemi M, Lemay R, Lee P. Life expectancy and cause of death in males and females with Fabry disease: findings from the Fabry Registry. Genet Med. 2009;11:790–796. doi: 10.1097/GIM.0b013e3181bb05bb [DOI] [PubMed] [Google Scholar]
- 4.Thurberg BL, Randolph Byers H, Granter SR, Phelps RG, Gordon RE, O’Callaghan M. Monitoring the 3-year efficacy of enzyme replacement therapy in fabry disease by repeated skin biopsies. J Invest Dermatol. 2004;122:900–908. doi: 10.1111/j.0022-202X.2004.22425.x [DOI] [PubMed] [Google Scholar]
- 5.Thurberg BL, Rennke H, Colvin RB, Dikman S, Gordon RE, Collins AB, Desnick RJ, O’Callaghan M. Globotriaosylceramide accumulation in the Fabry kidney is cleared from multiple cell types after enzyme replacement therapy. Kidney Int. 2002;62:1933–1946. doi: 10.1046/j.1523-1755.2002.00675.x [DOI] [PubMed] [Google Scholar]
- 6.Hughes DA, Nicholls K, Shankar SP, Sunder-Plassmann G, Koeller D, Nedd K, Vockley G, Hamazaki T, Lachmann R, Ohashi T, Olivotto I, Sakai N, Deegan P, Dimmock D, Eyskens F, Germain DP, Goker-Alpan O, Hachulla E, Jovanovic A, Lourenco CM, Narita I, Thomas M, Wilcox WR, Bichet DG, Schiffmann R, Ludington E, Viereck C, Kirk J, Yu J, Johnson F, Boudes P, Benjamin ER, Lockhart DJ, Barlow C, Skuban N, Castelli JP, Barth J, Feldt-Rasmussen U. Oral pharmacological chaperone migalastat compared with enzyme replacement therapy in Fabry disease: 18-month results from the randomised phase III ATTRACT study. J Med Genet. 2017;54:288–296. doi: 10.1136/jmedgenet-2016-104178 [DOI] [PMC free article] [PubMed] [Google Scholar]
- 7.Sado DM, White SK, Piechnik SK, Banypersad SM, Treibel T, Captur G, Fontana M, Maestrini V, Flett AS, Robson MD, Lachmann RH, Murphy E, Mehta A, Hughes D, Neubauer S, Elliott PM, Moon JC. Identification and assessment of Anderson-Fabry disease by cardiovascular magnetic resonance noncontrast myocardial T1 mapping. Circ Cardiovasc Imaging. 2013;6:392–398. doi: 10.1161/CIRCIMAGING.112.000070 [DOI] [PubMed] [Google Scholar]
- 8.Nordin S, Kozor R, Medina-Menacho K, Abdel-Gadir A, Baig S, Sado DM, Lobascio I, Murphy E, Lachmann RH, Mehta A, Edwards NC, Ramaswami U, Steeds RP, Hughes D, Moon JC. Proposed stages of myocardial phenotype development in fabry disease [published online May 16, 2018]. JACC Cardiovasc Imaging. doi: 10.1016/j.jcmg.2018.03.020. https://www.sciencedirect.com/science/article/pii/S1936878X18303073?via%3Dihub [DOI] [PubMed] [Google Scholar]
- 9.Moon JC, Sachdev B, Elkington AG, McKenna WJ, Mehta A, Pennell DJ, Leed PJ, Elliott PM. Gadolinium enhanced cardiovascular magnetic resonance in Anderson-Fabry disease. Evidence for a disease specific abnormality of the myocardial interstitium. Eur Heart J. 2003;24:2151–2155. doi: 10.1016/j.ehj.2003.09.017 [DOI] [PubMed] [Google Scholar]
- 10.Moon JC, Sheppard M, Reed E, Lee P, Elliott PM, Pennell DJ. The histological basis of late gadolinium enhancement cardiovascular magnetic resonance in a patient with Anderson-Fabry disease. J Cardiovasc Magn Reson. 2006;8:479–482. DOI: 10.1080/10976640600605002 [DOI] [PubMed] [Google Scholar]
- 11.Nordin S, Kozor R, Bulluck H, Castelletti S, Rosmini S, Abdel-Gadir A, Baig S, Mehta A, Hughes D, Moon JC. Cardiac fabry disease with late gadolinium enhancement is a chronic inflammatory cardiomyopathy. J Am Coll Cardiol. 2016;68:1707–1708. doi: 10.1016/j.jacc.2016.07.741 [DOI] [PubMed] [Google Scholar]
- 12.Oliveira JP. Staging of Fabry disease using renal biopsies. Clin Ther. 2007;29(suppl A):S15–S16. [DOI] [PubMed] [Google Scholar]
- 13.Namdar M, Gebhard C, Studiger R, Shi Y, Mocharla P, Schmied C, Brugada P, Lüscher TF, Camici GG. Globotriaosylsphingosine accumulation and not alpha-galactosidase-A deficiency causes endothelial dysfunction in Fabry disease. PLoS One. 2012;7:e36373. doi: 10.1371/journal.pone.0036373 [DOI] [PMC free article] [PubMed] [Google Scholar]
- 14.Bergmann SR, Fox KA, Rand AL, McElvany KD, Welch MJ, Markham J, Sobel BE. Quantification of regional myocardial blood flow in vivo with H215O. Circulation. 1984;70:724–733. [DOI] [PubMed] [Google Scholar]
- 15.Einstein AJ. Radiation risk from coronary artery disease imaging: how do different diagnostic tests compare? Heart. 2008;94:1519–1521. doi: 10.1136/hrt.2007.135731 [DOI] [PubMed] [Google Scholar]
- 16.Bruder O, Wagner A, Lombardi M, Schwitter J, van Rossum A, Pilz G, Nothnagel D, Steen H, Petersen S, Nagel E, Prasad S, Schumm J, Greulich S, Cagnolo A, Monney P, Deluigi CC, Dill T, Frank H, Sabin G, Schneider S, Mahrholdt H. European cardiovascular magnetic resonance (EuroCMR) registry–multi national results from 57 centers in 15 countries. J Cardiovasc Magn Reson. 2013;15:9. doi: 10.1186/1532-429X-15-9 [DOI] [PMC free article] [PubMed] [Google Scholar]
- 17.Kellman P, Hansen MS, Nielles-Vallespin S, Nickander J, Themudo R, Ugander M, Xue H. Myocardial perfusion cardiovascular magnetic resonance: optimized dual sequence and reconstruction for quantification. J Cardiovasc Magn Reson. 2017;19:43. doi: 10.1186/s12968-017-0355-5 [DOI] [PMC free article] [PubMed] [Google Scholar]
- 18.Hansen MS, Sørensen TS. Gadgetron: an open source framework for medical image reconstruction. Magn Reson Med. 2013;69:1768–1776. doi: 10.1002/mrm.24389 [DOI] [PubMed] [Google Scholar]
- 19.Xue H, Inati S, Sørensen TS, Kellman P, Hansen MS. Distributed MRI reconstruction using Gadgetron-based cloud computing. Magn Reson Med. 2015;73:1015–1025. doi: 10.1002/mrm.25213 [DOI] [PMC free article] [PubMed] [Google Scholar]
- 20.Engblom H, Xue H, Akil S, Carlsson M, Hindorf C, Oddstig J, Hedeer F, Hansen MS, Aletras AH, Kellman P, Arheden H. Fully quantitative cardiovascular magnetic resonance myocardial perfusion ready for clinical use: a comparison between cardiovascular magnetic resonance imaging and positron emission tomography. J Cardiovasc Magn Reson. 2017;19:78. doi: 10.1186/s12968-017-0388-9 [DOI] [PMC free article] [PubMed] [Google Scholar]
- 21.Knott KD, Camaioni C, Ramasamy A, Augusto JA, Bhuva AN, Xue H, Manisty C, Hughes RK, Brown LAE, Amersey R, Bourantas C, Kellman P, Plein S, Moon JC. Quantitative myocardial perfusion in coronary artery disease: a perfusion mapping study [published online January 25, 2019]. J Magn Reson Imaging. doi: 10.1002/jmri.26668. https://onlinelibrary.wiley.com/doi/full/10.1002/jmri.26668 [DOI] [PMC free article] [PubMed] [Google Scholar]
- 22.Brown LAE, Onciul SC, Broadbent DA, Johnson K, Fent GJ, Foley JRJ, Garg P, Chew PG, Knott K, Dall’Armellina E, Swoboda PP, Xue H, Greenwood JP, Moon JC, Kellman P, Plein S. Fully automated, inline quantification of myocardial blood flow with cardiovascular magnetic resonance: repeatability of measurements in healthy subjects. J Cardiovasc Magn Reson. 2018;20:48. doi: 10.1186/s12968-018-0462-y [DOI] [PMC free article] [PubMed] [Google Scholar]
- 23.Kitkungvan D, Johnson NP, Roby AE, Patel MB, Kirkeeide R, Gould KL. Routine clinical quantitative rest stress myocardial perfusion for managing coronary artery disease: clinical relevance of test-retest variability. JACC Cardiovasc Imaging. 2017;10:565–577. doi: 10.1016/j.jcmg.2016.09.019 [DOI] [PubMed] [Google Scholar]
- 24.Petersen SE, Jerosch-Herold M, Hudsmith LE, Robson MD, Francis JM, Doll HA, Selvanayagam JB, Neubauer S, Watkins H. Evidence for microvascular dysfunction in hypertrophic cardiomyopathy: new insights from multiparametric magnetic resonance imaging. Circulation. 2007;115:2418–2425. doi: 10.1161/CIRCULATIONAHA.106.657023 [DOI] [PubMed] [Google Scholar]
- 25.Camici P, Chiriatti G, Lorenzoni R, Bellina RC, Gistri R, Italiani G, Parodi O, Salvadori PA, Nista N, Papi L. Coronary vasodilation is impaired in both hypertrophied and nonhypertrophied myocardium of patients with hypertrophic cardiomyopathy: a study with nitrogen-13 ammonia and positron emission tomography. J Am Coll Cardiol. 1991;17:879–886. [DOI] [PubMed] [Google Scholar]
- 26.Cecchi F, Olivotto I, Gistri R, Lorenzoni R, Chiriatti G, Camici PG. Coronary microvascular dysfunction and prognosis in hypertrophic cardiomyopathy. N Engl J Med. 2003;349:1027–1035. doi: 10.1056/NEJMoa025050 [DOI] [PubMed] [Google Scholar]
- 27.Tomberli B, Cecchi F, Sciagrà R, Berti V, Lisi F, Torricelli F, Morrone A, Castelli G, Yacoub MH, Olivotto I. Coronary microvascular dysfunction is an early feature of cardiac involvement in patients with Anderson-Fabry disease. Eur J Heart Fail. 2013;15:1363–1373. doi: 10.1093/eurjhf/hft104 [DOI] [PubMed] [Google Scholar]
- 28.Elliott PM, Kindler H, Shah JS, Sachdev B, Rimoldi OE, Thaman R, Tome MT, McKenna WJ, Lee P, Camici PG. Coronary microvascular dysfunction in male patients with Anderson-Fabry disease and the effect of treatment with alpha galactosidase A. Heart. 2006;92:357–360. doi: 10.1136/hrt.2004.054015 [DOI] [PMC free article] [PubMed] [Google Scholar]
- 29.Kalliokoski RJ, Kantola I, Kalliokoski KK, Engblom E, Sundell J, Hannukainen JC, Janatuinen T, Raitakari OT, Knuuti J, Penttinen M, Viikari J, Nuutila P. The effect of 12-month enzyme replacement therapy on myocardial perfusion in patients with Fabry disease. J Inherit Metab Dis. 2006;29:112–118. doi: 10.1007/s10545-006-0221-3 [DOI] [PubMed] [Google Scholar]
- 30.Kramer CM, Barkhausen J, Flamm SD, Kim RJ, Nagel E; Society for Cardiovascular Magnetic Resonance Board of Trustees Task Force on Standardized Protocols. Standardized cardiovascular magnetic resonance (CMR) protocols 2013 update. J Cardiovasc Magn Reson. 2013;15:91. doi: 10.1186/1532-429X-15-91 [DOI] [PMC free article] [PubMed] [Google Scholar]
- 31.Treibel TA, Fontana M, Maestrini V, Castelletti S, Rosmini S, Simpson J, Nasis A, Bhuva AN, Bulluck H, Abdel-Gadir A, White SK, Manisty C, Spottiswoode BS, Wong TC, Piechnik SK, Kellman P, Robson MD, Schelbert EB, Moon JC. Automatic measurement of the myocardial interstitium: synthetic extracellular volume quantification without hematocrit sampling. JACC Cardiovasc Imaging. 2016;9:54–63. doi: 10.1016/j.jcmg.2015.11.008 [DOI] [PubMed] [Google Scholar]
- 32.Modi BN, Rahman H, Sherif SA, Ellis H, Eruslanova K, Chiribiri A, Perera D. Is heart rate response a reliable marker of adenosine-induced coronary hyperemia? Int J Cardiovasc Imaging. 2018;34:1117–1125. doi: 10.1007/s10554-018-1309-1 [DOI] [PMC free article] [PubMed] [Google Scholar]
- 33.Manisty C, Ripley DP, Herrey AS, Captur G, Wong TC, Petersen SE, Plein S, Peebles C, Schelbert EB, Greenwood JP, Moon JC. Splenic switch-off: a tool to assess stress adequacy in adenosine perfusion cardiac MR imaging. Radiology. 2015;276:732–740. doi: 10.1148/radiol.2015142059 [DOI] [PubMed] [Google Scholar]
- 34.Cerqueira MD, Weissman NJ, Dilsizian V, Jacobs AK, Kaul S, Laskey WK, Pennell DJ, Rumberger JA, Ryan T, Verani MS; American Heart Association Writing Group on Myocardial Segmentation and Registration for Cardiac Imaging. Standardized myocardial segmentation and nomenclature for tomographic imaging of the heart. A statement for healthcare professionals from the Cardiac Imaging Committee of the Council on Clinical Cardiology of the American Heart Association. Circulation. 2002;105:539–542. [DOI] [PubMed] [Google Scholar]
- 35.Messroghli DR, Moon JC, Ferreira VM, Grosse-Wortmann L, He T, Kellman P, Mascherbauer J, Nezafat R, Salerno M, Schelbert EB, Taylor AJ, Thompson R, Ugander M, van Heeswijk RB, Friedrich MG. Clinical recommendations for cardiovascular magnetic resonance mapping of T1, T2, T2* and extracellular volume: a consensus statement by the Society for Cardiovascular Magnetic Resonance (SCMR) endorsed by the European Association for Cardiovascular Imaging (EACVI). J Cardiovasc Magn Reson. 2017;19:75. doi: 10.1186/s12968-017-0389-8 [DOI] [PMC free article] [PubMed] [Google Scholar]
- 36.Elliott PM, Borger MA, Borggrefe M, Cecchi F, Charron P, Hagege AA, Lafont A, Limongelli G, Mahrholdt H, McKenna WJ, Mogensen J, Nihoyannopoulos P, Nistri S, Pieper PG, Pieske B, Rapezzi C, Rutten FH, Tillmanns C, Watkins H. 2014 ESC Guidelines on diagnosis and management of hypertrophic cardiomyopathy: the Task Force for the Diagnosis and Management of Hypertrophic Cardiomyopathy of the European Society of Cardiology (ESC). Eur Heart J. 2014;35:2733–2779. doi: 10.1093/eurheartj/ehu284 [DOI] [PubMed] [Google Scholar]
- 37.Vermes E, Childs H, Carbone I, Barckow P, Friedrich MG. Auto-threshold quantification of late gadolinium enhancement in patients with acute heart disease. J Magn Reson Imaging. 2013;37:382–390. doi: 10.1002/jmri.23814 [DOI] [PubMed] [Google Scholar]
- 38.Germain DP, Hughes DA, Nicholls K, Bichet DG, Giugliani R, Wilcox WR, Feliciani C, Shankar SP, Ezgu F, Amartino H, Bratkovic D, Feldt-Rasmussen U, Nedd K, Sharaf El Din U, Lourenco CM, Banikazemi M, Charrow J, Dasouki M, Finegold D, Giraldo P, Goker-Alpan O, Longo N, Scott CR, Torra R, Tuffaha A, Jovanovic A, Waldek S, Packman S, Ludington E, Viereck C, Kirk J, Yu J, Benjamin ER, Johnson F, Lockhart DJ, Skuban N, Castelli J, Barth J, Barlow C, Schiffmann R. Treatment of Fabry’s disease with the pharmacologic chaperone migalastat. N Engl J Med. 2016;375:545–555. doi: 10.1056/NEJMoa1510198 [DOI] [PubMed] [Google Scholar]
- 39.Chimenti C, Morgante E, Tanzilli G, Mangieri E, Critelli G, Gaudio C, Russo MA, Frustaci A. Angina in fabry disease reflects coronary small vessel disease. Circ Heart Fail. 2008;1:161–169. doi: 10.1161/CIRCHEARTFAILURE.108.769729 [DOI] [PubMed] [Google Scholar]
- 40.Mourad JJ, Hanon O, Deverre JR, Camici PG, Sellier P, Duboc D, Safar ME. Improvement of impaired coronary vasodilator reserve in hypertensive patients by low-dose ACE inhibitor/diuretic therapy: a pilot PET study. J Renin Angiotensin Aldosterone Syst. 2003;4:94–95. doi: 10.3317/jraas.2003.018 [DOI] [PubMed] [Google Scholar]
- 41.Neglia D, Fommei E, Varela-Carver A, Mancini M, Ghione S, Lombardi M, Pisani P, Parker H, D’amati G, Donato L, Camici PG. Perindopril and indapamide reverse coronary microvascular remodelling and improve flow in arterial hypertension. J Hypertens. 2011;29:364–372. doi: 10.1097/HJH.0b013e328340a08e [DOI] [PubMed] [Google Scholar]
- 42.Hittinger L, Shannon RP, Bishop SP, Gelpi RJ, Vatner SF. Subendomyocardial exhaustion of blood flow reserve and increased fibrosis in conscious dogs with heart failure. Circ Res. 1989;65:971–980. [DOI] [PubMed] [Google Scholar]