

Abstract
Exhausted CD8 T cells (TEX) are a distinct state of T cell differentiation associated with failure to clear chronic viruses and cancer. Immunotherapies like PD-1 blockade can re-invigorate TEX cells, but re-invigoration is not durable. A major unanswered question is whether TEX cells differentiate into functional durable memory T cells (TMEM) upon antigen clearance. Here, using a mouse model, we found that upon eliminating chronic antigenic stimulation, TEX cells partially (re)acquire phenotypic and transcriptional features of TMEM cells. These “recovering” TEX cells originated from the T-cell factor (TCF-1+) TEX progenitor subset. Nevertheless, the recall capacity of these recovering-TEX cells remained compromised compared to TMEM cells. Chromatin-accessibility profiling revealed failure to recover core memory epigenetic circuits and maintenance of a largely exhausted open chromatin landscape. Thus, despite some phenotypic and transcriptional recovery upon antigen clearance, exhaustion leaves durable epigenetic scars constraining future immune responses. These results support epigenetic remodeling interventions for TEX cell targeted immunotherapies.
Keywords: T cell exhaustion, immunological recovery, recall capacity, epigenetic landscape of exhausted T cells
INTRODUCTION
Memory CD8 T cells (TMEM) persist long-term, can self-renew in the absence of antigen via homeostatic cytokines, interleukin-7 (IL-7) and IL-15, and generate robust secondary TEFF responses upon reinfection1. However, in cancer and chronic viral infections continuous antigen exposure results in “exhaustion”2. Exhausted CD8 T cells (TEX) have altered effector functions, and sustained high expression of inhibitory receptors (IRs), including programmed death-1 (PD-1)3–5. TEX lack the key TMEM property of antigen-independent self-renewal and become addicted to persisting antigen for maintenance6–8. TEX have a distinct transcriptional program4, 9, 10 and epigenetic landscape11–16 compared to TEFF and TMEM. The epigenetic divergence of TEX from TEFF and TMEM is driven by the transcription factor Tox17–22 and the TEX-specific chromatin landscape is stable even following PD-1 pathway blockade11. Thus, TEX are a distinct type of CD8 T cells with specific functional and phenotypic properties, and a unique underlying transcriptional and epigenetic program. Whether these properties and programs change upon resolution of chronic disease remains poorly understood.
TEX are heterogeneous, with two main subsets. The PD-1IntCD44Hi TEX progenitor subset (Prog-TEX) responds to PD-1 pathway blockade, whereas the PD-1HiCD44Int terminal subset (Term-TEX) does not23. A proliferative hierarchy exists, whereby the PD-1Int TEX progenitor subset gives rise to a larger terminal TEX subset through antigen-driven proliferation24–28. The transcription factor TCF-1 is critical for the maintenance of this Prog-TEX subset25–28. It is now clear that additional heterogeneity exists in TEX 29–31. However, all TEX subsets require Tox29 and are epigenetically distinct from TEFF and TMEM32.
Developing TEX can be rescued from irreversible exhaustion and reprogrammed towards memory if removed from antigen exposure early, but not after prolonged stimulation33. This is consistent with progressive epigenetic changes13, and establishment of NFAT-independent Tox expression later during chronic antigen exposure17. Nevertheless, a small fraction of TEX may persist following antigen elimination and some TEX features may recover6, 7, 33, 34. In patients cured of chronic HCV, previously-exhausted HCV-specific CD8 T cells can persist and display reduced PD-1 expression and improved function, perhaps due to persistence of Prog-TEX35–37. A key question is what changes occur phenotypically, functionally, transcriptionally, and epigenetically to TEX and TEX subsets upon cure of chronic disease. This question is of increasing relevance, as more patients are being cured of cancer by immunotherapies and of chronic HCV infection by direct-acting antivirals (DAAs)38–40.
Here, we addressed these questions using the mouse model of chronic lymphocytic choriomeningitis virus (LCMV) infection, the prototypical model of T cell exhaustion. Upon removal from chronic antigen exposure, only a small proportion of TEX were able to survive and persist, but those persisting TEX partially (re)acquired some TMEM phenotypic and transcriptional features while losing some TEX characteristics. TEX persisting after antigen withdrawal were mainly derived from TCF-1+ TEX progenitors, indicating preferential survival. However, despite some memory-like phenotypic and transcriptional features, these “recovering” TEX (REC-TEX) were highly compromised upon re-challenge infection. ATAC-seq analysis demonstrated that REC-TEX underwent only minor changes in chromatin accessibility upon withdrawal of antigen and retained a largely TEX epigenetic identity. This study provides insight into molecular mechanisms of TEX differentiation upon antigen elimination during chronic disease, and has implications for patients cured of cancer or chronic viral infection.
RESULTS
TEX downregulate exhaustion markers upon antigen elimination
Although most TEX are lost upon antigen removal, a fraction persists6, 7, 33–37. The differentiation program of these persisting TEX remains poorly understood. Here, we used an adoptive transfer approach in a mouse model of chronic viral infection33 to dissect the mechanisms and differentiation of persisting TEX. Briefly, CD8 TEX isolated from spleens of mice chronically infected with LCMV clone 13 (LCMV-Cl13) were isolated 4 weeks post-infection (p.i.) and adoptively transferred into congenically-distinct, infection-free recipient mice. An equal number of antigen-specific TMEM (generated in LCMV Armstrong (LCMV-Arm) infection at >week 4 p.i) were adoptively transferred into matched recipient mice (Fig. 1a). Recipient mice had previously cleared LCMV-Arm infection, hereafter called LCMV-Arm immune. Immunity in these recipients controlled for any possible low-level virus transfer. One day prior to infection, donor mice were engrafted with a physiological number (103) of congenically-distinct TCR transgenic P14 cells, specific for the H-2Db restricted GP33-41 epitope of LCMV41,42, 43.
Figure 1: Antigen elimination results in acquisition of a partial memory phenotype by TEX.

(a) Experimental design. CD8+ T cells from LCMV-Cl13 infected mice containing P14 cells (TEX P14) were adoptively transferred into congenic, infection-free recipient mice. TMEM P14 cells were transferred into matched recipient mice as a control. (b) Left, representative dot plots for the frequency of donor P14 cells. Right, number of P14 cells per spleen at week 4 post-transfer as a percentage of original number of P14 cells adoptively transferred on d0 (estimating 10% take). N=3 biologically independent experiments. (c) Left, representative dot plots of CD127 and PD-1 expression. Right, percentages of PD-1+CD127− and CD127+PD-1−. (d) Left, representative dot plots of TCF-1 and Tim-3 expression and percentage of TCF-1+Tim-3− subset. Right, dot plots and graphs for Tox and PD-1 expression. (e) Representative histograms for expression of PD-1 (left), Tox (middle), or TCF-1 (right). To the right of histograms, corresponding graphs of mean fluorescence intensity (MFI) subtracted from MFI of endogenous naïve cells (ΔMFI). Data (c-e) for PD-1 and CD127 n=12 biologically independent experiments for d0 and n=7 for d28, for Tox and TCF-1 n=4 for d0 and n=2 for d28. (f) Top, representative dot plots of CD160 and PD-1 expression. Bottom, percentages of co-expression of IRs on P14 cells. N=3 biologically independent experiments. (g) Top, representative dot plots of IFNγ production and LAMP-1 (i.e. CD107a) expression in response to peptide stimulation. Bottom, percentages of polyfunctional cells. N=3 and 2 biologically independent experiments for d0 and d28, respectively. (h) Phenotypic profile of TEX, TMEM, and REC-TEX. Level of expression of indicated markers represented as a percentage of the highest expressing cell type. Data presented as mean +/− SD. All analyses for Figure 1 performed by unpaired two-tailed Mann-Whitney test. *p<0.05, **p<0.01, ***p<0.001, ****p<0.0001. Data for d28 from 2-8 mice and 2-5 mice per experiment for the TEX and TMEM groups, respectively.
Most donor TEX were poorly maintained compared to TMEM upon adoptive transfer to infection-free mice, as expected6, 34, though some TEX persisted in absence of antigen (Fig. 1b). After 1 month, frequency of CD127+PD-1− donor TEX increased from ~0.37% on adoptive transfer day (d0) to 23.8% (64-fold increase) (Fig. 1c). Additionally, the frequency of TCF-1+Tim-3− and PD-1int Ly108/Slamf6+ donor TEX increased 4-fold and 2.23-fold, respectively (Fig. 1d and Extended Data 1b–1c). Conversely, the frequency of the CD127− PD-1+, TCF-1−Tim-3+, and PD-1hi Ly108/Slamf6− donor terminal TEX populations, decreased by 3.7-fold, 2.3-fold, and 2.3-fold, respectively. Moreover, the percentage of donor TEX co-expressing PD-1 and Tox, decreased by half (77% versus 36.6%) (Fig. 1d). The amount of these proteins expressed/cell also changed with PD-1, Tox and Eomes decreasing, and TCF-1 and CD127 increasing (Fig. 1e and Extended Data 1d–1e). Despite this phenotypic shift away from exhaustion and towards memory, the phenotype of TEX at week 4 post-transfer did not fully recapitulate that of bona fide TMEM with residual expression of many exhaustion markers. Examining donor TEX at later time points (up to d520 post-transfer) showed a trend of continued increasing expression of markers of TMEM, but even at these late time points Tox expression remained elevated (Extended Data 1g).
We examined co-expression of IRs including PD-1, 2B4 (CD244), Lag-3, CD160, TIGIT and Tim-3 on donor TEX. The frequency of TEX co-expressing 4+ IRs significantly decreased upon antigen elimination. However, the frequency of TEX expressing 1-3 IR(s) remained significantly higher than TMEM, and the percentage of TEX cells not expressing any IRs remained lower (Fig. 1f). Donor TEX showed slightly improved polyfunctionality following 4 weeks in infection-free mice, especially donor TEX with dual functionality. However, donor TEX with 4 functions were significantly less frequent than TMEM, and donor TEX with zero or one function were increased (Fig. 1g and Extended Data 1f). Similar phenotypic and functional patterns were observed when equal numbers of TEX and TMEM P14 cells were co-transferred into the same Arm-immune recipient mice, controlling for any environmental effects (Extended Data 2a–2g) or when examining non-TCR-transgenic H-2Db tetramer+ GP33-specific TEX (Db-GP33 TEX) (Extended Data 2h–2j). Collectively, these data indicate that TEX transferred into infection free mice displayed mixed TEX and TMEM features (Fig. 1h), suggesting partial recovery from exhaustion. These results are consistent with observations post-cure of human HCV infection35–37. These donor TEX at 4+ weeks post-transfer will hereafter be termed recovering-TEX (REC-TEX).
TEX undergo transcriptional changes upon antigen elimination
TEX have a distinct transcriptional program from TEFF, TMEM and naïve T cells4, 9, 10; however, it is unclear how the TEX transcriptional profile changes upon eliminating chronic antigen stimulation. Thus, we examined the transcriptional program of REC-TEX compared to the originally transferred donor TEX. Donor TEX and TMEM cells were purified on day 0 (d0) and 4 weeks post-transfer to Arm-immune recipient mice and we performed single-cell RNA sequencing (scRNAseq). A control naïve P14 population was examined in parallel to allow benchmarking known differences between naïve and TMEM or TEX, but was not examined further below. Donor TMEM transcriptional profiles remained unchanged upon adoptive transfer. We therefore focused our analysis on TEX, TMEM, and REC-TEX.
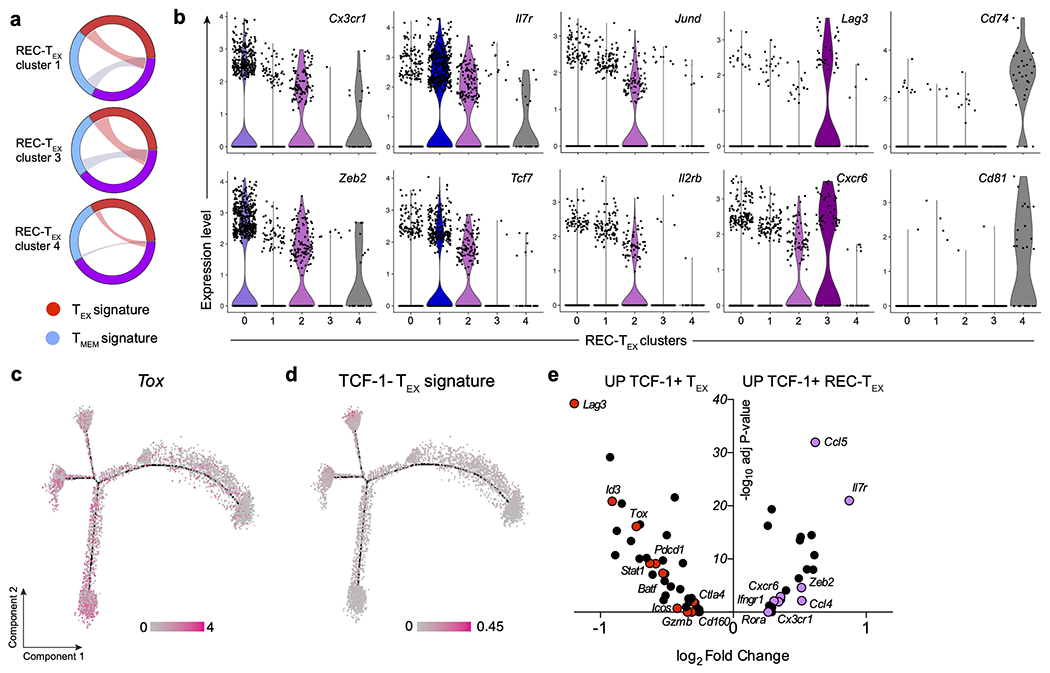
The majority of REC-TEX cells clustered with TMEM in the scRNAseq tSNE (Fig. 2a). Nine distinct clusters were identified by unsupervised clustering (Extended Data 3b), and the majority of REC-TEX (68.1%), fell within clusters dominated by TMEM cells (clusters 0, 2, and 4), whereas only 13.9% of REC-TEX were within clusters with a majority of TEX cells (clusters 1, 5, 6, and 7) (Extended Data 3c). Overall, REC-TEX showed an intermediate transcriptional profile between TEX and TMEM, with only three genes unique to REC-TEX (Extended Data 3d–3e). In REC-TEX, expression of exhaustion-associated genes, such as Tox, Pdcd1 (PD-1) and Lag3, decreased and memory-associated genes, such as Il7r (CD127) and Tcf7 (TCF-1) increased compared to donor TEX (Fig. 2b, and Extended Data 3f). However, Tox remained higher and Tcf7 lower in REC-TEX compared to TMEM. Unsupervised hierarchical clustering of only REC-TEX scRNAseq data identified 5 clusters (Fig. 2c). These clusters fell into two main categories; the first contained REC-TEX-Cluster 2 (REC-TEX-C2), a cluster that overlapped exclusively with the TEX signature and had higher expression of Il2rb (encoding CD122) and Jund (Fig. 2d). The second category included all other clusters, that displayed mixed signatures of TEX and TMEM (Fig. 2d and Extended Data 4a–4b). These results suggested differing degrees of transcriptional recovery among TEX following cure of chronic infection.
Figure 2: Recovering-TEX (REC-TEX) are transcriptionally distinct from TEX but intermediate between TEX and TMEM.

(a) tSNE plot of scRNAseq transcriptional profile for combined TEX, TMEM, and REC-TEX. (b) Separate tSNE plots of TEX, TMEM, and REC-TEX cells (top row), with overlay of Tox, Tcf7, and Il7r expression patterns (bottom rows). (c) tSNE plot showing unsupervised clustering of REC-TEX cells. (d) Circos plots for transcriptional profiles of REC-TEX clusters compared to TEX and TMEM signatures, REC-TEX-Cluster 0 (REC-TEX-C0) (top), and REC-TEX-C2 (bottom). (e) Gene ontology (GO) analysis of differentially expressed genes between REC-TEX (purple) and TEX (red). −log10 p-value calculated by hypergeometric distribution test. (f) Network analysis by Ingenuity® of the top differentially expressed genes (DEGs) between REC-TEX and TEX. (g) Pseudotime trajectory analysis by Monocle 2 for TEX and REC-TEX transcriptional profiles generated using top 209 DEGs from scRNAseq data. Arrows indicate suggested direction of differentiation from progenitor TEX population (State 1), towards more terminally differentiated TEX populations (States 3, 4 and 5), or towards REC-TEX following antigen elimination. (h) Pseudotime plot of TEX and REC-TEX with overlay of the Tcf7 gene expression (i) Pseudotime plot of TEX and REC-TEX with overlay of the signature of genes upregulated in TCF-1+ TEX progenitor subset from Utzschneider et al. 25. (j) Volcano plot showing selected differentially expressed genes between TCF-1+ TEX and REC-TEX. NK, natural killer cells; IFN, interferon.
Pairwise analysis between REC-TEX and TEX revealed 239 differentially expressed genes (DEGs); 190 in TEX and 49 in REC-TEX. The top gene ontology (GO) terms enriched in REC-TEX included T cell activation, ferroptosis, homeostasis, and peptide metabolism, whereas TEX were enriched in signatures of inflammation, such as responses to type I and II interferons (IFNβ and IFNγ) (Fig. 2e). Ingenuity Pathway Analysis (IPA®) of the top differentially expressed genes between TEX and REC-TEX also showed enrichment of inflammatory pathways in TEX. Genes associated with type I interferon responses were the top significant network enriched in TEX compared to REC-TEX (Fig. 2f). IPA also revealed enrichment of transcription factors Tcf7 and Zeb2 in REC-TEX and Tox in TEX.
To investigate developmental changes, we performed pseudotime analysis of TEX and REC-TEX using Monocle 2.0 44 (Fig. 2g). We anchored the trajectory on the transferred donor TEX cells in state 1 (bottom branch). The predicted trajectory then bifurcated into two branches. One branch bifurcated again, containing cells within states 3 and 4, whereas the other branch contains cells in state 5. The majority of REC-TEX cells (95.4%) were found in the state 5 branch. State 2 contained only 5 cells at the small interconnecting central branch. TEX in state 1 had the highest Tcf7 expression likely corresponding to TCF-1+ TEX progenitors25, 26, whereas states 3-5 corresponded to more terminally differentiated TCF-1− TEX subset (Fig. 2h, and Extended Data 4c). Indeed, the TCF-1+ TEX signature from Utzschneider et al.25 was strongly enriched in state 1 (Fig. 2i), compared to the TCF-1− TEX signature that enriched in states 3-4 (Extended Data 4d). Together, these data suggested that REC-TEX likely arise from the TCF-1+ progenitor TEX subset, that persists, and possibly differentiates, following removal from chronic infection.
To investigate how TCF-1+ progenitor TEX may change upon antigen removal, we compared gene expression profiles of TCF-1+ TEX and REC-TEX. Of 269 DEGs, 227 were enriched in TCF-1+ TEX, including Tox, Tcf7, Slamf6, indicators of recent TCR signaling (Batf and Nr4a2), and type I IFN pathway genes. The 42 genes enriched in REC-TEX included Il7r, Zeb2, Gzma, and beta chemokines (Fig. 2j). Thus, transcriptional comparison of TCF-1+ TEX and REC-TEX indicated that TCF-1+ TEX likely undergo further differentiation upon removal from antigen. Additionally, TCF-1+ REC-TEX also displayed 157 DEGs compared to TCF-1+ TEX (Extended Data 4e), further supporting the notion of TCF-1+ TEX differentiation of upon removal from antigen.
TCF-1+ TEX selectively survive and differentiate to REC-TEX
In the studies above, and in previous work37,45, the contribution of selective survival versus differentiation of TEX subsets was unclear. To address this question, we sorted TEX subsets using Ly108 as a surrogate for TCF-1 expression. Sorting Ly108+PD-1int and Ly108−PD-1hi TEX allowed high purity separation of TCF-1+ TEX and TCF-1− TEX, respectively (Fig. 3a). We then adoptively transferred equal numbers of progenitor TCF-1+ TEX (Prog-TEX) and terminal TCF-1− TEX (Term-TEX) into Arm-immune mice and examined persistence and differentiation upon removal from antigen (Fig. 3a, right panel). The number of donor cells recovered from the TCF-1+ TEX was ~10-fold higher than for the TCF-1− TEX subset after 4 weeks post-transfer (Fig. 3b). This result demonstrates that at least some changes to TEX upon antigen elimination arise from selective survival of TEX TCF-1+ population.
Figure 3: Differentiation of TEX into REC-TEX is associated with selective survival of the progenitor TCF-1+ TEX subset.

(a) Left, dot plots showing sorting purity of Ly108+PD-1int (surrogate for TCF-1+) progenitor TEX (Prog-TEX) and Ly108−PD-1hi (i.e. TCF-1−) terminal TEX (Term-TEX). Middle, representative histograms of TCF-1 expression on sorted subsets. Right, experimental design for co-transfer of ~1.4x10⁵ sorted P14 cells of each congenically distinct Prog-TEX and Term-TEX subsets into infection-free recipient mice. (b) Left, representative dot plots for the frequency of donor Prog-TEX and Term-TEX P14 cells, on the day of adoptive transfer (d0) and ~d30 post-transfer. Middle, percentage of surviving P14 cells for Prog-TEX and Term-TEX on d30 post-transfer compared to d0 (estimating 10% take). Right, absolute number of P14 cells per spleen for each subset on d30 post-transfer. (c) Left, representative dot plots of CD127 and PD-1 expression. Right, percentages of CD127+ and PD-1+CD127− P14 cells for both subsets on d0 and d30 post-transfer, and absolute numbers of CD127+ P14 cells per spleen on d30 post-transfer. (d) Left, representative histograms for expression of PD-1 or CD127 on Prog-TEX and Term-TEX P14s on d0 (adoptive transfer day), and on d30 post-transfer compared to endogenous CD8+ GP33 tetramer+ TMEM of recipient mice. Right, plots of PD-1 and CD127 MFI on both subsets. Data (b-d) n=2 biologically independent experiments, 2 donor groups/experiment for d0 and 3-5 mice/experiment for d30. (e) Left, representative histograms for levels of expression of transcription factors Tox, Eomes, or TCF-1 d30 post-transfer, compared to CD8+ naïve T cells. Right, plots of Tox, Eomes, and TCF-1 MFI on both subsets. (f) Left, representative dot plot of CD39 and PD-1 expression. Right, percentages of co-expression of 6 IRs on P14s d30 post-transfer. Data (e-f) from one experiment, 5 mice. All analyses for Figure 3, for co-transferred cells performed by paired two-tailed t-test (Wilcoxon matched-pairs signed rank test). Comparisons of d0 versus d30 analyzed using unpaired two-tailed Student’s t-tests (Mann-Whitney test). *p<0.05, **p<0.01.
Additional changes occurred within donor TCF1+ Prog-TEX, since only ~8% of donor Prog-TEX population was CD127+ at transfer, whereas the REC-TEX were ~80% CD127+, and the MFI of CD127 was significantly increased (Fig. 3c,d). PD-1 expression also decreased on the donor TCF1+ TEX and the frequency of PD-1+CD127− REC-TEX was reduced ~10-fold (from 84% to 8%) (Fig. 3c,d). Conversely, the progeny of Term-TEX displayed less differentiation (Fig. 3c,d). Rather, these Term-TEX sustained higher expression of Tox and Eomes, lower TCF-1 expression (Fig. 3e), and higher co-expression of multiple IRs in the absence of persisting antigen (Fig. 3f). Similar results were obtained when subsets were purified using a Blimp1-YFP reporter to obtain Blimp1-YFP− Prog-TEX and Blimp1-YFP+ Term-TEX27 (Extended Data 5). Together, these data suggested that REC-TEX originated from the progenitor TCF-1+ TEX or even a subpopulation within the progenitors, with perhaps additional changes in key pathways, including IL-7R expression, consistent with predictions of the scRNAseq data.
REC-TEX recall capacity remains compromised compared to TMEM
The data above indicate that upon eliminating chronic antigenic stimulation TEX (re)acquired some phenotypic and transcriptional features of TMEM. We next sought to examine whether REC-TEX also recover a key functional property of TMEM, which is the ability to mount potent recall responses upon re-encountering their cognate antigen1. We sorted REC-TEX P14 cells and adoptively transferred these cells into new congenic naïve mice together with an equal number of either congenic TEX or TMEM. Recipient mice were challenged with LCMV-Arm and the recall response of each donor population was examined 8 days later (Fig. 4a and Extended Data 6a–6b). The REC-TEX underwent slightly better expansion compared to TEX which largely failed to expand upon rechallenge (Extended Data 6c). However, these REC-TEX were >5-fold less efficient in expansion capacity compared to co-transferred TMEM, indicating that any recovery that occurred in REC-TEX failed to completely restore memory function (Fig. 4b). Moreover, whereas only ~16.6% (6-33%) of the secondary TEFF derived from TMEM were PD-1+CD127−, secondary TEFF derived from REC-TEX were 63% (37-77%) PD-1+CD127−. Secondary TEFF derived from REC-TEX also expressed 3-4 times the amount of PD-1 per cell compared to secondary TEFF from TMEM (Fig. 4c,d). Conversely, KLRG1, a marker of robust TEFF generation, was substantially lower in frequency and MFI on TEFF from REC-TEX compared to those derived from TMEM (Fig. 4c,d). Similar results were obtained in different organs (Extended Data 6d). Consistent with these observations, REC-TEX-derived TEFF had a substantially lower percentage of polyfunctional TEFF than TMEM derived cells, and inferior cytotoxic capacity (Fig. 4e and Extended Data 6e–6f). After clearance of rechallenge infection, progeny of REC-TEX were present in similar numbers to TMEM progeny at d30 p.i. (Fig. 4f). However, REC-TEX progeny had higher TCF-1, CD127 and CD62L, though these cells also retained more PD-1 and Tox (Fig 4f and Extended Data 6g), suggesting that although some memory-like properties were recovered after rechallenge, there may still be persisting features of the history of exhaustion. Despite the rapid upregulation of PD-1 on REC-TEX derived secondary TEFF, blockade of the PD-1 pathway during rechallenge provided only modest benefit and there was no increase in absolute cell number (Fig. 4g–I and Extended Data 6h–k). Thus, despite a slight improvement in secondary expansion of REC-TEX compared to TEX upon challenge, REC-TEX remained significantly inferior to TMEM even with PD-1 pathway blockade, indicating lack of full recovery of memory properties. Moreover, secondary TEFF generated from REC-TEX were phenotypically and functionally compromised compared to secondary TEFF generated from TMEM with higher PD-1, lower KLRG1 and suboptimal effector function.
Figure 4: REC-TEX possess inferior recall capacity compared to TMEM that is only partially improved with PD-L1 blockade.

(a) Experimental design. Equal number of sorted REC-TEX and TMEM was co-transferred into congenic naïve mice, then challenged with LCMV-Arm. Donor cells were examined on d8 post-challenge. (b) Absolute number of P14 cells per spleen on d8 post challenge. (c) Left, representative dot plots of CD127 and PD-1, and CD127 and KLRG1 expression. Right, percentages of different subsets. (d) Left, histograms for expression of PD-1 or KLRG1 for P14 cells. Right, markers’ expression as ΔMFI (compared to endogenous naïve cells). (e) Left, representative dot plots of cytokine production (IFNγ and TNF) and CD107a expression on P14 cells upon GP33-peptide re-stimulation. Right, percentage of polyfunctional REC-TEX and TMEM P14 cells. Data (b-e) n=2 biologically independent experiments, 4-5 mice/experiment. (f) Co-transferred REC-TEX and TMEM P14s at d30 post-challenge. Representative dot plots of CD127 and CD62L, TCF-1 and Tim-3 expression, and histograms of TCF-1 expression. To the right of dot plots, percentages and absolute numbers of the different P14 subsets, and TCF-1 expression. N=2 biologically independent experiments, 2-5 mice/experiment. (g) Experimental design for LCMV-Arm challenge of co-transferred REC-TEX and TMEM, treated with anti-PD-L1 or PBS. (h) Left, percentage of REC-TEX cells of total P14 cells. Right, fold expansion of REC-TEX and TMEM P14 cells. Data presented as mean +/− SD. Unpaired two-tailed Student’s t-tests (Mann-Whitney test). **p<0.01. (i) Left, representative dot plots of CD127 and PD-1, and CD127 and KLRG1 expression in control PBS-treated (top) or anti-PD-L1-treated (bottom) groups. Right, percentages of indicated subsets. (j) Left, histograms for PD-1 or KLRG1 expression on d8 post challenge. Right, expression as MFI. (k) Left, representative dot plots of Tox and PD-1 expression. Right, plots for percentages of Tox+PD-1+ P14 cells. (l) Left, representative histograms for granzyme B (GzmB) expression. Right, GzmB expression as ΔMFI. Data for (h-l) n=2 independent experiments, 2-4 mice/group/experiment. All analyses for Figure 4, for co-transferred cells by paired two-tailed t-test (Wilcoxon matched-pairs signed rank test). PBS versus αPD-L1 (h-l) analyzed using unpaired two-tailed Student’s t-tests (Mann-Whitney test). *p<0.05, **p<0.01.
Epigenetic scars persist from REC-TEX exhaustion history
We next investigated the epigenetic state of REC-TEX by performing transposase accessible chromatin with high-throughput sequencing (ATACseq)46 (Extended Data 7a,b). ATACseq analysis of REC-TEX, TEX, and TMEM, using Uniform Manifold Approximation and Projection (UMAP) suggested a chromatin accessibility landscape of REC-TEX intermediate between TEX and TMEM (Fig. 5a). Pearson correlation suggested more similarity in ATACseq signatures between REC-TEX and TEX samples than between REC-TEX and TMEM samples (mean correlation 116.8 versus 143.7, respectively) (Extended Data 7c). Including naïve P14 cells in Principal Component Analysis (PCA) also suggested that REC-TEX had a chromatin accessibility profile more similar to TEX than TMEM (Extended Data 7d). Pairwise comparisons of open chromatin regions (OCRs) in REC-TEX, TEX and TMEM confirmed that REC-TEX were more similar to TEX than to TMEM (Fig. 5b–d). The number of differential OCRs between REC-TEX and TEX was ~1 order magnitude lower than between REC-TEX versus TMEM (182 and 1586 OCRs, respectively) (Fig. 5b). Nevertheless, of the 147 OCRs more open in REC-TEX compared to TEX (UP_REC-TEX_vs TEX) 136 (92.5%) overlap with those more accessible in TMEM compared to TEX (Extended Data 7e), suggesting that some changes in REC-TEX do overlap with features of TMEM. However, of the 666 OCRs that were significantly more accessible in REC-TEX versus TMEM (UP_REC-TEX_vsTMEM), 526 OCRs (79%) were also more accessible in TEX compared to TMEM, suggesting that the majority of differences between the REC-TEX and TMEM OCR landscapes were residual open chromatin signatures from TEX or “scars” of exhaustion (Fig. 5c).
Figure 5: REC-TEX remain epigenetically scarred from their exhaustion history.

(a) Uniform Manifold Approximation and Projection (UMAP) of chromatin accessibility profiles for TEX, TMEM, and REC-TEX P14 cells using ATACseq. (b) Number of differential OCRs between REC-TEX versus TMEM or TEX using pairwise analysis by DESeq2. (c) Venn diagram of overlap in OCRs significantly more open in REC-TEX compared to TMEM (UP_REC-TEX_vs TMEM) and significantly more open in TEX compared to TMEM (UP_TEX_vs TMEM). (d) Heatmap of differential peaks corresponding to OCRs significantly different between TEX, TMEM, and REC-TEX. Calculated by pairwise analysis using DESeq2. (e) ATACseq tracks at selected genes (Tox, Il7r, Pdcd1, and Klrg1) from naïve, TMEM, TEX, and REC-TEX samples (top to bottom). Shaded boxes indicate peaks with significantly different accessibility between REC-TEX and TEX. Open boxes indicate peaks that are not significantly changed between REC-TEX and TEX, but are significantly different from TMEM. The red arrow indicates the Pdcd1 -23kb enhancer.
Further analysis revealed open chromatin changes that were highly biased to REC-TEX compared to TEX or TMEM. However, this cluster (cluster 1, C1) was small, and only 149 OCRs were significantly more accessible in REC-TEX compared to TEX and TMEM. These OCRs included sites near Fasl, Ezh2, Il12r and Id2 (Fig. 5d). Specific clusters of REC-TEX gene loci that overlapped with TMEM (REC-TEX and TMEM), contained 107 OCRs (cluster C4) with OCRs mapping to genes including Il7r, Il21, Cd226 and Il12rb2. However, the vast majority of TMEM associated OCRs (n=3242; C5) were not changed in REC-TEX (Fig. 5d). The OCR pattern in REC-TEX predominantly resembled that of TEX, as indicated by the cluster of gene-associated OCRs that remained highly similar between TEX and REC-TEX (Fig 5d; cluster 2 of 525 OCRs) including regions near Eomes, Pdcd1, Tox2, Cd101, and Nr4a2.
Some of these changes in individual genes provided insight into mechanisms. For example, an OCR upstream of Il7r became more accessible in REC-TEX, reflecting a more TMEM pattern (Fig. 5e). In contrast, in REC-TEX the accessibility pattern of the Tox locus, a locus that is heavily remodeled in exhaustion17, remained more similar to TEX (Fig. 5e). Moreover, accessibility of OCRs associated with Pdcd1 (encoding PD-1) were not significantly changed in REC-TEX compared to TEX (Fig 5e), including the well characterized exhaustion-specific enhancer in Pdcd1 at ~23 kb11, 12. A similar OCR stability was observed for other loci such as Klrg1 (Fig. 5e), Batf, Tox2, Eomes, and Stat3 (Extended Data 7f).
To test whether the OCR pattern of REC-TEX could be explained by persistence of the OCR pattern of TCF-1+ Prog-TEX cells, we compared the chromatin accessibility profile of REC-TEX to the profiles of TCF-1+ and TCF-1− TEX subsets from Jadhav et al.32. However, REC-TEX were positioned separately from the TCF-1+ TEX subset and slightly towards TMEM (Extended Data 7g). We then examined the 182 OCRs that were changed in REC-TEX compared to TEX. These OCRs were evenly distributed between the TCF-1+ TEX and TCF-1− TEX subsets (Extended Data 7h). A similar pattern was observed using a different TEX subset ATAC-seq dataset 29 (Extended Data 7i). These analyses suggest that, although some chromatin accessibility changes in REC-TEX reflect features of the Prog-TEX subset, the global pattern of OCR changes in REC-TEX are due to contributions from Prog-TEX biology as well as other changes likely occurring as these cells differentiate in the absence of antigen.
Epigenetic scars in REC-TEX limit core memory circuits
To identify the transcriptional circuitry associated with this epigenetic “scarring” of TEX, we performed integrated analysis of scRNAseq and ATACseq data. We first asked what fraction of genes differentially expressed between REC-TEX and TEX were associated with changes in OCRs. Of the 190 genes that were significantly upregulated in TEX compared to REC-TEX, only 10 (5.2%) were associated with significantly altered chromatin accessibility (Fig. 6a). Similarly, of the 49 genes significantly upregulated in REC-TEX, only 4 (8.1%) were associated with altered accessibility (Fig. 6a). Thus, the vast majority, 225/239 genes (~94%), of transcriptional changes between TEX and REC-TEX were not associated with a change in the open chromatin pattern of that gene. These observations suggest that although the transcriptional and protein expression patterns of REC-TEX shifted towards a TMEM-like profile, the underlying cellular identity defined by OCR patterns and, thus, potential for future behavior, remained TEX-like.
Figure 6: Open chromatin landscape of REC-TEX hinders access to TEFF and TMEM transcriptional circuitry.

(a) Total number of DEGs between REC-TEX and TEX from scRNAseq. The fraction of DEGs associated with differential accessibility in OCRs from ATACseq are represented by the white portion of the bar. (b) Heatmap of the 182 differentially accessible OCRs in REC-TEX versus TEX. (c) Changes in gene expression associated with the differentially accessible OCRs in REC-TEX versus TEX. (d) Transcription factors with significantly enriched motifs in OCRs in REC-TEX versus TEX (top half, purple circles) or in TEX versus REC-TEX (bottom half, red circles). Pairwise analysis by Homer. (e) Overlap of the transcription factor binding sites (TFBS) in OCRs between REC-TEX, TEX, and TMEM, calculated by Taiji for TCF-4, T-bet and CEBP. (f) Fold difference in the TFBS overlap between REC-TEX and TEX divided by overlap between REC-TEX and TMEM for top differential TFs identified by HOMER in (d) and Extended Data 8c. (g) Left, heatmap of the PageRank analysis of TFs with the most significant differences in chromatin accessibility of their TFBS among the three groups. Right, fold difference in the TFBS overlap between REC-TEX and TEX divided by overlap between REC-TEX and TMEM for the identified TFs. (h) Heatmap of the top 100 OCRs showing differential accessibility in REC-TEX versus TEX from the TEFF signature by Pauken et al. 11.
Nevertheless, we analyzed OCRs with differential accessibility between REC-TEX and TEX (Fig. 6b) and examined gene expression from the scRNAseq data set associated with these OCRs. The top upregulated genes associated with differentially accessible chromatin regions for REC-TEX compared to TEX were Il7r and Emb (Fig. 6c). Some peaks with increased accessibility were associated with genes that had decreased expression in REC-TEX compared to TEX (Fig 6c) suggesting potential negative regulatory elements. These included Cd226 and Tox. Of the 140 OCRs that were more accessible in REC-TEX compared to TMEM (see Fig. 5c), only a handful (e.g. Zfp362) showed increased expression of the associated gene (Extended Data 8a). Applying the genomic regions enrichment of annotations tool (GREAT), to the comparison between REC-TEX and TMEM revealed predicted biological pathways, including signatures associated with T cell activation and differentiation, and regulation of cell death in REC-TEX (Extended Data 8b). Biological pathways enriched in TMEM included cell cycle pathways, epigenetics, and regulation of retinoic acid receptor signaling (Extended Data 8b). In contrast, no distinct biological processes were associated with OCR differences between REC-TEX and TEX.
HOMER analysis showed the top TFs with enriched motifs in REC-TEX compared to TEX were members of the TCF family (TCF-3 and TCF-4), members of the T-box family (T-bet and Tbx5), and ERG (Fig. 6d). Compared to TMEM, some of the top TFs enriched in REC-TEX were BATF, AP-1, and Eomes (Extended Data 8c). Compared to REC-TEX, TEX were enriched for motifs containing BATF and CEBP binding sites, whereas TMEM were enriched for Runx1 and 2 binding sites (Fig 6d and Extended Data 8c). Using Taiji, we compared TF binding site (TFBS) overlap between REC-TEX and either TEX or TMEM for the top differential TFs identified above (Fig. 6e). For all of the top 9 TFs with enriched TFBS in REC-TEX, there was more overlap with TEX than TMEM (Fig. 6f).
Next, using PageRank analysis, we identified TFs that had the most significant differences in chromatin accessibility within their TFBS (Fig. 6g). For the top 34 TFs identified, all but two (Tcf7 and Hsf1) showed greater overlap of TFBS between REC-TEX and TEX than between REC-TEX and TMEM (Fig. 6g). For Tcf7, 77 TFBS characteristic of TMEM (i.e. not predicted for TEX) were (re)acquired by REC-TEX, whereas 47 remained from their exhaustion history. However, for Hic1 and Zeb1, two of the top TFs identified by page rank analysis for REC-TEX, less TFBS were shared with TMEM (83 and 71) than with TEX (152 and 92, respectively) (Extended Data 8d). Together, these analyses suggest that the epigenetic landscape in which these TFs operate remains scarred from the exhaustion history.
Finally, we examined whether the OCR landscape associated with TEFF might change upon antigen removal. Thus, we identified 545 open chromatin regions enriched for accessibility in TEFF from published work11. Although there was some change in accessibility at these TEFF-associated OCRs upon recovery of TEX (i.e. TEX versus REC-TEX; log2 fold change >0.25) only 7 OCRs were statistically different between TEX and REC-TEX (p-value <0.05) (Fig. 6h). These data indicate a similar, and relatively inflexible pattern of effector gene accessibility, perhaps limiting the re-engagement of the effector program upon rechallenge infection (noted in Fig. 4). Mechanistically, Tox is a key TF that drives epigenetic induction of exhaustion and represses development of the OCR landscape of TEFF17. Thus, we examined the TEFF OCRs that failed to open because of Tox activity in TEX. Of the 2024 “Tox-repressed” OCRs normally found in TEFF only 58 were differentially accessible in REC-TEX compared to TEX (Extended Data 8e). In other words, only ~2.9% of the non-TEX OCR landscape associated with TEFF biology was restored in REC-TEX. Thus, recovery from exhaustion upon removal of antigen stimulation was not associated with a robust or global improvement access to TEFF genes. This finding is consistent with the poor REC-TEX recall responses and suboptimal differentiation into secondary TEFF upon antigen re-exposure compared to TMEM.
Thus, integrated transcriptional and epigenetic analyses suggested that incomplete functional recovery of TEX upon eliminating antigen stimulation is largely due to a lack of epigenetic plasticity and a failure to (re)acquire an epigenetic landscape permissive to the core transcriptional TMEM and TEFF circuits (Extended Data 9).
DISCUSSION
Reinvigoration of TEX by checkpoint blockade highlights the reversibility of some aspects of exhaustion47,2. However, effector properties are only partially and temporarily regained following PD-1:PD-L1 pathway blockade, and the exhaustion OCR landscape remains largely unchanged11. It remains unclear whether non-immunological cure of chronic infections will allow TEX to (re)-acquire TMEM differentiation or increase effector potential. To address this question we dissected the program of TEX following elimination of chronic antigen stimulation. These REC-TEX generated after experimental “cure” of chronic infection downregulated some features of exhaustion and appeared phenotypically and transcriptionally more memory-like. Despite the appearance of recovery, however, REC-TEX remained compromised in the ability to respond to reinfection compared to bona fide TMEM. Profiling chromatin accessibility of REC-TEX revealed minimal remodeling of the TEX epigenetic landscape, suggesting that lack of epigenetic plasticity is a major impediment to restoring optimal TMEM or TEFF biology.
Approximately 90% of TEX cells persisting ~1 month after eliminating antigen originated from the TCF-1+ TEX progenitor subset. These observations agree with previous observations in a mouse model of melanoma45, and in HCV patients following virological cure37. However, in addition to simply selective survival of this TCF-1+ subset of TEX, phenotypic and transcriptional changes in these REC-TEX cause them to appear more TMEM-like. A key change in REC-TEX upon cure may be the IL-7R-TCF-1 axis. Indeed, upregulation of CD127 protein and Il7r gene expression was associated with increased chromatin accessibility in some regions of the Il7r locus. The increase in CD127 expression by REC-TEX, especially the TCF-1+ subset, provides a potential mechanism for survival of REC-TEX and may reveal therapeutic opportunities. Future studies are needed to define whether these cells simply survive or also acquire TMEM-like homeostatic self-renewal.
Studies in HCV infection have shown that upon virological cure, previously exhausted HCV-specific CD8 T cells can persist and respond to reinfection37, 48. It has been unclear, however, how the recall responses of previously exhausted CD8 T cells compare to bona fide TMEM. By comparing REC-TEX to TMEM directly in a co-transfer setting, we were able to control for key confounding variables since both cell types were present at the same numbers, in the same inflammatory environment and responding to the same level of antigen throughout the reinfection. Under these conditions, re-expansion of REC-TEX was suboptimal and the responding cells were incapable of generating appropriately differentiated secondary TEFF. Indeed, REC-TEX gave rise to cells biased towards TEX rather than TEFF upon rechallenge. It should be noted, however, that REC-TEX were not devoid of any recall capacity and might, in some settings such as chronic infections, provide some degree of protection. Moreover, it is possible that longer periods of antigen-free recovery could improve REC-TEX differentiation, though even after >500 days, REC-TEX retain higher Tox. Nevertheless, these observations make several key points. First, when compared on a per cell basis REC-TEX were inferior to TMEM for critical properties, such as response to reinfection. Second, the phenotypic and transcriptional similarity of REC-TEX to TMEM does not predict future T cell responses. Third, REC-TEX rapidly upregulate PD-1 upon rechallenge infection, but PD-1 expression alone does not explain inferior recall responses. It is possible that in other settings of more protracted or chronic rechallenge infections or cancer recurrence there may be more benefit to blocking the PD-1 pathway. Nevertheless, these data support the notion of broad, pervasive and durable imprinting of the TEX program that is at least partially retained in REC-TEX.
TEX are epigenetically divergent from TEFF and TMEM, suggesting that TEX are a distinct state or differentiation branch of mature CD8 T cells11–13, 16. This TEX open chromatin landscape remains largely fixed upon PD-1 pathway blockade11. However, it has been unclear whether TEX open chromatin landscape remodeling would occur upon “cure” of chronic infections. Our data, rather, find a highly stable open chromatin landscape following removal of chronic antigen stimulus. Indeed, chromatin accessibility in the regulatory regions of many exhaustion genes, like Tox and Pdcd1 remained similar to the original TEX. The consequence of these patterns was a more rapid and robust upregulation of exhaustion-related gene-products, like PD-1, upon rechallenge. In addition, the accessibility of the overall TEFF open chromatin landscape remained essentially unchanged following antigen elimination. This effect also extends to poor ability to access TEFF transcriptional circuits upon reinfection, resulting in limited effector function and reduced expression of canonical TEFF protein markers, such as KLRG1. One consequence of this epigenetic stability is that REC-TEX maintain a pattern of transcription factor binding site (TFBS) accessibility that remains largely unchanged from TEX. Aside from the notable, and likely functionally important, changes in accessibility of Tcf7 TFBS, much of the potential for different TF to function remains hardwired to the TEX cellular identity. It is possible that coaxing changes in the epigenetic landscape through epigenetic or immunological drugs, might enhance changes in the chromatin landscape upon cure of chronic diseases. However, after a cure that mimics a non-immunological intervention, such as highly effective antiviral treatment, “scars” of the exhaustion epigenetic program remain and strongly influence the future responses of REC-TEX.
Antiviral cures for chronic LCMV infection do not exist, necessitating these adoptive transfer approaches. However, companion studies from human HCV infection (Tonnerre et al. 49, and Sen et al. 50) and other recent work 51, using direct acting antiviral treatment cures chronic viral infection, are consistent with the findings in the LCMV system. It will be interesting in the future to combine immunological and/or epigenetic therapies with cure approaches to potentially enhance the quality and durability of persisting immune memory. Such approaches may also be relevant in cancer where some types of tumors are eradicated, but relapse and recurrence remain an impediment to true long-term cures. However, our studies identify epigenetic “scars” of T cell exhaustion that persist even after cure of chronic infection. These data highlight the need to understand epigenetic plasticity of TEX more fully and also point to opportunities to improve immunity following cure of chronic disease. Moreover, these findings provide insights into how to assess and potentially manipulate the formation of long-term CD8 T cell immunity following cure of chronic infections and cancer.
METHODS
Mice.
Female C57BL/6 mice (CD45.2+) from Charles River, US National Cancer Institute (NCI) were used for infections at 5-7 weeks of age for all experiments. The numbers of mice used in each experiment are mentioned in the corresponding figure legend. P14 mice transgenic for a TCR recognizing the H-2Db GP33–41 epitope of LCMV were bred at the University of Pennsylvania (Penn). Blimp-1-yellow fluorescent protein (YFP) reporter mice from Eric Meffre, Yale University, were bred to P14 to generate P14 Blimp-1-YFP mice. All mice were kept on an NCI C57BL/6 background. Mice used in the experiments were age- and sex-matched. Mice were housed in an animal facility at Penn at ~20°C (68°F) with humidity at ~55%, and the dark/light cycle was 12h/12h. All mouse use, experiments, protocols, and breeding conditions were in accordance with Institutional Animal Care and Use Committee (IACUC) guidelines for the University of Pennsylvania, and are in compliance with the ethical guidelines of the University of Pennsylvania that comply with the US national and International guidelines.
LCMV infections.
For acute viral infections, mice were injected intraperitoneally (i.p) with 2x10⁵ plaque-forming units (PFU) of LCMV-Armstrong (LCMV-Arm). For chronic viral infections, mice were injected intravenously (i.v.) with LCMV-Cl13 (4x10⁶ PFU). Mice were infected one day post adoptive transfer of P14 cells. LCMV strains were grown in BHK cells (ATCC, CCL-10) and titrated on VERO cells (ATCC, CCL-81) using plaque assay as previously described 42.
Cell preparation.
Single-cell suspensions of splenocytes were generated by mechanically homogenizing spleens using a 70μm cell strainer. Cells were washed and red blood cells lysed using ACK lysis buffer (ThermoFisher). PBMCs were isolated using Histopaque®-1083 gradient (Sigma-Aldrich). When necessary, cells were sorted with a FACS Aria II (BD Biosciences) to >92% purity. Before sorting, CD8 T cells were enriched from total splenocytes using the EasySeptm CD8 T cell isolation Kit (StemCell) (routinely >85% purity). CD8 T cell-enrichment was also performed before adoptively transferring P14 cells to recipient mice. All in vitro T cell assays were performed using complete RPMI medium (cRPMI): RPMI-1640 (Corning/Mediatech), 10% fetal bovine serum (FBS) (ThermoFisher), 1% HEPES (ThermoFisher), 1% penicillin/streptomycin (ThermoFisher), 1% L-glutamine, and 0.1% β-mercaptoethanol (Sigma-Aldrich).
Adoptive transfers.
For primary infections, recipient mice were engrafted with 1x10³ naïve splenic P14 cells one day before infection with LCMV. For persistence experiments, total CD8+ T cells containing ~1x10⁶ congenic P14 cells (separate transfer experiments, Figure 1 and Extended Data 1), or ~1.6x10⁵ Db-GP33-specific CD8 T cells (Extended Data 2h–j), or ~2x10⁵ P14 cells of each TEX and TMEM P14 cells on distinct congenic backgrounds (co-transfer experiments, Extended Data 2a–g) were adoptively transferred into LCMV-Arm-immune recipient mice (mice that cleared a previous LCMV-Arm infection >3 weeks prior to the adoptive transfer). For subset-transfer experiments, an equal number of Prog-TEX and Term-TEX P14 cells on distinct congenic backgrounds were co-adoptively transferred into LCMV-Arm-immune congenic recipient mice, ~1.4x10⁵ cells of each subset sorted on Ly108 and PD-1 expression (Figure 3), or 1.2x10⁵ P14 cells sorted on Blimp1-YFP expression (Extended Data 5). The day of adoptive transfer day is considered d0 for all persistence experiments (Figure 1 and 3, Extended Data 1, 2, and 5). For rechallenge experiments, REC-TEX P14 cells were co-transferred with an equal number of congenically distinct TMEM or TEX, 1-1.5x10³ of each population were transferred into naïve recipient mice.
Antibodies, flow cytometry, and cell sorting.
The following fluorochrome-conjugated antibodies were used (clone mentioned in parentheses): from Biolegend: anti-CD8–BV650, Clone (53-6.7), dilution 1:200; anti-CD44–BV785 (IM7), 1:300; anti-CD44–BV785 (IM7), 1:300; anti-CD45.1–A700 (A20), 1:200; anti-CD45.1–BV605 (A20), 1:200; anti-CD45.1–BV785 (A20), 1:200; anti-CD45.1–FITC (A20), 1:200; anti-CD45.1–PB (A20), 1:200; anti-CD45.2–A700 (104), 1:200; anti-CD45.2–BV421 (104), 1:200; anti-CD45.2–BV605 (104), 1:200; anti-CD45.2–BV785 (104), 1:200; anti-CD62L–BV605 (MEL14), 1:200; anti-CD69–PE-Cy5 (H1.2F3), 1:200; anti-CD107a–A488 (1D4B), 1:500; anti-CD107a–A647 (1D4B), 1:500; anti-CD127–PE-Dazzle594 (A7R34), 1:200; anti-CD160–PE (7H1), 1:100; anti-PD-1–PE-Cy7 (RMP1-30), 1:200; anti-CX3CR1–APC (CX3CR1-173), 1:200; anti-Ly108–PB (330-AJ), 1:200; anti-T-bet–BV421 (4B10), 1:100; anti-TIGIT–PE/Dazzle594 (1G9), 1:200; anti-TIM3–BV605 (RMT3-23), 1:100; and anti-TNF–BV421 (MP6-XT22), 1:100; from eBioscience/Thermo Fisher Scientific: anti-CD4–APC-eFlour780 (RM4-5), 1:200; anti-CD27–APC-eFlour780 (LG.7F9), 1:200; anti-CD39–eFlour660 (24DMS1), 1:200; anti-CD45.2–FITC (104), 1:200; anti-CD45R/B220–APC-eFlour780 (RA3-6B2), 1:200; anti-CD62L–eFlour450 (MEL14), 1:200; anti-2B4–FITC (eBio244F4), 1:100; anti-Eomes–PE (Dan11mag); 1:100; anti-IFN-γ–PE-eFlour610 (XMG1.2), 1:100; anti-IL-2–FITC (JES6-5H4), 1:100; anti-Lag3– (eBioC9B7w), 1:100; and anti-TNF–PE-Cy7 (MP6-XT22), 1:100; from BD Biosciences: anti-CD127–PE-CD594 (SB/199), 1:200; anti-CD244.2/2B4–FITC (2B4), 1:100; anti-IFN-γ–A700 (XMG1.2), 1:100; anti-IL-2–APC (JES6-5H4), 1:100; anti-TCF1/TCF7–PE (S33-966), 1:100; anti-Ki67–A488 (B56), 1:50; and anti-Ki67–BV786 (B56), 1:50; from R&D Systems:anti-CCL3/MIP-1–APC (39624), 1:50; and anti-CCL3/MIP-1–PE (39624), 1:50; from invitrogen: anti-Eomes–PE-eFlour610 (Dan11mag); 1:100; and anti-granzyme B–PE (GB12), 1:50; from Miltenyi: anti-TOX–APC (REA473), 1:100; and from Southern Biotech: anti-KLRG1–FITC (2F1), 1:150. Tetramers of MHC class I H-2Db GP33 were obtained from the National Institute of Health (NIH) Tetramer Core, dilution 1:300/1:400. Dead cells were excluded using Live/Dead Fixable Aqua Dead Cell Stain Kit, from invitrogen/ThermoFisher, dilution 1:600.
Cells were sorted using a 70 μm nozzle in RPMI 50% FBS maintained at 4°C using a circulating cool-down system. Purity for all samples presented in the figures was >92% (mean 97.9%). The following gating strategies were used for sorting: P14 cells were sorted based on GP33-tetramer+ live CD8+ congenic marker+ (CD45.1, CD45.2). For Blimp1-YFP subsets, progenitor TEX and terminal TEX were sorted based on YFP+ and YFP−, respectively. Flow cytometry data were acquired on a BD LSR II instrument. Cell sorting was performed on a BD FACS-Aria. Data were analyzed using FlowJo software V10.1r7 (FlowJo, LLC).
Staining for flow cytometry.
Surface staining; cell suspensions were surface stained with indicated antibodies for 30 min at 4°C. Dead cells were excluded using Live/Dead (1/600, ThermoFisher) added concurrently with surface antibodies. Intracellular staining was conducted at 4°C for 1 hour. Intracellular cytokine staining; evaluation of in vitro cytokine production was performed by incubating 2x10⁶ cells in 96-well plates for 5h at 37oC 5% CO2 in cRPMI supplemented with GolgiStop (1/250; BD bioscience), GolgiPlug (1/500; BD bioscience), and CD107a antibodies (1/500). The cells were re-stimulated with GP33 peptide 0.4 μg/ml (GenScript) to test specific production of cytokines by P14 cells, or re-stimulated with GP276 peptide 0.4 μg/ml (GenScript), or left unstimulated as controls. The cells were stained for surface antigens, then fixed and stained for intracellular cytokines using the BD Fixation/permeabilization kit (BD Bioscience) according to manufacturer’s instructions. Intracellular and nuclear staining of transcription factors; following staining for surface antigens, FoxP3 staining kit (eBioscience/ThermoFisher) was used to stain TFs according to manufacturer’s instructions.
Blockade of PD-1/PD-L1 pathway.
PD-L1 blockade was performed by i.p. injections of 200μl of PBS or PBS containing 200mg rat anti-mouse PD-L1 monoclonal antibody, clone 10F.9G2, from BioXcell, Catalog# BE0101. The injections were performed on days 1, 4, and 7 post-infection with LCMV-Arm.
Cytotoxicity assay.
Splenocytes from naïve CD45.2 C57BL/6 mice were coated with 0.4mM of GP33-41 peptide (specific target cells) or non-coated cells (non-specific cells). Specific target cells and non-specific cells were stained with CTV at 0.5 and 10mM, respectively. Specific target cells and non-specific cells were incubated with sorted REC-TEX or TMEM cells (effector to target, E:T = 2:1) or without effector cells as controls for 16 hours in cRPMI. Percentage of specific killing was calculated as: 100 – [(100 x % specific target cells) / % specific target cells without effector cells].
Flow cytometry analysis and calculations.
For analysis of polyfunctionality and inhibitory receptor co-expression; positive gates for each parameter were created in FlowJo (V10.1.r7, Tree Star) and the Boolean tool was used to evaluate the frequency of cells in each possible combination of markers for each sample of interest. Background is not subtracted in the summary of these data. To normalize for MFI at different time points, MFI was calculated in reference to naïve cells. For Spider/Radar plot, MFI of TEX and REC-TEX was calculated as a percentage of TMEM and normalized in reference to TMEM at both time points for individual experiments, and the mean was presented on the plot.
Single-cell RNA-seq (scRNAseq) library preparation and analysis.
LCMV-specific P14 cells were sorted from mice infected with LCMV-Arm or LCMV-Cl13, as well as mice that received donor P14 TEX or TMEM. Splenocytes from mice within the same group were pooled, enriched for LCMV-specific CD8+ T cells, and stained with surface antibodies as described above. Live CD8+ congenic (CD45.1+ or CD45.1/2+) LCMV-GP33-tetramer+ P14 cells were FACS-sorted (1.18–2.4 x10⁴ cells), used to generate single-cell gel-beads in emulsion, and counted using a Countess II Automated Cell Counter (Thermo Fisher Scientific) prior to library preparation. Cells were loaded onto the Chromium Controller (10x Genomics) for a target recovery of 5,000 single cells. The scRNAseq libraries were generated using Chromium Single Cell 3′ Library and Gel Bead Kit v2 (10x Genomics) according to the manufacturer’s protocol. Briefly, emulsions were created and, after reverse transcription, gel-beads in emulsion were disrupted. Barcoded complementary DNA was isolated and amplified by PCR (12 cycles). Following fragmentation, end repair and A-tailing, sample indexes were added during index PCR (8 cycles). Samples were pooled and quantified using a KAPA Library Quantification Kit (Kapa Biosystems) prior to sequencing. Normalized pooled libraries were diluted at 1.8 ρg/ml loaded onto a NextSeq 500/550 High Output Flow Cell (Kit v2, 150 cycles, 400M reads, Illumina) and paired-end sequencing was performed on a NextSeq550 sequencer (Illumina). Sample demultiplexing, barcode processing, alignment, filtering, unique molecular identifier (UMI) counting and aggregating sequencing runs were performed using Cell Ranger software v.2.1.0 (10x Genomics). A total of 14,787 cells were recovered from all libraries, with 29,085 mean reads and 675 median genes detected per cell (3163 naïve cells, 3861 TMEM, 1964 transferred-TMEM, 3756 TEX, and 2043 REC-TEX). Downstream analysis was performed using Seurat v2.3 52. Briefly, individual library outputs from the Cell Ranger pipeline were loaded, and cells with fewer than 200 detected genes were excluded from downstream analysis. Genes detected in fewer than three cells across the dataset were also excluded. Raw UMI counts were normalized by total expression in the corresponding cell and multiplied by a scaling factor of 10,000 to give UMI count per million total counts and then log-transformed. Variable genes were selected based on average expression and dispersion. Linear dimensional reduction (PCA) was performed using variable genes and the first 7 principal components were determined to be significant using the jackstraw method. tSNE was performed on these significant principle components using default parameters for 1,000 iterations for visualization in two dimensions. Unsupervised clustering was performed using a shared nearest neighbor modularity optimization-based algorithm. Optimal number of clusters was chosen using Identifying K mAjor cell Population groups (IKAP) algorithm 53. Differential expression analysis was performed between each cluster and all other cells using a Wilcoxon rank sum test. Marker genes were identified by the Seurat function FindAllMarkers. Scaled expression data of these marker genes were used for creating the heatmaps. Normalized data are shown in the form of feature plots or violin plots. Trajectory analysis was performed with Monocle v.2 conducted using Monocle 2 v2.10.1 (Qiu et al., 2017b, 2017a). Gene ontology analysis was performed using maker genes in Metascape 3.0 54 (http://metascape.org). Network analysis was performed using Ingenuity Pathway Analysis (IPA) (QIAgen®).
ATACseq library preparation and analysis.
Using the same sorting parameters used for scRNAseq, P14 cells per replicate were sorted from spleens of mice into RPMI medium with 50% FBS (1–1.2x10⁴ cells for REC-TEX, and 4–5x10⁴ for other cell types). ATACseq sample preparation was performed as described 46 with minor modifications. Briefly, sorted were washed twice in cold PBS and resuspended in 50 μl of cold lysis buffer (10nM Tris-HCl, pH 7.4, 10mM NaCl, 3mM MgCl2, 0.1% Tween). Lysates were centrifuged (750xg, 10min, 4°C) and nuclei were resuspended in 50μl of transposition reaction mix (TD buffer [25μl], Tn5 Transposase [2.5μl], nuclease-free water [22.5μl]; (Illumina)) and incubated for 30min at 37°C. Transposed DNA fragments were purified using a Qiagen Reaction MiniElute Kit, barcoded with NEXTERA dual indexes (Illumina) and amplified by PCR for 11 cycles using NEBNext High Fidelity 2x PCR Master Mix (New England Biolabs). PCR products were purified using a PCR Purification Kit (Qiagen) and amplified fragments size was verified on a 2200 TapeStation (Agilent Technologies) using High Sensitivity D1000 ScreenTapes (Agilent Technologies). Libraries were quantified by qPCR using a KAPA Library Quant Kit (KAPA Biosystems). Normalized libraries were pooled, diluted at 1.8μg/ml loaded onto a TG NextSeq 500/550 Mid Output Kit v2.5 (150 cycles, 130 million reads, Illumina) and paired-end sequencing was performed on a NextSeq550 sequencer (Illumina). Raw ATACseq FASTQ files from paired-end sequencing were processed using the script available at the following repository (https://github.com/wherrylab/jogiles_ATAC). Samples were aligned to the GRCm38/mm10 reference genome using Bowtie2. We used samtools to remove unmapped, unpaired, and mitochondrial reads. ENCODE blacklist regions were also removed (https://sites.google.com/site/anshulkundaje/projects/blacklists). PCR duplicates were removed using Picard. Peak calling was performed using MACS v2 (FDR q-value 0.01). For each experiment, we combined peaks of all samples to create a union peak list and merged overlapping peaks with BedTools merge. The number of reads in each peak was determined using BedTools coverage. Differentially accessible peaks were identified following DESeq2 normalization using an FDR cut-off <0.05 unless otherwise indicated. Tracks were visualized using Integrative Genomics Viewer (v.2.3.77, Broad Institute) and GVIZ package on R 55. Gene-to-peak associations were determined using the GREAT software package (v.3.0.0, http://bejerano.stanford.edu/great/public/html/) with default settings. Pearson correlations between samples were calculated in R and plotted. PCA was carried out using R (v.3.3.1, R Core Team). Gene ontology term enrichment was performed for each biological condition using GREAT, with default settings and binomial enrichment 56. Motif enrichment analysis was performed using HOMER (v.4.6) with default settings 57. Transcription Factor Binding Site (TFBS) analysis and PageRank analysis were performed using Taiji 58. Statistical analysis of differential chromatin accessibility tests was done using DESeq2 (v.1.18.1), and FDR correction was performed using the Benjamini-Hochberg method in R (v.3.3.1). Significance of gene ontology term enrichments and motif enrichments were calculated with binomial tests and hypergeometric tests. P values and q values <0.05 were considered to indicate a significant difference.
Quantification and statistical analysis.
For each figure the number of replicates for each experiment is indicated in the legend. In the figures, mean and standard deviations (S.D.) are presented, error bars represent the ± S.D. Paired two-tailed t-tests were run on comparisons for co-transfer experiments (Wilcoxon matched-pairs signed rank test), and all other data were analyzed using unpaired two-tailed Student’s t-tests (Mann-Whitney test). Prism 6 (GraphPad Software) was used to calculate statistics. For adoptive transfer time points each individual point represents pooled P14 cells from one infection-matched mouse group, for all other time points individual points represent one mouse.
Data availability.
All data generated during this study are available within the paper. All sequencing data from this study are deposited in the National Center for Biotechnology Information Gene Expression Omnibus (GEO) and are accessible through a GEO Series accession code GSE150370. Any other relevant data are available from the corresponding author on request.
Diagrams.
All diagrams were created using Biorender.com.
Co-submitted articles.
Extended Data
Extended Data Fig. 1. Upon antigen elimination TEX downregulate several exhaustion markers and upregulate some TMEM features.

(a) General gating strategy; dot plots in all figures are for transferred donor P14 cells gated on live CD8+ congenic cells. For surface stains, cells were also gated on Db-GP33 tetramer+ cells (yellow rectangle). (b) Representative dot plots for the association between TCF-1 and Ly108 (Slamf6) expression on the day of adoptive transfer (d0), and d28 post-transfer. (c) Left, representative dot plots of Ly108 and PD-1 expression. Right, percentages of different TEX subsets. N=9 biologically independent experiments for d0 and n=4 for d28. (d) Left, representative histograms for CD127. Right, CD127 expression as ΔMFI, corresponding to Figure 1c. (e) Left, representative histograms for Eomes. Right, Eomes expression as ΔMFI, corresponding to Figure 1e. Data presented in (c-e) as mean +/− SD. (f) Representative dot plots of cytokine production (IFNγ) and LAMP-1 (CD107a) expression on unstimulated splenocytes, corresponding to Figure 1g. (g) Left, experimental model, stability of TEX P14 phenotype post-transfer was examined at day >180 post-transfer (d193-d570) into infection-free mice. Top row, representative dot plots of CD127 and PD-1, CD127 and CD62L, and TCF-1 and Tim-3 expression. To the right of dot plots, percentages of the different TEX subsets, either compared to compared to TMEM P14 cells from mice that cleared LCMV-Arm (d67-d238 p.i.). Bottom, representative histograms of Tox expression. To the right of histograms, levels of Tox expression. N=2 biologically independent experiments, 2-5 REC-TEX mice/experiment. Data presented as mean +/− SD. All analyses for Extended Data 1 performed by unpaired two-tailed Student’s t-tests (Mann-Whitney test). *p<0.05, **p<0.01, ***p<0.001, ****p<0.0001.
Extended Data Fig. 2: REC-TEX display an intermediate phenotype between TEX and TMEM in the P14 co-transfer or DbGP33 tetramer+ non-P14 transfer approaches.

a) Experimental design for co-transfer of TEX and TMEM. (b) Left, dot plots showing percentages of co-transferred TEX and TMEM P14 cells on d0 and d28 post-transfer. Right, fold change in number of donor TEX and TMEM P14 cells on d28 post-transfer relative to the original number adoptively transferred on d0 (estimating 10% take). N=3 biologically independent experiments, 2-4 mice/experiment. (c) Number of TEX and TMEM P14 cells per million CD8 T cells from peripheral blood mononuclear cells (PBMCs) longitudinally as a percentage of the number of cells calculated at baseline (d2.5 post-transfer). N=1 experiment, 4-7 mice/time-point. Data presented as mean +/− S.E.M. Comparisons versus d2.5 analyzed by unpaired two-tailed Student’s t-tests (Mann-Whitney test). (d) Left, representative dot plots of CD127 and PD-1, and TCF-1 and Tim-3 expression. Right, percentages of different subsets. (e) Left panels, representative histograms for expression of indicated markers. Right, plots of ΔMFI. Data for (d-e) for PD-1 and CD127 n=3 independent experiments, and for Tox and TCF-1 n=1. Analyses for (b, d) paired two-tailed t-test (Wilcoxon matched-pairs signed rank test). *p<0.05, **p<0.01. (f) Left, representative dot plots for TIGIT and PD-1 expression. Right, percentages of IRs co-expression on P14 cells. N=1 experiment. (g) Left, representative dot plots of IFNγ production and LAMP-1/CD107a expression on P14 cells. Left, percentages of polyfunctionality on P14 cells. N=2 independent experiments. For (b-g) red and blue percentages are for TEX and TMEM P14 cells, respectively. Data for d28 from 2-4 mice per experiment. (h) Experimental design for adoptive transfer of CD8+ T cells containing DbGP33-specific TEX or TMEM. (i) Left, representative dot plots for CD127 and PD-1 expression on donor Db-GP33 specific T cells. Right, percentages of different subsets. (j) Left, representative histograms for level of expression of PD-1 or CD127. Right, plots for level of expression of PD-1 and CD127. Data (i-j) n=2 independent experiments, 3-8 mice/group/experiment for d28. Data presented as mean +/− SD. Analyses for (i-j) by unpaired two-tailed Student’s t-tests (Mann-Whitney test). ***p<0.001, ****p<0.0001.
Extended Data Fig. 3. REC-TEX are transcriptionally distinct from both TEX and TMEM.

(a) Top, general gating strategy for sorting; sorted cells were gated on live CD8+ DbGP33-tetramer+ cells. Bottom, dot plots showing purity post-sorting for samples used for scRNAseq. (b) tSNE plot of unsupervised clustering of combined TEX, TMEM, and REC-TEX cells. (b) Contribution of TEX, TMEM, and REC-TEX to each cluster in (b). (c) Heatmap of the top differentially expressed genes (DEGs) between TEX, TMEM, and REC-TEX. (d) Violin plots for genes differentially expressed by REC-TEX compared to both TEX and TMEM. (e) tSNE plots of TEX, TMEM, and REC-TEX cells with overlay of Pdcd1, Lag3, and Gzmb genes.
Extended Data Fig. 4. REC-TEX are transcriptionally heterogeneous and distinct from the TCF-1+ TEX subset.
a) Circos plots of different REC-TEX clusters compared to TEX and TMEM signatures. (b) Violin plots for individual gene expression by the different REC-TEX clusters from Figure 2c. (c) Pseudotime plot of TEX and REC-TEX with overlay of Tox (d) Pseudotime plot of TEX and REC-TEX with overlay of upregulated gene signature in TCF-1− TEX subset from Utzschneider et al. 25. (e) Volcano plot showing selected differentially expressed genes between TCF-1+ TEX and REC-TEX.
Extended Data Fig. 5. Partial recovery from exhaustion in REC-TEX is associated with preferential survival of the progenitor TEX subset.

(a) Left, representative dot plot of TCF-1 expression in Blimp1-YFP TEX P14 cells on d20 p.i. with LCMV-Cl13. Middle, dot plots showing sorting purity of Blimp1-YFP− (i.e. TCF-1+) progenitor TEX (Prog-TEX) and Blimp1-YFP+ (i.e. TCF-1−) terminal TEX (Term-TEX). Right, experimental design for co-transfer of Prog-TEX and Term-TEX into infection-free recipient mice. (b) Left, representative dot plots for frequency of donor Blimp1-YFP− Prog-TEX or Blimp1-YFP+ Term-TEX P14 cells, on the day of adoptive transfer (d0) and d26 post-transfer. Middle, number of P14 cells for Prog-TEX and Term-TEX on d0 and d26 post-transfer (estimating 10% take on d0). Right, absolute number of P14 cells per spleen for each subset on d26 post-transfer. (c) Left, representative dot plots of CD127 and PD-1 expression. Right, percentages of CD127+ or PD-1+CD127− for both subsets on d0 and d26 post-transfer, and absolute numbers per spleen of CD127+ cells for each subset on d26 post-transfer. (d) Left, representative histograms for expression of CD127 or PD-1 on Prog-TEX and Term-TEX on d0 and d26 post-transfer, and on endogenous GP33-tetramer+ TMEM of recipient mice on d26 post-transfer. Right, plots for MFIs. Data from one experiment, 2 mice.
Extended Data Fig. 6. Secondary effectors derived from REC-TEX and TMEM are distinct phenotypically and functionally.

(a) Representative dot plots showing sorting purity. (b) Representative dot plot for the frequency of co-transferred donor REC-TEX and TMEM P14 cells, on d-1. (c) Absolute number of TEX and REC-TEX P14 cells per spleen on d8 post challenge with LCMV-Arm. N=1 experiment, 3 mice. (d) Representative dot plots and plots for PD-1 and KLRG1 expression from different organs. Data representative of two independent experiments, 4-5 mice. (e) Representative dot plots of cytokine production (IFNγ and TNF) and CD107a expression on unstimulated splenocytes. Corresponding to Figure 4e. (f) Cytotoxicity assay of secondary effector cells (d8 post LCMV-Arm challenge) from separately transferred REC-TEX or TMEM P14 cells into naïve mice. Left, plots of % specific killing for REC-TEX compared to TMEM. Middle and right, number of effector cells and ratio of effector:target cells in REC-TEX containing wells compared to TMEM wells. N=1 experiment. Data presented as mean +/− SD. Unpaired two-tailed Student’s t-tests (Mann-Whitney test). (g) Percentages of CD127+CD62L+ and Tox+PD-1+, and expression of PD-1, Tox and Eomes on co-transferred REC-TEX and TMEM P14s at d30 post-challenge with LCMV-Arm. N=2 biologically independent experiments, 2-5 mice/experiment. (h) Absolute number per spleen for cells derived from TMEM and REC-TEX P14 cells (left), endogenous CD8+ T cells (middle), and endogenous GP33-tetramer+ cells (right), on d8 post LCMV-Arm challenge. (i) Left, representative dot plots of T-bet and Eomes expression. Right, percentages of Eomes+T-bet+. (j) Left, representative dot plots for GzmB expression. Right, percentages of GzmB expressing cells. (k) Left, histograms for expression of Tox and T-bet. Right, plots for levels of expression as ΔMFI (compared to naïve). (l) Representative dot plots and plots for PD-1 and KLRG1 from different organs from anti-PD-L1 treated mice compared to control PBS-treated mice. Data for (h-l) N=2 biologically independent experiments, 2-4 mice/group/experiment. All analyses for Extended Data 6, for co-transferred cells performed by paired two-tailed t-test (Wilcoxon matched-pairs signed rank test). PBS versus αPD-L1 (h-l) analyzed using unpaired two-tailed Student’s t-tests (Mann-Whitney test). *p<0.05, **p<0.01, ***p<0.001.
Extended Data Fig. 7. REC-TEX remain epigenetically similar to TEX and bear signatures from both the TCF-1+ and TCF-1− TEX subsets.

(a) Representative dot plots showing sorting purity for ATACseq samples. (b) Correlation of normalized peak enrichment between replicates of for ATACseq samples for each cell type. R2 indicates degree of correlation between replicates at p<2.2e-16, calculated by Spearman correlation. (c) Pearson correlation of ATACseq profiles from TEX, TMEM, and REC-TEX samples. (d) Principal component analysis (PCA) of ATACseq profiles for naïve, TEX, TMEM, and REC-TEX P14 cells. (e) Venn diagram showing the overlap between OCRs significantly open in REC-TEX versus TEX (REC-TEXUP_vsTEX) (from Fig. 5b) and UP_TMEM _vsTEX. (f) Representative ATACseq tracks at indicated loci from naïve, TEX, TMEM, and REC-TEX. (g) PCA of ATACseq profiles for TEX, TMEM, and REC-TEX samples from our current dataset compared to TMEM, CXCR5− Tim-3+ TEX and CXCR5− Tim-3+ TEX from Jadhav et al. 32 (h) Heatmap showing chromatin accessibility of CXCR5− Tim-3+ TEX and CXCR5− Tim-3+ TEX from Jadhav et al. 32 for the 182 differential peaks from REC-TEX vs. TEX signature of the current dataset (presented in Figure 6b). (i) Representative ATACseq tracks at indicated loci from TEX and REC-TEX samples from the current dataset compared to the four TEX subsets from Beltra et al. 29
Extended Data Fig. 8. Correlation between transcriptional and epigenetic profiles of REC-TEX identifies epigenetically fixed networks.

(a) Genes from scRNAseq with significantly different expression between REC-TEX and TMEM that also had associated significant differences in the chromatin accessibility. (b) Bubble plot showing significantly different biological processes associated with significantly different OCRs between REC-TEX and TMEM identified by GREAT. (c) TFs with significantly enriched motifs in OCRs in REC-TEX versus TMEM (top half, purple circles) or in TMEM versus REC-TEX (bottom half, blue circles). Pairwise analysis using HOMER. −log10 p-value calculated by hypergeometric distribution test. (d) Venn diagrams showing the overlap in TFBS between TEX, TMEM, and REC-TEX for some transcription factors from PageRank analysis (Figure 6g), Tcf7, Hic1 and Hsf1. (e) Heatmap of the 58 OCRs showing significantly differential accessibility in REC-TEX compared to TEX from the ΔTox-TEX versus wild-type TEX signature by Khan et al. 17.
Extended Data Fig. 9. Eliminating chronic antigen stimulation induces varying degrees of transcriptional and epigenetic recovery in TEX.

Upon eliminating chronic antigen stimulation, exhausted T cells (TEX) failed to fully differentiate into bona fide memory T cells (TMEM), but rather gave rise to cells with mixed exhaustion and memory features, recovering-TEX cells (REC-TEX). The degree of phenotypic and transcriptional recovery towards memory was not associated with a similar degree of recovery in recall capacity, mainly due to limited changes in the chromatin accessibility landscape. Ag, antigen; IL-7, interleukin-7; MPEC, memory precursor effector cells; SLEC, short-lived effector cells; and TEFF, effector T cells.Diagram created with Biorender.com.
Supplementary Material
ACKNOWLEDGMENTS
We thank members of the Wherry Lab for insightful comments, critical reading of the manuscript and advice. This work was supported by NIH grants AI155577, AI105343, AI115712, AI117950, AI108545, AI082630 and CA210944 (to E.J. Wherry). E.J. Wherry is supported by the Parker Institute for Cancer Immunotherapy which supports the cancer immunology program at UPenn. M.S. Abdel-Hakeem is a Cancer Research Institute (CRI) Irvington Postdoctoral Fellow, and is supported by Fonds de Recherche Québec—Santé (FRQS), and Canadian Network on Hepatitis C (CanHepC) Postdoctoral Fellowships. CanHepC is funded by a joint initiative from CIHR (NHC-142832) and the Public Health Agency of Canada.
Footnotes
COMPETEING INTERESTS
E.J.W. is a member of the Parker Institute for Cancer Immunotherapy. E.J.W. has consulting agreements with and/or is on the scientific advisory board for Merck, Elstar, Janssen, Related Sciences, Synthekine and Surface Oncology. E.J.W. is a founder of Surface Oncology and Arsenal Biosciences. E.J.W. has a patent licensing agreement on the PD-1 pathway with Roche/Genentech. The remaining authors declare no competing interests,
REFERENCES
- 1.Kaech SM & Cui W Transcriptional control of effector and memory CD8+ T cell differentiation. Nat Rev Immunol 12, 749–761 (2012). [DOI] [PMC free article] [PubMed] [Google Scholar]
- 2.McLane LM, Abdel-Hakeem MS & Wherry EJ CD8 T Cell Exhaustion During Chronic Viral Infection and Cancer. Annu Rev Immunol 37, 457–495 (2019). [DOI] [PubMed] [Google Scholar]
- 3.Wherry EJ, Blattman JN, Murali-Krishna K, van der Most R & Ahmed R Viral persistence alters CD8 T-cell immunodominance and tissue distribution and results in distinct stages of functional impairment. J Virol 77, 4911–4927 (2003). [DOI] [PMC free article] [PubMed] [Google Scholar]
- 4.Wherry EJ et al. Molecular signature of CD8+ T cell exhaustion during chronic viral infection. Immunity 27, 670–684 (2007). [DOI] [PubMed] [Google Scholar]
- 5.Fuller MJ & Zajac AJ Ablation of CD8 and CD4 T cell responses by high viral loads. J Immunol 170, 477–486 (2003). [DOI] [PubMed] [Google Scholar]
- 6.Wherry EJ, Barber DL, Kaech SM, Blattman JN & Ahmed R Antigen-independent memory CD8 T cells do not develop during chronic viral infection. Proc Natl Acad Sci U S A 101, 16004–16009 (2004). [DOI] [PMC free article] [PubMed] [Google Scholar]
- 7.Shin H, Blackburn SD, Blattman JN & Wherry EJ Viral antigen and extensive division maintain virus-specific CD8 T cells during chronic infection. J Exp Med 204, 941–949 (2007). [DOI] [PMC free article] [PubMed] [Google Scholar]
- 8.Tan JT et al. Interleukin (IL)-15 and IL-7 jointly regulate homeostatic proliferation of memory phenotype CD8+ cells but are not required for memory phenotype CD4+ cells. J Exp Med 195, 1523–1532 (2002). [DOI] [PMC free article] [PubMed] [Google Scholar]
- 9.Doering TA et al. Network analysis reveals centrally connected genes and pathways involved in CD8+ T cell exhaustion versus memory. Immunity 37, 1130–1144 (2012). [DOI] [PMC free article] [PubMed] [Google Scholar]
- 10.Crawford A et al. Molecular and transcriptional basis of CD4(+) T cell dysfunction during chronic infection. Immunity 40, 289–302 (2014). [DOI] [PMC free article] [PubMed] [Google Scholar]
- 11.Pauken KE et al. Epigenetic stability of exhausted T cells limits durability of reinvigoration by PD-1 blockade. Science 354, 1160–1165 (2016). [DOI] [PMC free article] [PubMed] [Google Scholar]
- 12.Sen DR et al. The epigenetic landscape of T cell exhaustion. Science 354, 1165–1169 (2016). [DOI] [PMC free article] [PubMed] [Google Scholar]
- 13.Philip M et al. Chromatin states define tumour-specific T cell dysfunction and reprogramming. Nature 545, 452–456 (2017). [DOI] [PMC free article] [PubMed] [Google Scholar]
- 14.Mognol GP et al. Exhaustion-associated regulatory regions in CD8(+) tumor-infiltrating T cells. Proc Natl Acad Sci U S A 114, E2776–E2785 (2017). [DOI] [PMC free article] [PubMed] [Google Scholar]
- 15.Youngblood B et al. Chronic virus infection enforces demethylation of the locus that encodes PD-1 in antigen-specific CD8(+) T cells. Immunity 35, 400–412 (2011). [DOI] [PMC free article] [PubMed] [Google Scholar]
- 16.Ghoneim HE et al. De Novo Epigenetic Programs Inhibit PD-1 Blockade-Mediated T Cell Rejuvenation. Cell 170, 142–157 e119 (2017). [DOI] [PMC free article] [PubMed] [Google Scholar]
- 17.Khan O et al. TOX transcriptionally and epigenetically programs CD8(+) T cell exhaustion. Nature 571, 211–218 (2019). [DOI] [PMC free article] [PubMed] [Google Scholar]
- 18.Alfei F et al. TOX reinforces the phenotype and longevity of exhausted T cells in chronic viral infection. Nature 571, 265–269 (2019). [DOI] [PubMed] [Google Scholar]
- 19.Scott AC et al. TOX is a critical regulator of tumour-specific T cell differentiation. Nature 571, 270–274 (2019). [DOI] [PMC free article] [PubMed] [Google Scholar]
- 20.Yao C et al. Single-cell RNA-seq reveals TOX as a key regulator of CD8(+) T cell persistence in chronic infection. Nat Immunol 20, 890–901 (2019). [DOI] [PMC free article] [PubMed] [Google Scholar]
- 21.Seo H et al. TOX and TOX2 transcription factors cooperate with NR4A transcription factors to impose CD8(+) T cell exhaustion. Proc Natl Acad Sci U S A 116, 12410–12415 (2019). [DOI] [PMC free article] [PubMed] [Google Scholar]
- 22.Wang X et al. TOX promotes the exhaustion of antitumor CD8(+) T cells by preventing PD1 degradation in hepatocellular carcinoma. J Hepatol 71, 731–741 (2019). [DOI] [PubMed] [Google Scholar]
- 23.Blackburn SD, Shin H, Freeman GJ & Wherry EJ Selective expansion of a subset of exhausted CD8 T cells by alphaPD-L1 blockade. Proc Natl Acad Sci U S A 105, 15016–15021 (2008). [DOI] [PMC free article] [PubMed] [Google Scholar]
- 24.Paley MA et al. Progenitor and terminal subsets of CD8+ T cells cooperate to contain chronic viral infection. Science 338, 1220–1225 (2012). [DOI] [PMC free article] [PubMed] [Google Scholar]
- 25.Utzschneider DT et al. T Cell Factor 1-Expressing Memory-like CD8(+) T Cells Sustain the Immune Response to Chronic Viral Infections. Immunity 45, 415–427 (2016). [DOI] [PubMed] [Google Scholar]
- 26.Im SJ et al. Defining CD8+ T cells that provide the proliferative burst after PD-1 therapy. Nature 537, 417–421 (2016). [DOI] [PMC free article] [PubMed] [Google Scholar]
- 27.Wu T et al. The TCF1-Bcl6 axis counteracts type I interferon to repress exhaustion and maintain T cell stemness. Sci Immunol 1, eaai8593 (2016). [DOI] [PMC free article] [PubMed] [Google Scholar]
- 28.He R et al. Follicular CXCR5- expressing CD8(+) T cells curtail chronic viral infection. Nature 537, 412–428 (2016). [DOI] [PubMed] [Google Scholar]
- 29.Beltra JC et al. Developmental Relationships of Four Exhausted CD8(+) T Cell Subsets Reveals Underlying Transcriptional and Epigenetic Landscape Control Mechanisms. Immunity 52, 825–841 e828 (2020). [DOI] [PMC free article] [PubMed] [Google Scholar]
- 30.Hudson WH et al. Proliferating Transitory T Cells with an Effector-like Transcriptional Signature Emerge from PD-1(+) Stem-like CD8(+) T Cells during Chronic Infection. Immunity 51, 1043–1058 e1044 (2019). [DOI] [PMC free article] [PubMed] [Google Scholar]
- 31.Zander R et al. CD4(+) T Cell Help Is Required for the Formation of a Cytolytic CD8(+) T Cell Subset that Protects against Chronic Infection and Cancer. Immunity 51, 1028–1042 e1024 (2019). [DOI] [PMC free article] [PubMed] [Google Scholar]
- 32.Jadhav RR et al. Epigenetic signature of PD-1+ TCF1+ CD8 T cells that act as resource cells during chronic viral infection and respond to PD-1 blockade. Proc Natl Acad Sci U S A 116, 14113–14118 (2019). [DOI] [PMC free article] [PubMed] [Google Scholar]
- 33.Angelosanto JM, Blackburn SD, Crawford A & Wherry EJ Progressive loss of memory T cell potential and commitment to exhaustion during chronic viral infection. J Virol 86, 8161–8170 (2012). [DOI] [PMC free article] [PubMed] [Google Scholar]
- 34.Utzschneider DT et al. T cells maintain an exhausted phenotype after antigen withdrawal and population reexpansion. Nat Immunol 14, 603–610 (2013). [DOI] [PubMed] [Google Scholar]
- 35.Martin B et al. Restoration of HCV-specific CD8+ T cell function by interferon-free therapy. J Hepatol 61, 538–543 (2014). [DOI] [PubMed] [Google Scholar]
- 36.Burchill MA, Golden-Mason L, Wind-Rotolo M & Rosen HR Memory re-differentiation and reduced lymphocyte activation in chronic HCV-infected patients receiving direct-acting antivirals. J Viral Hepat 22, 983–991 (2015). [DOI] [PubMed] [Google Scholar]
- 37.Wieland D et al. TCF1(+) hepatitis C virus-specific CD8(+) T cells are maintained after cessation of chronic antigen stimulation. Nat Commun 8, 15050 (2017). [DOI] [PMC free article] [PubMed] [Google Scholar]
- 38.Feld JJ et al. Sofosbuvir and Velpatasvir for HCV Genotype 1, 2, 4, 5, and 6 Infection. N Engl J Med 373, 2599–2607 (2015). [DOI] [PubMed] [Google Scholar]
- 39.Robert C et al. Pembrolizumab versus ipilimumab in advanced melanoma (KEYNOTE-006): post-hoc 5-year results from an open-label, multicentre, randomised, controlled, phase 3 study. Lancet Oncol 20, 1239–1251 (2019). [DOI] [PubMed] [Google Scholar]
- 40.Larkin J et al. Five-Year Survival with Combined Nivolumab and Ipilimumab in Advanced Melanoma. N Engl J Med 381, 1535–1546 (2019). [DOI] [PubMed] [Google Scholar]
- 41.Pircher H et al. Molecular analysis of the antigen receptor of virus-specific cytotoxic T cells and identification of a new V alpha family. Eur J Immunol 17, 1843–1846 (1987). [DOI] [PubMed] [Google Scholar]
- 42.Odorizzi PM, Pauken KE, Paley MA, Sharpe A & Wherry EJ Genetic absence of PD-1 promotes accumulation of terminally differentiated exhausted CD8+ T cells. J Exp Med 212, 1125–1137 (2015). [DOI] [PMC free article] [PubMed] [Google Scholar]
- 43.Blattman JN et al. Estimating the precursor frequency of naive antigen-specific CD8 T cells. J Exp Med 195, 657–664 (2002). [DOI] [PMC free article] [PubMed] [Google Scholar]
- 44.Qiu X et al. Single-cell mRNA quantification and differential analysis with Census. Nat Methods 14, 309–315 (2017). [DOI] [PMC free article] [PubMed] [Google Scholar]
- 45.Miller BC et al. Subsets of exhausted CD8(+) T cells differentially mediate tumor control and respond to checkpoint blockade. Nat Immunol 20, 326–336 (2019). [DOI] [PMC free article] [PubMed] [Google Scholar]
- 46.Buenrostro JD, Giresi PG, Zaba LC, Chang HY & Greenleaf WJ Transposition of native chromatin for fast and sensitive epigenomic profiling of open chromatin, DNA-binding proteins and nucleosome position. Nat Methods 10, 1213–1218 (2013). [DOI] [PMC free article] [PubMed] [Google Scholar]
- 47.Barber DL et al. Restoring function in exhausted CD8 T cells during chronic viral infection. Nature 439, 682–687 (2006). [DOI] [PubMed] [Google Scholar]
- 48.Callendret B et al. T-cell immunity and hepatitis C virus reinfection after cure of chronic hepatitis C with an interferon-free antiviral regimen in a chimpanzee. Hepatology 60, 1531–1540 (2014). [DOI] [PMC free article] [PubMed] [Google Scholar]
- 49.Tonnerre P et al. Differentiation of exhausted CD8 T cells after termination of chronic antigen stimulation stops short of achieving functional T cell memory Nature Immunology (Accepted in principle) (2021). [DOI] [PMC free article] [PubMed] [Google Scholar]
- 50.Sen DR et al. Epigenetic scars of CD8+ T cell exhaustion persist after cure of chronic infection in humans. Nature Immunology (Accepted in principle) (2021). [DOI] [PMC free article] [PubMed] [Google Scholar]
- 51.Hensel N et al. Memory-like HCV-specific CD8+ T cells retain a molecular scar after cure of chronic HCV infection. Nature Immunology 22, 229–239 (2021). [DOI] [PubMed] [Google Scholar]
METHODS ONLY REFERENCES
- 52.Butler A et al. Integrating single-cell transcriptomic data across different conditions, technologies, and species. Nat Biotechnol 36, 411–420 (2018). [DOI] [PMC free article] [PubMed] [Google Scholar]
- 53.Chen YC et al. IKAP-Identifying K mAjor cell Population groups in single-cell RNA-sequencing analysis. Gigascience 8, giz121 (2019). [DOI] [PMC free article] [PubMed] [Google Scholar]
- 54.Zhou Y et al. Metascape provides a biologist-oriented resource for the analysis of systems-level datasets. Nat Commun 10, 1523 (2019). [DOI] [PMC free article] [PubMed] [Google Scholar]
- 55.Hahne FI, Visualizing R Genomic Data Using Gviz and Bioconductor. In: S M.E.a.D. (ed). Statistical Genomics: Methods and Protocols. Springer; New York, 2016, pp 335–351. [DOI] [PubMed] [Google Scholar]
- 56.McLean CY et al. GREAT improves functional interpretation of cis-regulatory regions. Nat Biotechnol 28, 495–501 (2010). [DOI] [PMC free article] [PubMed] [Google Scholar]
- 57.Heinz S et al. Simple combinations of lineage-determining transcription factors prime cis-regulatory elements required for macrophage and B cell identities. Mol Cell 38, 576–589 (2010). [DOI] [PMC free article] [PubMed] [Google Scholar]
- 58.Zhang K, Wang M, Zhao Y & Wang W Taiji: System-level identification of key transcription factors reveals transcriptional waves in mouse embryonic development. Sci Adv 5, eaav3262 (2019). [DOI] [PMC free article] [PubMed] [Google Scholar]
Associated Data
This section collects any data citations, data availability statements, or supplementary materials included in this article.
Supplementary Materials
Data Availability Statement
All data generated during this study are available within the paper. All sequencing data from this study are deposited in the National Center for Biotechnology Information Gene Expression Omnibus (GEO) and are accessible through a GEO Series accession code GSE150370. Any other relevant data are available from the corresponding author on request.