Abstract
T cell exhaustion is associated with failure to clear chronic infections and malignant cells. Defining the molecular mechanisms of T cell exhaustion and reinvigoration is essential to improving immunotherapeutic modalities. Here we confirmed pervasive phenotypic, functional, and transcriptional differences between memory and exhausted antigen-specific CD8+ T cells in human hepatitis C virus (HCV) infection before and after treatment. After viral cure, phenotypic changes in clonally stable exhausted T cell populations suggested differentiation towards a memory-like profile. However, functionally, the cells showed little improvement and critical transcriptional regulators remained in the exhaustion state. Notably, T cells from chronic HCV infection that were exposed to antigen for less time because of viral escape mutations were functionally and transcriptionally more similar to memory T cells from spontaneously resolved HCV infection. Thus, T cell stimulation duration impacts exhaustion recovery, with antigen removal after long-term exhaustion being insufficient for development of functional T cell memory.
Keywords: T cell exhaustion, immunological recovery, HCV infection, antiviral therapy
Introduction:
Chronic viral infections and cancer exhibit accumulating changes in antigen-specific CD8+ T cells, termed T cell exhaustion1, 2. T cell exhaustion is initiated and maintained by extended exposure to cognate antigen and inflammatory signals2, 3. Exhausted T cells (TEX) characteristically express inhibitory receptors such as PD-1 or 2B44, 5, 6, increasingly lose key functions such as cytokine secretion and proliferation3, 7, and do not differentiate into memory T cells (TMEM) as occurs after acute infection8. TEX also lack antigen-independent self-renewal9, 10 and cannot mount a swift recall response. At the end of the exhaustion spectrum, antigen-specific T cells even get physically deleted9, 11.
T cell exhaustion is reversable, for example with checkpoint inhibitor therapies targeting PD-1 and CTLA-412, 13. However, these cancer immunotherapies are effective only for some cancers and, within a disease category, only for select patient subsets—indicating that the molecular mechanisms underlying T-cell exhaustion are complex and heterogeneous14. Additionally, immune recovery is not long lasting15. Other treatment modalities aimed at invigorating T cell responses, such as therapeutic vaccines16, 17 and immunomodulatory or antigen-lowering drugs in chronic viral infection18, similarly aim at overcoming the dysfunctionality of exhausted T cells. Understanding the cellular pathways driving T-cell exhaustion and the road to sustained T cell recovery is critical for developing more effective and targeted therapies14.
While the major clinical breakthroughs in reversing T cell exhaustion have been achieved in cancer, much of our understanding of the molecular mechanisms of T cell exhaustion stems from studies of chronic viral infection, most notably with strains of LCMV in mice19. The major advantage of studying viral infection is that it readily allows analysis of T cell exhaustion in antigen-specific T cells and within the critical context of antigen burden, both of which are more difficult to define in cancer. Emerging tools to study small populations of immune cells from clinical samples enable studies of T cell exhaustion directly in humans, especially in chronic infections with HIV20, hepatitis B virus (HBV)21, 22, and hepatitis C virus (HCV)4, 23. HCV infection is particularly suited to elucidating differences in the regulation of of T cell differentiation. HCV is the only chronic viral infection with a complete dichotomy in natural outcome24: an estimated 20–30% of infected individuals completely clear the virus, typically within 6 months, allowing direct comparison of T cell memory and exhaustion within the same pathogen and host framework25. Additionally, HCV is the first, and so far only, chronic viral infection that can be completely terminated using direct-acting antivirals (DAA)26, enabling study of whether termination of antigen exposure enables exhausted T cell populations to re-differentiate into effective T cell memory. Such work has revealed important insights, including T cell proliferation recovery after antigen clearance in parallel to the expansion of pre-existing CD127+ PD-1+ TCF-1+ memory-like T cells27, 28. Nevertheless, these memory-like CD8+ T cells are partially different from actual TMEM after acute infection27, 29, 30, indicating the need for more detailed analyses to understand the molecular trajectories of TEX after antigen removal and the hurdles to achieving full memory potential.
In this study, we utilized the paradigm of chronic HCV infection and DAA treatment to further define the features of T cell exhaustion in humans, and the potential for reversion of exhaustion after antigen removal. A specifically designed clinical DAA trial that incorporated leukapheresis collection at specified timepoints allowed us to perform broad and deep T cell studies from the same peripheral blood mononuclear cell (PBMC) collections in the context of a well-defined clinical perturbation. After cure, we documented pervasive phenotypic changes in clonally stable exhausted T cell populations suggesting differentiation towards memory, but function and critical transcriptional regulators were mostly fixed in the exhausted T cell state. We also provide evidence that T cell dysregulation solidifies with the duration of exhaustion, indicating a limited window of opportunity early in chronic infection.
Results:
DAA treatment trial for immunological studies of viral cure.
To determine the impact of antigen removal in a state of chronic viral infection, we designed a DAA treatment trial for HCV infection, generating optimal samples for immunological studies. We were able to study 20 of 25 long-term HCV-infected patients who received 12 weeks of paritaprevir/ritonavir/ombitasvir + dasabuvir + ribavirin31 (Supplementary Table 1). PBMC collections were scheduled at structured intervals pre-, during, and post-therapy, including at least two leukapheresis collections at weeks 0 and 24. A typical yield of 1010 PBMCs per leukapheresis procedure allowed us to perform all CD8+ T cell assays reported in this manuscript on cells from the same research blood collection with large virus-specific T cell populations, despite the low frequency of HCV-specific CD8+ T cells in the blood.
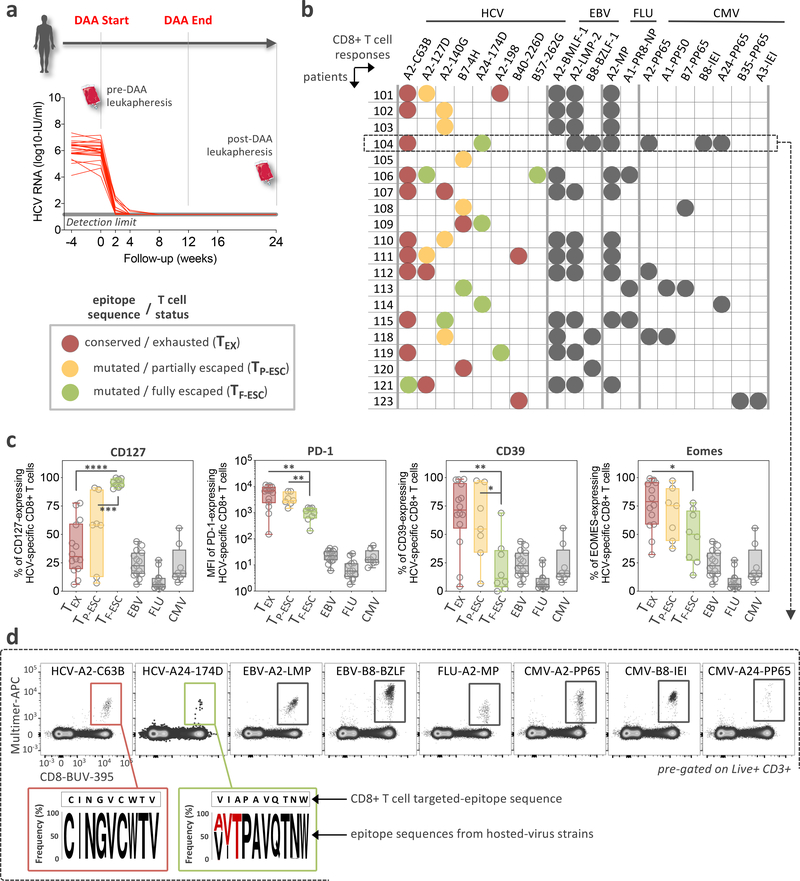
First, we screened all patients for the presence of HCV-specific CD8+ T cells using HLA class I multimers matching their expressed HLA alleles at baseline and 12 weeks after cessation of treatment (Fig. 1a and Extended Data Fig. 1a,b). Even extremely low-frequency HCV-specific T cell populations were analyzable after magnetic bead enrichment of multimer-positive cells from up to 108 PBMCs. After DAA treatment, these low frequencies remained stable or declined to even lower levels (Extended Data Fig. 1c,d). In parallel, we also determined the sequence of each targeted epitope in the viral populations circulating in each patient using next generation viral sequencing (Fig. 1b and Extended Data Fig. 2a). Based on these results, we tested whether the identified CD8+ T cell responses were able to recognize the currently dominant viral variants (Extended Data Fig. 2b). This test is critical for T cell assay interpretation, since, similar to HIV, HCV can escape T cell recognition via the emergence of viral variants that impede T-cell receptor (TCR) binding or activation. Importantly, and in contrast to HIV, viral escape from T cells in HCV is only observed in the early phase of infection, i.e., within a year after exposure32, 33. This phenomenon means that T cells targeting escaped epitopes received antigen signal for only a limited time, with limited or no TCR signal afterwards, while remaining in the same inflammatory environment. Thus, T cells targeting escaped epitopes are suitable controls for the impact of the duration of TCR stimulation on T cells. We detected T cell responses targeting both preserved and escaped T cell epitopes in most patients (Fig. 1b and Extended Data Fig. 2) and classified them as follows. When the epitope sequence matched the sequence of the circulating virus, we considered these T cells with full recognition of the autologous virus as likely to be exhausted and therefore labeled them TEX. If viral sequencing detected a dominant population of viral variants different from the prototype epitope, we performed functional testing of HCV-specific CD8+ T cells with both wild-type and variant peptides. This allowed us to determine whether viral variants completely abrogated peptide recognition or only diminished the T cell response (Fig. 1b and Extended Data Fig. 2). Complete abrogation of a response against a viral variant can only be explained by priming with the prototype sequence followed by viral evolution, i.e. viral escape mutation, and thus these T cell responses were categorized as full escape, or TF-ESC23, 32, 33, 34. Variants with partial recognition by the T cells were labeled as partial escape, or TP-ESC33. We cannot rule out that TP-ESC sequences were already primed by the variant sequence, and thus we focused most of our analyses on TEX and TF-ESC. Importantly, different viral recognition patterns were associated with distinct expression patterns of memory- and exhaustion-related molecules, supporting the classification of T cell responses as proposed (Fig. 1c). Furthermore, we observed that TEX frequencies typically decreased after viral control, whereas frequencies of T cells targeting escaped epitopes remained stable or even slightly increased post-therapy (Extended Data Fig. 1d), further substantiating the difference in TCR signaling depending on the current epitope sequence. As non-HCV controls, we identified CD8+ T cell populations targeting different acute and chronic viruses (influenza, EBV and CMV) that also would not undergo changes in antigen stimulation levels during HCV DAA therapy (Fig. 1b,d).
Figure 1: Study design, patients and virus-specific CD8+ T cell responses.
a, Overview of the clinical trial phases and longitudinal monitoring of HCV viral load. b, Study-subject virus-specific CD8+ T cell responses detected by MHC class I multimers. Targeted HCV-epitopes were sequenced and grouped as “conserved / exhausted (TEX)” (red circles), “mutated / partially escaped (TP-ESC)” (orange circles), or “mutated / fully escaped (TF-ESC)” (green circles) according to subsequent testing of the T cell recognition of the variant compared to wild-type epitopes through intracellular staining of IFNγ (Extended Data Fig, 2). c, Dot plot histograms displaying CD127, PD-1, CD39 and Eomes expression by HCV-specific TEX, TP-ESC and TF-ESC as well as by EBV-, FLU- and CMV-specific T cells, pre-DAA therapy. Box plots show the median (vertical bar), 25th and 75th percentiles (lower and upper bounds of the box, respectively) and 1.5 times the interquartile range (or minimum/maximum values if they fall within that range; end of whiskers). Statistical testing by Mann-Whitney tests (unpaired, nonparametric, two-sided), *P < 0.05, **P < 0.01, ***P < 0.001, ****P < 0.0001. d, Representative flow cytometry plots of virus-specific CD8+ T cells from patient 104, and related HCV epitope-sequences.
Phenotypic changes in clonally stable HCV-specific TEX.
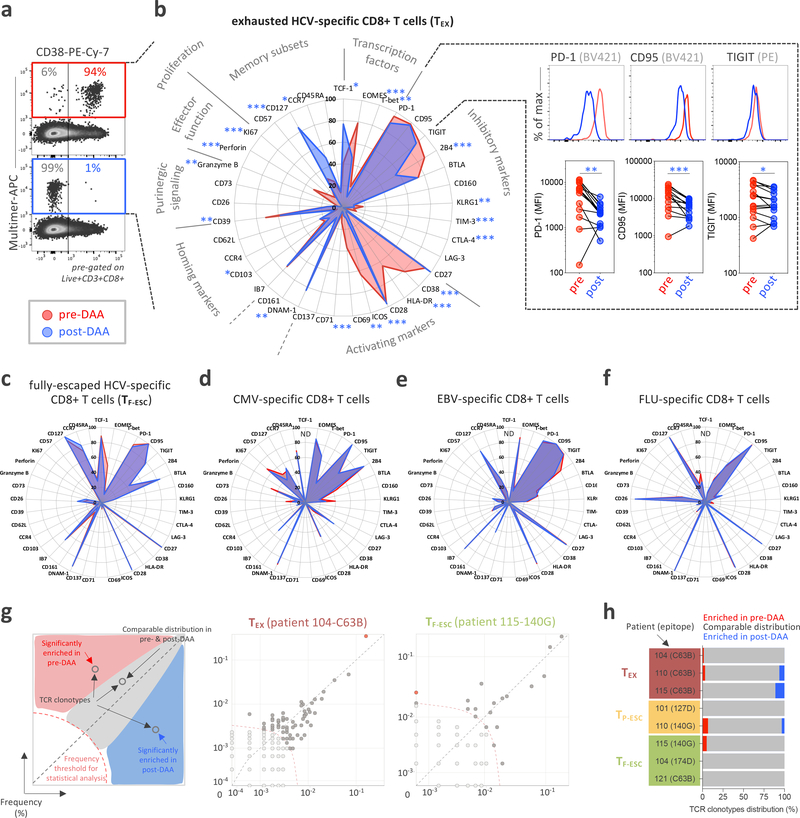
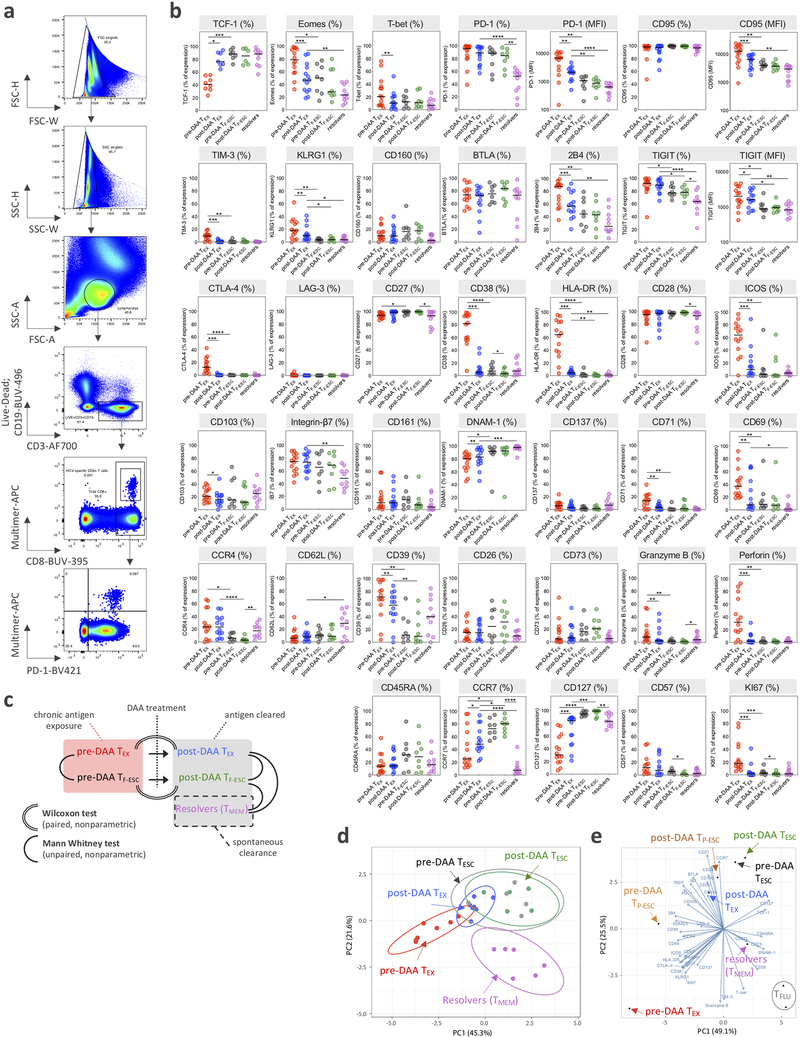
Based on the CD8+ T cell response screening, we performed comprehensive immune profiling by flow cytometry pre- and post-DAA therapy, assessing the expression of 37 different molecules with known relevance for T cell state and differentiation (Fig. 2a,b and Extended Data Fig. 3a–c). HCV-specific CD8+ T cells targeting conserved epitopes (TEX) had the expected profile of high activation with expression of CD38, HLA-DR, ICOS, and CD69 by most HCV-specific T cells, an effector memory phenotype (CCR7lo, CD45RAlo, and CD127lo,), high expression of different T cell inhibitory receptors and other molecules related to T cell exhaustion (PD-1, TIGIT, CD95, BTLA, 2B4, and CD39), and the typical transcription factor profile (TCF-1lo, Eomeshi, and T-betlo) (Fig. 2b, red line). This exhausted T cell phenotype changed extensively by 12 weeks after the end of DAA therapy, or almost 24 weeks after termination of viremia, with 23/37 molecules expressed at significantly different levels. The overall picture post HCV cure was characterized by a complete reduction in T cell activation (complete loss of CD38, HLA-DR, ICOS, CD69 and CD71 expression), a switch towards a central memory phenotype with more cells expressing CCR7 and, especially, CD127, and a switch towards a higher frequency of TCF-1 than Eomes-expressing cells (Fig. 2b, blue line). While most HCV-specific CD8 TEX cells continued to express T cell inhibitory molecules, most T cell inhibitory molecules were significantly decreased in either percentage (2B4, CD39, TIM-3, and CTLA-4) or median fluorescence intensity (MFI) (PD-1, CD95, and TIGIT) (Fig. 2b, right panels). Overall, the phenotypic changes in TEX post-DAA therapy aligned with a switch towards less-exhausted T cells that had developed distinct features usually associated with TMEM. All other virus-specific CD8+ T cell populations, including HCV-specific TF-ESC and those targeting other viruses, displayed a different phenotypic T cell profile at baseline, and underwent no significant changes from pre- to post-DAA therapy (Fig. 2c–f). Together, the data expand on previous findings27 by describing even broader changes from the exhaustion phenotype towards memory features. Further, even when studying 37 different T cell parameters, all observed changes can be attributed to the removal of HCV antigen, and thus cessation of TCR stimulation, rather than termination of chronic inflammation. We also performed TCR sequencing analyses in a subset of patients to determine whether the broad phenotypical changes described above could be explained by remodeling of the clonal composition of TEX post-therapy. As we observed rather stable clonal repertoires in both TEX and TESC (Fig. 2g,h), the pervasive phenotypic alterations in TEX cannot be explained by selective emergence or disappearance of distinct HCV-specific T cell clones, but rather by changes within the original clonal repertoire.
Figure 2: HCV-specific TEX have a characteristic phenotype that is significantly changed after DAA therapy and antigen removal.
a, Representative flow cytometry dot plots of the changes in CD38 expression pre- and post-DAA therapy. b, Deep immune-profiling analysis of TEX HCV-specific CD8+ T cells (paired samples, n=14) before (red plot) and after (blue plot) DAA-treatment. Data are expressed as percentage of cells expressing the listed markers. Changes in expression level, defined by the median fluorescence intensity (MFI) for PD1, CD95 and TIGIT before and after DAA treatment are also indicated in the right panels. Statistical testing by Wilcoxon tests (paired, nonparametric, two-sided), *P < 0.05, **P < 0.01, ***P < 0.001. c, Phenotypic changes in TF-ESC HCV-specific CD8+T cells targeting mutated epitopes (paired samples, n=8) pre- and post-DAA treatment. Phenotypic changes in CMV- (paired samples, n=8), EBV- (paired samples, n=14), and influenza-specific (paired samples, n=13) CD8+T cells pre- and post-DAA treatment are displayed in d, e and f, respectively. g, Correlation plots displaying the frequencies of the different clonotypes identified by TCR sequencing between pre- and post-DAA therapy. Each dot represents a unique TCR clonotype. h, TCR clonotype distribution in n=8 different T cell populations (TEX, n=3; TP-ESC, n=2; and TF-ESC, n=3) between pre- and post-DAA treatment.
Memory differentiation of TEX post DAA remains incomplete.
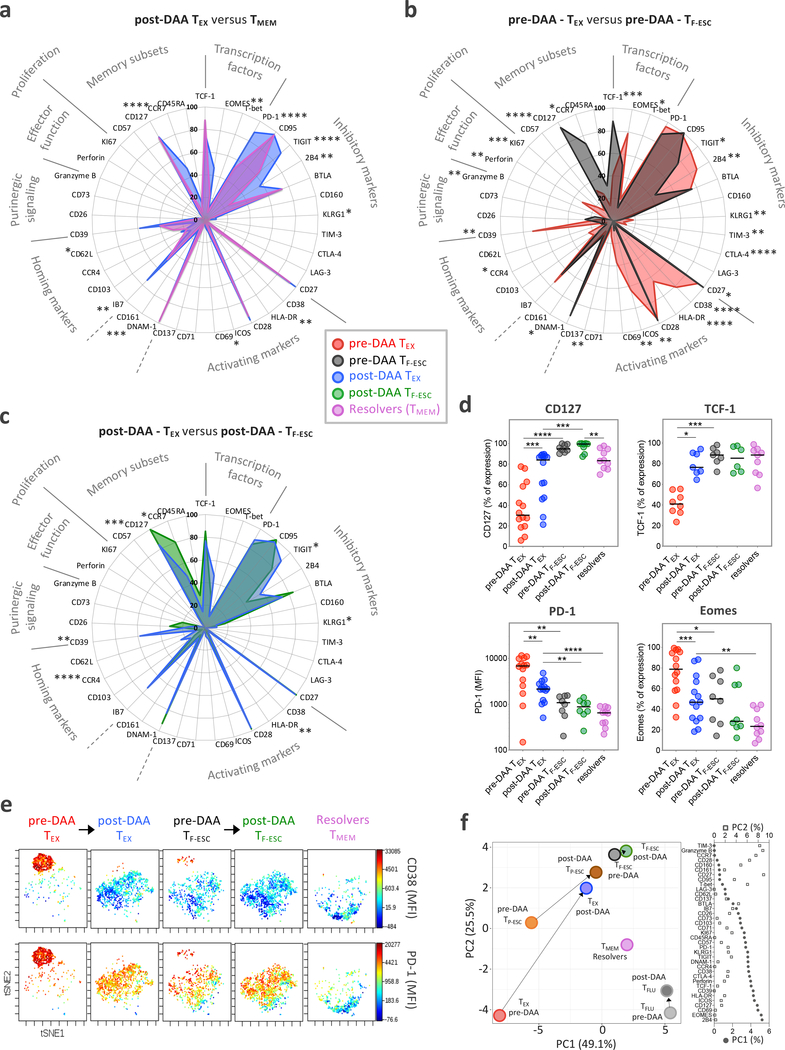
We next tested whether the phenotypic changes in TEX after cure of chronic infection resulted in T cell populations recapitulating true T cell memory by comparing their phenotype to HCV-specific CD8+ T cells from patients who had spontaneously resolved HCV infection (Extended Data Fig. 1e). In patients with a recently resolved acute infection, we analyzed PBMCs from about 24 weeks after the last positive viral load, so that the HCV-specific CD8+ T cells were at a similar time since the last TCR signal as the TEX after cure. The expression levels of some molecules, such as CD127 and TCF-1, was similar to those of TMEM (Fig. 3a,d and Extended Data Fig. 3b,c). Other important molecules, however, remained differentially expressed, including PD-1 and Eomes (Fig. 3d and Extended Data Fig. 3b,c). When we added CD8+ T cells targeting escape epitopes to the analysis, differences between TEX and TF-ESC narrowed from pre- to post-HCV cure, but significant phenotypic differences remained between these T cell populations (Fig. 3b–d and Extended Data Fig. 3b,c). Overall, TF-ESC occupied a space between TEX after cure and TMEM (Fig. 3b–d and Extended Data Fig. 3b,c). This finding was further supported through T-distributed stochastic neighbor embedding (t-SNE) visualization based on the expression levels of 9 different molecules that were part of one of the flow cytometry phenotyping panels (Fig. 3e, expression levels shown for CD38 and PD-1). Looking at individual T cells from the different HCV-specific T cell populations, we observe two highly distinct clusters at opposite sides of the spectrum. In the upper left corner, we almost exclusively see TEX from pre-treatment, with high PD-1 and CD38 expression (Fig. 3e, left panel). In contrast, cells in the lower right corner are completely negative for CD38 and PD-1 and consist only of TMEM from resolved infections (Fig. 3e, right panel). TEX after treatment move towards the lower right, but fall significantly short of reaching the t-SNE space with a full TMEM profile (second panel from left). TESC from pre- and post-treatment (middle panel and second panel from right) also occupy a space in the middle, but reach a position closer to TMEM. Similar results were observed with principal component (PC) analysis of data used for t-SNE analysis (Extended Data Fig. 3d), and the pattern was substantiated by PC analysis integrating the results from all 37 molecules that we analyzed via flow cytometry (Fig. 3f and Extended Data Fig. 3e). Pre-treatment, we see increasing memory-like T cells on the trajectory from TEX over TP-ESC to TF-ESC on both the PC1 and PC2 axis, with further differentiation towards memory post cure status, though none of the T cell populations from chronic infection fully reach the memory T cell profile on the bottom right of the PC plane, where TMEM from HCV-resolvers and Flu-specific T cells are located. Together, the data indicate that TEX do not fully differentiate into TMEM post removal of antigen, but rather acquire a memory-like phenotype similar to what we observe in TESC already during viremia.
Figure 3: The phenotypic change of TEX towards TMEM after HCV cure remains incomplete.
a, Comparison of the phenotypic immune signature of post-DAA TEX (n=14) to that of TMEM from spontaneous HCV-resolvers (n=10). b, Comparison of the TEX phenotypic immune signature (n=14) to that of TF-ESC (n=8) pre-DAA therapy. c, Comparison of the TEX phenotypical immune-signature (n=14) to TF-ESC (n=8), post-DAA therapy. a-c, Data are expressed as the percentage of cells expressing the listed markers. Dot plot histograms comparing expression levels of the 37 proteins studied across the different HCV-specific CD8+ T cell populations are presented in Extended Data Fig. 3b. Statistical testing by Mann-Whitney tests (unpaired, nonparametric, two-sided). d, Dot plot histograms displaying CD127, TCF-1, PD-1 and Eomes expression levels across TEX and TF-ESC, pre- and post-DAA therapy, and in resolver TMEM. Statistical testing by Mann-Whitney tests when comparing TEX versus TF-ESC or TMEM (unpaired, nonparametric, two-sided), or by Wilcoxon tests (paired, nonparametric, two-sided) when comparing paired samples pre- versus post-DAA. A schematic representation of the comparison rules and statistical tests used is presented in Extended Data Fig. 3c. a-d, *P < 0.05, **P < 0.01, ***P < 0.001, ****P < 0.0001. e, t-SNE analysis of TEX and TF-ESC, pre- and post-DAA therapy, as well as resolver TMEM, based on the expression levels of CD38, HLA-DR, PD-1, CD39, TIGIT, CCR7, CD45RA, Integrin-Beta-7 and CD62L. Expression levels (MFI) of CD38 and PD-1 are displayed using a color scheme. f, Principal component analysis of the expression levels of the 37 proteins, as detected by flow cytometry, by TEX, TP-ESC, TF-ESC and TFLU, pre- and post-DAA therapy, as well as by resolver TMEM. Respective contributions of the 37 different proteins in driving PC1 and PC2 are depicted in the right panel.
TESC display functional properties similar to those of TMEM.
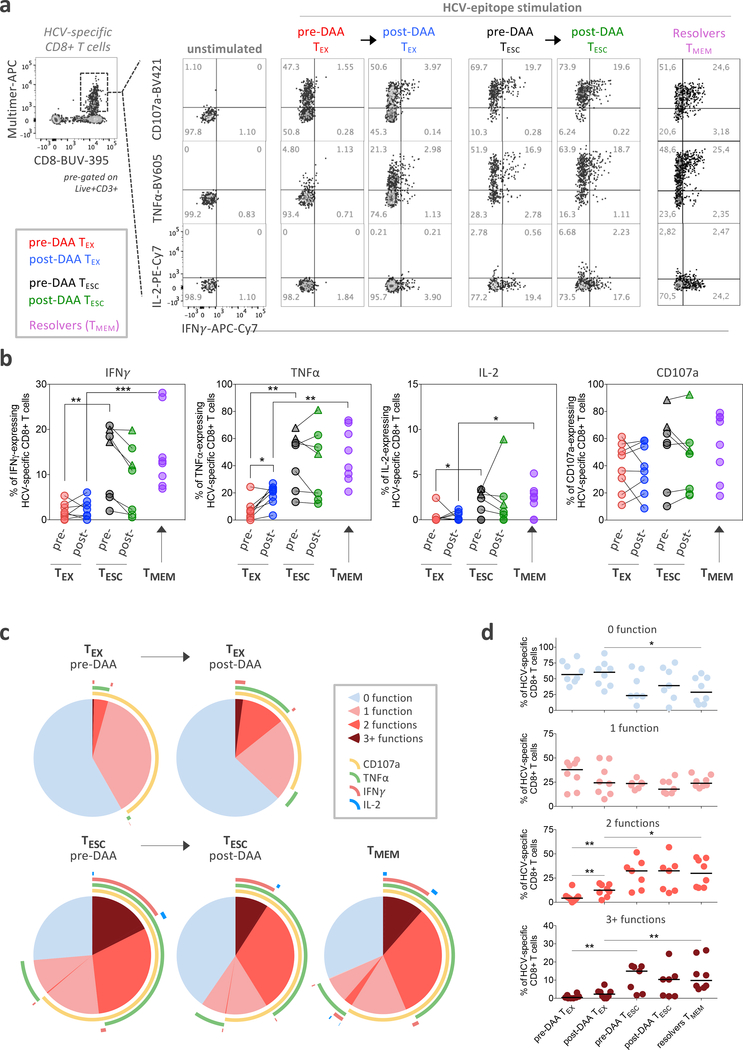
Despite broad phenotyping, the quality of a T cell response can ultimately only be assessed by testing its functional properties. This has been extremely challenging in chronic HCV infection, but the availability of leukapheresis samples allowed the input of sufficiently large numbers of PBMCs to yield robust functional data (Fig. 4a). We tested for the secretion of IFNγ, TNFα, and IL-2 after ex-vivo peptide stimulation, as well as the mobilization of CD107A, a surrogate marker for T cell cytolytic capability. We found limited cytokine secretion in HCV-specific TEX pre-treatment, as described previously35, while a significant proportion of the cells displayed a cytotoxic response (Fig. 4b–d). These results were almost unchanged after HCV cure, apart from a significant, but low-level increase in TNFα secretion. In contrast, TESC cells were more polyfunctional and produced significantly more of each cytokine before treatment, at overall levels similar to those of TMEM from spontaneously recovered HCV infection (Fig. 4b–d). Overall, the data indicate that early loss of antigenic stimulation, after development of viral escape mutations, can lead to functionally active cells, whereas viral cure after extended chronic viremia does not. Further, even when cells are similar in phenotype, they can be significantly different in function.
Figure 4: Functional analysis reveals that TESC, but not TEX after viral cure, display functional properties similar to those of TMEM from HCV natural resolvers.
a, Representative flow cytometry plots of the cytokine production and cytotoxicity capability of HCV-specific CD8+ T cells following ex vivo stimulation with or without cognate antigen. The co-expression patterns and percentage of cells producing IFNγ, TNFα and IL-2 cytokines and expressing CD107a are indicated. b, Dot plot histograms displaying IFNγ, TNFα and IL-2 production as well as CD107a expression across TEX (paired samples, n=8) and TESC (paired samples, n=7) pre- and post-DAA therapy, and in resolver TMEM (n=8). Triangles identify two analyzed TP-ESC populations. Statistical testing by Mann-Whitney tests when comparing TEX versus TF-ESC or TMEM (unpaired, nonparametric, two-sided), or by Wilcoxon tests (paired, nonparametric, two-sided) when comparing paired samples pre- versus post-DAA. A schematic representation of the comparison rules and statistical tests used are presented in Extended Data Fig. 3c. c, Overlapping pie-charts describing the polyfunctionality of TEX (paired samples, n=8) and TESC (paired samples, n=7) pre- and post-DAA therapy, as well as TMEM (n=8), after ex vivo stimulation with cognate antigens. d, Frequencies of T cells with one, two and three or more functions as defined by the expression or co-expression of CD107a, IFNγ, TNFα and IL-2 after stimulation with cognate antigens. Statistical testing by Mann-Whitney tests (unpaired, nonparametric, two-sided). b,d, *P < 0.05, **P < 0.01, ***P < 0.001.
No improvement of TEX functions long-term after HCV cure.
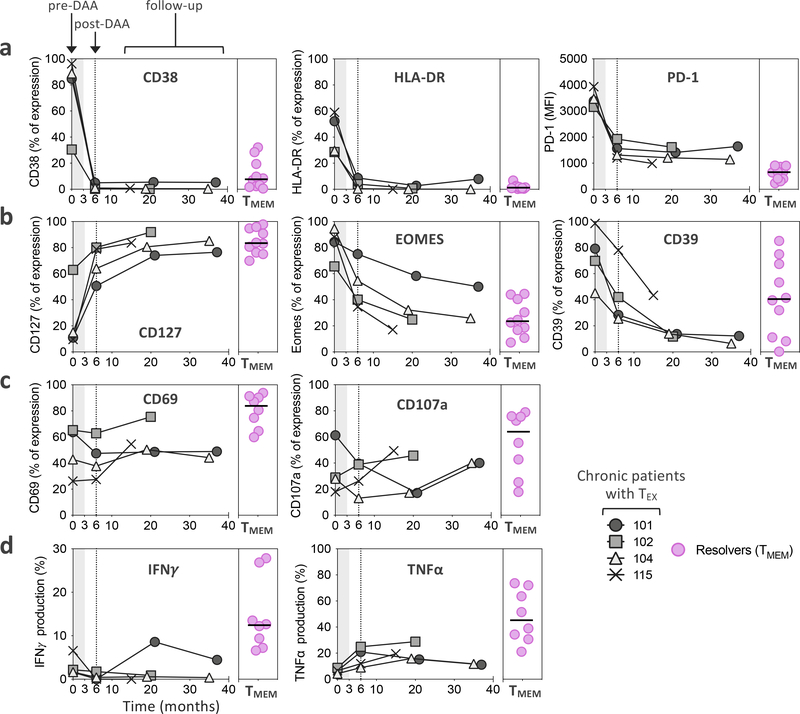
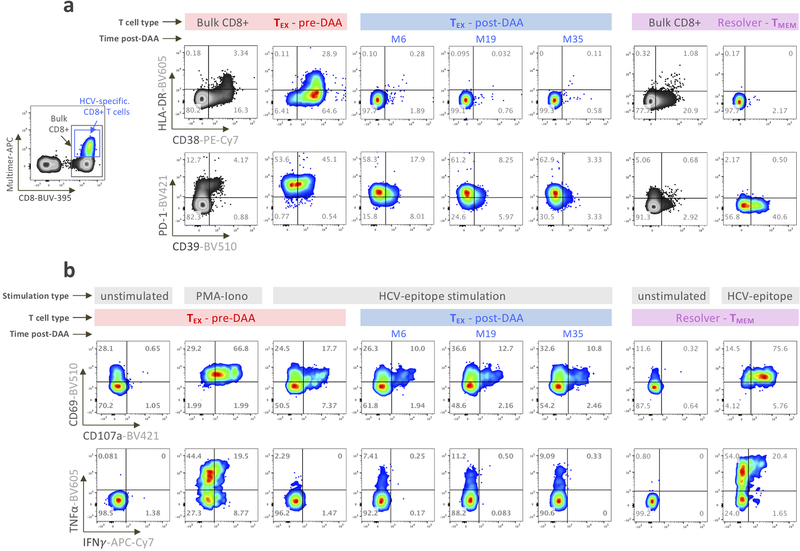
To establish whether our assessment of the effect of HCV cure on TEX at week 24 post treatment initiation might be missing important subsequent changes over time, we followed 4 patients with additional leukapheresis samples up to 3 years post initiation of treatment. We found that many molecules had already reached steady state expression levels at the early post-treatment timepoint, including CD38, HLA-DR and PD-1 (Fig. 5a and Extended Data Fig. 4a). Nevertheless, some markers continued to change beyond month 6, with a further increase of CD127 expression and additional decreases in Eomes and CD39 expression (Fig. 5b and Extended Data Fig. 4a). However, these changes had no significant impact on T cell activation and function, e.g. on CD69 and CD107a upregulation or IFNγ and TNFα production following cognate antigen stimulation, which all remained stably diminished compared to TMEM (Fig. 5c,d and Extended Data Fig. 4b). Overall, the data do not indicate substantial improvement of TEX during long-term observation after HCV cure, but suggest prolonged fixation of TEX in their dysfunctional state after cessation of chronic antigen stimulation.
Figure 5: The TEX phenotypic and functional profile shows limited evolution over time post-HCV cure.
a-b, Temporal dynamics of expression levels of CD38, HLA-DR and PD-1 (a), as well as CD127, EOMES, and CD39 (b), by TEX from four chronic HCV patients treated with DAA. c-d, Functional analysis of CD69 and CD107a (c), as well as IFNγ and TNFα production (d) after ex vivo stimulation with cognate antigen. Expression levels are displayed as percentage of expression except for PD-1, which is expressed as MFI. Expression levels in TMEM from spontaneous resolvers are displayed for comparison.
Scars in the transcriptional landscape of HCV-specific TEX.
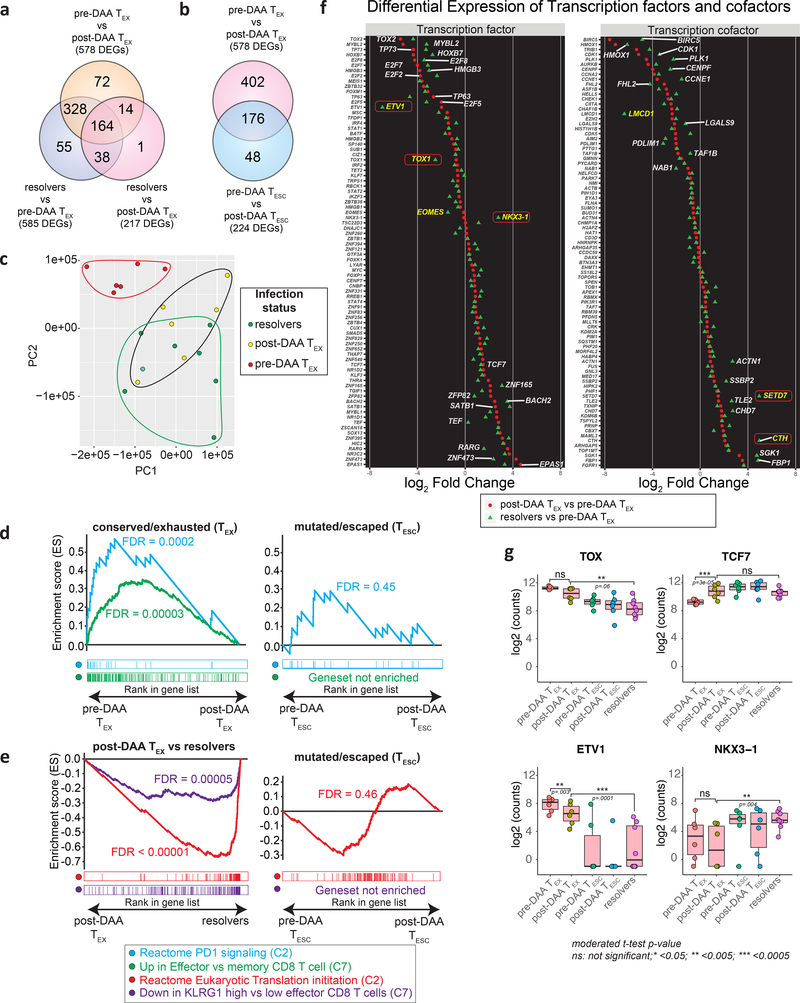
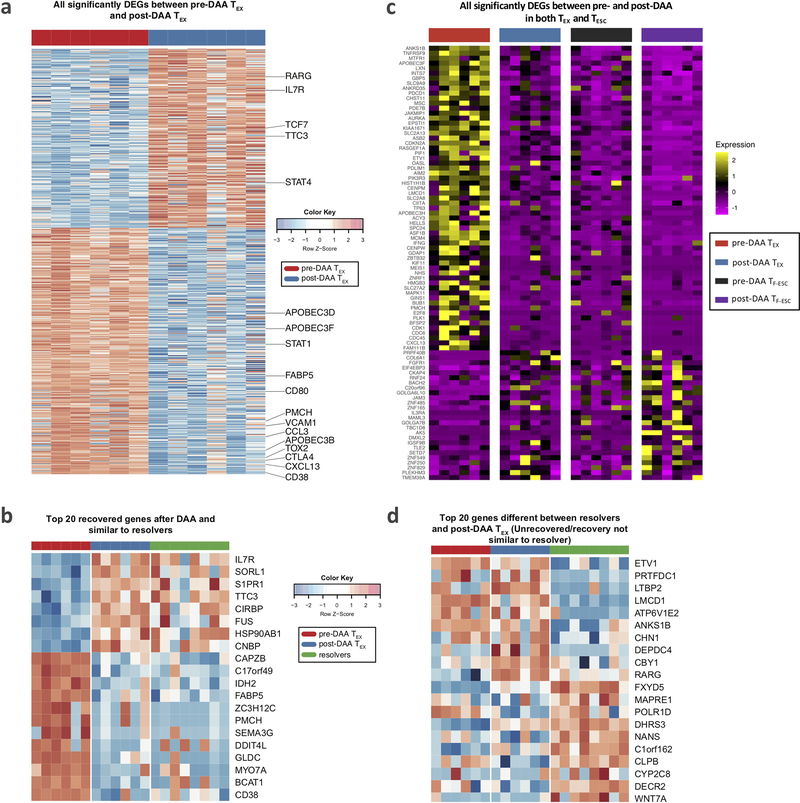
To broaden the analysis to all molecules expressed in antigen-specific CD8+ T cells, we performed RNAseq on HCV multimer-binding CD8+ T cell populations sorted for the previously analyzed T cell categories (TEX and TESC pre- and post-DAA therapy, and TMEM). First, we compared gene expression in TEX before and after HCV cure. Confirming and extending our findings from flow-based phenotyping, we found broad changes in gene expression after antigen removal, with a total of 578 differentially expressed genes (Fig. 6a and Extended Data Fig. 5a). This included already detected changes towards a memory phenotype, such as upregulation of CD127, but many additional molecules were expressed at similar levels to TMEM (Extended Data Fig. 5b). This phenotypic change is further corroborated by the observation that differential gene expression between TMEM from resolvers and TEX dropped from 585 genes pre DAA treatment to 217 genes post DAA treatment (Fig. 6a). Principal component analysis of these three populations accordingly showed a change from complete separation of TEX to partial overlap with TMEM post-treatment (Fig. 6c). The transcriptional data also confirmed on a much broader scale the more limited changes in TESC after therapy, with most changes in TESC also observed in TEX, but with smaller differences between pre and post treatment (Fig. 6b and Extended Data Fig. 5c). The transcriptional data also show that TESC do not exhibit changes in key pathways such as PD-1 response signaling or in their memory phenotype after HCV cure, in contrast to TEX (Fig. 6d). While TESC already had more memory-like characteristics before treatment, TEX still had exhausted characteristics compared to TMEM after antigen removal, including lower translation initiation and higher expression of the KLRG1-related gene cluster5, 36 (Fig. 6e). Together, these data confirm and expand the phenotyping analysis by flow cytometry, with broad and significant changes towards memory in TEX post cure, while in TESC, these changes have already occurred previously after viral escape.
Figure 6: Transcriptional analysis confirms broad changes in TEX after removal of antigen, but also identifies exhaustion scars in the transcriptional landscape.
HCV-specific MHC-multimer-sorted CD8+ T cells from patients pre- and post-DAA treatment were compared with those from patients who resolved infection spontaneously. a, b, Venn diagrams showing the number of differentially expressed genes (DEGs) and overlap between TEX pre- vs post-DAA therapy (paired samples, n=6), vs TMEM from resolver patients (n=8) (a), or vs TESC (paired samples n=6) (b). c, Principal component analysis of gene expression profiles from pre-DAA TEX, post-DAA TEX, and resolver TMEM cells. d, Gene set enrichment analysis (GSEA) of the transcriptional signature “reactome PD1 signaling (C2)” and “up in effector vs memory CD8+ T cell (C7)” enriched in pre-DAA TEX cells compared post-DAA (left panel) or in pre-DAA TESC cells compared post-DAA (right panel). e, GSEA of transcriptional signature “reactome translation (C2)” and “down in KLRG1 high vs low effector CD8+ T cells (C7)” enriched negatively in resolver TMEM cells compared to post-DAA TEX cells (left panel) or in pre-DAA TESC cells compared to post-DAA (right panel). f, Plot showing the log2 fold change difference of transcription factors and cofactors between post-DAA TEX and resolver T cells with respect to pre-DAA TEX cells. Transcription factors and cofactors that did not recover are highlighted in yellow font and with a red frame if statistical validation was made on 9 additional TEX populations post-DAA therapy and compared to TMEM (Extended Data Fig. 6c). g, Expression (log2 counts) of TOX, TCF7, ETV1 and NKX3–1 in TEX and TESC pre- and post-DAA (paired samples n=6) as well as in resolver TMEM cells (n=8). Box plots show the median (vertical bar), 25th and 75th percentiles (lower and upper bounds of the box, respectively) and 1.5 times the interquartile range (or minimum/maximum values if they fall within that range; end of whiskers). Statistical testing by moderated t-test (two-sided, unadjusted).
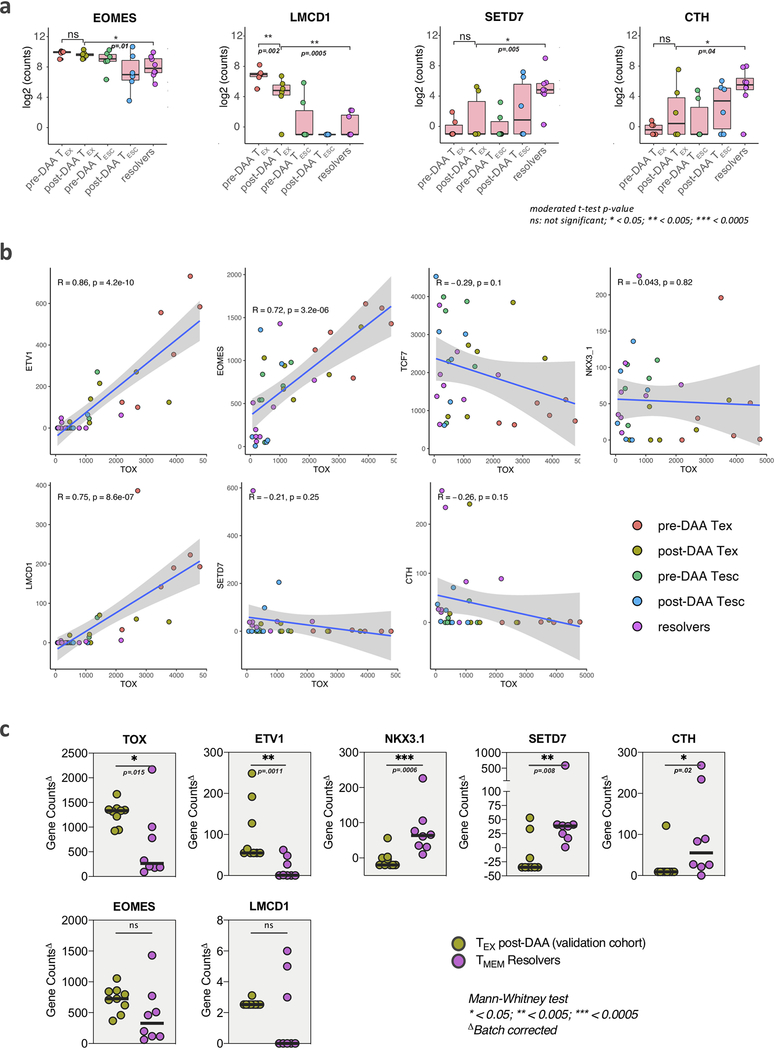
Since phenotypic improvements were incomplete and did not lead to functional improvement, we searched for genes that remained fixed in a TEX state after antigen removal (top 20 differentially expressed genes between TEX post-treatment and TMEM in Extended Data Fig. 5d). We focused on transcription factors and transcription co-factors, as we hypothesized these to be at the center of potential immunological scars that prevent differentiation into effective memory T cells. While the expression levels of many transcription factors and co-factors in TEX changed after treatment to levels comparable with those in TMEM, some notable outliers either did not change at all or changed insufficiently (Fig. 6f). An important example is the transcription factor TOX, recently identified as a key driver of T cell exhaustion (Fig. 6f,g)29, 37, 38. TOX expression decreases post antigen removal but does not reach the level of either TESC or TMEM, in contrast to TCF7, which fully normalizes. The same pattern was observed for the transcription factor Eomes and additional transcription factors and co-factors, most prominently ETV-1, NKX3–1, LCMD-1, SETD7, and CTH (Fig. 6f,g and Extended Data Fig. 6a). Of these transcription factors and co-factors, ETV1, EOMES and LCMD1 displayed expression patterns correlating with TOX expression, suggesting potential mechanisms of coregulation (Extended Data Fig. 6b). We then validated the differential expression of these molecules between TEX post-DAA treatment and TMEM in 9 additional TEX populations post therapy, confirming the gene expression differences for TOX, ETV1, NKX3–1, SETD7, and CTH, but not LMCD1. Eomes showed similar difference as in the original comparison, but this did not reach statistical significance (Extended Data Fig. 6c). Importantly, most molecules without clear recovery displayed much more TMEM-like expression levels in TESC (Fig. 6g and Extended Data Fig. 6a). These data suggest that, despite the broad transcriptional changes in TEX post-DAA treatment, many key transcriptional regulators remain in a TEX state and thus seem to represent immunological scars, which are mostly absent in T cells that received antigen signal for a more limited time due to viral escape mutations.
Discussion:
T cell exhaustion that is common in cancer and chronic viral infections can be reversed, but the efficacy of existing therapies is not universal or necessarily durable. Overcoming these limitations requires a better understanding of the molecular pathways underlying T cell exhaustion and its reversal. Here we utilized treatment of HCV infection with DAA, the only curable chronic viral infection, to test the hypothesis that complete clearance of chronic antigen allows TEX to differentiate towards a memory profile without additional immunotherapeutic intervention. Early reports of DAA-cured chronic HCV infection indicated some reversal of T cell exhaustion, with increased proliferative capacity of HCV-specific CD8+ T cells28, decreased PD-1 expression, and a shift towards a TCF-1+ CD127+ memory-like T cell phenotype27. However, these cells did not fully resemble TMEM27, 29, 30.
To define the impact of antigen removal on TEX in more detail, we analyzed 20 subjects undergoing identical DAA treatment for chronic HCV infection in a specifically designed clinical trial that included leukapheresis sampling. This enabled deeper T cell profiling of large antigen-specific T cell populations from the same research sample, including functional assays, multiple control T cell specificities within the same individual, and a detailed assessment of the recognition of the autologous HCV strain by each T cell response. Phenotypically, we observed broad changes in TEX after antigen removal, with expression of 23/37 proteins changing significantly, all towards a memory phenotype. Importantly, this was not caused by selective emergence or disappearance of distinct T cell clones, as we observed stable clonal repertoires analyzing thousands of TEX cells pre- and post-DAA. Expanding this analysis by RNAseq revealed 578 DEGs between TEX pre- and post-treatment. Thus, previously described changes post antigen removal are one facet of a broadly altered transcriptional landscape in TEX after cure. Importantly, our data indicate that the observed changes are predominantly a function of terminated TCR signaling, and not mediated by resolution of the chronic inflammatory environment, since T cells from the same patient targeting other viruses remained unchanged in their phenotype and those targeting HCV escape variants displayed minimal changes on the protein and transcriptional level.
Comparison of TEX post antigen removal with bona fide TMEM from patients with spontaneously resolved infection made evident that TEX differentiation towards memory was incomplete. Significant differences in gene expression remained for about one third of the molecules that were differentially expressed between TMEM and TEX before treatment, including key mediators of T cell exhaustion. While the number of genes that did not recover was about half of those that did, these fixed or scarred genes must be especially relevant, as the broad transcriptional changes in TEX post treatment failed to translate into a meaningful increase in cytokine production. Additionally, T cells targeting fully escaped HCV epitopes were completely distinct in their phenotype pre-treatment, but were already functionally as robust as TMEM from spontaneously resolved infection. With the TESC phenotype pre-treatment being relatively close to post-treatment TEX, it is evident that even the broadest and most detailed phenotyping is insufficient to fully deduce T cell functionality. Importantly, viral escape from HCV-specific CD8+ T cell responses almost exclusively occurs early in chronic infection, typically between 3 and 9 months after exposure32, 33. Thus, our results support that, after a limited period of antigen stimulation during early infection, TESC can recover by antigen removal alone, especially when the escape variant fully abrogates TCR recognition, in contrast to TEX with many years of chronic antigen stimulation. Alternatively, T cells targeting exhausted epitopes could have had a much longer time to recover. We deem this unlikely because we observed limited additional changes in phenotype and no sign of functional recovery when we followed a subgroup of chronic patients for up to 3 years after treatment. That duration of antigen stimulation, rather than duration of recovery, is the defining factor for the ability to differentiate into TMEM is supported by data from the LCMV model of viral infection, where early transfer of exhausted T cells into uninfected mice was similarly associated with improved T cell function, in contrast to transfer later8.
Future studies will need to determine whether the global changes observed in the TEX population after antigen removal are based on re-differentiation of different TEX, or exclusively on outgrowth of the pre-existing TCF-1+ memory-like population30, 39. As the TCR composition of TEX after DAA cure was highly preserved in our analysis, the phenotypic changes are not consequential to dramatic remodeling of the clonal repertoire. Data from a recent scRNAseq study suggests that the HCV-specific TCF-1+ memory-like population represents precursors to all terminally differentiated TEX30, meaning that chronic antigen removal post HCV cure might induce the loss of the terminally differentiated TEX population within each clone, leaving only memory-like precursors that nevertheless are dysfunctional. Proof for this hypothesis will require more definitive mouse transfer experiments using different TEX subsets.
Furthermore, we identified several transcription factors with similar expression behavior to that of TOX that were not previously associated with T cell exhaustion. With most comprehensive exhaustion data coming from mouse models, these molecules might have gone unnoticed due to different roles in mice and humans. The cause of this lack of plasticity in TEX might be epigenetic scarring in key regions of the genome, locking in the exhausted T cell state. Whether there is a window of opportunity to correct or prevent the scarred exhaustion state early in infection is therefore critical. We are currently studying whether DAA therapy during the first year of HCV infection leads to more profound reprogramming of exhausted T cell responses.
In summary, our study revealed a broad impact of antigen removal on human TEX that did not translate into functional recovery. We identified genes that seem irrevocably fixed in their expression levels after long-term antigen exposure, whereas T cells with shorter TCR stimulation due to viral escape can differentiate towards functional memory. These results suggest a window of opportunity for reconstituting immunity early in exhaustion and identify target genes for interventions to rescue more terminally exhausted CD8+ T cells.
Methods
Study design, DAA treatment and sample collection
Patients with chronic genotype (GT) 1a HCV infection were enrolled in an open-label Phase 3 clinical trial of paritaprevir/ritonavir, ombitasvir, dasabuvir and ribavirin designed to evaluate the effect of successful antiviral therapy on innate and adaptive immune responses (NCT02476617)31. The clinical trial was approved by the Partners Healthcare Institutional Review Board and has been previously described31. All patients provided written informed consent.
Patients were all chronically infected for 9 or more years with HCV GT 1a and presented no additional co-infections such as HIV or HBV, or had previously resolved HCV infection on their own. Trial participants were treated for 12 weeks with a combination of paritaprevir/ritonavir/ombitasvir + dasabuvir + ribavirin and regular blood draws were collected pre- and post-DAA therapy, including at least two leukapheresis collections at weeks 0 and 24. Additional leukaphereses were collected from four trial subjects between weeks 60 and 80. Peripheral blood mononuclear cells (PBMCs) were extracted by Ficoll-Paque (GE Healthcare Life Sciences) density gradient centrifugation and frozen down for further processing, together with plasma samples. Repository-frozen PBMCs from an additional cohort of patients who had spontaneously resolved HCV infection (Resolvers) were also studied. Clinical characteristics of the patients are described in Supplementary Table 1.
Ex vivo detection of virus-specific CD8+ T cell populations and cell enrichment
PBMC samples were thawed and analyzed by flow cytometry to identify virus-specific CD8+ T cell responses using appropriate HLA class I multimers, pre- and post-DAA treatment (Extended Data Fig. 1a,b). Magnetic bead enrichment of multimer-positive cells using anti-PE or -APC beads and LS columns (Miltenyi) was performed on up to 200 million PBMCs, according to the manufacturer’s instructions, to capture HCV-specific CD8+ T cell populations of even extremely low-frequency (Extended Data Fig. 1c).
Sequencing HCV epitopes and testing of variant epitopes
We deep sequenced each of the identified HCV epitopes and tested the T cell recognition of epitope variants. HCV epitopes from chronically infected patients were sequenced from circulating viruses in plasma samples collected before trial initiation to identify potential escape mutations. An amplicon surrounding epitopes C63B, 127D, 140G, A2–198 and 174D was generated by a reaction consisting of 2x First Strand Buffer, sense (A2F: AAC GTT GCG ATC TGG AAG AC or A3F: GCT CTC ATG ACC GGC TTT AC) and antisense primers (A2R: GGA AGC GTG GTT GTC TCA AT or A3R: AGA GAT CTC CCG CTC ATC CT) at 0.4 μM, and a Superscript III RT/Platinum Taq Mix (Invitrogen) with the following conditions: cDNA synthesis for 30 minutes at 50°C, followed by heat denaturation at 94°C for 2 minutes, then PCR amplification with 40 × (94°C, 15 s; 55°C, 30 s; 68°C 180 s), with a final extension at 68°C for 5 minutes. For epitope 4H, an amplicon was generated using 2x First Strand Buffer, sense (UTR4: CCT TGT GGT ACT GCC TGA TAG) and antisense primers (A1R-1a: GGG YAG CAG TTG ACA CRA TCT) at 0.4 μM, and a Superscript III RT/Platinum Taq Mix (Invitrogen) with the following conditions: cDNA synthesis for 30 minutes at 55°C, followed by heat denaturation at 94°C for 2 minutes, then PCR amplification by 40 × (94°C, 15 s; 58°C, 30 s; 68°C 240 s), with a final extension at 68°C for 10 minutes. Finally, for epitopes 262G and 2226D the primers used were (A4F: CTC ACT GAT CCC TCC CAC AT) and antisense primers (A4R: GGG GAG GAG GTA GAT GCC TA) with the following PCR conditions: 40 × (94°C, 15 s; 64°C, 30 s; 68°C 180 s), with a final extension at 68°C for 10 minutes. PCR products were visualized on a 1% agarose gel and purified using the PureLink Quick Gel Extraction Kit (Invitrogen). PCR amplicons were fragmented and barcoded using the NexteraXT DNA Library Prep Kit, as per the manufacturer’s protocol. Samples were pooled and sequenced on an Illumina MiSeq platform, using a 2 × 250 bp V2 reagent kit. Paired-end reads obtained from Illumina MiSeq were assembled into a de novo HCV consensus sequence and aligned with intra-host variants as previously reported40, 41. Data has been deposited to the NCBI Sequence Read Archive under accession numbers SRR11811484 – SRR11811504. Wild-type and variant epitope sequences are available in Extended Data Fig. 2a. If the circulating virus contained epitope variants, we generated T cell lines by stimulating the patient’s PBMCs for 14 days with the wild-type peptide under addition of IL-2 and subsequently tested recognition of both wild-type and variant epitopes by intracellular cytokine staining aiming to detect IFNγ production. The effect of epitope sequence variations on T cell recognition based on IFNγ production compared to wild-type epitopes was tested as previously described23, and T cell responses were categorized into two categories (Extended Data Fig. 2b): 1) partial recognition of the epitope variant (partially escaped T cells, TP-ESC) and 2) complete loss of T cell stimulation (fully escaped T cells, TF-ESC).
Ex vivo immunophenotyping of antigen-specific CD8+ T cells by flow cytometry
To profile the different immune subsets shown in Fig. 1c; Fig. 2a–f and Fig. 3, surface staining and intracellular staining of ex vivo multimer-positive T cells were performed. In brief, PBMCs were thawed and washed in R10 medium [RPMI 1640 (Sigma-Aldrich), 2% fetal calf serum (FCS), 1.5% 1 M HEPES buffer (Fisher Scientific), 1× l-glutamine (Fisher Scientific) and 1× streptomycin–penicillin (Fisher Scientific)]. Cells were then stained with LIVE/DEAD Cell Viability dye (Thermo Fisher Scientific) according to the manufacturer’s protocol. The cells were washed in FACS buffer and incubated with select MHC class I Pentamers (ProImmune) or Tetramers (NIH tetramer core facility) for 10 minutes at room temperature. After a wash, cells were stained with surface antibodies for 30 minutes, washed twice, and a fixation–permeabilization step was performed using the FOXP3 Transcription Factor Staining buffer set (Thermo Fisher Scientific) according to the manufacturer’s protocol. Alternatively, multimer-positive cell enrichment was performed before the surface antibody staining step. Cells were then stained with intracellular antibodies. A full list of antibodies used is available in Supplementary Table 2. All steps were performed at 4 °C unless otherwise specified by the manufacturer. Acquisition was performed on an LSR-II flow cytometer (Becton Dickinson).
T cell stimulation with cognate antigen and ICS assays
For ex vivo analyses (for Fig. 4 and Fig. 5), frozen PBMC samples were rested overnight at 37 °C in R10 medium [RPMI 1640 (Sigma-Aldrich), 2% FCS, 1.5% 1 M HEPES buffer (Fisher Scientific), 100× l-glutamine (Fisher Scientific) and 50× streptomycin–penicillin (Fisher Scientific)]. Rested PBMCs containing ex vivo antigen-specific CD8+ T cell populations, or alternatively previously generated T cell lines (for Extended Data Fig 2b), were then incubated with select MHC class I pentamers (ProImmune) or tetramers (NIH Tetramer Core Facility) for 10 minutes at room temperature before stimulation with or without cognate antigen at 10 μg/mL in the presence of 10 μL/mL anti-CD28/49d (BD Biosciences) and 1x protein transport inhibitor (eBioscience) at a final volume of 500 μL for 3 h. Additionally, 5 μL of anti-CD107a antibody was added to the stimulation mixture. Alternatively, multimer-positive cell enrichment was performed on rested PBMCs before cell stimulation. Following incubation, cells were washed and stained with a viability dye (LIVE/DEAD Fixable Blue; Thermo Fisher Scientific) according to the manufacturer’s protocol, and then stained with the surface antibodies followed by intracellular antibodies as described in the above section. A full list of antibodies used is available in Supplementary Table 2. All steps were performed at 4 °C unless otherwise specified by the manufacturer. Acquisition was performed using an LSR-II flow cytometer (Becton Dickinson).
Flow cytometry data analysis and visualization
Flow-cytometry data were analyzed using FlowJo software. Protein expression levels were extracted as percentages and/or as median fluorescence intensity (MFI) numerical values. Alternatively, flow-cytometry data were analyzed using Cytobank42 to generate the T-distributed stochastic neighbor embedding (t-SNE) visualization presented in Fig. 3e, based on the expression levels of CD38, HLA-DR, PD-1, CD39, TIGIT, CCR7, CD45RA, Integrin-Beta-7 and CD62L. Extracted numerical values referring to the expression levels of the 37 proteins presented in Fig. 2, 3 and Extended Data Fig. 3 were integrated into Radar Charts (Fig. 2 and 3) using Excel software or into PC analysis using R software (Fig. 3f and Extended Data Fig. 3e) or ClustVis43 (Extended Data Fig. 3d). Dot-plot histograms integrating the expression levels of the 37 proteins across the different T cell populations analyzed were generated using GraphPad Prism software (Extended Data Fig. 3b).
Cell sorting and RNAseq library preparation
Ex vivo HCV-specific CD8+ T cells were sorted from chronically infected patients pre- and post-DAA therapy (TEX, paired samples, n=6; TESC, paired samples, n=6), including patients with spontaneously resolved HCV infection (TMEM, n=6), as well as from a validation cohort of additional chronic patients post-DAA therapy (TEX, n=9) using the gating strategy described in Extended Data Fig. 3a on a FACS ARIA II sorter (BD Biosciences). Cells were sorted on RLT+, 1% BME buffer and immediately frozen. RNA was extracted using an RNeasy Micro Kit (QIAGEN) according to manufacturer’s instructions, treated with DNase I (New England Biolabs), then concentrated using Agencourt RNAClean XP beads (Beckman Coulter). Full-length cDNA and sequencing libraries were prepared using the Smart-Seq2 protocol as previously described44. Libraries were loaded on a Novaseq 6000 (Illumina) or Nextseq 500 (Illumina) to generate 150 base pair or 38 base pair paired-end reads, respectively. Raw sequencing reads were aligned to the hg38 (GENCODE [v32]) reference transcriptome using STAR (v2.7.3a). Gene expression was quantified using RSEM (v1.3.1).
TCR sequencing and analysis
HCV-specific CD8 T cells from chronically infected patients pre- and post- treatment were sorted by flow cytometry into 500 uL of Hepes Buffer (PBS+2%FBS+0.025M Hepes). After sorting, cells were pelleted and snap frozen, followed by DNA extraction using the Qiagen QIAmp DNA micro kit. Samples were eluted in 100 uL of AE buffer and DNA concentration was measured by Nanodrop. Sample concentration was adjusted to 11 to 14 ng/μl in a total volume of 36 ml as recommended by the manufacturer. DNA amplification and library preparation were performed using the immunoseq hsTCRB kit from Adaptive Biotechnologies, with each DNA sample being amplified in duplicate. We also ran two negative control samples containing only AE buffer. The immunoseq assay is a multiplex PCR-based method that amplifies rearranged TCR CDR3 sequences and characterizes tens of thousands of TCRB CDR3 chains simultaneously. The assay captures the full TCR repertoire including specific individual clones and provides a method to identify and track common and rare clones. After library preparation with the immunoseq kit, quality control of the library was performed using Tapestation and qPCR before sequencing. The library was sequenced by the Biopolymers Facility of Harvard Medical School using Illuminaseq Next Gen500. Raw sequencing data were processed by Adaptive Biotechnologies using a multistep procedure that includes annotation, nucleated cell and TCRB quantification, and quality assessment to generate a comprehensive and quantitative report of each sample’s T-cell receptor repertoire.
Differential gene expression analysis
Genes with non-zero counts were taken for limma analysis (linear models for microarray data). RNAseq count data were normalized using trimmed means of M-values (TMM) with the calcNormFactors function in the edgeR package45. Voom was used to estimate the mean-variance relationship of log2 counts and precision weights were generated before linear modeling46. To identify differentially expressed genes (DEGs) between HCV-specific T cell populations in different disease outcomes, we performed multi-group analysis in limma47. Comparisons used exhausted T cells (pre-DAA and post-DAA), escaped T cells (pre-DAA and post-DAA), central memory T cells (pre-DAA, post-DAA and resolvers) and specific T cells from resolvers (complete results in Supplementary Table 3). DEGs between two groups were calculated using the moderated t-test based on an empirical Bayesian algorithm to estimate changes in gene expression (implemented using R package version 3.6.3; limma package version 3.42.2)47. False discoveries occurring due to simultaneous testing of the hypothesis were adjusted by applying the Benjamini-Hochberg procedure (adjusted P value)48. An adjusted P-value of 0.05 and absolute log2 fold change of 1 were considered cut-offs to create the DEG list using the TopTable function in the limma package. Principal component analysis was done using the prcomp function in R using normalized counts. Heatmaps for normalized counts were plotted using the heatmap.2 function in the gplots R package. Gene counts of exhausted T cells (post-DAA) from the validation cohort (n=9) were compared with resolver samples from the original cohort (n=8) after batch correction using COMBAT49 as a function of SVA (version 3.38.0). For calculating correlations between genes, we used Pearson correlation.
Gene set enrichment analysis (GSEA)
DEGs for each comparison (multi-group adjusted p-value of 0.05 as cut-off) were ranked based on their log2 fold change. GSEA was performed on ranked gene lists using the PreRanked method in the GSEA desktop application (version 4.0.0)50, 51. Enrichment scores were normalized by multiple sample correction to generate a normalized enrichment score.
Transcription factor analysis
We extracted genes that were significantly differentially expressed (adjusted p-value cut-off of 0.05) and identified transcription factor and cofactor genes among them by matching them to a list generated based on various databases52, 53.
Statistical analyses
Statistical analyses were performed using GraphPad PRISM or R software. Statistical tests were used as indicated. *P < 0.05, **P < 0.01, ***P < 0.001, ****P < 0.0001.
Data Availability.
HCV epitope sequences have been deposited to the NCBI Sequence Read Archive under accession numbers SRR11811484 – SRR11811504. RNA-sequencing and TCR-sequencing data from this study will be made publicly available through the NCBI Gene Expression Omnibus (GEO) and/or NCBI database of Genotypes and Phenotypes (dbGaP). The remaining data supporting the findings of this study are available from the corresponding authors upon request.
Extended Data
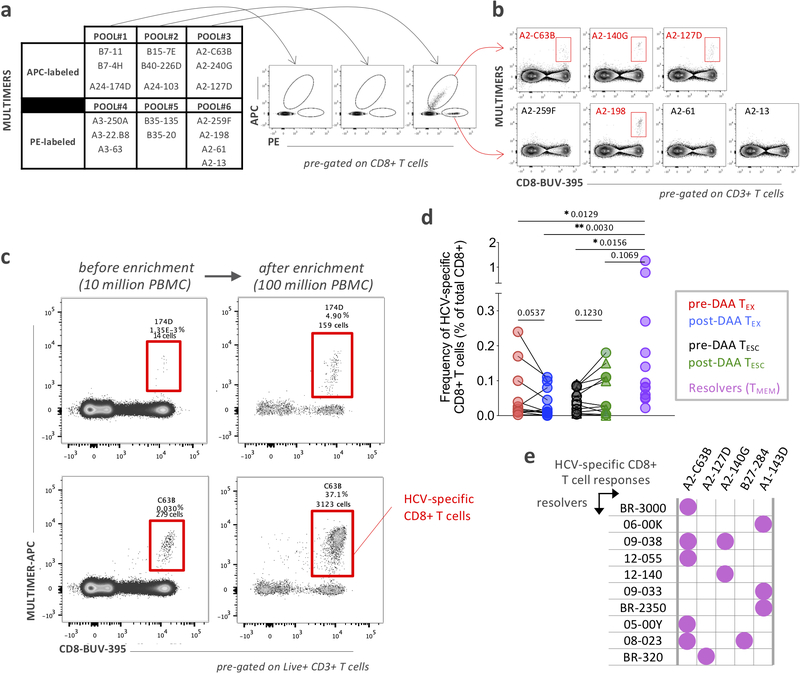
Extended Data Fig. 1. Detection and frequency of HCV-specific CD8+ T cells.
a, Screening strategy to detect HCV-specific CD8+ T cells by flow cytometry using pools of Class I MHC multimers labeled with PE or APC. b, Positive detection was followed by individual multimer staining to identify and/or distinguish multiple HCV-specific CD8+ T cell responses. c, Representative flow cytometry dot plots of HCV-specific CD8+ T cells before and after magnetic bead enrichment. d, HCV-specific-multimer positive CD8+ T cell frequencies, pre- and post-DAA treatment or after spontaneous resolution of the infection. Statistical testing by Wilcoxon tests (paired, nonparametric, two-sided for TEX and TESC pre- and post-DAA) or Mann-Whitney tests (unpaired, nonparametric, two-sided when compared to Resolvers), *P < 0.05, **P < 0.01, ***P < 0.001. e, HCV-specific CD8+ T cell responses (recognized epitopes and associated HLA class I restrictions) detected in a cohort of patients with spontaneously resolved HCV infection.
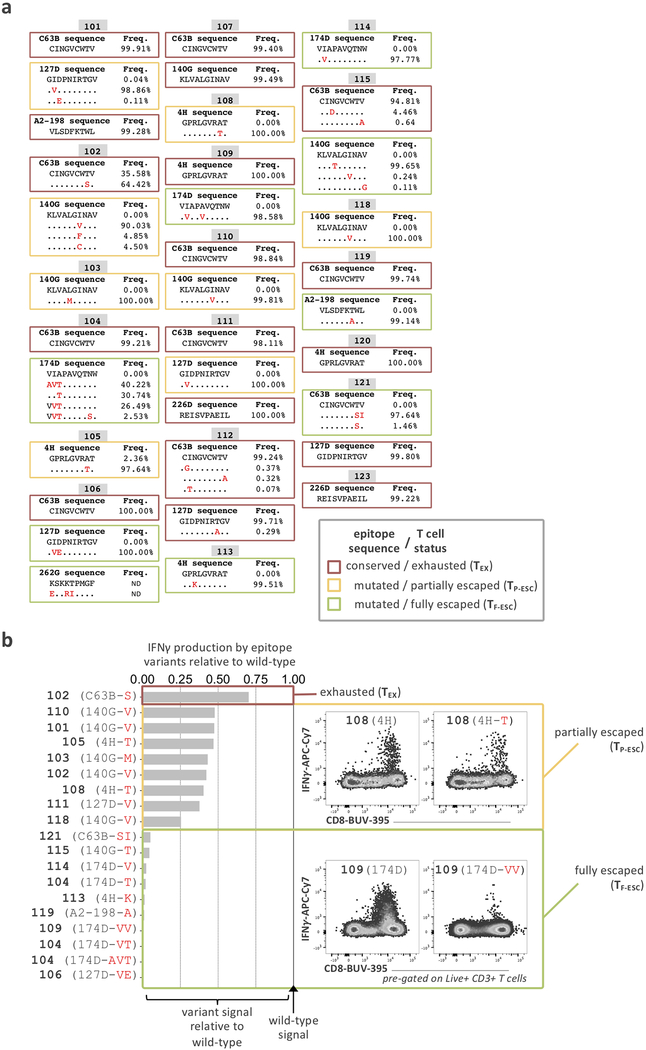
Extended Data Fig. 2. HCV-epitope sequences and identification of functional escape mutations.
a, Sequences of select HCV epitopes across patients included in this study. Escape mutations are written in red and T cell status, whether the cells have full recognition of the virus (TEX) or are partially (TP-ESC) or fully escaped (TF-ESC) is indicated as determined through functional assays of the recognition of the variant epitopes compared to wild-types by intracellular cytokine detection of IFNγ by flow-cytometry (b).
Extended Data Fig. 3. Phenotypical landscape of TEX and TESC, pre- and post-DAA, as compared to TMEM.
a, Flow cytometry gating strategy and representative flow cytometry dot plots. b, Dot plot histograms displaying the expression levels of the 37 proteins analyzed by flow cytometry across TEX and TF-ESC, pre- and post-DAA therapy, and in resolver TMEM. Statistical testing by Mann-Whitney tests when comparing TEX versus TF-ESC or TMEM (unpaired, nonparametric, two-sided), or by Wilcoxon tests (paired, nonparametric, two-sided) when comparing paired samples pre- versus post-DAA. A schematic representation of the comparison rules and statistical tests used are presented in Extended Data Fig. 3c. *P < 0.05, **P < 0.01, ***P < 0.001, ****P < 0.0001. c, Schematic representation of the comparison rules and statistical tests used to compare expression levels across the different T cell populations of interest. d, Principal component analysis of TEX and TF-ESC, pre- and post-DAA therapy, as well as resolver TMEM, based on the expression levels of CD38, HLA-DR, PD-1, CD39, TIGIT, CCR7, CD45RA, Integrin-Beta-7 and CD62L, and as presented also in Fig. 3e by t-SNE analysis. e, Principal component analysis based on the expression levels of the 37 proteins analyzed by flow-cytometry and expressed by TEX, TP-ESC, TF-ESC and TFLU, pre- and post-DAA therapy, as well as by resolver TMEM, with respective contribution and direction (arrows) of each of the 37 different proteins throughout PC1 and PC2 dimensions.
Extended Data Fig. 4. Phenotypical and functional changes in TEX over a long-term period post-DAA cure.
a, Representative flow cytometry dot plots showing the expression and co-expression patterns of HLA-DR and CD38 (upper panels) as well as PD-1 and CD39 (lower panels) by bulk CD8+ T cells (grey dots) or HCV-specific CD8+ T cells (colored dots), pre- and overtime post- DAA therapy or after spontaneous resolution. b, Representative flow cytometry plots showing the expression and co-expression patterns of CD69 and CD107a (upper panels) as well as IFNγ and TNFα cytokines (lower panels) by HCV-specific CD8+ T cells following ex vivo stimulation with or without cognate antigens, pre- and overtime post- DAA therapy or after spontaneous resolution.
Extended Data Fig. 5. Transcriptional landscape of TEX and TESC, pre- and post-DAA, and as compared to TMEM.
a, Heatmap showing all genes that were differentially expressed between pre-DAA TEX and post-DAA TEX. b, Top 20 recovered genes after DAA treatment which are similar to resolver T cells. c, Heatmap showing the 176 significantly DEGs between pre- and post-DAA that are shared by TEX and TESC, as described in Fig. 6b. d, Heatmap showing the top 20 unrecovered genes after DAA treatment which were significantly different between post-DAA TEX and TMEM cells.
Extended Data Fig. 6. Expression patterns of key transcription factors and co-factors.
a, Expression (log2 counts) of EOMES, LMCD1, SETD7 and CTH in TEX and TESC pre- and post-DAA (paired samples n=6) as well as in resolver TMEM cells (n=8). Box plots show the median (vertical bar), 25th and 75th percentiles (lower and upper bounds of the box, respectively) and 1.5 times the interquartile range (or minimum/maximum values if they fall within that range; end of whiskers). Statistical testing by moderated t-test (two-sided, unadjusted). b, Linear regression analysis to model the relationship in gene count expression of TOX and the other transcription factors and co-factors identified in Fig. 6d, by the different populations of HCV-specific CD8+ T cells, pre- and post-DAA therapy or after spontaneous resolution. Error bands represents the 95% confidence level interval. Pearson correlation coefficient R and significance p (two-sided) values are reported from the linear regression analysis performed with R software. c, Gene count expression of TOX, ETV1, NKX3–1, SETD7, CTH, EOMES and LMCD1, by HCV-specific CD8+ T cells from a validation cohort of additional individual with TEX post-DAA (n=9), as compared to resolver TMEM cells (n=8), and following batch effect correction. Statistical testing by Mann-Whitney tests (two-sided), *P < 0.05, **P < 0.01, ***P < 0.001.
Supplementary Material
ACKNOWLEDGMENTS
We are grateful to the patients participating in the clinical trial. Important contributions were made by the HSCI-CRM Flow Cytometry Core Facility at MGH, the NIH Tetramer Core Facility, and the University of Oklahoma Medical Center HLA Typing Facility (William Hildebrand). We also thank all members of the Lauer Lab for insightful comments, critical reading of the manuscript and advice on figure design. This work was supported by NIH grants U19 AI086230 (GML, WNH, RTC, NH, TMA, AYK), U01 AI131314 (GML, LLLX, AYK) and R01 DA046277 (GML, AYK), and fellowships by the German Research Foundation DFG (HKD and LMB). AbbVie sponsored the clinical trial (NCT02476617).
Footnotes
COMPETING INTERESTS
AbbVie sponsored the clinical trial (NCT02476617) and provided input to the trial design and clinical and biological sample collection schedule. W.N.H. is an employee of Merck and Company and holds equity in Tango Therapeutics and Arsenal Biosciences. All other authors declare no competing interests.
REFERENCES
- 1.McLane LM, Abdel-Hakeem MS & Wherry EJ CD8 T Cell Exhaustion During Chronic Viral Infection and Cancer. Annu Rev Immunol 37, 457–495 (2019). [DOI] [PubMed] [Google Scholar]
- 2.Wherry EJ & Kurachi M Molecular and cellular insights into T cell exhaustion. Nat Rev Immunol 15, 486–499 (2015). [DOI] [PMC free article] [PubMed] [Google Scholar]
- 3.Wherry EJ, Blattman JN, Murali-Krishna K, van der Most R & Ahmed R Viral persistence alters CD8 T-cell immunodominance and tissue distribution and results in distinct stages of functional impairment. J Virol 77, 4911–4927 (2003). [DOI] [PMC free article] [PubMed] [Google Scholar]
- 4.Kasprowicz V et al. High level of PD-1 expression on hepatitis C virus (HCV)-specific CD8+ and CD4+ T cells during acute HCV infection, irrespective of clinical outcome. J Virol 82, 3154–3160 (2008). [DOI] [PMC free article] [PubMed] [Google Scholar]
- 5.Bengsch B et al. Coexpression of PD-1, 2B4, CD160 and KLRG1 on exhausted HCV-specific CD8+ T cells is linked to antigen recognition and T cell differentiation. PLoS pathogens 6, e1000947 (2010). [DOI] [PMC free article] [PubMed] [Google Scholar]
- 6.Blackburn SD et al. Coregulation of CD8+ T cell exhaustion by multiple inhibitory receptors during chronic viral infection. Nat Immunol 10, 29–37 (2009). [DOI] [PMC free article] [PubMed] [Google Scholar]
- 7.Wherry EJ et al. Molecular signature of CD8+ T cell exhaustion during chronic viral infection. Immunity 27, 670–684 (2007). [DOI] [PubMed] [Google Scholar]
- 8.Angelosanto JM, Blackburn SD, Crawford A & Wherry EJ Progressive loss of memory T cell potential and commitment to exhaustion during chronic viral infection. Journal of virology 86, 8161–8170 (2012). [DOI] [PMC free article] [PubMed] [Google Scholar]
- 9.Shin H, Blackburn SD, Blattman JN & Wherry EJ Viral antigen and extensive division maintain virus-specific CD8 T cells during chronic infection. J Exp Med 204, 941–949 (2007). [DOI] [PMC free article] [PubMed] [Google Scholar]
- 10.Wherry EJ, Barber DL, Kaech SM, Blattman JN & Ahmed R Antigen-independent memory CD8 T cells do not develop during chronic viral infection. Proc Natl Acad Sci U S A 101, 16004–16009 (2004). [DOI] [PMC free article] [PubMed] [Google Scholar]
- 11.Gallimore A et al. Induction and exhaustion of lymphocytic choriomeningitis virus-specific cytotoxic T lymphocytes visualized using soluble tetrameric major histocompatibility complex class I-peptide complexes. J Exp Med 187, 1383–1393 (1998). [DOI] [PMC free article] [PubMed] [Google Scholar]
- 12.Pardoll DM The blockade of immune checkpoints in cancer immunotherapy. Nat Rev Cancer 12, 252–264 (2012). [DOI] [PMC free article] [PubMed] [Google Scholar]
- 13.Wei SC, Duffy CR & Allison JP Fundamental Mechanisms of Immune Checkpoint Blockade Therapy. Cancer Discov 8, 1069–1086 (2018). [DOI] [PubMed] [Google Scholar]
- 14.Hegde PS & Chen DS Top 10 Challenges in Cancer Immunotherapy. Immunity 52, 17–35 (2020). [DOI] [PubMed] [Google Scholar]
- 15.Hamid O et al. Five-year survival outcomes for patients with advanced melanoma treated with pembrolizumab in KEYNOTE-001. Ann Oncol 30, 582–588 (2019). [DOI] [PMC free article] [PubMed] [Google Scholar]
- 16.Seder RA, Darrah PA & Roederer M T-cell quality in memory and protection: implications for vaccine design. Nat Rev Immunol 8, 247–258 (2008). [DOI] [PubMed] [Google Scholar]
- 17.Hoogeveen RC & Boonstra A Checkpoint Inhibitors and Therapeutic Vaccines for the Treatment of Chronic HBV Infection. Front Immunol 11, 401 (2020). [DOI] [PMC free article] [PubMed] [Google Scholar]
- 18.Fisicaro P et al. Pathogenetic Mechanisms of T Cell Dysfunction in Chronic HBV Infection and Related Therapeutic Approaches. Front Immunol 11, 849 (2020). [DOI] [PMC free article] [PubMed] [Google Scholar]
- 19.Wherry EJ T cell exhaustion. Nature immunology 12, 492–499 (2011). [DOI] [PubMed] [Google Scholar]
- 20.Day CL et al. PD-1 expression on HIV-specific T cells is associated with T-cell exhaustion and disease progression. Nature 443, 350–354 (2006). [DOI] [PubMed] [Google Scholar]
- 21.Schuch A et al. Phenotypic and functional differences of HBV core-specific versus HBV polymerase-specific CD8+ T cells in chronically HBV-infected patients with low viral load. Gut (2019). [DOI] [PubMed] [Google Scholar]
- 22.Hoogeveen RC et al. Phenotype and function of HBV-specific T cells is determined by the targeted epitope in addition to the stage of infection. Gut (2018). [DOI] [PubMed] [Google Scholar]
- 23.Kasprowicz V et al. Hepatitis C virus (HCV) sequence variation induces an HCV-specific T-cell phenotype analogous to spontaneous resolution. J Virol 84, 1656–1663 (2010). [DOI] [PMC free article] [PubMed] [Google Scholar]
- 24.Lauer GM & Walker BD Hepatitis C virus infection. N Engl J Med 345, 41–52. (2001). [DOI] [PubMed] [Google Scholar]
- 25.Wolski D et al. Early Transcriptional Divergence Marks Virus-Specific Primary Human CD8(+) T Cells in Chronic versus Acute Infection. Immunity 47, 648–663 e648 (2017). [DOI] [PMC free article] [PubMed] [Google Scholar]
- 26.Holmes JA, Rutledge SM & Chung RT Direct-acting antiviral treatment for hepatitis C. Lancet 393, 1392–1394 (2019). [DOI] [PubMed] [Google Scholar]
- 27.Wieland D et al. TCF1+ hepatitis C virus-specific CD8+ T cells are maintained after cessation of chronic antigen stimulation. Nat Commun 8, 15050 (2017). [DOI] [PMC free article] [PubMed] [Google Scholar]
- 28.Martin B et al. Restoration of HCV-specific CD8+ T cell function by interferon-free therapy. J Hepatol 61, 538–543 (2014). [DOI] [PubMed] [Google Scholar]
- 29.Alfei F et al. TOX reinforces the phenotype and longevity of exhausted T cells in chronic viral infection. Nature 571, 265–269 (2019). [DOI] [PubMed] [Google Scholar]
- 30.Hensel N et al. Memory-like HCV-specific CD8(+) T cells retain a molecular scar after cure of chronic HCV infection. Nat Immunol 22, 229–239 (2021). [DOI] [PubMed] [Google Scholar]
- 31.Holmes JA et al. Dynamic changes in innate immune responses during direct-acting antiviral therapy for HCV infection. J Viral Hepat 26, 362–372 (2019). [DOI] [PubMed] [Google Scholar]
- 32.Kuntzen T et al. Viral sequence evolution in acute hepatitis C virus infection. J Virol 81, 11658–11668 (2007). [DOI] [PMC free article] [PubMed] [Google Scholar]
- 33.Cox AL et al. Cellular immune selection with hepatitis C virus persistence in humans. J Exp Med 201, 1741–1752 (2005). [DOI] [PMC free article] [PubMed] [Google Scholar]
- 34.Timm J et al. CD8 epitope escape and reversion in acute HCV infection. J Exp Med 200, 1593–1604 (2004). [DOI] [PMC free article] [PubMed] [Google Scholar]
- 35.Gruener NH et al. Sustained dysfunction of antiviral CD8(+) T lymphocytes after infection with hepatitis c virus. J Virol 75, 5550–5558. (2001). [DOI] [PMC free article] [PubMed] [Google Scholar]
- 36.Araki K et al. Translation is actively regulated during the differentiation of CD8(+) effector T cells. Nat Immunol 18, 1046–1057 (2017). [DOI] [PMC free article] [PubMed] [Google Scholar]
- 37.Khan O et al. TOX transcriptionally and epigenetically programs CD8(+) T cell exhaustion. Nature 571, 211–218 (2019). [DOI] [PMC free article] [PubMed] [Google Scholar]
- 38.Yao C et al. Single-cell RNA-seq reveals TOX as a key regulator of CD8(+) T cell persistence in chronic infection. Nat Immunol 20, 890–901 (2019). [DOI] [PMC free article] [PubMed] [Google Scholar]
- 39.Utzschneider DT et al. T Cell Factor 1-Expressing Memory-like CD8(+) T Cells Sustain the Immune Response to Chronic Viral Infections. Immunity 45, 415–427 (2016). [DOI] [PubMed] [Google Scholar]
- 40.Henn MR et al. Whole genome deep sequencing of HIV-1 reveals the impact of early minor variants upon immune recognition during acute infection. PLoS Pathog 8, e1002529 (2012). [DOI] [PMC free article] [PubMed] [Google Scholar]
- 41.Tully DC et al. Differences in the Selection Bottleneck between Modes of Sexual Transmission Influence the Genetic Composition of the HIV-1 Founder Virus. PLoS Pathog 12, e1005619 (2016). [DOI] [PMC free article] [PubMed] [Google Scholar]
- 42.Kotecha N, Krutzik PO & Irish JM Web-based analysis and publication of flow cytometry experiments. Curr Protoc Cytom Chapter 10, Unit10 17 (2010). [DOI] [PMC free article] [PubMed] [Google Scholar]
- 43.Metsalu T & Vilo J ClustVis: a web tool for visualizing clustering of multivariate data using Principal Component Analysis and heatmap. Nucleic Acids Res 43, W566–570 (2015). [DOI] [PMC free article] [PubMed] [Google Scholar]
- 44.Picelli S et al. Full-length RNA-seq from single cells using Smart-seq2. Nat Protoc 9, 171–181 (2014). [DOI] [PubMed] [Google Scholar]
- 45.Robinson MD, McCarthy DJ & Smyth GK edgeR: a Bioconductor package for differential expression analysis of digital gene expression data. Bioinformatics 26, 139–140 (2010). [DOI] [PMC free article] [PubMed] [Google Scholar]
- 46.Law CW, Chen Y, Shi W & Smyth GK voom: Precision weights unlock linear model analysis tools for RNA-seq read counts. Genome Biol 15, R29 (2014). [DOI] [PMC free article] [PubMed] [Google Scholar]
- 47.Ritchie ME et al. limma powers differential expression analyses for RNA-sequencing and microarray studies. Nucleic Acids Res 43, e47 (2015). [DOI] [PMC free article] [PubMed] [Google Scholar]
- 48.Benjamini Y & Hochberg Y Controlling the False Discovery Rate: A Practical and Powerful Approach to Multiple Testing. Journal of the Royal Statistical Society: Series B (Methodological) 57, 289–300 (1995). [Google Scholar]
- 49.Johnson WE, Li C & Rabinovic A Adjusting batch effects in microarray expression data using empirical Bayes methods. Biostatistics 8, 118–127 (2007). [DOI] [PubMed] [Google Scholar]
- 50.Subramanian A et al. Gene set enrichment analysis: a knowledge-based approach for interpreting genome-wide expression profiles. Proc Natl Acad Sci U S A 102, 15545–15550 (2005). [DOI] [PMC free article] [PubMed] [Google Scholar]
- 51.Mootha VK et al. PGC-1alpha-responsive genes involved in oxidative phosphorylation are coordinately downregulated in human diabetes. Nat Genet 34, 267–273 (2003). [DOI] [PubMed] [Google Scholar]
- 52.Khan A et al. JASPAR 2018: update of the open-access database of transcription factor binding profiles and its web framework. Nucleic Acids Res 46, D1284 (2018). [DOI] [PMC free article] [PubMed] [Google Scholar]
- 53.Consortium, E.P. A user’s guide to the encyclopedia of DNA elements (ENCODE). PLoS Biol 9, e1001046 (2011). [DOI] [PMC free article] [PubMed] [Google Scholar]
Associated Data
This section collects any data citations, data availability statements, or supplementary materials included in this article.
Supplementary Materials
Data Availability Statement
HCV epitope sequences have been deposited to the NCBI Sequence Read Archive under accession numbers SRR11811484 – SRR11811504. RNA-sequencing and TCR-sequencing data from this study will be made publicly available through the NCBI Gene Expression Omnibus (GEO) and/or NCBI database of Genotypes and Phenotypes (dbGaP). The remaining data supporting the findings of this study are available from the corresponding authors upon request.


