Abstract
Purpose:
The aim of this study was to develop a high-resolution 3D oxygen-17 (17O) MRI method to delineate the kinetics of 17O-enriched water (H217O) across the entire mouse brain after a bolus injection via the tail vein.
Methods:
The dynamic 17O signal was acquired with a golden-means-based 3D radial sampling scheme. To achieve adequate temporal resolution with preserved spatial resolution, a k-space–weighted view sharing strategy was used in image reconstruction with an adaptive window size tailored to the kinetics of the 17O signal. Simulation studies were performed to determine the adequate image reconstruction parameters. The established method was applied to delineating the kinetics of intravenously injected H217O in vivo in the post-stroke mouse brain.
Results:
The proposed dynamic 17O-MRI method achieved an isotropic resolution of 1.21 mm (0.77 mm nominal) in mouse brain at 9.4T, with the temporal resolution increased gradually from 3 s at the initial phase of rapid signal increase to 15 s at the steady-state. The high spatial resolution enabled the delineation of the heterogeneous H217O uptake and washout kinetics in stroke-affected mouse brain.
Conclusion:
The current study demonstrated a 3D 17O-MRI method for dynamic monitoring of 17O signal changes with high spatial and temporal resolution. The method can be utilized to quantify physiological parameters such as cerebral blood flow and blood–brain barrier permeability by tracking injected H217O. It can also be used to measure oxygen consumption rate in 17O-oxygen inhalation studies.
Keywords: adaptive temporal resolution, golden-means-based radial sampling, k-space–weighted image reconstruction, oxygen-17 MRI, stroke
1 |. INTRODUCTION
Oxygen-17 MRI (17O-MRI) using 17O-enriched water (H217O) as a nontoxic and diffusible tracer allows in vivo assessment of cerebral perfusion.1,2 More recently, it has also been used to evaluate water exchange across the blood–brain barrier (BBB) and the glymphatic pathway of water influx into the cerebrospinal fluid.3–5 With a bolus injection of H217O into the vascular space, the arterial blood carrying high concentration of H217O gives rise to a rapid increase of the 17O signal in the brain. Subsequently, the water exchange among the capillary, tissue, and cerebrospinal fluid leads to a period of 17O signal decrease, that is, the washout phase, until the H217O exchange reaches an equilibrium. Similar to positron emission tomography studies using oxygen-15–enriched water (H215O) as a tracer, the peak 17O signal and the rate of H217O washout are a complex interplay of several physiological parameters, including the cerebral blood flow (CBF) and BBB permeability to water.6,7 Quantitative assessment of these physiological parameters is possible by employing a kinetic modeling approach. However, there currently remains the lack of a robust imaging method that can capture the changes in absolute H217O concentration with adequate spatial and temporal resolution.
In a dynamic 17O-MRI study, H217O can be detected directly using a coil tuned to the resonance frequency of 17O.8–10 It can also be detected indirectly from the proton (1H) signal via the T2-shortening effect of the 17O-1H scalar coupling11,12 or by T1ρ-dispersion imaging.13,14 Although the indirect method provides high spatial resolution, conversion of T2- or T1ρ-weighted signal to H217O concentration is complicated by the nonlinear relationship between the signal intensity and H217O concentration. In contrast, the 17O signal acquired using the direct method is not only proportional to H217O concentration but can also increase by several fold above the baseline level with a mere bolus injection of a trace amount of H217O. Thus, direct 17O-MRI provides a large dynamic range for quantifying the kinetics of signal changes.5 However, a major limitation of the direct method is its low signal-to-noise ratio (SNR) due to the low MR sensitivity and low natural abundance of 17O. The short T2 of 17O (~4 ms) has also limited the use of the multiecho techniques for accelerated image acquisition. As a result, 17O images are typically acquired with low spatial resolution in order to gain adequate SNR and temporal resolution.
Previously, we used a golden-ratio-based, stack-of-stars sampling scheme in combination with k-space–weighted image contrast (KWIC) reconstruction strategy for improved spatial and temporal resolution.15 We were able to achieve a voxel size of 11.25 µL and a temporal resolution of 7.56 s in an H217O injection study performed on mice. The use of the stack-of-stars readout, however, limited the further improvement of the spatial resolution along the slice direction because increasing the phase-encoding steps inevitably reduces the temporal resolution. In contrast, a golden-means-based 3D radial sampling scheme has the advantage of providing isotropic high spatial resolution with a high temporal resolution, as was recently demonstrated in a dynamic contrast-enhanced 1H-MRI study by Zhang et al.16 More importantly, the nearly uniform coverage of the k-space by the golden-means-based sampling pattern offers the flexibility of image reconstruction with different temporal window sizes. In an H217O-injection study, high temporal resolution is necessary to capture the rapid signal increase during the injection phase, whereas trading temporal resolution for improved SNR is acceptable when the signal approaches steady-state in the washout phase. Hence, image reconstruction using adaptive temporal resolution has the potential for more accurate delineation of the 17O signal kinetics.
In this study, we aimed at developing a 3D 17O-MRI method for acquiring and processing dynamic 17O-MRI data from the entire mouse brain. Data acquisition used a golden-means-based 3D radial sampling scheme. Dynamic 17O images were reconstructed using a KWIC-based approach with an adaptive window size ranging from 3 to 15 s. Parametric maps of the 17O signal kinetics were generated with an isotropic resolution of 1.21 mm (0.77 mm nominal). Simulation studies were performed to evaluate the performance of using adaptive temporal resolution in quantifying H217O uptake and washout kinetics in an H217O-injection study. Subsequently, the utility of the proposed method for in vivo delineation of H217O kinetics was demonstrated in a mouse model of acute stroke.
2 |. METHODS
2.1 |. Data acquisition using golden-means-based 3D radial sampling
The oversampling of the center k-space in a 3D radial trajectory provides the opportunity for image reconstruction at high temporal resolution using a KWIC-based image reconstruction approach.17 To ensure nearly uniform coverage of the k-space with desired temporal resolution, data acquisition used a center-out, golden-means-based 3D radial sampling scheme.18 Specifically, the 2D goldenmeans derived from the modified Fibonacci sequence,φ1 = 0.6823 and φ2 = 0.4656, were used to determine the azimuthal (α) and polar (β) angles of a radial spoke (Figure 1A). For the mth radial spoke, these 2 angles were:
| (1) |
FIGURE 1.
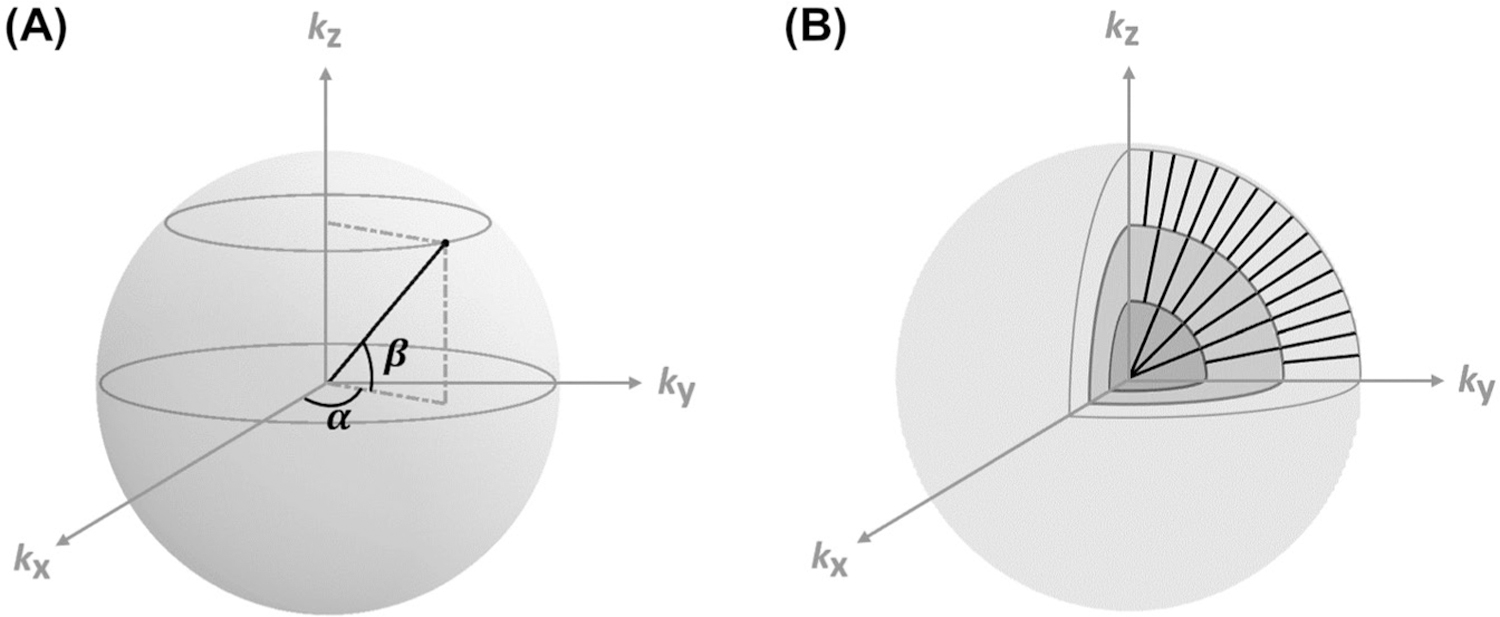
Schematics of data sampling and image reconstruction. (A) Golden-means-based radial sampling. α and β are the azimuthal and polar angles of a radial spoke, respectively. (B) KWIC-based image reconstruction. Only 3 concentric shells in the partitioned k-space are shown. Number of spokes used in image reconstruction increased from the inner to outer shells. KWIC, k-space–weighted image contrast.
Dynamic 17O data were acquired with 10-ms repetition time and 0.75-ms echo time. Along each radial spoke, 16 data points were acquired with a sampling interval (Δk) of 1/24 mm−1 and a readout bandwidth of 8012 Hz, leading to a kmax of 15/24 mm−1 with a 2-ms readout time. These imaging parameters allowed image reconstruction with a field of view of 24 × 24 × 24 mm3 and a matrix size of 31 × 31 × 31, corresponding to a nominal resolution of 0.77 × 0.77 × 0.77 mm3 (0.46 µL).
2.2 |. Image reconstruction with adaptive window size
Taking advantage of the oversampling of the center k-space by a radial trajectory, the KWIC-based strategy allows image reconstruction at a desirable temporal resolution with preserved spatial resolution.17,19 In the current study, the k-space was partitioned into 10 concentric shells as illustrated in Figure 1B.
The radius of each shell and the minimal number of radial spokes required to fulfill the Nyquist criterion in each shell are listed in Table 1. For the reconstruction of a specific time frame, the innermost shell located at the center of the k-space was filled with a few radial spokes acquired around that time point, whereas the outer shells were filled by including more radial spokes acquired further away from that time point. In combination with view-sharing, this approach allowed image reconstruction at the temporal resolution (window size) that was equivalent to the time spent on acquiring the spokes needed to fill the innermost shell. With a 10-ms repetition time, only 0.6 s of data acquisition was needed to fully sample the innermost shell, and thus a minimal window size of only 0.6 s. More spokes can be incorporated in each shell to improve the SNR with reduced temporal resolution. Hence, this KWIC-based view-sharing scheme enabled image reconstruction with flexible window size to achieve a balance between SNR and accurate delineation of signal kinetics. For a chosen window size, the number of spokes acquired in each shell was increased by the same ratio as the chosen window size and the minimal window size, maintaining consistent weighting of the sampling density in each shell.
TABLE 1.
Partition of k-space for KWIC reconstruction
| Shell no. | Radius (Δk steps) | No. Spokes |
|---|---|---|
| 1 | 2 | 60 |
| 2 | 3 | 129 |
| 3 | 4 | 277 |
| 4 | 5 | 406 |
| 5 | 6 | 595 |
| 6 | 7 | 872 |
| 7 | 9 | 1278 |
| 8 | 11 | 1873 |
| 9 | 13 | 2745 |
| 10 | 15 | 4023 |
Radius: outer radius of each shell in number of Δk steps.
No. spokes: minimal number of spokes required to fulfill the Nyquist criterion for each shell.
Abbreviation: KWIC, k-space–weighted image contrast; Δk, k-space sampling interval.
2.3 |. Simulation studies
Simulation studies were performed on a modified 3D Shepp-Logan phantom to evaluate the efficacy of image reconstruction with adaptive temporal resolution. The phantom comprised of 3 compartments with the dynamics of 17O signal in each compartment representative of the normal brain tissue, the infarct core, and the ischemic penumbra in a post-stroke mouse brain, respectively (Figure 2A). The time courses of the 17O signal in each compartment consisted of 3 segments representing the baseline, wash-in, and washout phases in an H217O-injection study (Figure 2B). The parameters used to simulate the dynamic 17O signal are listed in Table S1 of the supplementary materials. The baseline 17O signal was a constant normalized to 1. The injection phase was represented by a rapid, linear increase of the signal by sixfold to tenfold in 12 s. The washout phase was represented by a monoexponential decay of the signal, with the rate constant being the fastest in the normal tissue and the slowest in the infarct core.
FIGURE 2.
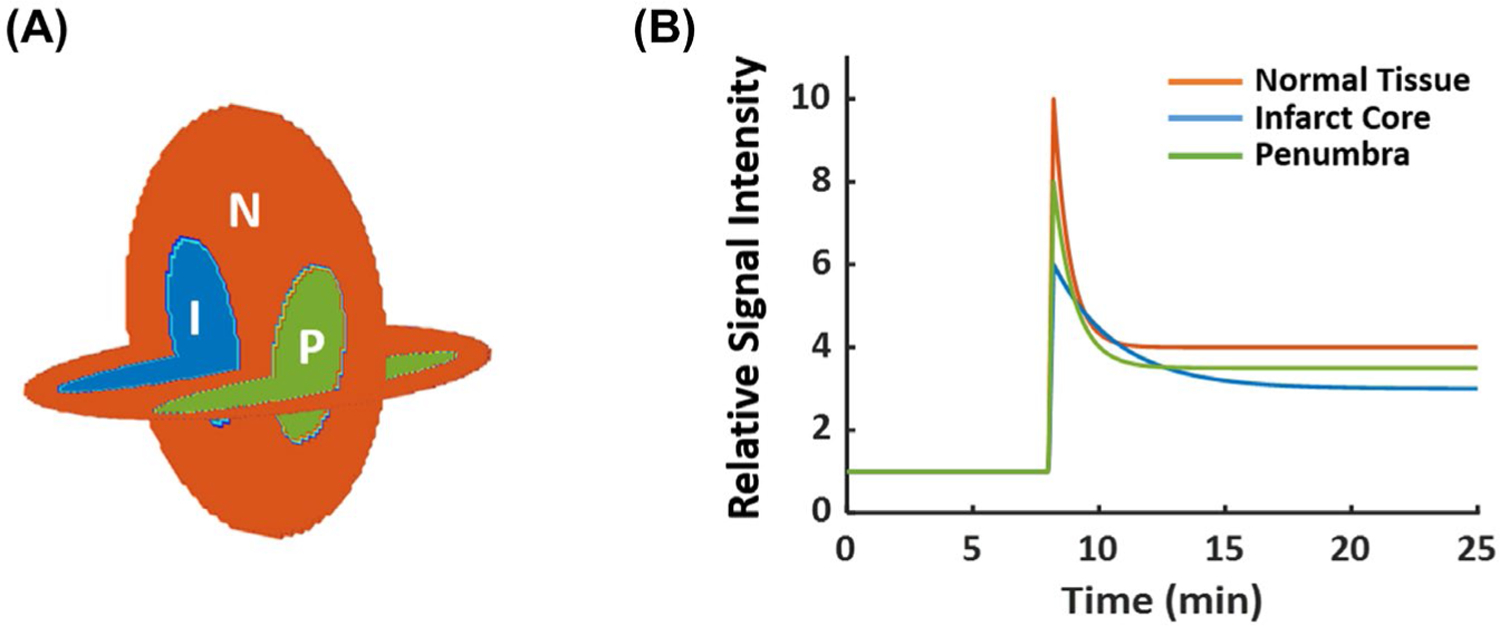
In silico phantom for simulation studies. (A) Three-compartment phantom. (B) Ground-truth dynamic 17O signals for each of the 3 compartments. 17O, oxygen-17; I, infarct core; N, normal tissue; P, penumbra.
High-resolution digital phantom was generated on a Cartesian grid with a matrix size of 128 × 128 × 128 and an field of view of 24 × 24 × 24 mm3. Simulated data were generated by radially sampling the phantom using the parameters described above. A total of 25 min continuous data acquisition was simulated covering 8 min of baseline and 17 min of H217O injection and washout. One radial spoke was sampled every 10 ms, leading to a total of 150,000 spokes along the time course of the 25-min data acquisition. Gaussian noise was added to each spoke, with the noise level matching that of the in vivo data. To account for the effect of decay, the k-space data were modulated by an exponential function with a time constant of 1 ms.
Baseline 17O image was reconstructed using all k-space data acquired during the 8-min baseline scan. A Hamming filter was applied to the baseline k-space data to improve the SNR. Varied window size tailored to the dynamics of the signal was used in the reconstruction of dynamic 17O data using the KWIC strategy. A 3-s window size was used to capture the rapid signal increase after the bolus injection. During the washout phase, the window size increased gradually according to the rate of signal change in the center k-space (Figure 3A-C). Specifically, the washout part of the center k-space data were fit with an exponential function, and the first-order derivative (k) of the exponential function was calculated. Subsequently, the window size (W) was calculated as
| (2) |
where W0 is the window size at the start of the washout phase; ΔW is the step size of each increment; NW is the number of increment steps; and k0 is the first-order derivative at the start of the washout phase. A step size (ΔW) of 3 s and 4 increment steps (NW) were used in the current study, which allowed the window size to change gradually from 3 s at the start of the washout phase to 15 s at the steady-state. From the reconstructed dynamic images, maps of the washout rate, peak, and steady-state of the 17O signal were estimated from pixel-wise fitting of the washout curve to a monoexponential function. Parameter estimation using the adaptive reconstruction strategy was compared with that using a fixed window size of either 3 s or 15 s.
FIGURE 3.
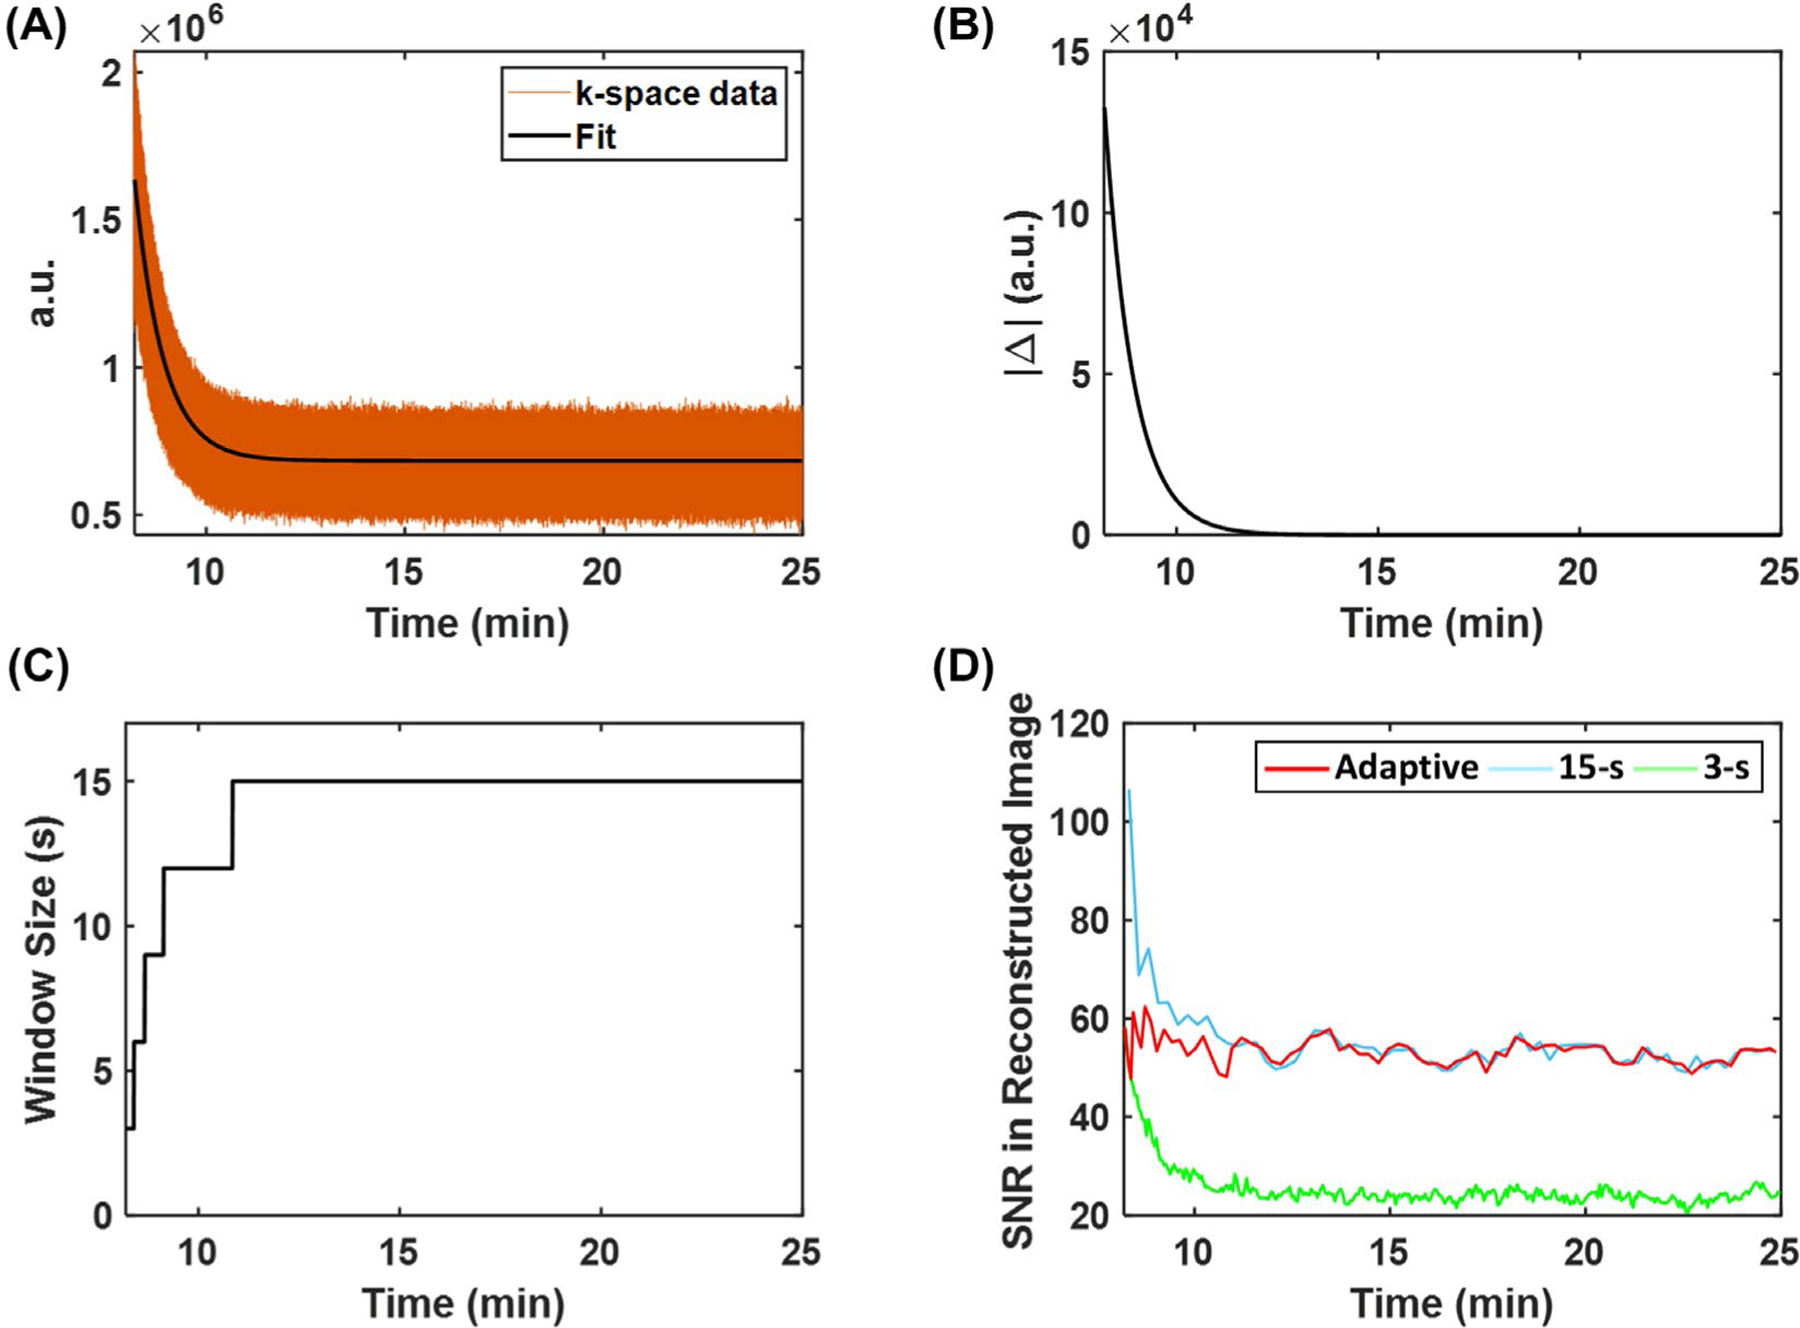
Image reconstruction using adaptive temporal resolution. (A) The exponential fitting of center k-space data acquired during the washout phase. (B) The magnitude of the first-order derivative of the exponential curve. (C) The variable window size chosen for image reconstruction. (D) Comparison of SNR of images reconstructed using adaptive and fixed temporal resolution.
2.4 |. Phantom studies
All MRI studies were performed on a 9.4T Bruker Biospec scanner (Bruker Biospin Inc., Billerica, MA). 17O data were acquired using a custom-built 2-cm surface coil, whereas 1H imaging used a 3-cm birdcage coil (M2M Imaging Corp., Cleveland, OH). The point spread function (PSF) of the proposed method was measured using a microhematocrit capillary tube with an inner diameter of 1 mm. The tube was filled with H217O (40% enrichment) and placed in parallel to the z-direction of the magnet. 3D 17O data were acquired using the golden-means-based sampling scheme. As a comparison, 17O data were also acquired using conventional 3D radial sampling. Specifically, radial spokes were sampled at 51 polar angles distributed evenly between 0° and 180°. For a specific polar angle β, ⌈32π ⋅ sinβ ⌉ azimuthal angles that distributed evenly between 0° and 360° were sampled (⌈ ⋅ ⌉ denotes ceiling function). A total of 4,023 spokes were acquired for both the golden-means-based and the conventional 3D radial sampling schemes. PSF of 3 different acquisition/reconstruction strategies were evaluated, including conventional radial sampling, golden-means-based sampling, and golden-means-based sampling combined with KWIC reconstruction using a window size of 0.6 or 3 s, respectively. The full-width-half-maximum and the SNR of the PSF were compared.
2.5 |. In vivo studies
All animal procedures were conducted in accordance with the protocol approved by the Institutional Animal Care and Use Committee of Case Western Reserve University. Eight male C57/BL6 mice (3- to 6-months old, 29–32 g body weight) underwent transient occlusion of the middle cerebral artery (MCA). Specifically, MCA occlusion was induced by inserting a silicone-coated filament (Doccol Corp., Sharon, MA) via the external carotid artery and advancing into the internal carotid artery (ICA). The filament was withdrawn after 60 min to resume cerebral perfusion. Before the closure of the surgical incision, both the external carotid artery and the common carotid artery (CCA) were permanently ligated in 3 mice (the Koizumi procedure), whereas the remaining 5 mice only went through external carotid artery ligation (the Longa procedure).20
MRI studies were performed at ~2 hours after the reperfusion. Anesthesia was initiated with 2% isoflurane mixed with 100% oxygen in an induction chamber and maintained with 0.5% to 1.0% isoflurane mixed with 100% oxygen delivered via a nose cone. A 25-gauge catheter was inserted into the tail vein. The animal was placed in prone position in a cradle with the 17O surface coil placed on top of the head. The cradle was then transferred into the 1H volume coil placed at the isocenter of the scanner. Body temperature was maintained at ~35°C by blowing warm air into the scanner through a feedback control system (SA Instruments, Stony Brook, NY). Respiration rate was maintained above 80 breaths per min by adjusting the level of isoflurane.
T2-weighted 1H images were acquired using a 3D rapid acquisition with relaxation enhancement (RARE) sequence. Imaging parameters were TR = 1 s, effective echo time = 48 ms, echo spacing = 16 ms, echo train length = 8, field of view = 32 × 15 × 15 mm3, and matrix size = 160 × 75 × 75. Two signal averages were acquired, leading to a total acquisition time of 22 min. These acquisition parameters allowed the coverage of the entire mouse brain with an isotropic resolution of 200 µm.
17O data acquisition began with the acquisition of the baseline signal for 8 min. A bolus of 100 µL of H217O (40% enrichment) was injected via the tail vein catheter in 5 to 10 s after the baseline scan. 17O data acquisition continued for another 17 min during the injection and the washout phase until steady-state was reached. Reconstruction of dynamic 17O data used the KWIC strategy with an adaptive window size as described above. The gridded k-space data were zero-padded twice before Fourier transform. From reconstructed images, pixel-wise monoexponential fitting was applied to the washout phase of the dynamic signal, yielding maps of the washout rate, peak, and steady-state of 17O signal.
The estimated parameters in the stroke-affected regions were compared to those in the contralateral side in selected regions of interest (ROIs). The ROIs were selected according to the Allen Mouse Brain Atlas by registering the T2-weighted 1H images to the atlas.21 Five ROIs in the MCA perfusion territory were selected, including the somatosensory cortex (M1), insular cortex (M2), piriform cortex (M3), auditory cortex (M4), and caudoputamen (M5). In addition, one ROI in the perfusion territory of the anterior cerebral artery (ACA)—the motor cortex (A1); and 2 ROIs in the perfusion territory of the posterior cerebral artery (PCA)—the hippocampus (P1) and thalamus (P2)—were also selected. The mean values of the washout rate and the peak and steady-state 17O signal in these ROIs were calculated.
2.6 |. TTC Staining
The animal was euthanized immediately after the MRI experiments (~4 hours after reperfusion). The brain was excised and sectioned into 1-mm thick axial slices. The brain slices were incubated in 2% 2,3,5-triphenyltetrazolium chloride (TTC) solution at 37°C for 20 min and were flipped at 10 min to ensure even staining on both sides. After incubation, the brain slices were washed with phosphate buffered saline and photographed.
2.7 |. Statistical analysis
The washout rate and the peak and steady-state 17O signal are reported as mean ± standard deviation. Two-way analysis of variance was used for data comparison in the selected ROIs. If statistical differences were detected, pair-wise comparisons were performed using a 2-tailed Student t-test. An unpaired 2-tailed Student t-test was used to compare the estimated parameters between MCA occlusion mice with and without CCA ligation. A paired 2-tailed Student t-test was used to compare the parameters between the 2 hemispheres, as well as between the stroke-affected and the contralateral ROIs. Significant difference was accepted at P < .05.
3 |. RESULTS
3.1 |. Simulation results
Figure 3D shows SNR changes using different image reconstruction strategies, and Figure 4 shows reconstructed dynamic 17O signals from simulated data. Comparisons of parameter estimation using different temporal resolution are shown in Figure 5 and Supporting Information Figure S1. There was an overestimation of the peak and steady-state 17 O signals in the 2 stroke-related compartments by all 3 methods, which was largely caused by signal leakage from the surrounding normal tissue compartment due to the low spatial resolution. Although a 15 -s window size gave rise to higher SNR, it was unable to accurately capture the dynamics of the signal at the early stage of washout because of the strong smoothing effect. As a result, the estimated washout rate constant and peak signal showed larger deviations from the ground truth using the fixed 15-s temporal resolution. In contrast, the improved temporal resolution using a 3-s window size led to better agreement between the mean values of the estimated parameters and the ground truth. However, there were large variations in the estimated washout rate due to reduced SNR. Image reconstruction using an adaptive window size allowed a relatively constant SNR level, achieving a balance between adequate SNR and accurate delineation of 17O signal dynamics, which allowed better agreement with the ground truth compared to the 15 s window size and up to twofold reduction in the variations of the estimated washout rate compared to the 3-s window size.
FIGURE 4.
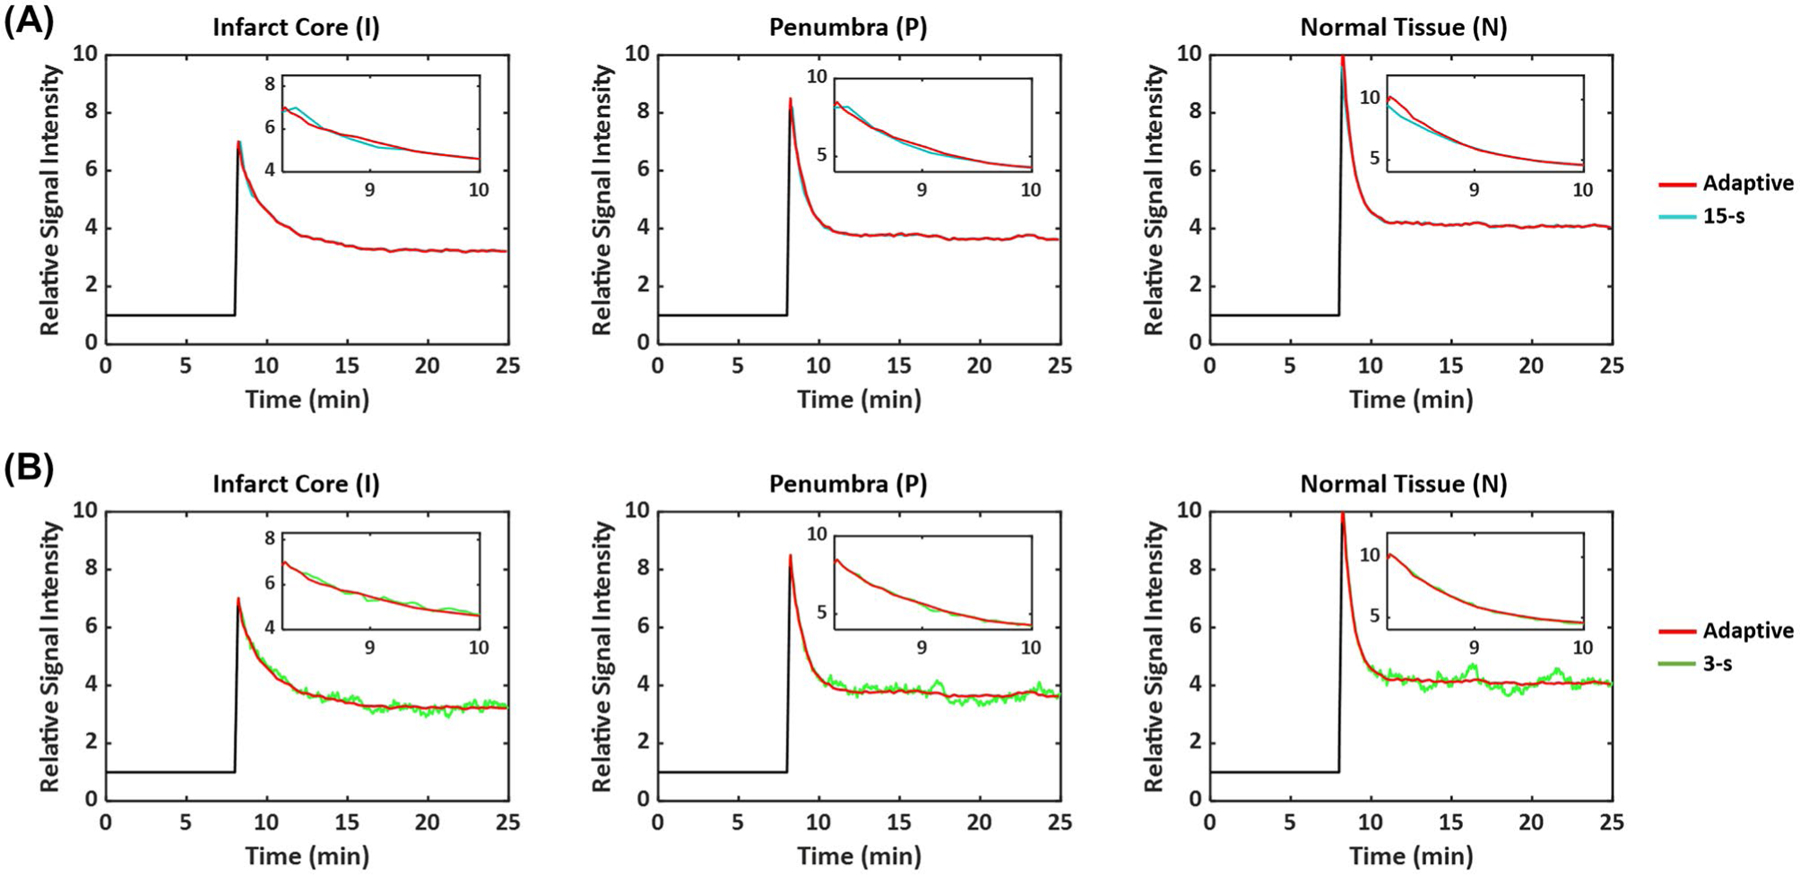
Reconstructed dynamic 17O signals from simulation study using adaptive and fixed temporal resolution. (A) Comparison between adaptive and 15-s resolution. (B) Comparison between adaptive and 3-s resolution. The inset figures show the first 2.5 min of the washout phase.
FIGURE 5.
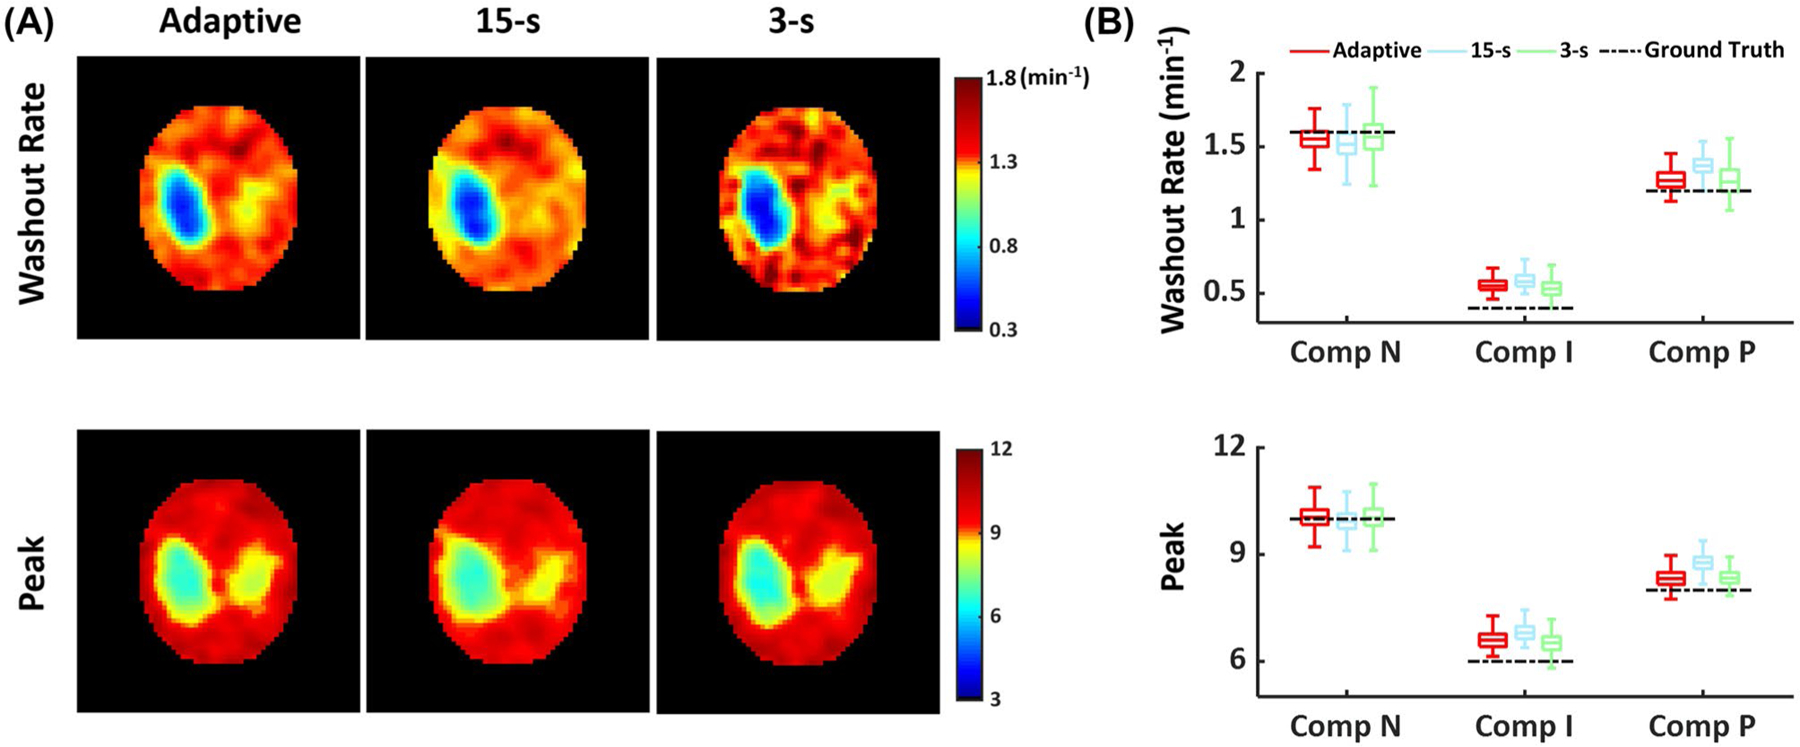
In silico comparison of parameter mapping using adaptive and fixed temporal resolution. (A) Parametric maps of washout rate (top) and peak (bottom) 17O signal. (B) Boxplots of washout rate (top) and peak (bottom) 17O signal in each compartment.
3.2 |. Phantom results
Supporting Information Figure S2 shows the measured PSF using the 1-mm capillary tube. The full-width-half-maximum of the PSF acquired using the golden-means-based sampling scheme was similar to that acquired using the conventional radial sampling (1.21 mm), leading to a true voxel size of 1.77 μL. This measured resolution was approximately 1.57-fold of the nominal resolution (0.77 mm), which was in agreement with the theoretical prediction of the broadening effect inherent to radial sampling.22 KWIC reconstruction using different window sizes maintained the full-width-half-maximum of PSF at 1.21 mm. However, a 3-s window size yielded ~2.2-fold SNR gain compared to a 0.6-s window size, which was in agreement with theoretical prediction.23
3.3 |. In vivo results
Figure 6 shows reconstructed 17O images without zero-padding, overlaid on T2-weighted images in the coronal and axial views, as well as dynamic 17O signals from pixels in the ipsilateral and the contralateral hemispheres from 2 mice, one with and another without CCA ligation. SNR of the reconstructed 17O images ranged from 30.2 to 41.4. Parametric maps and the mean values of the washout rate and peak and steady-state 17O signals are shown in Figure 7. All of the mice did not show obvious abnormality in T2-weighted 1H images at this early time point (about 2 hours after reperfusion). In the normal contralateral hemisphere, there was a ~9.2-fold increase in peak 17O signal immediately after the bolus injection of H217O, whereas accumulation of H217O at the steady-state gave rise to a ~4.9-fold increase above the baseline level. The mean washout rate in the contralateral hemisphere was 0.60 ± 0.07 min−1. In comparison, the ipsilateral hemisphere showed a significant reduction in the washout rate in mice both with (0.37 ± 0.10 min−1) and without (0.53 ± 0.05 min−1) CCA ligation, with the reduction in mice with CCA ligation more pronounced (P < .05). In addition, mice with CCA ligation also showed a significant reduction in peak H217O uptake by 24% (P < .05) and a trend of reduction in steady-state H217O accumulation in the stroke-affected hemisphere (P = .16). Mice without CCA ligation showed less pronounced reduction in peak H217O uptake and steady-state H217O accumulation that did not reach statistical significance (P = .08 and .12, respectively).
FIGURE 6.
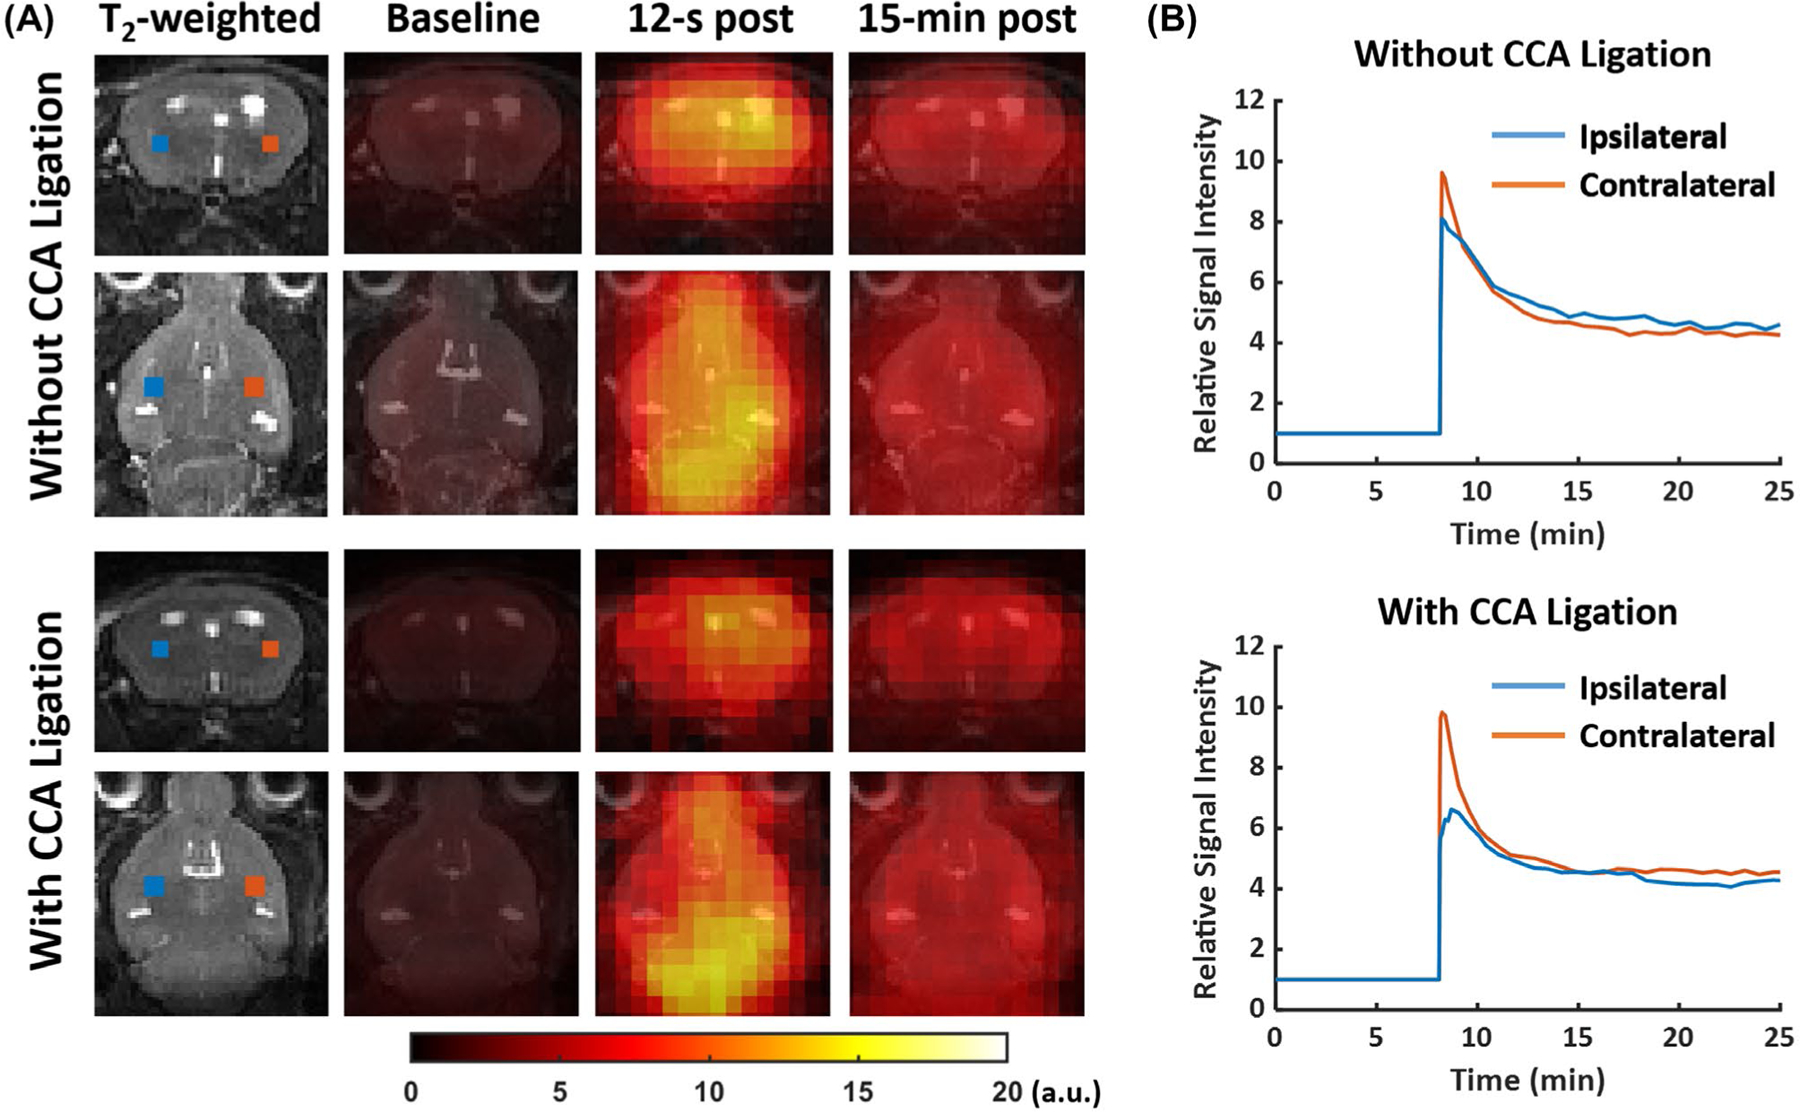
Representative 17O images and dynamic 17O signals in post-stroke mouse brain. (A) T2-weighted images and reconstructed 17O images at baseline, 12 s, and 15 min post-H217O injection. (B) Baseline-normalized dynamic 17O signals in pixels from the ipsilateral (blue) and contralateral (red) hemispheres. The locations of the pixels are marked in the T2-weighted images in (A).
FIGURE 7.
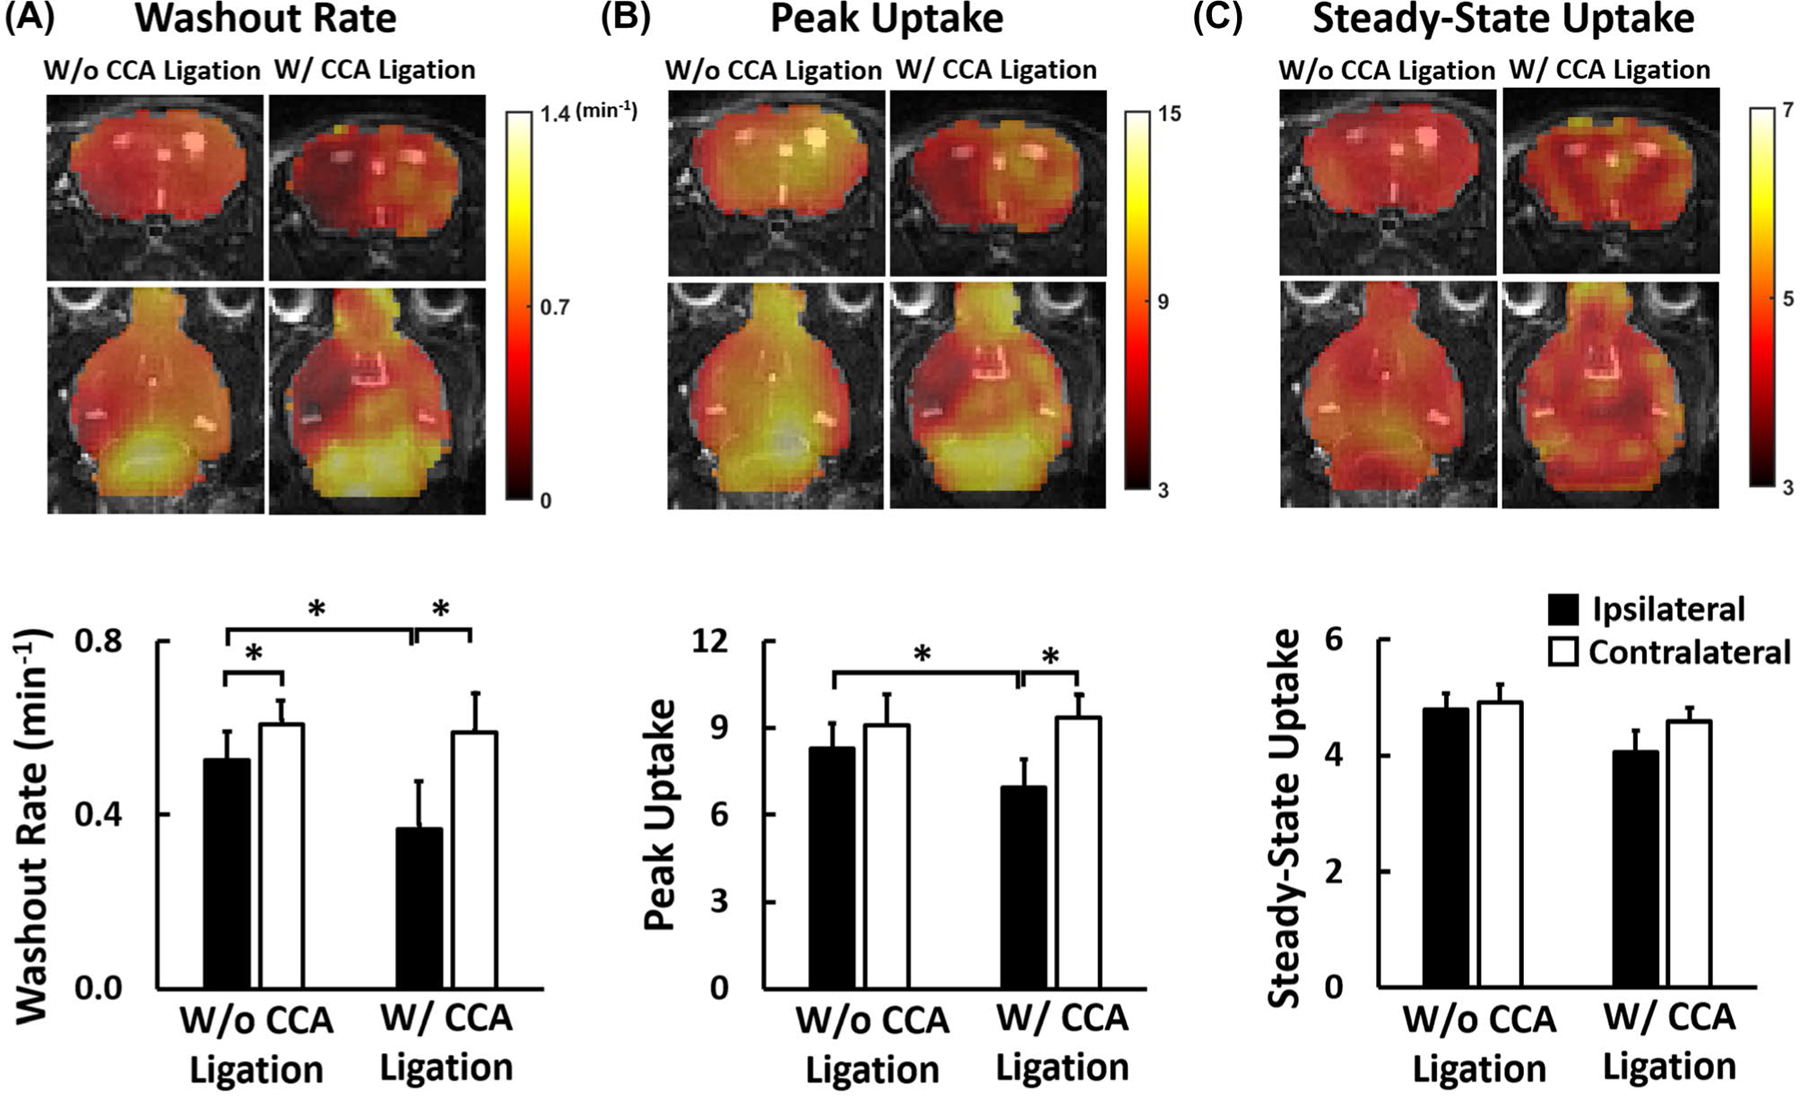
Parameters of 17O signal kinetics in the ipsilateral and contralateral hemispheres of MCAO mice. (A) H217O washout rate; (B) peak 17O signal; (C) steady-state 17O signal. Top: parametric maps. Bottom: comparison of group-averaged parameters. *P < .05. H217O, 17O-enriched water; MCAO, middle cerebral artery occlusion.
Figure 8 and Supporting Information Figure S3 show the comparisons of the H217O washout rate and baseline-normalized peak H217O uptake in selected ROIs, respectively. Compared to the contralateral side, there were a 10% to 75% reduction in the washout rate and a 5% to 40% reduction in peak H217O uptake in stroke-affected ROIs. Mice with CCA ligation also showed more pronounced reduction in these ROIs compared to mice without CCA ligation. For mice with CCA ligation, the most severe reduction (> 30%) in both the washout rate and peak H217O uptake occurred consistently in the MCA perfusion territory consisting of the insular (M2) and the piriform (M3) cortex. In comparison, mice without CCA ligation showed the lowest washout rate and peak H217O uptake either in the somatosensory (M1) cortex or in the piriform (M4) cortex. In addition, the caudoputamen (M5) area showed significantly reduced washout rate and peak H217O uptake in all mice, although less severe than those in the cortical areas described above. Further, the reduced H217O kinetics occurred not only in the ROIs within the MCA perfusion territory but also in the hippocampus (P1) and thalamus (P2), which are in the PCA perfusion territory.
FIGURE 8.
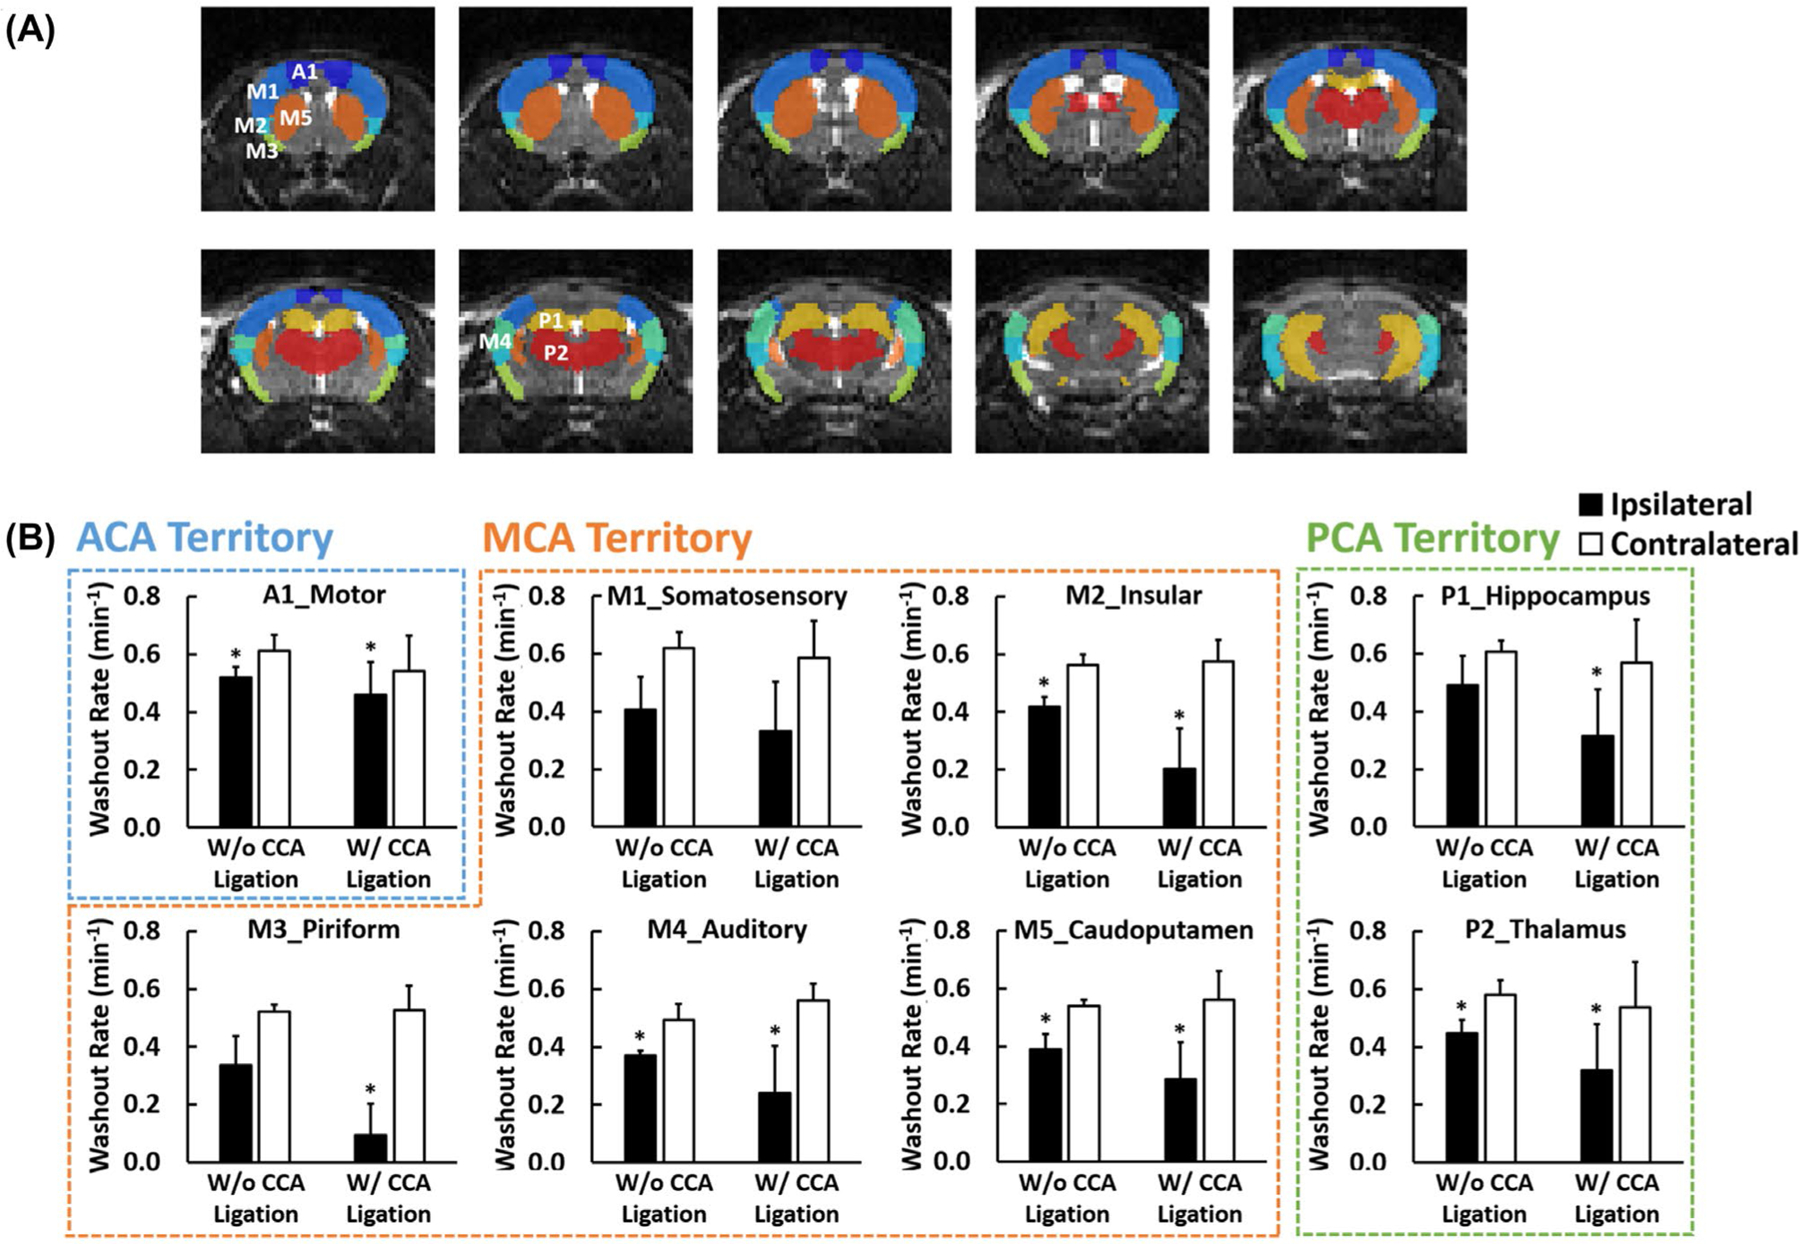
Parameter comparisons in selected ROIs. (A) Segmentation of 8 ROIs. (B) Group-averaged H217O washout rate in the ipsilateral (solid bars) and contralateral (open bars) ROIs. A1, motor cortex (dark blue); M1, somatosensory cortex (blue); M2, insular cortex (light blue); M3, piriform cortex (green); M4, auditory cortex (cyan); M5, caudoputamen (brown); P1, hippocampus (yellow); P2, thalamus (red); ROI, region of interest.
Mice without CCA ligation did not show obvious defects in TTC staining at this early time point. Figure 9 and Supporting Information Figure S4 show the TTC staining of a mouse with CCA ligation and the variations in H217O kinetics in different axial slices from anterior to posterior. The infarct lesion mainly spanned the regions of the insular (M2) and the piriform (M3) cortex, where the greatest reduction in H217O kinetics were observed. Changes in H217O kinetics in the anteroposterior direction showed a good agreement with the TTC staining in the insular (M2) cortex, where the greatest reduction occurred at the slice with TTC-stained lesions. The washout rate in the piriform (M3) cortex remained low in all slices.
FIGURE 9.
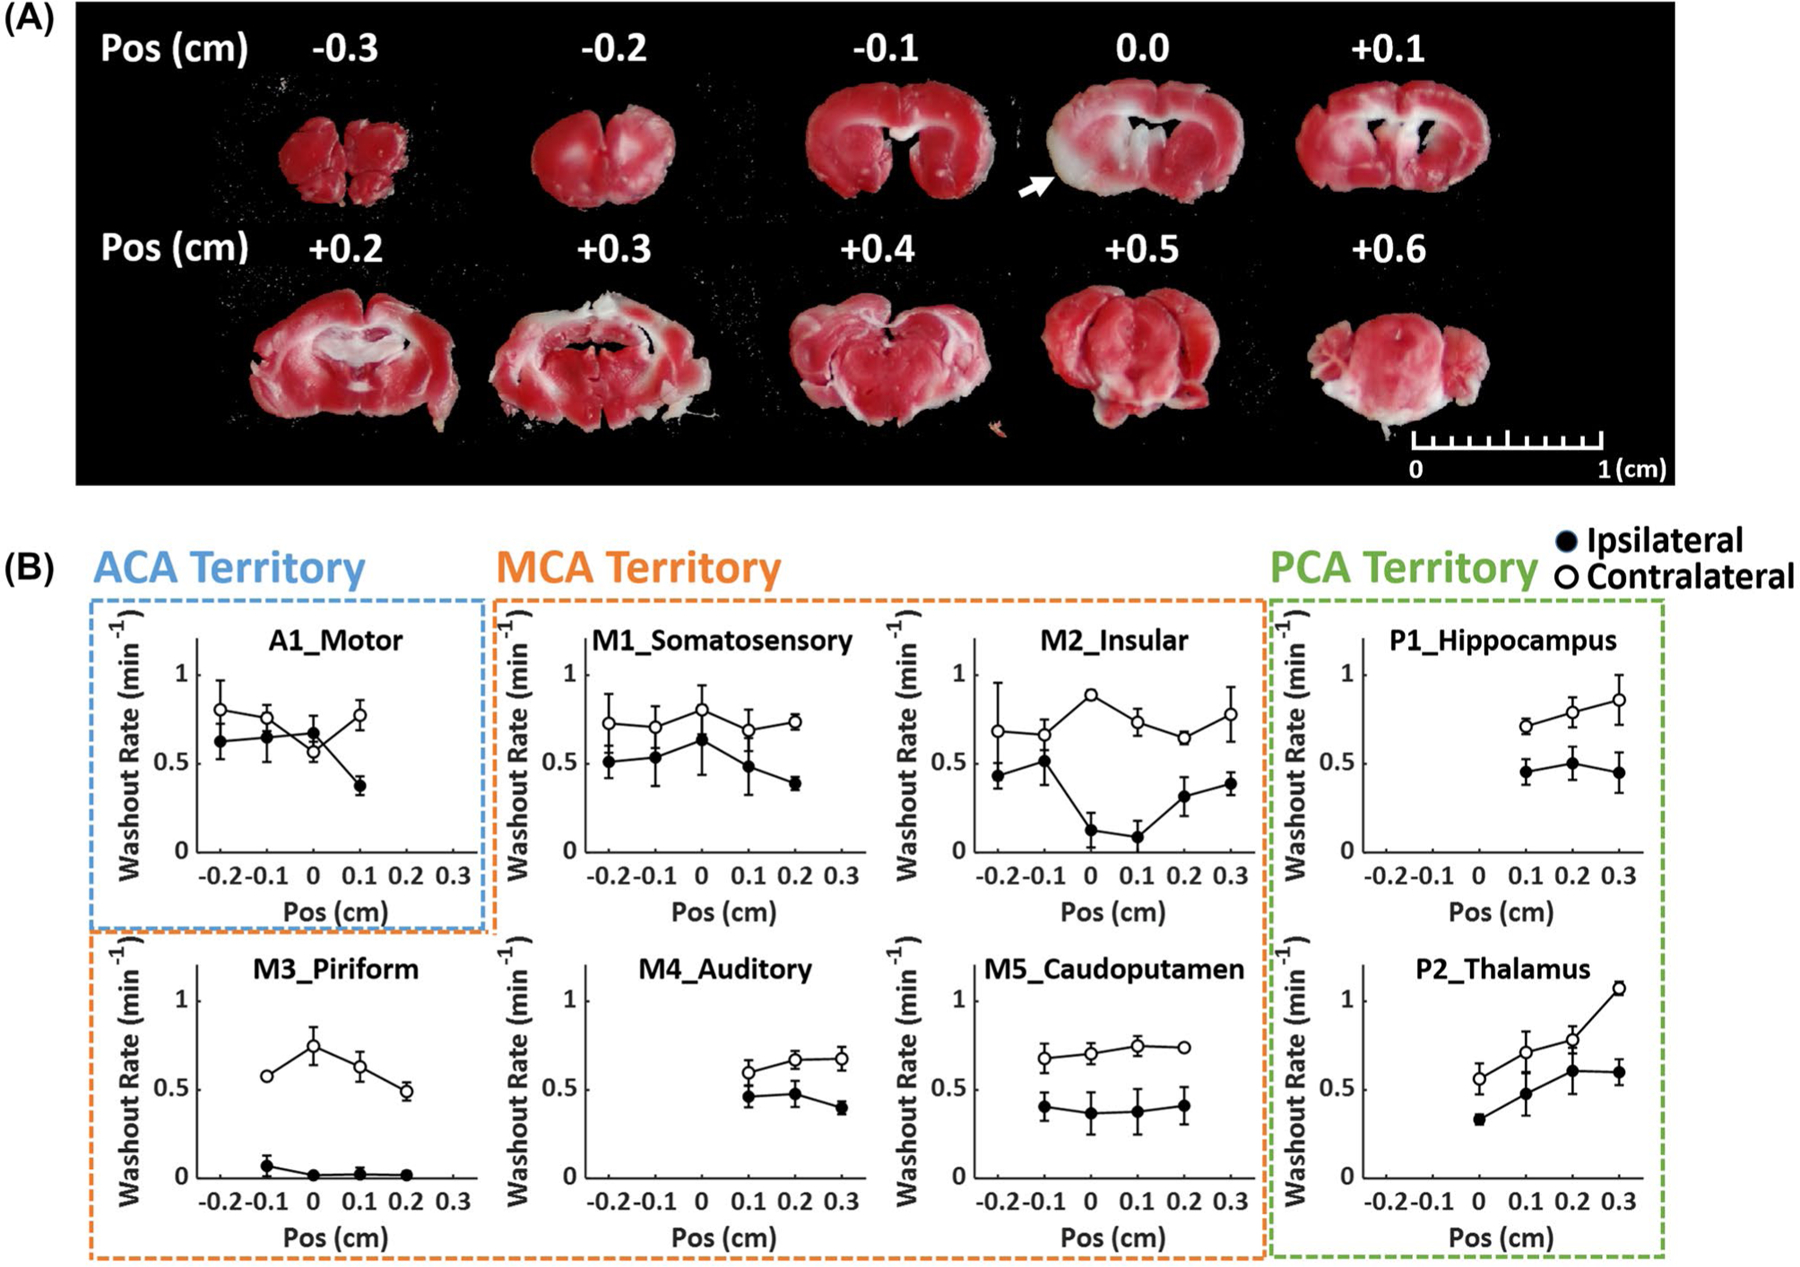
Correlation between 17O kinetics and TTC staining. (A) TTC staining of a mouse with CCA ligation. Arrow indicates the infarct lesion. (B) Anteroposterior changes in H217O washout rate in selected ROIs. Closed and open circles represent ipsilateral and contralateral ROIs, respectively. Position (Pos) indicates distance relative to the slice with TTC-stained lesion, with negative sign on the anterior side and positive sign on the posterior side. CCA, common carotid artery; Pos, position.
4 |. DISCUSSION
In the current study, we developed and validated a dynamic 3D 17O-MRI method using a golden-means-based 3D radial sampling scheme. Image reconstruction used the KWIC strategy with an adaptive window size (3 to 15 s) tailored to the rate of signal changes. This approach enabled the delineation of the uptake and washout of intravenously injected H217O in the entire mouse brain with an isotropic spatial resolution of 1.21 mm (0.77 mm nominal) at 9.4T. The efficacy of using this method for in vivo delineation of altered H217O kinetics in acute post-stroke mouse brain was evaluated. Reduced peak uptake and washout rate of H217O were observed in the stroke-affected regions. Further, the areas that showed the most pronounced reduction in 17O kinetics, the insular and piriform cortex, were in good correlation with the infarct core identified in TTC staining.
The dynamic process of H 217O uptake and washout after a bolus injection is highly dependent on CBF.24 The significant reduction in H217O uptake and washout rate in the stroke-affected regions suggests compromised perfusion. Further, considerably more severe reduction was observed in mice with CCA ligation due to the disruption of the vascular pathway between CCA and MCA. These observations are in agreement with previous studies by both laser Doppler and MRI. 20,25,26 The improved spatial resolution of the current 3D 17O-MRI method also enabled the analysis of regional variations in H217O kinetics. The most pronounced reduction in H217O uptake and washout rate occurred in the insular and piriform cortex within the MCA perfusion territory. The hippocampus and thalamus within the PCA perfusion territory also showed reduced peak uptake and washout rate of H 217 O, especially in mice with CCA ligation. Because PCA in mice receives blood supply mainly from the ICA downstream to the CCA, 25,27–29 the residual perfusion from collateral circulation to PCA may be lower with a disrupted CCA-ICA-PCA pathway. Further, hippocampus and thalamus can also develop secondary ischemic lesion due to their proximity to the MCA perfusion territorty.30,31
Previous studies have estimated CBF from the washout rate of metabolically generated H217O after a brief period of 17O-oxygen (17O2) inhalation.24,32 Compared to the inhalation studies, the washout rate of intravenously injected H 217O observed in the current study was ~10% higher.31 This difference could be due to the diffusion of metabolically generated H217O from the mitochondria to the extracellular space. In principle, absolute quantification of CBF from dynamic 17O studies can be achieved by kinetic analysis using compartment models that incorporate the major physiological processes of H217O transport and exchange. However, measurement of the arterial input function (AIF) for kinetic analysis remains a challenge in rodents given the current spatial resolution. Alternatively, Zhang et al. used implanted vascular coil to measure AIF in rat carotid artery.33 It was shown that H217O concentration in the carotid artery reached a new steady-state in < 2 s after a bolus injection. Hence, H217O washout rate fitted to a monoexponential function could correlate well with CBF if the first 2 s of the washout period is excluded from fitting. However, the accuracy and robustness of this approach in quantifying CBF in mice remain to be evaluated.
MRI is a versatile tool that allows the assessment of multiple aspects of the post-stroke pathology. Although most investigations using MRI have focused on diffusion- and perfusion-weighted MRI to evaluate the structural and vascular changes in poststroke brain,34 it is increasingly recognized that assessing BBB integrity that allows better prediction of the risk for hemorrhagic transformation is important to optimal therapeutic selection.35 Large molecules such as Evans blue and gadolinium-based contrast agent have been used to evaluate BBB integrity36–38; quantification of water exchange across the BBB may provide a more sensitive method for detecting subtle changes in BBB permeability.39–42 Previous studies have demonstrated the efficacy of using H217O as a tracer in detecting altered BBB permeability to water.3,5 Developing compartment modeling approaches for simultaneous quantification of CBF and BBB permeability to water could be an important direction of future work. Recent studies using gadolinium-based contrast agent also suggest compromised glymphatic perfusion after stoke.43 H217O provides a physiological tracer for assessing glymphatic perfusion that can complement gadolinium-based contrast-enhanced MRI studies.3,4 Further, metabolic integrity is the hallmark of the salvageable penumbra.44 17O-MRI can also be applied to 17O2 inhalation studies for quantification of cerebral metabolic rate of oxygen in post-stroke brain.45
The use of non-Cartesian trajectories such as radial and twisted projection in 17O-MRI allows ultra-short echo-time imaging that minimizes signal loss due to decay.46–48 For dynamic imaging, the oversampling of the center k-space by these trajectories also enables KWIC-based image reconstruction at high temporal resolution without sacrificing the spatial resolution.17 This reconstruction strategy is further facilitated by the golden-means-based sampling scheme that provides nearly uniform coverage of the k-space at any number of spokes.18 Hence, temporal resolution can be determined retrospectively based on signal kinetics. In the current study, a k-space filter with an innermost shell that encompassed 75% of the total energy in the k-space was used in image reconstruction. Because the kinetics of signal change showed a wide range of variations from very rapid increase at the injection phase to near equilibrium at the steady-state, an adaptive window size determined by the rate of signal changes was used in image reconstruction for improved SNR with adequate temporal resolution. Our simulation results suggest that such an approach can lead to reduced parameter estimation errors.
Whereas the current study showed promises in improving the spatial and temporal resolution of 17O-MRI, the method can be further improved by exploiting a priori knowledge of the signal dynamics. Previous 1H-MRI studies have shown that applying model-based temporal constraints can lead to improved parameter estimation from undersampled data for both T1/T2 mapping and dynamic contrast-enhanced studies.49–51 Similar to dynamic contrast-enhanced studies, the time course of 17O signal changes in an injection study can be approximated by a rapid, linear increase during injection and a monoexponential decay during the washout phase. Using this signal model in image reconstruction will likely improve the robustness of the estimation of H217O uptake and washout parameters. Alternatively, training denoising neural networks to identify signal components that are consistent with the tracer kinetic model from noise-corrupted data can also be employed to improve the accuracy of parameter estimation.52
In conclusion, this study demonstrated a promising 17O-MRI method for studying the kinetics of intravenously injected H217O in mouse brain with improved spatial and temporal resolution. This method provides an opportunity for longitudinal evaluation of cerebral perfusion and water regulation in neurological diseases such as stroke.
Supplementary Material
FIGURE S1 In silico comparison of mapping of steady-state 17O signal using adaptive and fixed temporal resolution. A, Maps of steady-state 17O signal. B, Boxplot of steady-state 17O signal in each compartment
FIGURE S2 Measured point spread function. A, Conventional radial sampling. B, Golden-means-based radial sampling. C&D. Golden-means-based radial sampling combined with KWIC reconstruction using 0.6-s (C) and 3-s (D) window size. Upper and lower panels are the 2D and 1D profiles of the point spread function, respectively
FIGURE S3 Group-averaged peak H217O uptake in the ipsilateral (solid bars) and contralateral (open bars) ROIs
FIGURE S4 Anterior-to-posterior changes in baseline-normalized peak H217O uptake in selected ROIs. Closed and open circles represent ipsilateral and contralateral ROIs, respectively. Position (Pos) indicates distance relative to the slice with TTC-stained lesion in Figure 9, with negative sign on the anterior side and positive sign on the posterior side
ACKNOWLEDGMENT
This work was supported by grants from the National Institutes of Health (NIH) (R01 EB23704, R01 HL126645, R01 NS091213, U10 NS086532, U01 NS086872) and the Clinical and Translational Science Collaborative of Cleveland (UL1 TR000439) from the National Center for Advancing Translational Sciences (NCATS) component of the NIH and NIH Roadmap for Medical Research.
Funding information
Supported by the National Institutes of Health (NIH) grants (R01 EB23704, R01 HL126645, R01 NS091213, U10 NS086532, U01 NS086872) and the Clinical and Translational Science Collaborative of Cleveland grant (UL1 TR000439) from the National Center for Advancing Translational Sciences (NCATS) component of the NIH and NIH Roadmap for Medical Research.
Footnotes
SUPPORTING INFORMATION
Additional Supporting Information may be found online in the Supporting Information section.
REFERENCES
- 1.Arai T, Nakao SI, Morikawa S, et al. Measurement of local cerebral blood flow by magnetic resonance imaging: in vivo autoradiographic strategy using 17O-labeled water. Brain Res Bull. 1998;45:451–456. [DOI] [PubMed] [Google Scholar]
- 2.de Crespigny AJ, D’Arceuil HE, Engelhorn T, Moseley ME. MRI of focal cerebral ischemia using 17O-labeled water. Magn Reson Med. 2000;43:876–883. [DOI] [PubMed] [Google Scholar]
- 3.Igarashi H, Tsujita M, Kwee IL, Nakada T. Water influx into cerebrospinal fluid is primarily controlled by aquaporin-4, not by aquaporin-1:17O JJVCPE MRI study in knockout mice. NeuroReport. 2014;25:39–43. [DOI] [PMC free article] [PubMed] [Google Scholar]
- 4.Kudo K, Harada T, Kameda H, et al. Indirect proton MR imaging and kinetic analysis of 17O-labeled water tracer in the brain. Magn Reson Med Sci. 2018;17:223–230. [DOI] [PMC free article] [PubMed] [Google Scholar]
- 5.Zhang Y, Xu K, Liu Y, et al. Increased cerebral vascularization and decreased water exchange across the blood-brain barrier in aquaporin-4 knockout mice. PLoS One. 2019;14:e0218415. [DOI] [PMC free article] [PubMed] [Google Scholar]
- 6.Herscovitch P, Markham J, Raichle ME. Brain blood flow measured with intravenous H215O. I. Theory and error analysis. J Nucl Med. 1983;24:782–789. [PubMed] [Google Scholar]
- 7.Raichle ME, Martin WRW, Herscovitch P, Mintun MA, Markham J. Brain blood flow measured with intravenous H215O. II. Implementation and validation. J Nucl Med. 1983;24:790–798. [PubMed] [Google Scholar]
- 8.Zhu X-H, Zhang Y, Tian R-X, et al. Development of 17O NMR approach for fast imaging of cerebral metabolic rate of oxygen in rat brain at high field. Proc Natl Acad Sci USA. 2002;99:13194–13199. [DOI] [PMC free article] [PubMed] [Google Scholar]
- 9.Mateescu GD. Functional oxygen-17 magnetic resonance imaging and localized spectroscopy. Adv Exp Med Biol. 2003;510:213–218. [DOI] [PubMed] [Google Scholar]
- 10.Cui W, Zhu X-H, Vollmers ML, et al. Non-invasive measurement of cerebral oxygen metabolism in the mouse brain by ultra-high field (17)O MR spectroscopy. J Cereb Blood Flow Metab. 2013;33:1846–1849. [DOI] [PMC free article] [PubMed] [Google Scholar]
- 11.Hopkins AL, Lust WD, Haacke EM, Wielopolski P, Barr RG, Bratton CB. The stability of proton T2 effects of oxygen-17 water in experimental cerebral ischemia. Magn Reson Med. 1991;22:167–174. [DOI] [PubMed] [Google Scholar]
- 12.Ronen I, Merkle H, Ugurbil K, Navon G. Imaging of H217O distribution in the brain of a live rat by using proton-detected 17O MRI. Proc Natl Acad Sci USA. 1998;95:12934–12939. [DOI] [PMC free article] [PubMed] [Google Scholar]
- 13.Reddy R, Stolpen AH, Leigh JS. Detection of 17O by proton T1 rho dispersion imaging. J Magn Reson B. 1995;108:276–279. [DOI] [PubMed] [Google Scholar]
- 14.Tailor DR, Roy A, Regatte RR, et al. Indirect 17O-magnetic resonance imaging of cerebral blood flow in the rat. Magn Reson Med. 2003;49:479–487. [DOI] [PubMed] [Google Scholar]
- 15.Liu Y, Zhang Y, Wu C, et al. High-resolution dynamic oxygen-17 MR imaging of mouse brain with golden-ratio–based radial sampling and k-space–weighted image reconstruction. Magn Reson Med. 2018;79:256–263. [DOI] [PMC free article] [PubMed] [Google Scholar]
- 16.Zhang J, Feng L, Otazo R, Kim SG. Rapid dynamic contrast-enhanced MRI for small animals at 7T using 3D ultra-short echo time and golden-angle radial sparse parallel MRI. Magn Reson Med. 2019;81:140–152. [DOI] [PMC free article] [PubMed] [Google Scholar]
- 17.Song HK, Dougherty L. k-Space weighted image contrast (KWIC) for contrast manipulation in projection reconstruction MRI. Magn Reson Med. 2000;44:825–832. [DOI] [PubMed] [Google Scholar]
- 18.Chan RW, Ramsay EA, Cunningham CH, Plewes DB. Temporal stability of adaptive 3D radial MRI using multidimensional golden means. Magn Reson Med. 2009;61:354–363. [DOI] [PubMed] [Google Scholar]
- 19.Winkelmann S, Schaeffter T, Koehler T, Eggers H, Doessel O. An optimal radial profile order based on the golden ratio for time-resolved MRI. IEEE Trans Med Imaging. 2007;26:68–76. [DOI] [PubMed] [Google Scholar]
- 20.Smith HK, Russell JM, Granger DN, Gavins FNE. Critical differences between two classical surgical approaches for middle cerebral artery occlusion-induced stroke in mice. J Neurosci Methods. 2015;249:99–105. [DOI] [PubMed] [Google Scholar]
- 21.Lein ES, Hawrylycz MJ, Ao N, et al. Genome-wide atlas of gene expression in the adult mouse brain. Nature. 2007;445:168–176. [DOI] [PubMed] [Google Scholar]
- 22.Rahmer J, Börnert P, Groen J, Bos C. Three-dimensional radial ultrashort echo-time imaging with T2 adapted sampling. Magn Reson Med. 2006;55:1075–1082. [DOI] [PubMed] [Google Scholar]
- 23.Liao JR, Pauly JM, Brosnan TJ, Pelc NJ. Reduction of motion artifacts in cine MRI using variable-density spiral trajectories. Magn Reson Med. 1997;37:569–575. [DOI] [PubMed] [Google Scholar]
- 24.Zhu XH, Zhang Y, Wiesner HM, Ugurbil K, Chen W. In vivo measurement of CBF using 17O NMR signal of metabolically produced H217O as a perfusion tracer. Magn Reson Med. 2013;70: 309–314. [DOI] [PMC free article] [PubMed] [Google Scholar]
- 25.Morris GP, Wright AL, Tan RP, Gladbach A, Ittner LM, Vissel B. A comparative study of variables influencing ischemic injury in the Longa and Koizumi methods of intraluminal filament middle cerebral artery occlusion in mice. PLoS One. 2016;11:1–34. [DOI] [PMC free article] [PubMed] [Google Scholar]
- 26.Van DFA, Hata R, Maeda K, et al. Diffusion- and perfusion-weighted MR imaging of transient focal cerebral ischaemia in mice. NMR Biomed. 1999;12:525–534. [DOI] [PubMed] [Google Scholar]
- 27.Kitagawa K, Matsumoto M, Yang G, et al. Cerebral ischemia after bilateral carotid artery occlusion and intraluminal suture occlusion in mice: evaluation of the patency of the posterior communicating artery. J Cereb Blood Flow Metab. 1998;18:570–579. [DOI] [PubMed] [Google Scholar]
- 28.Akamatsu Y, Shimizu H, Saito A, Fujimura M, Tominaga T. Consistent focal cerebral ischemia without posterior cerebral artery occlusion and its real-time monitoring in an intraluminal suture model in mice: laboratory investigation. J Neurosurg. 2012;116:657–664. [DOI] [PubMed] [Google Scholar]
- 29.Gürsoy Özdemir Y, Bolay H, Erdem E, Dalkara T. Occlusion of the MCA by an intraluminal filament may cause disturbances in the hippocampal blood flow due to anomalies of circle of Willis and filament thickness. Brain Res. 1999;822:260–264. [DOI] [PubMed] [Google Scholar]
- 30.Danielisova V, Burda J, Nemethova M, Gottlieb M. Aminoguanidine administration ameliorates hippocampal damage after middle cerebral artery occlusion in rat. Neurochem Res. 2011;36:476–486. [DOI] [PubMed] [Google Scholar]
- 31.Sopala M, Frankiewicz T, Parsons C, Danysz W. Middle cerebral artery occlusion produces secondary, remote impairment in hippocampal plasticity of rats—involvement of N-methyl-D-aspartate receptors? Neurosci Lett. 2000;281:143–146. [DOI] [PubMed] [Google Scholar]
- 32.Zhu XH, Chen JM, Tu TW, Chen W, Song SK. Simultaneous and noninvasive imaging of cerebral oxygen metabolic rate, blood flow and oxygen extraction fraction in stroke mice. Neuroimage. 2013;64:437–447. [DOI] [PMC free article] [PubMed] [Google Scholar]
- 33.Zhang X, Zhu XH, Tian R, Zhang Y, Merkle H, Chen W. Measurement of arterial input function of 17O water tracer in rat carotid artery by using a region-defined (REDE) implanted vascular RF coil. Magn Reson Mater Physics, Biol Med. 2003;16:77–85. [DOI] [PubMed] [Google Scholar]
- 34.Duong TQ. Magnetic resonance imaging of perfusion-diffusion mismatch in rodent and non-human primate stroke models. Neurol Res. 2013;35:465–469. [DOI] [PMC free article] [PubMed] [Google Scholar]
- 35.Sandoval KE, Witt KA. Blood-brain barrier tight junction permeability and ischemic stroke. Neurobiol Dis. 2008;32:200–219. [DOI] [PubMed] [Google Scholar]
- 36.Krueger M, Mages B, Hobusch C, Michalski D. Endothelial edema precedes blood-brain barrier breakdown in early time points after experimental focal cerebral ischemia. Acta Neuropathol Commun. 2019;7:17. [DOI] [PMC free article] [PubMed] [Google Scholar]
- 37.Hone EA, Hu H, Sprowls SA, et al. Biphasic blood-brain barrier openings after stroke. Neurol Disord Stroke Int. 2018;1:11–14. [Google Scholar]
- 38.Kastrup A, Engelhorn T, Beaulieu C, De Crespigny A, Moseley ME. Dynamics of cerebral injury, perfusion, and blood-brain barrier changes after temporary and permanent middle cerebral artery occlusion in the rat. J Neurol Sci. 1999;166:91–99. [DOI] [PubMed] [Google Scholar]
- 39.Kim YR, Tejima E, Huang S, et al. In vivo quantification of trans-vascular water exchange during the acute phase of permanent stroke. Magn Reson Med. 2008;60:813–821. [DOI] [PMC free article] [PubMed] [Google Scholar]
- 40.Lin Z, Li Y, Su P, et al. Non-contrast MR imaging of blood-brain barrier permeability to water. Magn Reson Med. 2018;80:1507–1520. [DOI] [PMC free article] [PubMed] [Google Scholar]
- 41.Shao X, Ma SJ, Casey M, D’Orazio L, Ringman JM, Wang DJJ. Mapping water exchange across the blood–brain barrier using 3D diffusion-prepared arterial spin labeled perfusion MRI. Magn Reson Med. 2019;81:3065–3079. [DOI] [PMC free article] [PubMed] [Google Scholar]
- 42.Ohene Y, Harrison IF, Nahavandi P, et al. Non-invasive MRI of brain clearance pathways using multiple echo time arterial spin labelling: an aquaporin-4 study. Neuroimage. 2019;188:515–523. [DOI] [PMC free article] [PubMed] [Google Scholar]
- 43.Gaberel T, Gakuba C, Goulay R, et al. Impaired glymphatic perfusion after strokes revealed by contrast-enhanced MRI: a new target for fibrinolysis? Stroke. 2014;45:3092–3096. [DOI] [PubMed] [Google Scholar]
- 44.Astrup J, Siesjö BK, Symon L. Thresholds in cerebral ischemia—the ischemic penumbra. Stroke. 1981;12:723–725. [DOI] [PubMed] [Google Scholar]
- 45.Zhu X-H, Chen JM, Tu T-W, Chen W, Song S-K. Simultaneous and noninvasive imaging of cerebral oxygen metabolic rate, blood flow and oxygen extraction fraction in stroke mice. Neuroimage. 2013;64:437–447. [DOI] [PMC free article] [PubMed] [Google Scholar]
- 46.Hoffmann SH, Radbruch A, Bock M, Semmler W, Nagel AM. Direct 17O MRI with partial volume correction: first experiences in a glioblastoma patient. MAGMA. 2014;27:579–587. [DOI] [PubMed] [Google Scholar]
- 47.Kurzhunov D, Borowiak R, Hass H, et al. Quantification of oxygen metabolic rates in Human brain with dynamic 17O MRI: profile likelihood analysis. Magn Reson Med. 2017;78:1157–1167. [DOI] [PubMed] [Google Scholar]
- 48.Atkinson IC, Thulborn KR. Feasibility of mapping the tissue mass corrected bioscale of cerebral metabolic rate of oxygen consumption using 17-oxygen and 23-sodium MR imaging in a human brain at 9.4 T. Neuroimage. 2010;51:723–733. [DOI] [PubMed] [Google Scholar]
- 49.Doneva M, Börnert P, Eggers H, Stehning C, Sénégas J, Mertins A. Compressed sensing reconstruction for magnetic resonance parameter mapping. Magn Reson Med. 2010;64:1114–1120. [DOI] [PubMed] [Google Scholar]
- 50.Chen Y, Li W, Jiang K, Wang CY, Yu X. Rapid T2 mapping of mouse heart using the Carr-Purcell-Meiboom-Ggill sequence and compressed sensing reconstruction. J Magn Reson Imaging. 2016;44:375–382. [DOI] [PMC free article] [PubMed] [Google Scholar]
- 51.Guo Y, Lingala SG, Zhu Y, Lebel RM, Nayak KS. Direct estimation of tracer-kinetic parameter maps from highly undersampled brain dynamic contrast enhanced MRI. Magn Reson Med. 2017;78:1566–1578. [DOI] [PMC free article] [PubMed] [Google Scholar]
- 52.Benou A, Veksler R, Friedman A, Riklin RT. Ensemble of expert deep neural networks for spatio-temporal denoising of contrast-enhanced MRI sequences. Med Image Anal. 2017;42:145–159. [DOI] [PubMed] [Google Scholar]
Associated Data
This section collects any data citations, data availability statements, or supplementary materials included in this article.
Supplementary Materials
FIGURE S1 In silico comparison of mapping of steady-state 17O signal using adaptive and fixed temporal resolution. A, Maps of steady-state 17O signal. B, Boxplot of steady-state 17O signal in each compartment
FIGURE S2 Measured point spread function. A, Conventional radial sampling. B, Golden-means-based radial sampling. C&D. Golden-means-based radial sampling combined with KWIC reconstruction using 0.6-s (C) and 3-s (D) window size. Upper and lower panels are the 2D and 1D profiles of the point spread function, respectively
FIGURE S3 Group-averaged peak H217O uptake in the ipsilateral (solid bars) and contralateral (open bars) ROIs
FIGURE S4 Anterior-to-posterior changes in baseline-normalized peak H217O uptake in selected ROIs. Closed and open circles represent ipsilateral and contralateral ROIs, respectively. Position (Pos) indicates distance relative to the slice with TTC-stained lesion in Figure 9, with negative sign on the anterior side and positive sign on the posterior side


