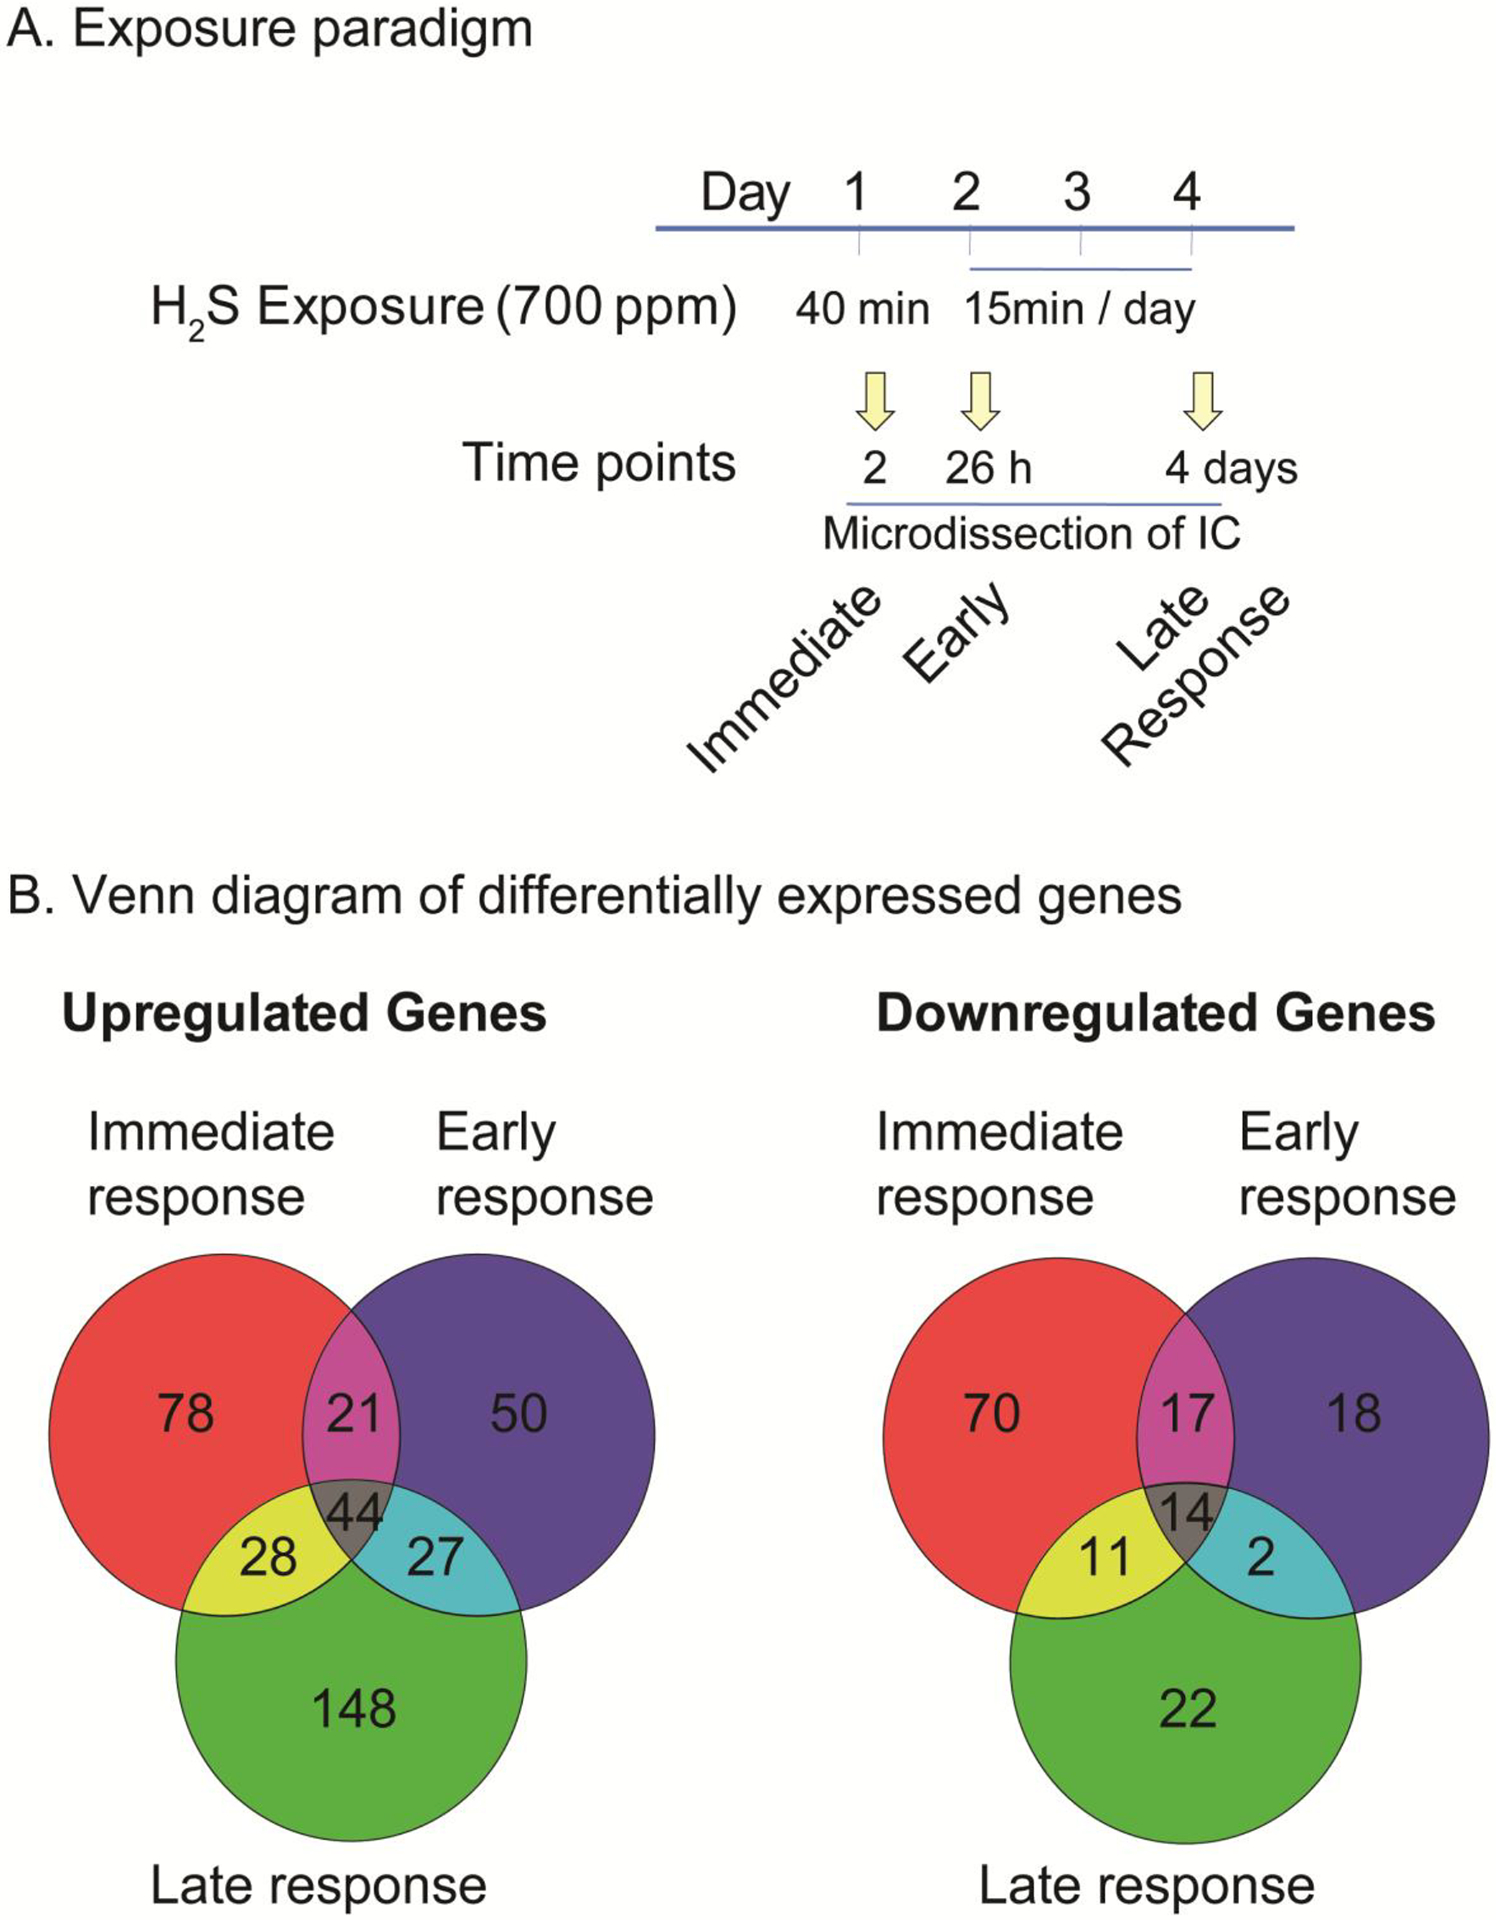
Figure 1.

Hydrogen sulfide exposure paradigm and Venn diagram of differentially expressed genes (DEGs) after acute exposure to H2S in the IC.
C57 black mice were exposed via whole body exposure to 700 ppm H2S. A scheme of exposure paradigm was shown (A). The microdissected IC was used for transcriptomic analysis. The numbers of DEGs at immediate, early, and late response to H2S exposure in the IC are shown in Venn diagrams (B).
