

Abstract
Recent interest has focused on the benefits of time-restricted feeding strategies, including intermittent fasting, for weight loss. It is unsettled, however, if intermittent fasting is more effective than daily caloric restriction at stimulating weight loss, and how each is subject to individual differences. Here, rat models of leanness and obesity, artificially selected for intrinsically high (HCR) and low (LCR) aerobic capacity, were subjected to intermittent fasting and 50% calorie restrictive diets in two separate experiments using male rats. The lean, high-fitness HCR and obesity-prone, low-fitness LCR rats underwent 50% calorie restriction while body weight and composition were monitored. The low-fitness LCR rats were better able to retain lean mass than the high fitness HCR, without significantly different proportional loss of weight or fat. In a separate experiment using intermittent fasting in male HCR and LCR rats, alternate-day fasting induced significantly greater loss of weight and fat mass in LCR compared to HCR rats, even though HCR had a more marked reduction in ad-libitum day food intake. Altogether, this suggests that intermittent fasting is an effective weight loss strategy for those with low intrinsic aerobic fitness, however, direct comparison of caloric restriction and intermittent fasting is warranted to determine any differential effects on energy expenditure in lean and obesity-prone phenotypes.
Keywords: intrinsic aerobic capacity, HCR/LCR, alternate-day fasting, rat, male, body composition, adiposity
1. Introduction
With an increasing prevalence of obesity comes a heightened risk for the development of chronic health sequalae including metabolic diseases, cardiovascular diseases, diabetes, and cancer (Haslam & James, 2005; Withrow & Alter, 2011). Most weight-loss diet regimens such as caloric restriction (CR) rely on limiting daily food intake, while time-restricted feeding and intermittent fasting (IF) limit the timing or duration of food availability (Hoddy, Marlatt, Çetinkaya, & Ravussin, 2020). A common challenge with diet-induced weight loss is that the reduced weight is often difficult to maintain (Redman et al., 2009; Yamada et al., 2013). This is because reduced weight and negative energy balance stemming from food restriction suppress metabolic rate and physical activity (Martins, Roekenes, Salamati, Gower, & Hunter, 2020; Redman, Heilbronn, Martin, de Jonge, Williamson, Delany, & Ravussin, 2009; Yamada, Colman, Kemnitz, Baum, Anderson, Weindruch, & Schoeller, 2013). For metabolic rate, energy expenditure is proportional to body mass; a decrease in weight is mirrored by a decrease in energy expenditure (Most & Redman, 2020). Metabolic adaptation occurs when energy expenditure is decreased below what is predicted for the reduced body mass, also known as adaptive thermogenesis (Dulloo, Jacquet, Montani, & Schutz, 2012; Müller & Bosy-Westphal, 2013; Rosenbaum & Leibel, 2010). This adaptation may be determined by the degree of negative energy balance (Most & Redman, 2020).
Aerobic capacity is well recognized as a strong predictor of metabolic health (Goran, Fields, Hunter, Herd, & Weinsier, 2000; Ladenvall et al., 2016; Timmons et al., 2010). Yet the challenge remains of how to promote weight loss on a background of low aerobic fitness. To investigate this challenge, we studied the lean high-capacity runners (HCR) and the obesity-prone low-capacity runners (LCR), rats that contrast for the fitness phenotypes of high and low intrinsic aerobic exercise capacity (Koch & Britton, 2018). These rat models were developed by a two-way artificial selection on maximal treadmill running capacity within a large founder population of genetically heterogeneous rats (N:NIH) (Hansen & Spuhler, 1984; Koch & Britton, 2018). These contrasting rat models serve as a platform to investigate segregating differences in both behavior and physiology that lead to a susceptibility or resistence to the development of obesity and a differential response to weight-loss strategies.
Here, we examine these rat models of leanness and obesity to observe intrinsic differences in response to IF and CR dietary regimens. Previously, Smyers et al. (2015) reported that HCR eat more, are more physically active, and lose more weight relative to baseline body mass compared to LCR during 50% CR (Smyers, Bachir, Britton, Koch, & Novak, 2015). This held true for both the males as well as the females where body weight was more comparable between the LCR and HCR (Smyers, Bachir, Britton, Koch, & Novak, 2015). When examining body composition during daily 50% kcal restriction, female HCR rats lost more fat and lean mass than LCR during CR even with similar baseline body weights (Smyers, Bachir, Britton, Koch, & Novak, 2015). In males, HCR also lost more weight as a proportion of their baseline body weight compared to LCR rats (Smyers, Bachir, Britton, Koch, & Novak, 2015).
The HCR and LCR response to daily CR differs markedly from the response to IF (Smyers, Koch, Britton, Wagner, & Novak, 2020). Over 14 weeks of IF, LCR lost more weight than HCR, which contrasts with the response to 50% daily CR (Smyers, Bachir, Britton, Koch, & Novak, 2015). HCR were still more physically active than LCR on both IF and 50% CR (Smyers, Koch, Britton, Wagner, & Novak, 2020). Continued IF maintained changes in body weight, body composition, and physical activity that persisted after 1 year (Smyers, Koch, Britton, Wagner, & Novak, 2020). While intriguing, the ability of IF to induce marked weight loss in low-fitness compared to high-fitness rats was only investigated in females. Knowing male HCR and LCR are larger than females, and that male HCR and LCR show a larger divergence in body weight and composition than seen in females, the response to IF needs to be investigated in male HCR and LCR rats as well to determine if the magnitude of weight loss on IF is characteristic of the low-fitness phenotype in general. Here, the temporal pattern of weight and body composition changes were investigated in males, using 50% CR, and then using IF on a separate group of HCR and LCR rats.
2. Methods
2.1. Ethical Approval
All research adhered to the principles of the laboratory animal care guidelines and were approved by the Kent State University Institutional Animal Care and Use Committee and performed in accordance with the Guide for the Care and Use and Laboratory Animals. All research complied with the ethical principles and standards for reporting animal experiments in Experimental Physiology.
2.2. Diet
Water was available ad libitum and food (5P00 MRH 3000, T.R. Last Co., Inc.) was available ad libitum except during calorie restriction and intermittent fasting. Prolab® RMH 3000 chow pellets are comprised of 26% protein, 14% porcine and plant oil fat, and 60% carbohydrate, with a physiological fuel value of 3.46 kcal/g.
2.3. Animals
Male high-capacity runners (HCR) and low-capacity runners (LCR) rats were developed and transferred from the University of Michigan. Two experiments were performed on individually housed rats. The first study included 48 rats that were aged 361 ± 39 days [mean ± SD; generation 27; HCR (n=24); LCR (n=24)]. These rats were subjected to either 2 days or 21 days of 50% CR or were part of the ad libitum-fed control group. At phenotyping (treadmill running endurance tests at 3-4 months of age), HCR had significantly longer maximal running time (HCR, 77.7 ± 7.7 min; LCR, 15.3 ± 1.9 min), maximal running distance (HCR, 2263.6 ± 373.4 m; LCR, 205.1 ± 30.6 m), top speed attained (HCR, 48.5 ± 3.8 m/min; LCR, 17.1 ± 0.9 m/min), and work performed (HCR, 1377.3 ± 153.6 Joules; LCR, 177.0 ± 30.9 Joules). Within phenotype, there were no group differences except that the LCR later subjected to 2 days of 50% CR showed marginally lower work than the other groups of LCR (156 J, compared to 183-192 J; 2-tailed t-tests). At the end of 50% CR, animals were humanely euthanized in the middle of the light phase by rapid decapitation; rats were briefly restrained and held by wrapping them in a clean medical towel and then quickly decapitated using a clean, sharpened, large decapitator (Harvard Apparatus, Holliston, MA).
The second study examined weight loss on IF in 16 male rats aged 384 ± 25 days [generation 37; HCR (n=8); LCR (n=8)]. For this study, these rats remained on IF for 7 weeks and served as their own control to measure changes in body weight and body composition between HCR and LCR. At phenotyping, HCR had significantly longer maximal running time (HCR, 71.7 ± 2.0 min; LCR, 11.7 ± 2.7 min), maximal running distance (HCR, 1968.2 ± 88.4 m; LCR, 147.2 ± 41.9 m), top speed attained (HCR, 45.4 ± 1.5 m/min; LCR, 15.3 ± 1.5 m/min), and work performed (HCR, 1295.6 ± 101.2 Joules; LCR, 127.0 ± 38.1). Animals were not euthanized at the end of IF.
A 12:12 light: dark cycle was maintained during both studies with the light phase starting at 07:00 EST, at 71.1 °F ± 0.96 °F (SD) for 50% CR, and 73.6 °F ± 1.65 °F for IF and the humidity was between 30-55% for IF and CR. Water was provided to each rat ad libitum throughout the duration of both studies. Daily food intake and body weight were measured for 1 week before the onset of CR or IF. After a week of baseline measurement, the rats on 21-day and 2-day 50% CR were fed ad libitum until they began CR. During baseline measurements and during CR, food intake and body weights were measured between 10:00-11:00 (i.e., 4-5 hours after lights-on). For IF, after a week of baseline measurement, all the rats on IF were subjected to alternate-day fasting and were fed ad libitum every-other day, with no food given on the alternating fasting days for 7 weeks. During this study, each rat had two separate cages—one for fasting days and one for feeding days; SSP Alpha-dri bedding (TR Last; Cabot, PA) was used to facilitate identification of any leftover food to be measured. As with the baseline measurements, during alternate day fasting, food intake and body weight were measured at 18:30 (i.e., 30 min before the onset of the active phase).
2.4. Body composition analysis using EchoMRI
To measure body composition, rats underwent magnetic resonance spectroscopy (EchoMRI™-700) at baseline and after CR (Nixon et al., 2010). For rats on IF, body composition was measured weekly for 8 weeks to quantify lean and fat mass (each in grams). This was done at the same time and day each week, resulting in alternating fasting and feeding days.
2.5. Cytokines and qPCR analysis
After the conclusion of the study, rats subjected to 50% CR and their control counterparts were euthanized by rapid decapitation and trunk blood was collected while in the light phase. Serum levels of cytokines IL-1β, IL-1α, TNF-α, IL-6, IL-10, and leptin were determined by the CTSC Bioanalyte Core Center at Case Western Reserve University using the Luminex xMAP multiplexing ELISA system, as described previously (Almundarij et al., 2016).
2.6. Statistical analysis
RStudio software was used to analyze the collected data for both the CR study and the IF study and SPSS was used to analyze the data from multiplex analysis. Analysis of variance (ANOVA) was used to compare body weight and body composition within and between lines. For cytokine analysis, outliers were identified using the outlier labeling rule (calculated by 2.2 * the upper and lower quartile). Repeated measures ANOVAs were used to compare food intake, body weight, fat mass, and lean mass between HCR and LCR over 7 weeks of IF. A two-way repeated measures ANOVA was used to compare baseline and final values for body weight on fasted and non-fasted days and to compare food intake between HCR and LCR over time. Upon analysis of food intake and body weight using two-way repeated measures ANOVAs, sphericity was violated and corrected for the main effect of time using the Huynh-Feldt correction. Two-way ANOVAs were used to compare fed versus fasted values between HCR and LCR for weight loss, fat loss, and lean mass loss, and a post-hoc Tukey Honest Significant Difference Test (Tukey HSD) was used when comparing between groups, and t-tests were used after repeated-measures analysis. Unpaired 2-tailed t-tests were used compare weekly body weight, fat mass, and lean mass between HCR and LCR. Analysis of covariance (ANCOVA) was used to determine whether baseline fat mass (covariate) affected weight and fat loss, and to determine if the overall change in food intake (covariate) affected weight loss. Effect sizes (Cohen’s d) were calculated for the CR-fed and IF-fed rats. Data are represented as mean ± SD.
3. Results
3.1. 21 days and 2 days of 50% CR: body composition and circulating cytokines
The ability of CR to induce weight loss and alter body composition was compared between male HCR and LCR. HCR and LCR significantly differed in baseline body weight, fat mass, and lean mass before and after the onset of CR, such that LCR had higher baseline body weight, fat mass, and lean mass, consistent with prior studies (Smyers, Bachir, Britton, Koch, & Novak, 2015) (Table 1). When analyzing the body composition from 2 days of 50% CR, there were no significant difference in the loss of body weight or fat mass (in grams) from baseline between HCR and LCR (Table 1). HCR, however, lost significantly more lean mass from baseline than LCR on 2-day CR (p = 0.003; Table 1). Two days of continuous energy restriction did not allow enough time for noticable changes between the two phenotypes in body weight or fat mass, in contrast to lean mass.
Table 1.
Body weight and composition before and after 21 day or 2 days of 50% calorie restriction (CR) or ad libitum (control) intake in male high- and low-capacity runners (HCR, LCR).
| Baseline | Calorie Restriction | Change from Baseline | |||||||
|---|---|---|---|---|---|---|---|---|---|
| Control-fed | Body Weight (g) | Fat Mass (g) | Lean Mass (g) | Body Weight (g) | Fat Mass(g) | Lean Mass (g) | Body Weight (g) | Fat Mass(g) | Lean Mass (g) |
| HCR | 395.88 ± 30.09 | 54.13 ± 17.03 | 286.90 ± 14.18 | 401.88 ± 32.47 | 55.23 ± 16.03 | 289.36 ± 16.17 | 6.00 ± 9.65 | 1.11 ± 5.71 | 2.49 ± 6.85 |
| LCR | 563.25 ± 46.62 | 143.26 ± 35.98 | 345.30 ± 10.66 | 570.38 ± 50.76 | 144.39 ± 39.74 | 350.63 ± 10.77 | 7.13 ± 16.02 | 1.13 ± 11.54 | 5.36 ± 3.99 |
| HCR≠LCR (p-value) | <0.001 | <0.001 | <0.001 | <0.001 | <0.001 | <0.001 | 0.532 | 0.996 | 0.323 |
| 2-Day50% CR | |||||||||
| HCR | 386.94 ± 34.12 | 49.95 ± 14.42 | 281.70 ± 29.24 | 373.50 ± 31.38 | 52.33 ± 16.33 | 272.70 ± 28.58 | −13.44 ± 5.68 | 2.38 ± 4.52 | −8.95 ± 4.16 |
| LCR | 538.94 ± 40.16 | 127.32 ± 18.86 | 340.80 ± 30.0 | 527.06 ± 36.70 | 122.65 ± 21.47 | 338.97 ± 27.92 | −11.88 ± 10.86 | −4.67 ± 9.18 | −1.83 ± 3.65 |
| HCR≠LCR (p-value) | <0.001 | <0.001 | 0.001 | <0.001 | <0.001 | <0.001 | 0.480 | 0.072 | 0.003 |
| 21-Day50% CR | |||||||||
| HCR | 411.13 ± 45.53 | 55.47 ± 21.91 | 298.60 ± 27.0 | 321.31 ± 38.93 | 24.87 ± 15.48 | 243.50 ± 23.60 | −89.81 ± 22.67 | −30.60 ± 15.53 | −55.12 ± 14.59 |
| LCR | 604.31 ± 55.75 | 160.82 ± 35.82 | 368.00 ± 33.86 | 493.38 ± 45.49 | 96.85 ± 31.80 | 325.75 ± 27.33 | −110.94 ± 17.82 | −63.96 ± 12.05 | −42.30 ± 12.01 |
| HCR≠LCR (p-value) | <0.001 | <0.001 | <0.001 | <0.001 | <0.001 | <0.001 | 0.051 | <0.001 | 0.076 |
Body weight at time of body composition measurement. Control-fed represents rats that ate ad libitum for 21 days. Significant p-values are bolded. Effect size (Cohen’s d) between HCR and LCR lean mass loss on 2-day 50% CR was d = 2.55 and fat loss loss on 21-day 50% CR was d = 1.82. Significantly different between HCR and LCR at baseline, after CR, and grams lost or gained (2-tailed t-test), Mean ± SD.
Although the absolute weight loss (in grams) approached significance, the LCR showed only a trend toward more body weight loss after 3 weeks of 50% CR and more lean mass loss in the HCR despite the LCRs much higher baseline body weight and lean mass (p = 0.051; Table 1). Consistent with prior experiments, HCR were less able to maintain lean mass when subjected to food restriction (Smyers, Bachir, Britton, Koch, & Novak, 2015; Smyers, Koch, Britton, Wagner, & Novak, 2020) (Figure 1C). After 21 days of 50% CR, LCR lost significantly more fat mass from baseline than HCR (p < 0.001; Table 1). Compared to control-fed rats, rats subjected to 50% CR for 21 days lost a greater proportion of baseline body weight (Figure 1A), fat mass (Figure 1B), and lean mass (Figure 1C). 21 days of 50% CR induced a significantly greater proportional loss of baseline lean mass in HCR (p = 0.001); the proportion of weight loss and fat loss, however, did not reach significance between the two phenotypes (Figure 1). Compared to HCR, LCR was more resistant to the loss of lean mass and lost significantly more grams of fat mass from baseline than HCR after 3 weeks of 50% CR.
Figure 1. Body weight and composition in male high-capacity runners (HCR) and low-capacity runners (LCR) subjected to 21 days of 50% calorie restriction (CR).

50% CR induced a significant loss of (A) body weight, (B) fat mass, and (C) lean mass. There was significantly greater loss of lean mass in HCR than LCR subjected to 50% CR and non-significant trend for greater weight loss in HCR than LCR (p = 0.051); † (over bar) significant loss in 21-day CR rats compared to control ad libitum-fed rats; * (in legend) HCR significantly different from LCR during 21-day CR; Mean ± SD, p < 0.05.
At baseline, HCR later subjected to 3 weeks of 50% CR ate 22.63 ± 1.65 g and LCR ate 21.20 ± 2.06 g; HCR selected for 2 days of 50% CR consumed 21.47 ± 1.85 g and LCR ate 20.27 ± 1.28 g. Upon examination of daily food intake on 2 days and 21 days of 50% CR, analysis revealed that there was no significant difference in food intake between HCR and LCR. Over 21 days of 50% CR, HCR ate 10.04 ± 0.83 g and LCR ate 10.01 ± 0.83 g of chow/day. Similarily, during 2 days of 50% CR, HCR ate 10.07 ± 0.95 g and LCR ate 9.87 ± 0.75 g of chow/day. Before and after 50% CR in rats subjected to either 2-day or 21-day CR, there was no significant difference in food intake between HCR and LCR.
Plasma leptin was significantly different between HCR and LCR, as well as between rats on control (ad libitum) feeding, 2 days of CR, and 21 days of CR. The 50% CR significantly decreased leptin levels, and LCR had significantly higher leptin levels overall (Table 2). Analysis of serum levels of circulating cytokines IL-1β and IL-10 showed a significant main effect of phenotype, with no main effect of food restriction and no interaction. Cytokines IL-1α and IL-16 did not differ significantly between HCR and LCR or with food restriction, although for IL-6 the main effect of diet approached significance (p = 0.051) and there was also no significant difference in circulating TNF-α levels between HCR and LCR on CR or control diets. For the cytokines assessed here, 2 days and 21 days of 50% CR reduced leptin levels compared to 21 days of an ad libitum-fed diet, with LCR having overall lower levels of leptin; cytokines IL-1β and IL-10 were significantly different between phenotype, with LCR having higher levels of both cytokines than HCR.
Table 2.
Circulating cytokine levels in high-capacity runners (HCR) and low-capacity runners (LCR) on ad libitum (control) food intake or subjected to 50% calorie restriction (CR) for 2 days or 21 days.
| Cytokine (pg/ml) |
|||||||
|---|---|---|---|---|---|---|---|
| Leptin | IL-1α | IL-1β | IL-6 | IL-10 | TNFα | ||
| Control-fed | HCR | 9851 ± 3136 | 35.9 ± 14.95 | 55.4 ± 25.04 | 31.9 ± 8.51 | 54.7 ± 23.16 | 20.5 ± 5.91 |
| LCR | 13,003 ± 2147 | 40.7 ± 11.35 | 60.0 ± 19.68 | 32.5 ± 7.61 | 64.4 ± 11.58 | 20.9 ± 3.19 | |
| 2-day CR | HCR | 8075 ± 4417 | 28.6 ± 2.57 | 32.6 ± 9.99 | 28.5 ± 5.01 | 36.8 ± 7.79 | 17.5 ± 2.19 |
| LCR | 11679 ± 3970 | 33.2 ± 12.91 | 89.5 ± 71.96 | 29.6 ± 9.07 | 75.2 ± 41.89 | 18.5 ± 4.79 | |
| 21-day CR | HCR | 3556 ± 2696 | 30.8 ± 5.63 | 45.6 ± 25.73 | 25.6 ± 3.45 | 42.6 ± 20.08 | 18.6 ± 2.20 |
| LCR | 7988 ± 3553 | 36.9 ± 14.21 | 52.3 ± 27.87 | 26.8 ± 4.36 | 50.4 ± 15.41 | 19.7 ± 3.08 | |
| Main effect | diet | p < 0.01 | n.s. | n.s. | n.s. (p = 0.051) | n.s. | n.s. |
| line | p < 0.01 (LCR > HCR) | n.s. | p = 0.043 (LCR > HCR) | n.s. | p = 0.011 (LCR > HCR) | n.s. | |
| Interaction | n.s | n.s. | n.s. | n.s. | n.s. | n.s. | |
n.s., not significant; Mean ± SD
3.2. Low-fitness male rats lost more body weight, fat mass, and lean mass on intermittent fasting
Similar to the HCR and LCR prior to 50% CR (Table 1), before initiation of 7 weeks of IF, LCR weighed significantly more than HCR at baseline, and LCR also had significantly more baseline fat and lean mass (Table 3). After 7 weeks of IF, LCR lost 3.6 times more absolute body weight than HCR with a large effect size of body weight (d = 2.55; Table 3). Not only did LCR lose a greater proportion of their baseline body weight, they also lost a greater proportion of their baseline fat mass than HCR. Indeed, LCR lost 13.5% of their baseline body weight and nearly half (47.4%), of their baseline fat mass, whereas HCR lost only 4.8% of their baseline body weight and 27.1% of their baseline fat mass (Figure 2A & B). Therefore the majority of the weight lost on IF, and the more marked loss by LCR, was attributed to loss of fat mass rather than lean mass (Figures 2 & 5). In fact, LCR lost over three times more fat mass than HCR, an effect size of d = 1.79 (Table 3). For lean mass, on the other hand, there was much less overall loss, and the proportional loss of 5.30% in LCR and 1.88% in HCR (d = 1.08; p = 0.048; Table 3; Figure 2C). In summary, on IF, LCR lost significantly more fat mass, which accounted for the majority of their weight loss.
Table 3.
Body weight and composition before and after 7 weeks of intermittent fasting (IF) in male high- and low-capacity runners (HCR, LCR).
| Baseline | Intermittent Fasting | Change from Baseline | |||||||
|---|---|---|---|---|---|---|---|---|---|
| Body Weight (g) | Fat Mass (g) | Lean Mass (g) | Body Weight (g) | Fat Mass (g) | Lean Mass (g) | Body Weight (g) | Fat Mass (g) | Lean Mass (g) | |
| HCR | 408.38 ± 26.09 | 67.50 ± 12.31 | 281.11 ± 16.80 | 388.52 ± 23.02 | 48.34 ± 7.43 | 275.83 ± 20.00 | −19.85 ± 15.61 | −19.16 ± 9.28 | −5.29 ± 9.67 |
| LCR | 530.80 ± 47.93 | 130.79 ± 56.60 | 326.23 ± 19.80 | 458.93 ± 40.92 | 68.53 ± 29.43 | 308.94 ± 19.31 | −71.88 ± 18.80 | −62.26 ± 32.75 | −17.29 ± 12.36 |
| HCR≠LCR (p-value) | <0.001 | 0.008 | <0.001 | <0.001 | 0.081 | 0.004 | <0.001 | 0.003 | 0.048 |
Body weight at time of body composition measurement on a fed day at the end of 7 weeks, significant p-values are bolded. Effect size (Cohen’s d) between HCR and LCR body weight loss was d = 2.55, fat mass loss (d = 1.29), and lean mass loss (d = 1.08). Significantly different between HCR and LCR (2-tailed t-test), Mean ± SD.
Figure 2. Body weight and composition in male high-capacity runners (HCR) and low-capacity runners (LCR) subjected to 7 weeks of intermittent fasting (IF).

LCR lost significantly more of their baseline (A) body weight and (B) fat mass than HCR on IF. (C) There was no significant difference in the percent of lean mass lost from baseline between HCR and LCR; *significantly more loss in LCR than HCR; Mean ± SD, p < 0.05.
Figure 5.

Relative change in body composition with 50% calorie restriction (50% CR) and intermittent fasting (IF) in male high- and low-capacity runners (HCR, LCR).
Food intake was examined to determine the extent to which a decrease in food intake contributed to the enhanced weight loss in LCR relative to HCR while on IF. Although HCR weighed less than LCR, HCR ate more at baseline (p < 0.001) and on each week of IF (p < 0.05) shown in Figure 3A. A repeated-measures ANOVA of food intake across 7 weeks revealed a significant main effect of time (p < 0.001) where both HCR and LCR reduced their food intake with IF, a significant main effect of phenotype (p = 0.001) where HCR and LCR had differential change in food intake over time, and a significant interaction between time and phenotype (p < 0.001) where HCR and LCR showed differential decrease in food intake over IF. A two-way ANOVA comparing food intake before and at the end of IF showed a significant main effect of time (p < 0.001) where HCR and LCR ate less over IF, and a significant main effect of phenotype (p < 0.001) where HCR ate more than LCR; there was no interaction between time and phenotype. Independent two-sample t-tests (two-tailed) showed the change from baseline weekly food intake was significantly different between HCR and LCR at weeks 1, 2, 4, and 7 (p < 0.05), where HCR had the larger decrease in food intake from baseline (Figure 3B). Interestingly, HCR ate more than LCR, and while both LCR and HCR decreased their food intake, the larger decrease was seen in the HCR phenotype.
Figure 3. Weekly food intake across 7 weeks of intermittent fasting (IF) in high-capacity runners (HCR) and low-capacity runners (LCR).
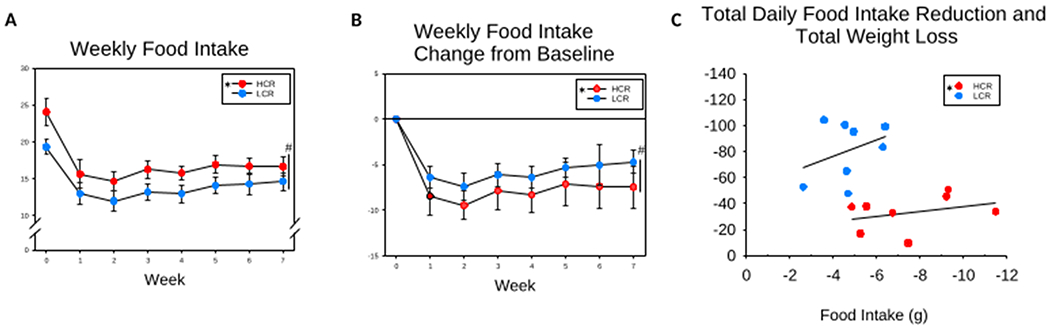
(A) HCR and LCR significantly reduced their food intake from baseline. HCR ate more than LCR at baseline and during each week of IF. (B) HCR showed a greater reduction from baseline food intake at weeks 1, 2, 4, and 7. (C) ANCOVA, compared to LCR, HCR showed a significantly greater reduction in food intake for a given weight loss. # (over vertical bar) significant interaction between time and phenotype; * (in legend) HCR significantly different from LCR, Mean ± SD, p < 0.05.
When examining the effect that reduced food intake had on weight loss during week 7 of IF, an ANCOVA revealed that total weight loss was significantly related to the decrease seen in total daily food intake (p < 0.037). This differed between HCR and LCR where LCR had a greater loss of body weight for a given decrease in food intake (p < 0.001; Figure 3C). In summary, LCR decreased their average food intake from 19.36 g to 14.66 g, a decrease of 4.7 g intake with a weight loss of 71.88 g, while HCR decreased their food intake from 24.11 g to 16.64 g, a decrease of 7.47 g intake with a weight loss of 19.85 g. On IF, HCR ate 69.0% of their ad libitum intake, while LCR ate 75.7% of their ad libitum intake. Although HCR had a greater reduction in food intake than LCR, HCR were still eating more than LCR, while the LCR lost more weight.
When comparing the method of food restriction between daily 50% CR and IF, male LCR subjected to IF—arguably a modest restriction of food intake of < 25% (Figure 2B)—lost similar amounts and proportion body fat (47.4%, 62 g) as the male LCR on much more severe daily food restriction (39.8%, 64 g), with relative preservation of lean mass on IF (Figures 1B and 2B). The ability of a relatively benign total energy deficit with IF to decrease adiposity in LCR stands in contrast with the vulnerability of HCR to a more severe restriction, where HCR lost >10 g more lean mass (Table 1 & Figure 1C).
Some variables changed between fed and fasted days, while others showed less day-to-day volatility in response to acute food availability. Repeated measures 2X7 ANOVA for the average weekly (7 weeks) fed minus fast days for body weight showed a significant main effect of time (p < 0.001) where HCR and LCR had a change in body weight between fed and fasted days over time (higher body weight after a fed day), and a significant main effect of phenotype (p = 0.009) where LCR had a greater change between fed and fasted day body weights; there was no significant interaction between time and phenotype (p = 0.160). T-tests (two-tailed) showed the LCR weighed more than HCR on both fed and fasted days each week (p < 0.05; Figure 4A). To compare changes in body composition between fed and fasted days between HCR and LCR subjected to IF, the last fasted and fed days where body composition was measured (i.e., weeks 6 and 7) were analyzed using t-tests (two-tailed). As shown in (Figure 4D & E), comparing the change in fat mass and lean mass from the final fasted and final fed measurements between HCR and LCR, analysis revealed a greater change in fat mass between fed and fasted days in HCR than LCR (p = 0.02; fasted fat mass was 3.6 ± 1.09 g lower than fed fat mass in HCR, and 1.69 ± 1.64 g higher in LCR), but there was no difference in the change of lean mass between HCR and LCR (p = 0.51; fasted lean mass was 7.5 g lower than fed lean mass in HCR, and 5.85 g lower in LCR). HCR and LCR fat mass did not differ on week 6 (fasted day) or on week 7 (fed day; p > 0.05; Figure 4B), but LCR had more lean mass than HCR on both weeks 6 and 7 of IF (p < 0.05; Figure 4C). In both HCR and LCR, the day-to-day changes of body weight while on IF were primarily due to daily fluctuations of lean mass rather than fat mass.
Figure 4. Body weight and composition during fed and fasted days of intermittent fasting (IF) in high-capacity runners (HCR) and low-capacity runners (LCR).

(A) LCR had higher fed- and fasted-day body weights than HCR in each week of IF. (B) HCR and LCR fat mass did not differ between phenotype during weeks 6 (on a fasted day; p = 0.06) or 7 (on a fed day; p = 0.08). (C) LCR had more lean mass than HCR at both weeks 6 (fasted) and 7 (fed). (D) LCR lost more fat mass than HCR during both weeks 6 (fast) and 7 (fed). (E) LCR lost more lean mass than HCR during week 7 (fed), but not week 6 (fast) of IF. † (over bar) significantly more fasted and fed lean mass in LCR than HCR; * (in legend) or * (over error bar) significantly more in LCR than HCR, Mean ± SD, p < 0.05.
4. Discussion
Previously, we reported that female LCR lost more weight than HCR on IF (Smyers, Koch, Britton, Wagner, & Novak, 2020), which contrasts with 50% CR, where HCR lost a greater proportion of their baseline body weight than LCR (Smyers, Bachir, Britton, Koch, & Novak, 2015). Here, we confirm that IF induces greater weight loss in male LCR. This greater loss of body weight and fat mass in the male rats with low intrinsic aerobic fitness is consistent with the greater loss of body weight and fat mass previously identified in female LCR (Smyers, Koch, Britton, Wagner, & Novak, 2020), and further underlines the potential for IF to be a beneficial weight-loss regimen for the obesity-prone rats.
The underlying phenotypic differences in intrinsic aerobic capacity in HCR and LCR rat models produce a differential response to both methods of energy restriction discussed here. Through the use of artificial selective breeding, these contrasting models exemplify the differences in aerobic fitness capacity (Koch & Britton, 2008; Wisløff et al., 2005). As such, LCR have a much higher risk for the development of cardiovascular disease and metabolic syndrome (Koch & Britton, 2008). Previously, these rats showed differential weight gain on a high-fat diet and insulin sensitivity in male rats (Bikman et al., 2009; Matthew Morris, Meers, Koch, Britton, MacLean, & Thyfault, 2016; Morris et al., 2014; Morris et al., 2017; Morris et al., 2016; Morris et al., 2019; Naples et al., 2010; Noland et al., 2007; Novak et al., 2010; Park et al., 2016), and some deleterious health effects of a high-fat diet in LCR were not seen in HCR (Novak, Escande, Burghardt, Zhang, Barbosa, Chini, Britton, Koch, Akil, & Levine, 2010). Despite the general vulnerability to weight gain and the corresponding health sequela in low-fitness rats, IF is a promising dietary regimen that results in a marked weight and fat loss in this rat model of intrinsic aerobic capacity (Smyers, Koch, Britton, Wagner, & Novak, 2020).
According to human clinical trials, low aerobic fitness is one of the strongest predictors of cardiovascular disease and all-cause mortality in healthy adults (Kodama et al., 2009; Kokkinos et al., 2008; Ladenvall, Persson, Mandalenakis, Wilhelmsen, Grimby, Svärdsudd, & Hansson, 2016). Kodama et al. (2009) compiled data from 33 eligible studies to reveal that lower maximal aerobic capacity is associated with higher cardiovascular disease and all-cause mortality (Kodama, Saito, Tanaka, Maki, Yachi, Asumi, Sugawara, Totsuka, Shimano, Ohashi, Yamada, & Sone, 2009). High fitness levels in children reduce obesity-related comorbidities as well (DuBose, Eisenmann, & Donnelly, 2007). Keeping this in mind, humans with low aerobic capacity or even those who do not exercise may benefit from IF for weight loss and the treatment of obesity. Indeed, in overweight and obese individuals, IF has resulted in significant weight loss, improvements of inflammatory markers, and improvements of HDL cholesterol and triglyceride concentrations (Patterson et al., 2015). Aerobic capacity is therefore a major driver to the development of obesity and thus serves as a mediator of the response to calorie restriction and intermittent fasting for weight and fat loss.
Our past experiment showed that 50% CR induced greater proportional weight loss in HCR rather than in LCR (Smyers, Bachir, Britton, Koch, & Novak, 2015). Here, however, the difference in weight loss between the two phenotypes did not reach significance. This inconsistency here and elsewhere (Mukherjee, Koch, Britton, & Novak, 2020) could be attributable to the relatively low effect size, reflected in the marginal difference in weight loss seen here (Figure 1A). This stands in contrast to the robust ability of IF to reduce body weight and adiposity in the LCR. Comparing daily food restriction with IF, a more consistent and notable phenotypic difference is apparent when examining body composition where LCR lost similar amounts and proportion body fat on 50% CR and IF, while HCR lost 55.12 ± 14.54 g of lean mass on 50% CR compared to 5.29 ± 9.67 g on IF. This raises the question as to why LCR lose more fat and body weight than HCR on IF, which is a less restrictive diet, albeit for a longer duration of food restriction. Possible contributing factors include food intake, energy expenditure, or both. When examining food intake, HCR ate more than LCR both before and during IF (Figure 3A). HCR, however, decreased their food intake more than LCR even though LCR lost more weight (Figures 3B & C). This implies that there is an additional energetic contribution to this phenotypic difference in the amount of weight lost, such as changes in energy expenditure, where LCR may experience less severe energy expenditure suppression than HCR. It is known that HCR has higher energy expenditure (EE) due to their heightened aerobic capacity and activity-related EE (Gavini et al., 2014; Mukherjee, Koch, Britton, & Novak, 2020) and thus may be affected differently than LCR in response to energy restriction. A direct comparison of the effects IF and CR have on EE is warranted, as the differential change in body composition between HCR and LCR could stem from differential suppression of EE when subjected to different modes of food restriction. The size difference between male HCR and LCR complicates expenditure analysis, whereas female HCR and LCR have less size variation and are more easily weight matched to control for the effect of weight when measuring EE. Similarly, the ability of different modes of food restriction to alter body composition could stem from the intermittent nature of food restriction, the overall lower severity of energetic restriction, or both.
As shown in Table 2, CR-induced weight loss was accompanied by a significant decrease in leptin in both HCR and LCR, as predicted with fat loss. Also, consistent with Novak et al. (2010), the greater body size and adiposity of the LCR coincided with significantly higher leptin levels, with no differential decrease in leptin with weight loss (Novak, Escande, Burghardt, Zhang, Barbosa, Chini, Britton, Koch, Akil, & Levine, 2010). There were also higher levels of proinflammatory cytokine IL-1β in LCR. Counterintuitively, there were also higher levels of the anti-inflammatory cytokine IL-10 in the low-fitness LCR. Though obesity is associated with inflammation (Engin, 2017), the association between adiposity and individual cytokines is not entirely predictable; for example, elevated levels of IL-10 are reported in obese women with metabolic syndrome, whereas low levels of IL-10 were present in obese woman without metabolic syndrome (Esposito et al., 2003). Some evidence supports the idea that IF decreases pro-inflammatory cytokines such as TNFα, IL-1β, and IL-6 (Arumugam, Phillips, Cheng, Morrell, Mattson, & Wan, 2010; Liu, Page, Hatzinikolas, Chen, Wittert, & Heilbronn, 2018; Patterson, Laughlin, LaCroix, Hartman, Natarajan, Senger, Martínez, Villaseñor, Sears, Marinac, & Gallo, 2015). Indeed, Liu et al. (2018) subjected high-fat diet-fed mice to IF and that 8 weeks of IF improved adipose tissue markers of inflammation (Liu, Page, Hatzinikolas, Chen, Wittert, & Heilbronn, 2018). Arumugam et al. (2010) suggested that age might modulate the effect of diet on inflammation; young mice on an IF-fed diet exhibited decreased inflammatory cytokines TNFα and IL-6, while inflammatory cytokines were increased in older mice (Arumugam, Phillips, Cheng, Morrell, Mattson, & Wan, 2010).
The absence of change in inflammation-related cytokines in HCR and LCR subjected to CR (Table 2) stands in contrast to a report that time-restricted feeding, which restricts the duration of food availability, reduced IL-1β in mice (Chung, Kim, Kim, Choi, & Yu, 2002; Sherman et al., 2011). Interestingly, higher levels of IL-10 after 30% CR were observed in aged rhesus monkeys (Willette et al., 2013). Despite relevance of inflammation to the health impact of obesity (Engin, 2017), there was no significant effect of food restriction and weight loss on cytokines identified here outside of leptin. Similar to our findings in male HCR and LCR rats on IF and 50% CR, Trepanowski et al. (2017) found that overweight or obese individuals who were either on an alternate-day fasting or CR regimen saw similarly reduced leptin levels, but neither diet affected other measured adipokines including TNF-α or IL-6. Cytokine levels are under circadian control, and perhaps the timing of serum collection in part influenced cytokine levels (Keller et al., 2009; Liu, Page, Hatzinikolas, Chen, Wittert, & Heilbronn, 2018). The effect IF has on circulating cytokines is of interest though unfortunately, the experimental design and sample size in this study precluded gathering serum samples before and after IF.
With alternating days of fasting, changes in body weight corresponded with acute food availability, such that there was an increase in body weight after feeding and a decrease in body weight after fasting (Figure 4A). This weight fluctuation is primarily due to daily changes in lean mass, rather than fat mass, consistent with prior evidence (Figure 4C & E) (Smyers, Koch, Britton, Wagner, & Novak, 2020). Previously, Smyers et al. (2020) measured water intake in HCR and LCR during IF and found that the fluctuations seen in lean mass, and therefore in body weight, may in part be due to the change in water intake with food availability on fed days (Smyers, Koch, Britton, Wagner, & Novak, 2020). Even though water was available ad libitum, there was less water intake on fasted days compared to fed days (Smyers, Koch, Britton, Wagner, & Novak, 2020). Limited evidence from human clinical trials indicates similar day-to-day responses and, not surprisingly, fasting days are associated with increased hunger and lower physical activity compared to fed days (Beaulieu et al., 2020). The prevalence of day-to-day changes in energy expenditure and physical activity with food availability is an important under-addressed issue as it would be expected to impact diet adherence.
Consistent with our recent report that female LCR were more responsive to IF, here we show that male LCR lost significantly more weight with alternate-day fasting, and this weight loss is primarily from the loss of fat mass (Table 3). Conversely, 3 weeks of CR induced a greater loss of lean mass in HCR (Table 1), consistent with our previous experiments, where HCR appear to have a greater vulnerability to the loss of lean mass with food restriction than LCR (Smyers, Bachir, Britton, Koch, & Novak, 2015). Even so, our findings suggest that IF is an effective weight loss regimen for the low-fitness LCR phenotype, however, direct comparisons are needed to determine if this greater weight loss in LCR is secondary to timing or the severity of food restriction, as well as the potential for IF to lessen the adaptation in energy expenditure seen with weight loss. Altogether, these datasets highlight not only the ability of IF to promote weight and fat loss, but also the interaction with aerobic fitness.
New Findings.
What is the central question of this study?
How does intrinsic aerobic capacity impact weight loss with 50% daily calorie restriction and alternate day fasting?
What is the main finding and its importance?
Intermittent fasting is effective for weight loss in low-fitness rats, which highlights the importance of how intermittent fasting interacts with aerobic fitness.
Funding
This work was supported by the National Institutes of Health R15DK108668 and R15DK097644 (to CMN) and P40OD021331 (to LGK and SLB); the LCR-HCR rat models are maintained as an exercise rat model resource for researchers at The University of Toledo, Toledo, OH. Contact LGK (Lauren.Koch2@UToledo.Edu) or SLB (brittons@umich.edu) for information.
Footnotes
Competing Interests
Authors have no competing interests in regard to data presented in this manuscript.
Data Availability Statement
All data supporting the results of this paper is located within this paper.
References
- Almundarij TI, Smyers ME, Spriggs A, Heemstra LA, Beltz L, Dyne E, … Novak CM (2016). Physical Activity, Energy Expenditure, and Defense of Body Weight in Melanocortin 4 Receptor-Deficient Male Rats. Sci Rep., 6, 37435–37435. doi: 10.1038/srep37435 [DOI] [PMC free article] [PubMed] [Google Scholar]
- Arumugam TV, Phillips TM, Cheng A, Morrell CH, Mattson MP, & Wan R (2010). Age and energy intake interact to modify cell stress pathways and stroke outcome. Ann Neurol, 67(1), 41–52. doi: 10.1002/ana.21798 [DOI] [PMC free article] [PubMed] [Google Scholar]
- Beaulieu K, Casanova N, Oustric P, Hopkins M, Varady K, Finlayson G, & Gibbons C (2020). An exploratory investigation of the impact of ‘fast’ and ‘feed’ days during intermittent energy restriction on free-living energy balance behaviours and subjective states in women with overweight/obesity. Eur J Clin Nutr. doi: 10.1038/s41430-020-00740-1 [DOI] [PubMed] [Google Scholar]
- Bikman BT, Woodlief TL, Noland RC, Britton SL, Koch LG, Lust RM, … Cortright RN (2009). High-fat diet induces Ikkbeta and reduces insulin sensitivity in rats with low running capacity. Int J Sports Med, 30(9), 631–635. doi: 10.1055/s-0029-1224174 [DOI] [PMC free article] [PubMed] [Google Scholar]
- Chung HY, Kim HJ, Kim KW, Choi JS, & Yu BP (2002). Molecular inflammation hypothesis of aging based on the anti-aging mechanism of calorie restriction. Microsc Res Tech, 59(4), 264–272. doi: 10.1002/jemt.10203 [DOI] [PubMed] [Google Scholar]
- DuBose KD, Eisenmann JC, & Donnelly JE (2007). Aerobic fitness attenuates the metabolic syndrome score in normal-weight, at-risk-for-overweight, and overweight children. Pediatrics, 120(5), e1262–1268. doi: 10.1542/peds.2007-0443 [DOI] [PubMed] [Google Scholar]
- Dulloo AG, Jacquet J, Montani JP, & Schutz Y (2012). Adaptive thermogenesis in human body weight regulation: more of a concept than a measurable entity? Obes Rev, 13 Suppl 2, 105–121. doi: 10.1111/j.1467-789X.2012.01041.x [DOI] [PubMed] [Google Scholar]
- Engin A (2017). The Definition and Prevalence of Obesity and Metabolic Syndrome. Adv Exp Med Biol, 960, 1–17. doi: 10.1007/978-3-319-48382-5_1 [DOI] [PubMed] [Google Scholar]
- Esposito K, Pontillo A, Giugliano F, Giugliano G, Marfella R, Nicoletti G, & Giugliano D (2003). Association of low interleukin-10 levels with the metabolic syndrome in obese women. J Clin Endocrinol Metab, 88(3), 1055–1058. doi: 10.1210/jc.2002-021437 [DOI] [PubMed] [Google Scholar]
- Gavini CK, Mukherjee S, Shukla C, Britton SL, Koch LG, Shi H, & Novak CM (2014). Leanness and heightened nonresting energy expenditure: role of skeletal muscle activity thermogenesis. Am J Physiol Endocrinol Metab, 306(6), E635–647. doi: 10.1152/ajpendo.00555.2013 [DOI] [PMC free article] [PubMed] [Google Scholar]
- Goran M, Fields DA, Hunter GR, Herd SL, & Weinsier RL (2000). Total body fat does not influence maximal aerobic capacity. Int J Obes, 24(7), 841–848. doi: 10.1038/sj.ijo.0801241 [DOI] [PubMed] [Google Scholar]
- Hansen C, & Spuhler K (1984). Development of the National Institutes of Health genetically heterogeneous rat stock. Alcohol Clin Exp Res, 8(5), 477–479. doi: 10.1111/j.1530-0277.1984.tb05706.x [DOI] [PubMed] [Google Scholar]
- Haslam DW, & James WPT (2005). Obesity. Lancet, 366(9492), 1197–1209. doi: 10.1016/S0140-6736(05)67483-1 [DOI] [PubMed] [Google Scholar]
- Hoddy KK, Marlatt KL, Çetinkaya H, & Ravussin E (2020). Intermittent Fasting and Metabolic Health: From Religious Fast to Time-Restricted Feeding. Obesity, 28(S1), S29–S37. doi: 10.1002/oby.22829 [DOI] [PMC free article] [PubMed] [Google Scholar]
- Keller M, Mazuch J, Abraham U, Eom GD, Herzog ED, Volk HD, … Maier B (2009). A circadian clock in macrophages controls inflammatory immune responses. Proc Natl Acad Sci U S A, 106(50), 21407–21412. doi: 10.1073/pnas.0906361106 [DOI] [PMC free article] [PubMed] [Google Scholar]
- Koch LG, & Britton SL (2008). Aerobic metabolism underlies complexity and capacity. The Journal of Physiology, 586(1), 83–95. doi: 10.1113/jphysiol.2007.144709 [DOI] [PMC free article] [PubMed] [Google Scholar]
- Koch LG, & Britton SL (2018). Theoretical and Biological Evaluation of the Link between Low Exercise Capacity and Disease Risk. Cold Spring Harb Perspect Med, 8(1). doi: 10.1101/cshperspect.a029868 [DOI] [PMC free article] [PubMed] [Google Scholar]
- Kodama S, Saito K, Tanaka S, Maki M, Yachi Y, Asumi M, … Sone H (2009). Cardiorespiratory Fitness as a Quantitative Predictor of All-Cause Mortality and Cardiovascular Events in Healthy Men and Women: A Meta-analysis. JAMA, 301(19), 2024–2035. doi: 10.1001/jama.2009.681 [DOI] [PubMed] [Google Scholar]
- Kokkinos P, Myers J, Kokkinos JP, Pittaras A, Narayan P, Manolis A, … Singh S (2008). Exercise Capacity and Mortality in Black and White Men. Circulation, 117(5), 614–622. doi:doi: 10.1161/CIRCULATIONAHA.107.734764 [DOI] [PubMed] [Google Scholar]
- Ladenvall P, Persson CU, Mandalenakis Z, Wilhelmsen L, Grimby G, Svärdsudd K, & Hansson PO (2016). Low aerobic capacity in middle-aged men associated with increased mortality rates during 45 years of follow-up. Eur J Prev Cardiol, 23(14), 1557–1564. doi: 10.1177/2047487316655466 [DOI] [PubMed] [Google Scholar]
- Liu B, Page AJ, Hatzinikolas G, Chen M, Wittert GA, & Heilbronn LK (2018). Intermittent Fasting Improves Glucose Tolerance and Promotes Adipose Tissue Remodeling in Male Mice Fed a High-Fat Diet. Endocrinology, 160(1), 169–180. doi: 10.1210/en.2018-00701 [DOI] [PubMed] [Google Scholar]
- Martins C, Roekenes J, Salamati S, Gower BA, & Hunter GR (2020). Metabolic adaptation is an illusion, only present when participants are in negative energy balance. Am J Clin Nutr, 112(5), 1212–1218. doi: 10.1093/ajcn/nqaa220 [DOI] [PMC free article] [PubMed] [Google Scholar]
- Matthew Morris E, Meers GM, Koch LG, Britton SL, MacLean PS, & Thyfault JP (2016). Increased aerobic capacity reduces susceptibility to acute high-fat diet-induced weight gain. Obesity (Silver Spring), 24(9), 1929–1937. doi: 10.1002/oby.21564 [DOI] [PMC free article] [PubMed] [Google Scholar]
- Morris EM, Jackman MR, Johnson GC, Liu TW, Lopez JL, Kearney ML, … Thyfault JP (2014). Intrinsic aerobic capacity impacts susceptibility to acute high-fat diet-induced hepatic steatosis. Am J Physiol Endocrinol Metab, 307(4), E355–364. doi: 10.1152/ajpendo.00093.2014 [DOI] [PMC free article] [PubMed] [Google Scholar]
- Morris EM, McCoin CS, Allen JA, Gastecki ML, Koch LG, Britton SL, … Thyfault JP (2017). Aerobic capacity mediates susceptibility for the transition from steatosis to steatohepatitis. J Physiol, 595(14), 4909–4926. doi: 10.1113/jp274281 [DOI] [PMC free article] [PubMed] [Google Scholar]
- Morris EM, Meers GME, Koch LG, Britton SL, Fletcher JA, Fu X, … Thyfault JP (2016). Aerobic capacity and hepatic mitochondrial lipid oxidation alters susceptibility for chronic high-fat diet-induced hepatic steatosis. Am J Physiol Endocrinol Metab, 311(4), E749–e760. doi: 10.1152/ajpendo.00178.2016 [DOI] [PMC free article] [PubMed] [Google Scholar]
- Morris EM, Meers GME, Ruegsegger GN, Wankhade UD, Robinson T, Koch LG, … Thyfault JP (2019). Intrinsic High Aerobic Capacity in Male Rats Protects Against Diet-Induced Insulin Resistance. Endocrinology, 160(5), 1179–1192. doi: 10.1210/en.2019-00118 [DOI] [PMC free article] [PubMed] [Google Scholar]
- Most J, & Redman LM (2020). Impact of calorie restriction on energy metabolism in humans. Exp Gerontol, 133, 110875. doi: 10.1016/j.exger.2020.110875 [DOI] [PMC free article] [PubMed] [Google Scholar]
- Mukherjee SD, Koch LG, Britton SL, & Novak CM (2020). Aerobic capacity modulates adaptive thermogenesis: Contribution of non-resting energy expenditure. Physiol Behav, 225, 113048. doi: 10.1016/j.physbeh.2020.113048 [DOI] [PMC free article] [PubMed] [Google Scholar]
- Müller MJ, & Bosy-Westphal A (2013). Adaptive thermogenesis with weight loss in humans. Obesity, 21(2), 218–228. doi:doi: 10.1002/oby.20027 [DOI] [PubMed] [Google Scholar]
- Naples SP, Borengasser SJ, Rector RS, Uptergrove GM, Morris EM, Mikus CR, … Thyfault JP (2010). Skeletal muscle mitochondrial and metabolic responses to a high-fat diet in female rats bred for high and low aerobic capacity. Appl Physiol Nutr Metab, 35(2), 151–162. doi: 10.1139/h09-139 [DOI] [PMC free article] [PubMed] [Google Scholar]
- Nixon JP, Zhang M, Wang C, Kuskowski MA, Novak CM, Levine JA, … Kotz CM (2010). Evaluation of a Quantitative Magnetic Resonance Imaging System for Whole Body Composition Analysis in Rodents. Obesity, 18(8), 1652–1659. doi: 10.1038/oby.2009.471 [DOI] [PMC free article] [PubMed] [Google Scholar]
- Noland RC, Thyfault JP, Henes ST, Whitfield BR, Woodlief TL, Evans JR, … Lust RM (2007). Artificial selection for high-capacity endurance running is protective against high-fat diet-induced insulin resistance. Am J Physiol Endocrinol Metab, 293(1), E31–41. doi: 10.1152/ajpendo.00500.2006 [DOI] [PubMed] [Google Scholar]
- Novak CM, Escande C, Burghardt PR, Zhang M, Barbosa MT, Chini EN, … Levine JA (2010). Spontaneous activity, economy of activity, and resistance to diet-induced obesity in rats bred for high intrinsic aerobic capacity. Horm Behav, 58(3), 355–367. doi: 10.1016/j.yhbeh.2010.03.013 [DOI] [PMC free article] [PubMed] [Google Scholar]
- Park YM, Kanaley JA, Zidon TM, Welly RJ, Scroggins RJ, Britton SL, … Vieira-Potter VJ (2016). Ovariectomized Highly Fit Rats Are Protected against Diet-Induced Insulin Resistance. Med Sci Sports Exerc, 48(7), 1259–1269. doi: 10.1249/mss.0000000000000898 [DOI] [PMC free article] [PubMed] [Google Scholar]
- Patterson RE, Laughlin GA, LaCroix AZ, Hartman SJ, Natarajan L, Senger CM, … Gallo LC (2015). Intermittent Fasting and Human Metabolic Health. Journal of the Academy of Nutrition and Dietetics, 115(8), 1203–1212. doi: 10.1016/j.jand.2015.02.018 [DOI] [PMC free article] [PubMed] [Google Scholar]
- Redman LM, Heilbronn LK, Martin CK, de Jonge L, Williamson DA, Delany JP, & Ravussin E (2009). Metabolic and behavioral compensations in response to caloric restriction: implications for the maintenance of weight loss. PLoS One, 4(2), e4377. doi: 10.1371/journal.pone.0004377 [DOI] [PMC free article] [PubMed] [Google Scholar]
- Rosenbaum M, & Leibel RL (2010). Adaptive thermogenesis in humans. Int J Obes (Lond), 34 Suppl 1, S47–55. doi: 10.1038/ijo.2010.184 [DOI] [PMC free article] [PubMed] [Google Scholar]
- Sherman H, Frumin I, Gutman R, Chapnik N, Lorentz A, Meylan J, … Froy O (2011). Long-term restricted feeding alters circadian expression and reduces the level of inflammatory and disease markers. J Cell Mol Med, 15(12), 2745–2759. doi: 10.1111/j.1582-4934.2010.01160.x [DOI] [PMC free article] [PubMed] [Google Scholar]
- Smyers ME, Bachir KZ, Britton SL, Koch LG, & Novak CM (2015). Physically active rats lose more weight during calorie restriction. Physiol Behav, 139, 303–313. doi: 10.1016/j.physbeh.2014.11.044 [DOI] [PMC free article] [PubMed] [Google Scholar]
- Smyers ME, Koch LG, Britton SL, Wagner JG, & Novak CM (2020). Enhanced weight and fat loss from long-term intermittent fasting in obesity-prone, low-fitness rats. Physiol Behav, 113280. doi: 10.1016/j.physbeh.2020.113280 [DOI] [PMC free article] [PubMed] [Google Scholar]
- Timmons JA, Knudsen S, Rankinen T, Koch LG, Sarzynski M, Jensen T, … Bouchard C (2010). Using molecular classification to predict gains in maximal aerobic capacity following endurance exercise training in humans. J Appl Physiol (1985), 108(6), 1487–1496. doi: 10.1152/japplphysiol.01295.2009 [DOI] [PMC free article] [PubMed] [Google Scholar]
- Trepanowski John F., Kroeger Cynthia M., Barnosky Adrienne, Klempel Monica C., Bhutani Surabhi, Hoddy Kristin K., Gabel Kelsey, Freeks Sally, Rigdon Joseph, Rood Jennifer, Ravussin Eric, Varady Krista A. (2017) Effect of Alternate-Day Fasting on Weight Loss, Weight Maintenance, and Cardioprotection Among Metabolically Healthy Obese Adults: A Randomized Clinical Trial. JAMA Intern Medicine, 177 (7), 930–938. doi: 10.1001/jamainternmed.2017.0936 [DOI] [PMC free article] [PubMed] [Google Scholar]
- Willette AA, Coe CL, Birdsill AC, Bendlin BB, Colman RJ, Alexander AL, … Johnson SC (2013). Interleukin-8 and interleukin-10, brain volume and microstructure, and the influence of calorie restriction in old rhesus macaques. Age (Dordrecht, Netherlands), 35(6), 2215–2227. doi: 10.1007/s11357-013-9518-y [DOI] [PMC free article] [PubMed] [Google Scholar]
- Wisløff U, Najjar SM, Ellingsen O, Haram PM, Swoap S, Al-Share Q, … Britton SL (2005). Cardiovascular risk factors emerge after artificial selection for low aerobic capacity. Science, 307(5708), 418–420. doi: 10.1126/science.1108177 [DOI] [PubMed] [Google Scholar]
- Withrow D, & Alter DA (2011). The economic burden of obesity worldwide: a systematic review of the direct costs of obesity. Obes Rev, 12(2), 131–141. doi: 10.1111/j.1467-789X.2009.00712.x [DOI] [PubMed] [Google Scholar]
- Yamada Y, Colman RJ, Kemnitz JW, Baum ST, Anderson RM, Weindruch R, & Schoeller DA (2013). Long-term calorie restriction decreases metabolic cost of movement and prevents decrease of physical activity during aging in rhesus monkeys. Exp Gerontol, 48(11), 1226–1235. doi: 10.1016/j.exger.2013.08.002 [DOI] [PMC free article] [PubMed] [Google Scholar]
Associated Data
This section collects any data citations, data availability statements, or supplementary materials included in this article.
Data Availability Statement
All data supporting the results of this paper is located within this paper.