

Abstract
Purpose
Our retrospective study is to investigate an end-to-end deep learning model in identifying ploidy status through raw time-lapse video.
Methods
By randomly dividing the dataset of time-lapse videos with known outcome of preimplantation genetic testing for aneuploidy (PGT-A), a deep learning model on raw videos was trained by the 80% dataset, and used to test the remaining 20%, by feeding time-lapse videos as input and the PGT-A prediction as output. The performance was measured by an average area under the curve (AUC) of the receiver operating characteristic curve.
Result(s)
With 690 sets of time-lapse video image, combined with PGT-A results, our deep learning model has achieved an AUC of 0.74 from the test dataset (138 videos), in discriminating between aneuploid embryos (group 1) and others (group 2, including euploid and mosaic embryos).
Conclusion
Our model demonstrated a proof of concept and potential in recognizing the ploidy status of tested embryos. A larger scale and further optimization on the exclusion criteria would be included in our future investigation, as well as prospective approach.
Keywords: Time-lapse, Deep learning, Preimplantation genetic testing for aneuploidy (PGT-A), Ploidy status
Introduction
The ultimate goal of assisted reproduction technology (ART) is to carry out healthy live births. With regard to the current ART practice, selecting the best embryo to transfer is highly dependent on daily morphology observation by embryologists trained with traditional grading systems. Though implantation potential has been considered higher among good-quality blastocysts, the correlation to clinical outcomes including ploidy status of embryo remains unsatisfactory with existing methods [1]. As morphology assessment has its subjectiveness due to the reliance of experience from embryologists and timing of observation, preimplantation genetic testing for aneuploidy (PGT-A) which performs implantation screening by detecting the chromosomal status of embryos has become a solid tool to interpret the genetic quality of the embryo [1]. However, PGT-A requires an invasive biopsy of trophectoderm (TE), which may intervene later in embryonic development and implantation; such approach has been suggested only under certain clinical indications with caution, not as a universal utilization on all patient cases [2]. As the current standard practice PGT-A protocol requires the highly invasive biopsy procedure, scientists have been seeking non-invasive methods to minimize the harm to the embryo. Beside PGT-A, the cell-free DNA analysis is one of the alternative approaches to predict chromosomal status [3], which also has the potential to increase the feasibility toward a larger number of clients and reduce lab expenses [4]. However, the frequent presence of non-embryonic sources of DNA in spent culture medium, e.g., maternal DNA from cumulus or corona radiata cells, still exists and requires more research in that direction for future clinical application [5].
As morphology grading remains the mainstream method of embryo evaluation, and PGT-A seems to provide a higher implantation potential [6], studies started to connect ploidy results with morphology and studies showed that the morphology in the blastocyst stage has been known to be associated with embryonic aneuploidy [7, 8]. Therefore, the morphology approach provides another direction of ploidy prediction through non-invasive assessment. The invention of the time-lapse incubator provides the laboratory an opportunity to utilize a vast number of sequence images for detailed morphology assessment. By analyzing continuous embryo development through captured time-lapse images from the incubator, the focus of embryo assessment has been shifted from the single snapshot morphological image to a more fluidic morphokinetic direction. Previous time-lapse studies have shown a potential relationship between morphokinetic parameters and ploidy status [9–13]. However, regarding the efficacy of such an approach, the methodology of ploidy prediction through time-lapse parameters is not ready for universal clinical practice [14, 15].
While time-lapse morphology has limitations in applying to clinical settings through statistical approach alone, deep learning approaches first started gaining its potential in medical imaging [16], followed by studies exploring its applications in ART to assist embryo evaluation and selection through images [17–19].
Compared with those commonly selected positive clinical outcomes, the genetic status relevant to ploidy results was seldom selected as an endpoint for deep learning models; until the most recent similar approach as Table 1 displays, AUC ranged from 0.56 to 0.74 [9, 11, 15, 18, 19]. However, those approaches varied in parameter selection, statistical analysis, or deep learning approaches.
Table 1.
Studies reporting of different parameters as predictors for ploidy status with AUC results
| Image capture device | Type of input data | Statistical/deep learning approach | Endpoint with ploidy status | Performance | |
|---|---|---|---|---|---|
| Campbell et al. (2013) | Time-lapse incubator | Morphokinetic parameters: up to blastocyst stage | Statistical: AUROC curve | Aneuploidy risk | Aneuploidy risk AUC = 0.72 |
| Basile et al. (2014) | Time-lapse incubator | Morphokinetic parameters: up to day 3 | Statistical: AUROC curve | Euploidy or aneuploidy | Chromosome normality: AUC = 0.63 |
| Kramer et al. (2014) | Time-lapse incubator | Morphokinetic parameters: up to blastocyst stages | Statistical: AUROC curve | Aneuploidy risk | Aneuploidy risk with full blastocyst: AUC = 0.56 |
| Barnes et al. (2020) | Time-lapse incubator | Single blastocyst image | Deep learning: AUROC curve | Euploidy or aneuploidy | Detection of euploidy and aneuploidy: AUC = 0.62 |
| Chavez et al. (2020) | Light microscope | Single blastocyst image | Deep learning: AUROC curve | Good/poor prognosis* | Detection of good/poor prognosis*: AUC = 0.74 |
| Our approach | Time-lapse incubator | Video image: from days 1 to 5 | Deep learning: AUROC curve | Aneuploidy or not | Detection of aneuploidy: AUC = 0.74 |
*Combined with other outcomes
Identifying the embryo’s ploidy status could facilitate the shortening of time-to-pregnancy; we were interested in whether a non-invasive deep learning approach toward the time-lapse video was capable of predicting the ploidy status from day 1 to day 5. In this study, we aim to see whether a morphokinetic approach using a novel deep learning model developed in-house through time-lapse video, instead of labeled parameters, can correlate with PGT-A result more precisely than existing protocols. Although there are studies that combine ploidy outcomes to human embryo images through deep learning models, the input data was mostly single images instead of continuous time-lapse video. To the best of our knowledge, the same approach as using continuous time-lapse images connecting to ploidy status prediction by using deep learning models has not yet been found. Therefore, our study would like to know whether continuous raw time-lapse videos can predict ploidy status through deep learning models.
Material and methods
Data collection and patient selection
This retrospective study was approved by the Institutional Review Board (approval numbers CS18082 on 30 April 2018 and CS19039 on 1 April 2019) of Chung Sun Medical University, Taichung, Taiwan. All procedures were performed in compliance with relevant guidelines and regulations [20].
A total of 108 patients undergoing 119 PGT-A cycles at the Lee Women’s Hospital were enrolled. Cases that meet the following conditions are excluded from our study: AMH ≤ 1.1 ng/mL, advanced age group (> 38 years old), severe endometriosis and uterine pathology, surgical sperm retrieval, and the patient experienced at least three previous failures of euploid embryo transfers. We obtained a total of 144,210 data points from 690 sets of videos collected from the time-lapse incubator. The Ethics Committee waived the requirement for informed consent as the time-lapse monitoring was free of charge to patients during the study period [20].
In vitro fertilization, embryo culture, and micromanipulation
Oocyte retrieval, insemination, embryo culture, trophectoderm biopsy, and embryo vitrification/warming were managed and performed by following the standard protocols [21]. Insemination procedure, conventional or ICSI, was performed in a fertilization medium (SAGE Biopharma, USA) with a 15% serum protein substitute (SPS; SAGE Biopharma, USA). After fertilization check, embryos were moved to EmbryoSlide+ culture dish with equilibrated cleavage medium (SAGE) containing 15% SPS, and placed into the time-lapse incubator (EmbryoScope+, Vitrolife, Sweden) supplemented with gas mixture at 5% CO2, 5% O2, and 90% N2. At this time, the time-lapse video monitoring process began. After 70–72 h of insemination or ICS, the culture medium was replaced by an equilibrated blastocyst medium with 15% SPS (SAGE). The quality of blastocysts expanded on day 5 or 6 was assessed before biopsy. We used Gardner & Schoolcraft grading system [22] to determine embryos feasible for biopsy for PGT and vitrification. We only biopsied those that were considered desirable (AA, BA, CA, AB, BB, CB, AC, and BC). Our biopsy procedures were equipped with a warming plate on a Diaphot 300 inverted microscope (Nikon, Japan). Blastocysts were shifted to microdroplets of blastocyst medium, and the biopsy procedures were performed by using micromanipulation tools (Humagen, USA). After creating a hole by 3–5 ms laser pulses on zona pellucida away from ICM, 5–8 trophectoderm cells were smoothly aspirated into the biopsy pipette. Then, by applying 2–3 laser pulses, the trophectoderm cells were then detached from the blastocysts. With smooth suction, those biopsied trophectoderm cells were shifted to droplets of phosphate-buffered saline. After rinsing several times, we moved the biopsied trophectoderm cells into an RNAse–DNAse-free polymerase chain reaction tube. Those biopsied blastocysts were subjected to vitrification (Cryotech, Japan) after more than 3 h of incubation within a tri-gas incubator [20].
Determination of diploid–aneuploid
According to the diploid–aneuploid mosaic ratios detected using the high-resolution next-generation sequencing (hr-NGS) platform on the biopsied cells, blastocysts were divided into the following four groups as Table 2: (i) euploid blastocysts with mosaicism levels ≤ 20%; (ii) low-level mosaic blastocysts with mosaicism levels between 20 and 50%; (iii) high-level mosaic blastocysts with mosaicism levels between 50 and 80%; (iv) aneuploid blastocysts with mosaicism levels > 80%. In this study, a total of 690 expanded blastocysts derived from culture in the time-lapse incubator were biopsied for the hr-NGS analysis. Amplification failure was encountered in nine blastocysts (1.3%), which were warmed for rebiopsy followed by re-vitrification.
Table 2.
Distribution of PGT-A results. Parentheses denoted open interval and square brackets indicated closed interval
| PGT-A result group | Euploidy | Low mosaicism | High mosaicism | Aneuploidy |
|---|---|---|---|---|
| Mosaicism levels (%) | ≤ 20 | (20, 50) | [50, 80] | > 80 |
| Count | 258 | 196 | 79 | 157 |
| Ratio (%) | 37.39 | 28.41 | 11.45 | 22.75 |
Model architecture and training process
Two-Stream Inflated 3D ConvNet (I3D) produced by Google was chosen as our model’s structure [23] for its significant improvement in classifying videos in action recognition. After being pre-trained on the ImageNet and Kinetics datasets, our model was then fine-tuned on the study datasets to learn how to classify the embryos as group 1 (aneuploidy) and group 2 (euploidy and mosaicism) based on a series of images by itself. For fine-tuning, the weights of all convolution bases were frozen, and the model was trained 1 epoch with a learning rate of 0.001. Later, weights were unfrozen for all layers, and the model was trained 400 epochs with a learning rate of 0.01. Stochastic gradient descent with warm restarts was utilized with 20 epochs per cycle, and the learning rate was decayed epoch by epoch with a rate of 0.8 within each cycle [24]. Batch size was set to 8 during training.
Deep learning models have the benefits of data augmentation because augmentation can increase the diversity of data and simulate different situations [25, 26]. Before training, several computer vision methods and calculations were utilized on the model inputs, i.e., data augmentation and normalization. For data augmentation, Fig. 1 briefly shows the change of images during the augmentation. Figure 1A is the original image, and Fig. 1B is the image after random horizontal and vertical flips on the original image (Fig. 1A) with a probability of 0.5. Figure 1C is a normal frame modified with gamma contrast uniformly sampled from 0.5 to 1.5. The gamma contrast utilizes a formula listed as below:
Fig. 1.

Sample images of an embryo with data augmentation under time-lapse video images. Random horizontal and vertical flips on original image (A) is implemented with probability 0.5 (B). If the inputs are normal frames (RGB), gamma contrasts are utilized, as the contrast of images was modified with gamma (γ) uniformly sampled from 0.5 to 1.5 (C). At last, images or flows are randomly rotated up to 30°, and then shifted within 20% of image width horizontally and height vertically, respectively (D)
output pixel = (pixel/255)γ
Lastly, the images or flows were randomly rotated up to 30°, and then shifted within 20% of the image width horizontally and height vertically, respectively (Fig. 1D).
For the calculation of optical flow, TV-L1 algorithm was utilized [27]. For the normalization part, pixel values of the normal frames were rescaled to (−1, 1), and values of the optical flow were clipped within (−20, 20) then rescaled to (−1, 1).
Figure 2 summarizes the process mentioned above. Our input models are RGB I3D and Optical flow I3D. For the RGB I3D model, since time-lapse videos are gray-scale videos, we broadcast gray-scale data to three channels (red, green, and blue (RGB)) in order to adapt to the input of a pre-trained RGB I3D model. Different from RGB I3D, optical flow is a vector. The color’s intensity is used for expressing the calculated result of optical flow: The depth of the red represents the vector of optical flow. Figure 3 also shows that our raw time-lapse video has been fed by two different I3D models: RGB and optical flow. After averaging the predictions of RGB I3D and Optical flow I3D, the model predicts the ploidy status as group 1 (aneuploidy) and group 2 (euploidy and mosaicism).
Fig. 2.

The flow chart of the overall process. Exporting time-lapse video from TLS, and obtain metadata such as PGT-A results. The study extracts frames approximately every 0.5 hpi and starts to calculate optical flow. Later, we split data randomly into a training set (80%) and a testing set (20%). The data augmentation is done by random flipping input images horizontally and vertically, following with contrast adjustment if the input was a RGB format, also combined with some rotation and shifting. After the previous steps have been completed and ready, the model training begins: fine tune on two-stream I3D pre-trained on ImageNet and Kinetics. Last, we evaluated our model performance on AUC and the distribution of prediction. The TLS represents time-lapse
Fig. 3.

The I3D model process map. Our input models are RGB I3D and Optical flow I3D. For the RGB I3D model, since time-lapse videos are gray-scale videos, we broadcast gray-scale data to three channels (red, green, and blue (RGB)) in order to adapt to the input of a pre-trained RGB I3D model. Different from RGB I3D, optical flow is a vector. The color’s intensity is used for expressing the calculated result of optical flow. The depth of the red represents the vector of optical flow. Figure 3 shows that our raw time-lapse video has been fed by two different I3D models: RGB and optical flow. After averaging the predictions of RGB I3D and Optical flow I3D, the model predicts the ploidy status as group 1 (aneuploidy) and group 2 (euploidy and mosaicism)
Model evaluation
The dataset was split randomly into a training set (80% of videos) and a test set (20% of videos) to examine the model’s performance. The performance was measured by the AUC, and we also observed the probability distribution of the different models. We evaluated the various settings of the different model inputs, including the RGB (normal frames) and the optical flow (motion features), and the time partitions, consisting of day 1, day 1 to 3, and day 1 to 5. The working flow is characterized as shown in Fig. 2.
Results
A total of 690 embryo videos were included in this study, with all of them having been developed into expanded blastocysts. Trophectoderm biopsy was performed on day 5 or day 6 for hr-NGS-based PGT-A, and the blastocysts were classified as group 1 (aneuploidy) and group 2 (euploidy and mosaicism). In Table 3, time-lapse videos were divided into 3-time partitions: day 1, day 1 to 3, and day 1 to 5. Besides the different time partitions, we also validated both the RGB images followed by the optical flow and with the additional fused result from the RGB and optical flow. Our AUC result appeared that neither the RGB nor the optical flow showed a promising result in any of the time partitions selected. However, while we did an average fusion on the predictions of the RGB and optical flow models, the AUC result was improved to 0.74. Figure 4 shows the ROC of the model training on day 1 to 5 dataset in detail. The curve with the fused predictions was overall on the top-left side of the other curves, meaning that both the true-positive rates and false-positive rates were mostly better than those of other predictions. Therefore, the fused predictions were favorable than the other ones under almost all thresholds.
Table 3.
AUC over different time partitions
| Time partition | Day 1 | Day 1 to day 3 | Day 1 to day 5 |
|---|---|---|---|
| RGB | 0.57 | 0.59 | 0.66 |
| Optical flow | 0.58 | 0.62 | 0.67 |
| Fused | 0.58 | 0.63 | 0.74 |
Fig. 4.
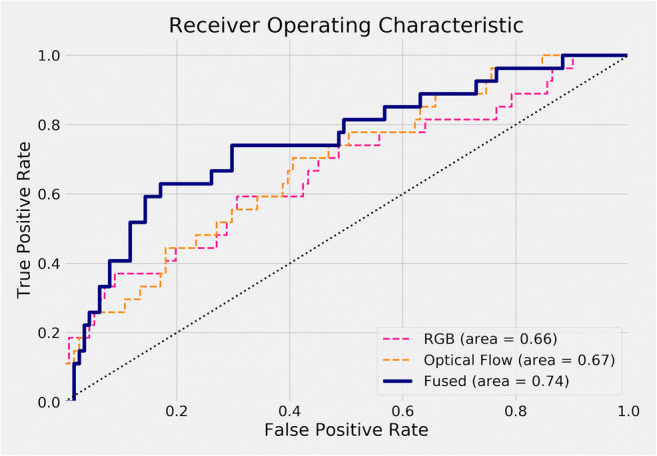
ROC curve of all models on time partition days 1 to 5. The curve with fused predictions is overall on the top-left side of other curves, meaning that both true-positive rates and false-positive rates are mostly better than others. Therefore, fused predictions are better than other ones under almost all thresholds
Figure 5 is the confusion matrix with considering group 2 as positive, showing false-positive rate: 0.666 (18/27), and false-negative rate: 0.072 (8/111). Such a result may be due to the fewer samples size of group 1, compared with that of group 2. In order to clarify such a result, we use another analyzing approach as follows.
Fig. 5.
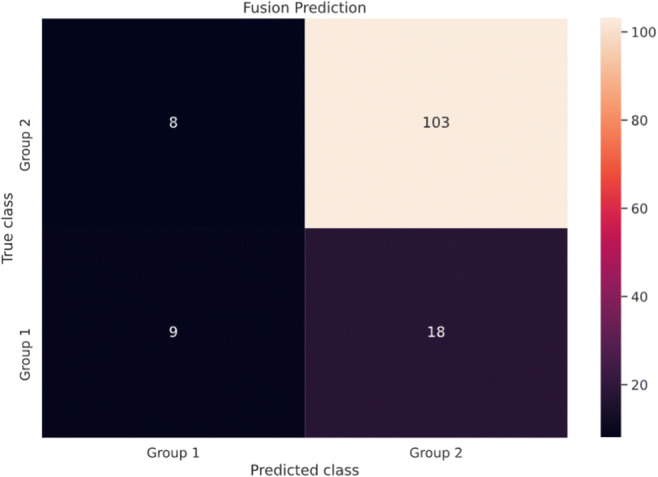
Confusion matrix of fused model on time partition day 1 to day 5. Figure 5 shows the performance of the testing set, though the confusion matrix showed false-positive rate: 0.072 (8/111), false-negative rate: 0.666 (18/27), positive predictive value (PPV, precision): 0.529 (9/17), and recall sensitivity: 0.333 (9/27). Considering aneuploidy as positive, such a result may be due to the few samples of group 1, compared with that of group 2. The result can be adjusted through changing the threshold to 0.3: AUC = 0.751, PPV = 0.436, recall = 0.63, false-positive rate = 0.198, and false-negative rate = 0.37
The prediction distribution of each model is shown in Fig. 6. Although the difference was unclear between groups 1 and 2 in the RGB and optical flow model, the distribution of group 1 was more compact than other models in the fused model.
Fig. 6.
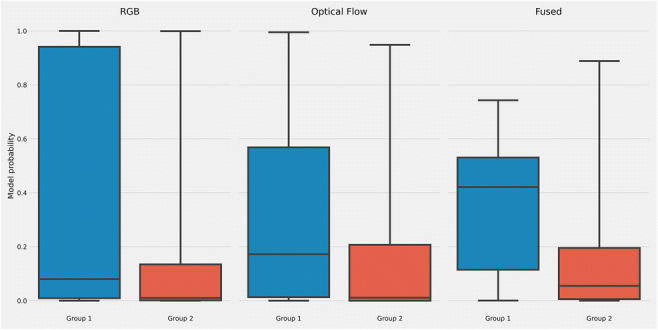
Boxplot of different models prediction on days 1 to 5. Although the difference was unclear between groups 1 and 2 in the RGB and optical flow model, the distribution of group 1 was more compact than other models in the fused model
Figure 7 shows calibration performance of model predictions, with X-axis range of sorted predictive values split by quartiles, and Y-axis actual probabilities of aneuploid occurrence. Except for the RGB model, probabilities of optical flow and fused model increased monotonically, meaning that those models were more robust. The calibration of the optical flow model was slightly better than the fused model in the quartile view, yet the fused model had a huge improvement in the AUC metric. Figure 8 shows that the majority of predicted confidence scores of group 1 have fallen between 0.3 and 0.8. Those less than and equal to 0.5 are classified as group 2 mistakenly. Those fallen above 0.5 are classified as group 1 in the threshold of 0.5. Our model had better performance in distinguishing group 2 since 75% of group 2 have been correctly identified with a strong confidence score (> 0.8). The result may be caused by the relatively small sample size of group 1 (n = 157, 22.75%), compared with group 2 (n = 533, 77.25%). There are several solutions for such limitations: first, balancing and expanding datasets in ploidy status. We can also seek for distinguished special features of morphokinetic or morphology from time-lapse videos. Alternatively, there is a need to develop deep learning algorithms optimized in time-lapse videos of embryos. Thus, our current approach was to prove the concept of using time-lapse images to deselect aneuploidy blastocysts.
Fig. 7.
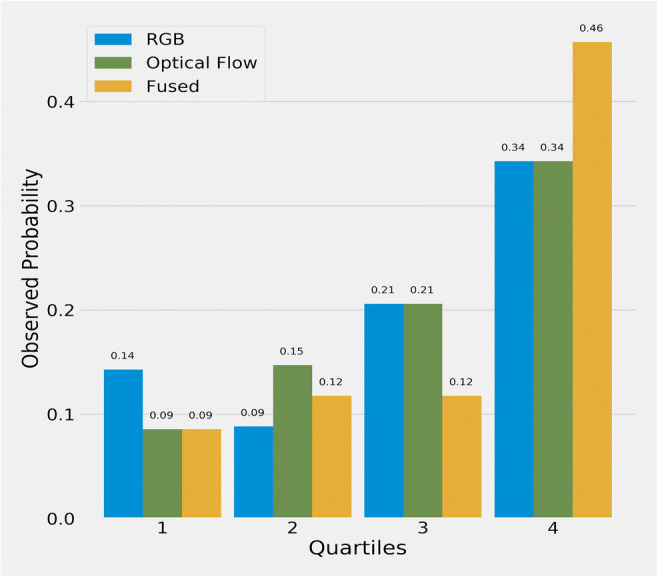
Observed average probability for each quartile on days 1 to 5. The X-axis represents ranges of sorted predictive values split by quartiles, and the Y-axis shows actual probabilities of aneuploid occurrence
Fig. 8.

Confidence score histogram of fused model. Figure 8 shows the majority of confidence scores of predictions were fallen between 0.3 and 0.5. Those less than 0.5 is classified as group 1. Those fallen above 0.5 is classified as group 2. Using a threshold of confidence score at 0.5, group 2 appears to have a better performance with 75% of the sub-set having been correctly identified with a strong confidence score (> 0.8)
Discussion
Videos provided from the time-lapse incubator have satisfied the need to better understand the continuous embryo development within an incubator. However, with a large amount of images to annotate and process, in addition to the labeling stages, finding useful and meaningful information from time-lapse images has been quite challenging as well.
Studies about relationships of ploidy status with time-lapse images in recent decades have different conclusions [9, 13, 14]. As deep learning has been booming in recent years, many consider it could play an essential role in large data management in the clinical ART application. Recent time-lapse studies related to machine learning were mostly focused on embryo assessment [28], selection for implantation capability, and improvement of clinical outcomes, e.g., pregnancy and live birth rates [18, 29]. In other words, deep learning has been used for predictions of positive outcomes.
Our deep learning approach toward time-lapse images is unique among recent related studies in two aspects: First, recent approaches that involved time-lapse and deep learning mostly used single time frames [17–19]. Second, although there have been studies investigating post-insemination up to day 5 or day 6, the analysis objects used were morphokinetic parameters rather than images [9, 14]. With video images collected from the beginning to the end of embryo development under time-lapse microscopy, our approach includes 144,210 images from 209 time frames per embryo, a wider pool of data.
There are three main findings in the current study: First, both the RGB’s and the optical flow’s performance in the AUC fell between 0.54 and 0.67. Second, the optical flow appeared to have a slightly better performance than the RGB. Last, it was foreseeable that the time frame of days 1 to 5 showed a higher AUC than the others. Based on these initial findings, we identified a direction to optimize this model by fusing the RGB and optical flow by calculating the averaged data. The fused AUC result, 0.74, appeared to be much higher than both performances in the days 1 to 5 time frame. Due to the other time frames that had relatively poor performances, we only fused the days 1 to 3 and days 1 to 5, and found that the performance of the days 1 to 5 was significantly higher. The AUC at 0.74 presented in this study is considered an excellent indicator as previous studies showed AUC at 0.56, 0.63, and 0.72 [9, 11, 15]. In the beginning, we design a series of parameters for our study, in which blastocyst morphology, morphogenetic, and KIDSCORE were included, and AUC appeared as 0.53–0.61 in blastocyst morphology, 0.5–0.56 in morphokinetics, and 0.48–0.58 in KIDSCORE. Those AUC results appeared relatively low compared with time-lapse video fusion, which AUC was 0.74.
Therefore, based on the AUC results, utilizing time-lapse images without human interpretation to clinical application was selected as the best option in our current study. We then decided to focus on the raw time-lapse video alone.
In addition, the study’s original intention is to provide aneuploidy prediction for clinical usage. Such research design of placing aneuploidy as group 1 (n = 157, 22.75%) and euploidy and mosaicism as group 2 (n = 533, 77.25%) had led to an unbalanced data set. However, we did make a similar attempt of dividing different ploidy statuses from 690 time-lapse videos, and the result does not show superiority to the current results, which might be related to the limitations of our current sample size.
Since mosaic embryos detected through PGT-A are mostly biopsied during day 5 or day 6, such early testing may not include further propagation or apoptotic from both euploid and aneuploidy cell lines, which may lead to different clinical outcomes [30]. In addition, recent studies have pointed out the potential self-correction within the mosaic embryo [30, 31]. Therefore, we assigned mosaic embryos along with euploid embryos in this study. Advantages of deep learning methodology include the relatively easy localized implementation into each clinic, as well as on-site information with a quick turn-around time compared to PGT-A workflow. In addition, its deselection capability has potential in easing the financial burden for patients by reducing the number of embryos required for biopsy.
Our approach suggested that raw time-lapse videos have the potential of providing additional reference in clinical usages such as blastocyst selection for biopsies and implantations. The algorithm can be fully integrated into the software system as electronic medical record (EMR) system that includes time-lapse image integration, or by uploading images to website platforms, as described in literature [32] and our current work in integration with an in-house EMR system for embryo selection/deselection in daily practice.
The limitations of our approach are as follows: first, limited sample size. This study is an extension study from our previous research [20]. The setups of exclusion criteria are based on selecting embryos which have minimal maternal effect; therefore, we excluded those with AMH ≤ 1.1 ng/mL, advanced age group (> 38 years old). This led to our ploidy results as euploidy 258 vs. mosaic 275 vs. aneuploid 157. We made several attempts in predicting different subgroups as (A) aneuploidy and euploidy; and (B) aneuploidy, mosaicism, and euploidy; both A and B show relatively low accuracy, compared with our original setups as deselecting aneuploid blastocysts based on clinical needs. This may also be caused by similar morphokinetic results between euploid and mosaic embryos according to our previous study [20]; in other words, it is possible that both statuses cannot be differentiated by raw time-lapse video images alone. In addition, according to our previous study, mosaic blastocyst has the potential of pregnancy and healthy live births [31, 33]. Since the data in our current study was obtained by a single center, our future direction is to expand our sample size by collecting more PGT-A blastocyst data through multiple IVF centers, in order to provide heterogeneousness of morphokinetic and morphology features, which may improve the performance of the deep learning models.
Second, the 690 embryos are all biopsiable blastocysts; such setting may also lead to bias to the study. However, in our study, we would like to focus on embryos considered biopsiable [20], which can hardly be distinguished through traditional morphology grading. Since such bias may affect the prediction of the model, we use the metric of AUC, which is relatively insensitive for the unbalanced dataset. For the unbalanced data set, we select other analyses: Figure 6 shows a boxplot of different models’ prediction on days 1 to 5, Fig. 7 shows the observed average probability for each quartile on days 1 to 5, and Fig. 8 shows the confidence scores of group 1 and group 2 to support the prediction of ploidy status through raw time-lapse videos.
Third, the present study is retrospective and future prospective research would help us to identify and explore more parameters to improve our model performance. Last, but not least, the group 1 and group 2 approach provided a deselection of aneuploidy embryos, while future deep learning approaches toward high mosaicism, low mosaicism, and euploidy will be needed, in order to provide a better clinical application. We strongly recommend that patients follow suggestions from physicians for advanced medical examinations if needed, for our deep learning model’s role is to provide assistance in deselecting aneuploidy blastocysts as a non-invasive tool.
Conclusions
The approach of our deep learning model demonstrated a potential in discriminating between test sets of aneuploid and euploid/mosaic embryos. As a proof of concept, this model may serve as an auxiliary tool, and with further studies contribute to the long-term goal of providing non-invasive and quick turn-around replacement for PGT-A.
Declarations
Conflict of interest
M.L. is co-owners of Binflux, a company created to develop Infans EMR, a laboratory information management system for fertility centers, as well as other artificial intelligence technologies designed for reproductive medicine.
Footnotes
Chun-I Lee and Yan-Ru Su are co-first authors.
Publisher’s note
Springer Nature remains neutral with regard to jurisdictional claims in published maps and institutional affiliations.
References
- 1.Gardner DK, Meseguer M, Rubio C, Treff NR. Diagnosis of human preimplantation embryo viability. Hum Reprod Update. 2015;21(6):727–747. doi: 10.1093/humupd/dmu064. [DOI] [PubMed] [Google Scholar]
- 2.Lu L, Lv B, Huang K, Xue Z, Zhu X, Fan G. Recent advances in preimplantation genetic diagnosis and screening. J Assist Reprod Genet. 2016;33(9):1129–1134. doi: 10.1007/s10815-016-0750-0. [DOI] [PMC free article] [PubMed] [Google Scholar]
- 3.Ho JR, Arrach N, Rhodes-Long K, Ahmady A, Ingles S, Chung K, Bendikson KA, Paulson RJ, McGinnis LK. Pushing the limits of detection: investigation of cell-free DNA for aneuploidy screening in embryos. Fertil Steril. 2018;110(3):467–475.e2. doi: 10.1016/j.fertnstert.2018.03.036. [DOI] [PubMed] [Google Scholar]
- 4.Rubio C, Rienzi L, Navarro-Sánchez L, Cimadomo D, García-Pascual CM, Albricci L, Soscia D, Valbuena D, Capalbo A, Ubaldi F, Simón C. Embryonic cell-free DNA versus trophectoderm biopsy for aneuploidy testing: concordance rate and clinical implications. Fertil Steril. 2019;112(3):510–519. doi: 10.1016/j.fertnstert.2019.04.038. [DOI] [PubMed] [Google Scholar]
- 5.Brouillet S, Martinez G, Coutton C, Hamamah S. Is cell-free DNA in spent embryo culture medium an alternative to embryo biopsy for preimplantation genetic testing? A systematic review. Reprod BioMed Online. 2020;40(6):779–796. doi: 10.1016/j.rbmo.2020.02.002. [DOI] [PubMed] [Google Scholar]
- 6.Greco E, Litwicka K, Minasi MG, Cursio E, Greco PF, Barillari P. Preimplantation genetic testing: where we are today. Int J Mol Sci. 2020;21(12):4381. doi: 10.3390/ijms21124381. [DOI] [PMC free article] [PubMed] [Google Scholar]
- 7.Alfarawati S, Fragouli E, Colls P, Stevens J, Gutiérrez-Mateo C, Schoolcraft WB, Katz-Jaffe MG, Wells D. The relationship between blastocyst morphology, chromosomal abnormality, and embryo gender. Fertil Steril. 2011;95(2):520–524. doi: 10.1016/j.fertnstert.2010.04.003. [DOI] [PubMed] [Google Scholar]
- 8.de Savio Figueira RC, Setti AS, Braga DP, Iaconelli A, Jr, Borges E., Jr Blastocyst morphology holds clues concerning the chromosomal status of the embryo. Int J Fertil Steril. 2015;9(2):215–220. doi: 10.22074/ijfs.2015.4242. [DOI] [PMC free article] [PubMed] [Google Scholar]
- 9.Campbell A, Fishel S, Bowman N, Duffy S, Sedler M, Hickman CF. Modelling a risk classification of aneuploidy in human embryos using non-invasive morphokinetics. Reprod BioMed Online. 2013;26(5):477–485. doi: 10.1016/j.rbmo.2013.02.006. [DOI] [PubMed] [Google Scholar]
- 10.Minasi MG, Colasante A, Riccio T, Ruberti A, Casciani V, Scarselli F, Spinella F, Fiorentino F, Varricchio MT, Greco E. Correlation between aneuploidy, standard morphology evaluation and morphokinetic development in 1730 biopsied blastocysts: a consecutive case series study. Hum Reprod. 2016;31(10):2245–2254. doi: 10.1093/humrep/dew183. [DOI] [PubMed] [Google Scholar]
- 11.Basile N, Nogales Mdel C, Bronet F, Florensa M, Riqueiros M, Rodrigo L, García-Velasco J, Meseguer M. Increasing the probability of selecting chromosomally normal embryos by time-lapse morphokinetics analysis. Fertil Steril. 2014;101(3):699–704. doi: 10.1016/j.fertnstert.2013.12.005. [DOI] [PubMed] [Google Scholar]
- 12.Yang Z, Zhang J, Salem SA, Liu X, Kuang Y, Salem RD, Liu J. Selection of competent blastocysts for transfer by combining time-lapse monitoring and array CGH testing for patients undergoing preimplantation genetic screening: a prospective study with sibling oocytes. BMC Med Genet. 2014;7:38. doi: 10.1186/1755-8794-7-38. [DOI] [PMC free article] [PubMed] [Google Scholar]
- 13.Reignier A, Lammers J, Barriere P, Freour T. Can time-lapse parameters predict embryo ploidy? A systematic review. Reprod BioMed Online. 36(4):380–7. [DOI] [PubMed]
- 14.Kramer YG, Kofinas JD, Melzer K, Noyes N, McCaffrey C, Buldo-Licciardi J, McCulloh DH, Grifo JA. Assessing morphokinetic parameters via time lapse microscopy (TLM) to predict euploidy: are aneuploidy risk classification models universal? J Assist Reprod Genet. 2014;31(9):1231–1242. doi: 10.1007/s10815-014-0285-1. [DOI] [PMC free article] [PubMed] [Google Scholar]
- 15.Kim M, Yun J, Cho Y, Shin K, Jang R, Bae HJ, Kim N. Deep learning in medical imaging. Neurospine. 2019;16(4):657–668. doi: 10.14245/ns.1938396.198. [DOI] [PMC free article] [PubMed] [Google Scholar]
- 16.Tran D, Cooke S, Illingworth PJ, Gardner DK. Deep learning as a predictive tool for fetal heart pregnancy following time-lapse incubation and blastocyst transfer. Hum Reprod. 2019;34(6):1011–1018. doi: 10.1093/humrep/dez064. [DOI] [PMC free article] [PubMed] [Google Scholar]
- 17.Khosravi P, Kazemi E, Zhan Q, Malmsten JE, Toschi M, Zisimopoulos P, Sigaras A, Lavery S, Cooper LAD, Hickman C, Meseguer M, Rosenwaks Z, Elemento O, Zaninovic N, Hajirasouliha I. Deep learning enables robust assessment and selection of human blastocysts after in vitro fertilization. NPJ Digit Med. 2019;2:21. doi: 10.1038/s41746-019-0096-y. [DOI] [PMC free article] [PubMed] [Google Scholar]
- 18.Chavez-Badiola A, Flores-Saiffe-Farías A, Mendizabal-Ruiz G, Drakeley AJ, Cohen J. Embryo Ranking Intelligent Classification Algorithm (ERICA): artificial intelligence clinical assistant predicting embryo ploidy and implantation. Reprod BioMed Online. 2020;5:S1472–6483(20)30373-4. doi: 10.1016/j.rbmo.2020.07.003. [DOI] [PubMed] [Google Scholar]
- 19.Josue Barnes, Jonas Malmsten, Qiansheng Zhan, Iman Hajirasouliha, Olivier Elemento, Jose Sierra, Nikica Zaninovic, Zev Rosenwaks, Noninvasive detection of blastocyst ploidy (euploid vs. aneuploid) using artificial intelligence (AI) with deep learning methods. 2020; 114:e76 10.1016/j.fertnstert.2020.08.233
- 20.Lee CI, Chen CH, Huang CC, Cheng EH, Chen HH, Ho ST, Lin PY, Lee MS, Lee TH. Embryo morphokinetics is potentially associated with clinical outcomes of single-embryo transfers in preimplantation genetic testing for aneuploidy cycles. Reprod BioMed Online. 2019;39(4):569–579. doi: 10.1016/j.rbmo.2019.05.020. [DOI] [PubMed] [Google Scholar]
- 21.Chen HH, Huang CC, Cheng EH, Lee TH, Chien LF, Lee MS. Optimal timing of blastocyst vitrification after trophectoderm biopsy for preimplantation genetic screening. PLoS One. 2017;12(10):e0185747. doi: 10.1371/journal.pone.0185747. [DOI] [PMC free article] [PubMed] [Google Scholar]
- 22.Gardner DK, Lane M, Stevens J, Schlenker T, Schoolcraft WB. Blastocyst score affects implantation and pregnancy outcome: towards a single blastocyst transfer. Fertil Steril. 2000;73(6):1155–1158. doi: 10.1016/s0015-0282(00)00518-5. [DOI] [PubMed] [Google Scholar]
- 23.Carreira J, Zisserman A (2017). Quo vadis, action recognition? A new model and the kinetics dataset. In Proceedings of the IEEE Conference on Computer Vision and Pattern Recognition (pp. 6299-6308)
- 24.Loshchilov I, Hutter F (2016). Sgdr: stochastic gradient descent with warm restarts. arXiv preprint arXiv:1608.03983
- 25.Shorten C, Khoshgoftaar TM. A survey on image data augmentation for deep learning. J Big Data. 2019;6:60. doi: 10.1186/s40537-019-0197-0. [DOI] [PMC free article] [PubMed] [Google Scholar]
- 26.Taylor L, Nitschke G. Improving deep learning with generic data augmentation, 2018 IEEE Symposium Series on Computational Intelligence (SSCI) India: Bangalore; 2018. pp. 1542–1547. [Google Scholar]
- 27.Zach C, Pock T, Bischof H. A duality based approach for real time TV-L1 optical flow: Pattern Recognition; 2007. p. 214–23.
- 28.Chen T-J, Zheng W-L, Liu C-H, Huang I, Lai H-H, Liu M. Using deep learning with large dataset of microscope images to develop an automated embryo grading system. Fertility & Reproduction. 2019;01(01):51–56. doi: 10.1142/S2661318219500051. [DOI] [Google Scholar]
- 29.Raudonis V, Paulauskaite-Taraseviciene A, Sutiene K, Jonaitis D. Towards the automation of early-stage human embryo development detection. Biomed Eng Online. 2019;18(1):120. doi: 10.1186/s12938-019-0738-y. [DOI] [PMC free article] [PubMed] [Google Scholar]
- 30.Esfandiari N, Bunnell ME, Casper RF. Human embryo mosaicism: did we drop the ball on chromosomal testing? J Assist Reprod Genet. 2016;33(11):1439–1444. doi: 10.1007/s10815-016-0797-y. [DOI] [PMC free article] [PubMed] [Google Scholar]
- 31.Lin PY, Lee CI, Cheng EH, Huang CC, Lee TH, Shih HH, Pai YP, Chen YC, Lee MS. Clinical outcomes of single mosaic embryo transfer: high-level or low-level mosaic embryo, does it matter? J Clin Med. 2020;9(6):1695. doi: 10.3390/jcm9061695. [DOI] [PMC free article] [PubMed] [Google Scholar]
- 32.VerMilyea M, Hall JMM, Diakiw S, Johnston A, Nguyen T Dakka MA, Lim A, Quangkananurug W, Perugini D, Murphy AP, Perugini M. Camera-agnostic self-annotating artificial intelligence (AI) system for blastocyst evaluation, [Abstract].ESHRE Virtual 36th Annual Meeting, July 7, 2020
- 33.Lee CI, Cheng EH, Lee MS, Lin PY, Chen YC, Chen CH, Huang LS, Huang CC, Lee TH. Healthy live births from transfer of low-mosaicism embryos after preimplantation genetic testing for aneuploidy. J Assist Reprod Genet. 2020;37(9):2305–2313. doi: 10.1007/s10815-020-01876-6. [DOI] [PMC free article] [PubMed] [Google Scholar]