

Abstract
The myotendinous junction is a highly interdigitated interface designed to transfer muscle-generated force to tendon. Understanding how this interface is formed and organized, as well as identifying tendon- and muscle-specific extracellular matrix (ECM), is critical for designing effective regenerative therapies to restore functionality to damaged muscle–tendon units. However, a comparative analysis of the ECM proteome across this interface has not been conducted. The goal of this study was to resolve the distribution of ECM proteins that are uniformly expressed as well as those specific to each of the muscle, tendon, and junction tissues. The soleus muscles from 5-month-old wild-type C57BL/6 mice were harvested and dissected into the central muscle (M) away from tendon, the junction between muscle and tendon (J) and the tendon (T). Tissues were processed by either homogenizing in guanidine hydrochloride or fractionating to isolate the ECM from more soluble intracellular components and then analyzed using liquid chromatography—tandem mass spectrometry. Overall, we found that both tissue processing methods generated similar ECM profiles. Many ECM were found across the muscle–tendon unit, including type I collagen and associated fibril-regulating proteins. The ECM identified exclusively in M were primarily related to the basal lamina, whereas those specific to T and J tissue included thrombospondins and other matricellular ECM. Type XXII collagen (COL22A1) was restricted to J, and we identified COL5A3 as a potential marker of the muscle–tendon interface. Immunohistochemical analysis of key proteins confirmed the restriction of some basal lamina proteins to M, tenascin-C to T, and COL22A1 to J. COL5A3, PRELP, and POSTN were visualized in the tissue surrounding the junction, suggesting that these proteins play a role in stabilizing the interface. This comparative map provides a guide for tissue-specific ECM that can facilitate the spatial visualization of M, J, and T tissues and inform musculoskeletal regenerative therapies.
Keywords: mass spectrometry, mouse, matrisome, muscle, tendon
INTRODUCTION
Skeletal muscle is composed of large multinuclear myofibers that, along with mononuclear satellite cells, are enclosed within a mesh-like extracellular matrix (ECM), the basal lamina.1 Force generated by the myofibers is transmitted through the basal lamina, comprising laminin-211, type IV collagen, and nidogens, to the surrounding type I collagen fibers via the reticular lamina that includes type VI collagen.1,2 Type I collagen fibers are the basis of the intramuscular connective tissue that surrounds individual muscle fibers, fascicles, and entire muscles (i.e., endomysium, perimysium, and epimysium) and forms a continuum with the tendon.2 Capillaries, nerves, and other supporting cells reside between the myofibers within the interstitial space filled with hyaluronic acid, fibronectin, and assorted proteoglycans.3,4 Muscle-generated force is transferred to the skeleton through tendons, which have a significantly different ECM organization. Adult tendons are relatively acellular, predominantly composed of parallel type I collagen fibers embedded within a proteoglycan- and glycosaminoglycan-rich matrix.5 Tendon cells are arranged in one-dimensional (1D) arrays, surrounded by a pericellular matrix composed of type VI collagen, perlecan, fibrillins, and versican, which separates the cell bodies from bundles of type I collagen fibers.6 In addition, hyaluronic acid, fibronectin, and tenascin-C (TNC) are prevalent within the interfibrillar space, acting to maintain tissue hydration, ECM assembly, and mechanical integrity. 7–9
Linking these two disparate tissues, the myotendinous junction is a highly interdigitated interface that seamlessly transfers muscle-generated forces to the tendon. It is hypothesized that the ECM is continuous across this interface, facilitating the integration of these tissues. Indeed, there are common ECM proteins reported to be in both muscle and tendon (e.g., type I collagen, fibronectin, and perlecan);1,2,10 however, there are also thought to be distinct differences (e.g., laminin-211 in skeletal muscle; versican in tendon).1,11 Understanding the composition and organization of the interface is critical for designing effective regenerative therapies that seek to restore functionality to damaged muscle–tendon units. Furthermore, identification of tissue-specific markers will greatly facilitate the visualization of musculoskeletal tissues via immunohistochemistry (IHC). Nevertheless, how the ECM varies across the myotendinous junction, and the relative amounts in tendon and muscle, is unclear.
The dearth of information on ECM protein, or matrisome, composition, and turnover rate can be attributed to the insoluble, interpenetrating networks into which the components are assembled. Researchers have begun to address this gap in knowledge by combining decellularization techniques, to enrich for ECM proteins, with mass spectrometric analysis of enzyme-digested peptide fragments.12–15 Liquid chromatography–tandem mass spectrometry (LC–MS/MS) enables the identification of specific proteins in a complex sample by mapping the measured peptide masses to a database of known peptide fragmentation patterns. Annotation of ECM-related proteins has been greatly facilitated by the matrisome database of common research organisms, established by the Hynes laboratory.14 Previous studies utilized LC–MS/MS to identify the individual proteomic composition of muscle,16–24 tendon, 25–32 and the myotendinous junction;33 however, only one of the skeletal muscle studies focused primarily on the ECM component.16 Furthermore, the use of different tissue processing and LC–MS/MS methodologies among individual studies makes it difficult to produce a clear map of the ECM in the muscle–tendon unit. Therefore, the goal of this study was to resolve the distribution of ECM proteins found across the interface or specific to each of the muscle, tendon, and junction tissues by analyzing the murine soleus muscle and comparing two different tissue processing techniques.
MATERIALS AND METHODS
All reagents were of chemical grade from Sigma-Aldrich unless otherwise specified, and buffers were made with HPLC-grade water.
Animal Models
Animals used in these studies were derived from wild-type C57BL/6 mice (Mus musculus) obtained from The Jackson Laboratory. All experimental protocols were performed in compliance with guidelines established, and all methods were approved by Purdue Animal Care and Use Committee (PACUC, protocols# 1209000723 and 1801001682). PACUC requires that all animal programs, procedures, and facilities at Purdue University to abide by the policies, recommendations, guidelines, and regulations of the USDA and the United States Public Health Service, in accordance with the Animal Welfare Act and Purdue’s Animal Welfare Assurance.
Muscle, Myotendinous Junction, and Tendon Tissue Collection
Five month-old male mice were euthanized via CO2 inhalation, followed by cervical dislocation. The soleus muscle, including the proximal and distal (Achilles) tendons, was harvested from both hindlimbs and placed in ice-cold PBS. Muscle (M), tendon (T) and junction (J) samples were isolated (Figure 1A), where the distal and proximal tissues were combined for the T and J samples, and samples from both hindlimbs were pooled. Samples were snap frozen in liquid nitrogen and stored at −80 °C. Tissues from each mouse were considered to be a single biological replicate, and pooled samples from n = 3 mice were analyzed.
Figure 1.

Experimental workflow. (A) Regions of muscle (M), junction (J), and tendon (T) of 5 month-old murine soleus isolated for ECM proteomic analysis. Scale bar = 2 mm. (B,C) Steps for guanidine HCl (GuHCl; B) and tissue fractionation (C). See the Materials and Methods section for definition of abbreviations.
Processing Tissues for LC–MS/MS Analysis
GuHCl Extraction.
Proteins from M, J, and T samples were extracted following34 using 750 μL guanidine hydrochloride buffer (GuHCl buffer: 4 M guanidine HCl, 50 mM sodium acetate, 100 mM N-ethylmaleimide, pH 5.8) using a glass tissue homogenizer (Ace Glass, Vineland, NJ) and incubated overnight at 4 °C with constant rocking (Figure 1B). Samples were reduced with dithiothreitol (DTT; 4 mM final concentration) for 1 h with constant agitation (1000 rpm; ThermoMixer F1.5, Thermo Fisher Scientific, Rockford, IL) and alkylated with iodoacetamide (IAA; 16 mM final concentration) for 30 min at room temperature (RT). Proteins were precipitated in ethanol (1:9 parts sample/EtOH) overnight at 4 °C and pelleted by centrifugation at 13,750g for 30 min (Avanti J-25 Centrifuge, Beckman, Pasadena, CA). Pellets were washed with an additional 4 mL of ice-cold ethanol for 4 h at 4 °C with constant rocking followed by centrifugation. Protein extracts were resuspended in 500 μL of digestion buffer [100 mM Tris base, 2 mM calcium chloride, 10% acetonitrile (ACN), pH 8.0], followed by reduction and alkylation steps, as described above. Two enzymatic digestion steps were performed with MS-grade trypsin (Thermo Fisher Scientific), overnight and an additional 2 h (3 μg/500 μL and 1.5 μg/500 μL, respectively), at 37 °C with constant agitation. Trypsin was inactivated with trifluoroacetic acid (TFA, 0.1%) after the second digestion. Peptides were cleaned using MicroSpin C-18 columns (The Nest Group, Southborough, MA) according to the manufacturer’s instructions. Briefly, columns were conditioned with 100 μL 100% ACN and equilibrated with 2 × 100 μL washes of 0.1% TFA. Peptides were loaded onto columns, washed with 2 × 100 μL volumes of 0.1% TFA, and eluted in 80% ACN/25 mM formic acid (FA). After elution, peptides were dried in a CentriVap vacuum concentrator (Labconco, Kansas City, MO) and resuspended in 10 μL of 3% ACN/0.1% FA. Peptide concentrations were measured using the Pierce Quantitative Colorimetric Peptide Assay (Thermo Fisher Scientific) and normalized to 0.5 μg/μL with 3% ACN/0.1% FA.
Fractionation of M, J, and T Tissues.
Tissues were fractionated as previously described with the following modifications (ref 35; Figure 1C). Briefly, M, J, and T tissues were homogenized on ice in 500 μL of C buffer (Table S3) using a glass homogenizer. Samples were rotated end-over-end at 4 °C for 30 min, followed by centrifugation (Thermo Fisher Scientific) for 20 min at 16,000g. The resulting pellets were resuspended in 400 μL of ice-cold W buffer, incubated on ice for 5 min, and centrifuged for 20 min at 16,000g. Pellets were subjected to two extractions in 50 μL of N buffer each for 30 min and followed by centrifugation for 20 min at 16,000g. Additional protein extraction was performed with 50 μL of Mem buffer at 4 °C with end-over-end rotation for 20 min then centrifuged for 20 min at 16,000g. Finally, pellets were resuspended and rocked in 25 μL of CS buffer at RT for 20 min, centrifuged for 20 min at 16,000g, and supernatants were collected (CS fraction). CS fractions and the remaining insoluble pellets were snap frozen and stored at −80 °C.
CS fractions were diluted two-fold with 25 μL of digestion buffer (8 M urea/100 mM ammonium bicarbonate), and insoluble pellets were suspended with 50 μL of digestion buffer. Samples were reduced for 2 h at 37 °C with 10 mM DTT and then alkylated for 30 min at RT with 25 mM IAA. Urea was diluted to 2 M with 100 mM ammonium bicarbonate, and proteins were deglycosylated with 0.1 U chondroitinase ABC for 2 h at 37 °C. Proteins were digested at 37 °C with constant agitation (1000 rpm) with endoproteinase LysC (1 μg/200 μL; New England Biolabs, Ipswich, MA) for 2 h, MS-grade trypsin (3 μg/200 μL) overnight, and another MS-grade trypsin (1.5 μg/200 μL) for an additional 2 h. Protease enzymes were inactivated with 0.1% TFA. Samples were cleaned of detergent and salt contamination with Pierce Detergent Removal Spin Columns (Thermo Fisher Scientific) as per the manufacturer’s protocol and C-18 Microspin columns, respectively, as described above. Peptides were dried and resuspended in 3% ACN/0.1% FA, and concentrations measured, as described above. CS and insoluble peptide concentrations were normalized to 0.2 and 1 μg/μL, respectively, with 3% ACN/0.1% FA.
LC–MS/MS Analysis.
Samples were analyzed using the Dionex UltiMate 3000 RSLC Nano System coupled to the Q Exactive HF Hybrid Quadrupole-Orbitrap Mass Spectrometer (Thermo Fisher Scientific). Following digestion and clean up, 1 μg of peptide was loaded onto a 300 μm i.d. × 5 mm C18 PepMap 100 trap column and washed for 5 min using 98% purified water/2% ACN/0.01% FA at a flow rate of 5 μL/min. After washing, the trap column was switched in-line with a 75 μm × 50 cm reverse phase Acclaim C18 PepMap 100 analytical column heated to 50 °C. Peptides were separated using a 120 min gradient elution method at a flow rate of 300 nL/min. Mobile phase A consisted of 0.01% FA in water, while mobile phase B consisted of 0.01% FA in 80% ACN. The linear gradient started at 2% B and reached 10% B in 5 min, 30% B in 80 min, 45% B in 91 min, and 100% B in 93 min. The column was held at 100% B for the next 5 min before being brought back to 2% B and held for 20 min. Samples were injected into the QE HF through the Nanospray Flex Ion Source fitted with an emission tip (New Objective, Woburn, MA). The Q ExactiveHF was operated with survey scans between m/z 400–1600 acquired at a mass resolution of 120,000 after accumulation of ions to a 5 × 10⁶ target value, based on automatic gain control values from the previous full scan. The 20 most intense precursor ions with charge states between 2+ and 6+ were selected for MS/MS with an isolation window of 1.2 m/z units. Peptides were fragmented using a normalized collision energy of 27 at a mass resolution of 15,000, with a maximum injection time of 100 ms. Dynamic exclusion of m/z values to prevent repeated fragmentation of the same peptide was used with an exclusion time of 15 s.
Raw files were processed by MaxQuant (ref 36, version 1.6.1.0). Default settings were used unless otherwise noted (Table S6). Peak lists were searched against the M. musculus Uniprot FASTA database (November 2018, 53,803 proteins total). Cysteine carbamidomethylation was included as a fixed modification, and the variable modifications included were oxidation of methionine, hydroxylysine, hydroxyproline, deamidation of asparagine, and conversion of glutamine to pyro-glutamic acid. Peptide and protein false discovery rates were set to 0.01 and determined by a reverse decoy database derived from the M. musculus database. Proteins that were labeled as potential contaminants or reverse hits were filtered from the data set. In addition, proteins from epidermal contamination (i.e., hornerin, filaggrin, and filaggrin-2) were also removed. Furthermore, proteins that were identified by one unique and razor peptide or were only found in one biological replicate of a time point were removed prior to data analysis. Protein intensities were analyzed with Microsoft Excel (for filtering and data handling) and GraphPad Prism 8 (for data visualization). Raw data sets are available in the MassIVE repository under the accession number: MSV000085253.
Proteins were annotated as cytosolic, nuclear, membrane, cytoskeletal (CS), or matrisome based on a concise list of cellular compartments derived from The Matrisome Project14 and Gene Ontology (GO37) enrichment terms.35 Matrisome proteins were categorized further as collagens, proteoglycans, ECM glycoproteins, secreted factors, ECM regulators, or ECM-affiliated proteins (see Tables S1 and S4). Raw protein intensities were used to identify proteins in the M, J, and T samples, as well as calculate the percentage of raw intensity corresponding to the annotated cellular compartments and matrisome categories within each sample. The distribution of matrisome categories in M and T samples was used to estimate the theoretical combination of M and T tissues in the J samples. Using the GuHCl data, we estimated ∼88% M in J based on the distribution of the matrisome categories. Raw intensities from the M and T samples were combined into a theoretical J intensity value using a weighted average (80:20 or 90:10, M/T) between the tissues. The fold change between theoretical and measured J intensities was calculated and plotted against statistical significance in a volcano plot. For all other analyses, raw intensities were normalized such that the total summed intensity for each sample was equivalent and then log10 transformed. Pearson correlation coefficients were calculated between each sample and plotted as a heat map.
Immunohistochemistry.
The posterior compartment of the murine hindlimb from 5 month-old wild-type male mice was dissected, and the en bloc soleus muscle was harvested and embedded in optimal cutting temperature compound (Tissue Tek). Samples were frozen in dry ice-cooled isopentane and stored at −80 °C until sectioned. Using a Shandon FE Cryotome (Thermo Fisher Scientific), 10 μm thick sections were collected on charged slides and stored at −20 °C until stained.
IHC staining of sections was conducted at RT unless otherwise indicated and protected from light when fluorescently labeled secondary antibodies were used. After slides equilibrated to RT, sections were encircled with an ImmEdge pen (Vector Laboratories) and rehydrated in PBS for 10–15 min. The samples were fixed in 4% paraformaldehyde (Electron Microscopy Sciences) for 5 min, rinsed in PBS, permeabilized with PBST [0.1% Triton-X100 in PBS (Amresco)], then rinsed with PBS. Sections were either (A) blocked for 1 h with Ig blocking buffer from the Mouse on Mouse (M.O.M.) basic kit (Vector Laboratories) following manufacturer’s instructions, rinsed 3 × 2 min with PBS and blocked for 5 min with MOM basic kit protein diluent or (B) blocked for 30 min with blocking buffer [10% donkey serum (Lampire Biological Laboratories) in PBS with 0.2% bovine serum albumin (Sigma) 0.02% sodium azide (Sigma)]. Sections were incubated with primary antibodies overnight at 4 °C (see antibodies and concentrations in Table S7) in a solution of MOM protein diluent or blocking buffer, then washed for 3 × 2 min with PBS. For sections processed following (B), slides were blocked for 5 min in blocking buffer. Sections were incubated in a solution of secondary antibodies (Table S7) in a solution of MOM protein diluent or blocking buffer for 40–45 min and rinsed for 3 × 2 min with PBS. Sections were mounted with FluoromountG (Electron Microscopy Sciences) and coverslips and sealed using clear nail polish. Slides were stored at 4 °C until imaged with a Leica DMI6000 at 20× magnification. Negative controls consisted of the same processing with the exclusion of the primary antibodies. Images are representative for n = 3 biological replicates and were processed with FIJI and compiled using Adobe Photoshop.
RESULTS
To resolve differences in the ECM distribution across the muscle–tendon unit, the soleus muscles from 5 month-old wild-type C57BL/6 mice were harvested and dissected into three parts: the central muscle (M) away from tendon, the junction between muscle and tendon (J), and the tendon (T; Figure 1A). The soleus muscle was selected due to the ease of isolating tendon from the muscle as there is no aponeurosis, or extension of the tendon, into the muscle belly. Care was taken to trim away potential muscle contamination from the tendon segments and to cut the tendon away from the calcaneus to avoid harvesting any enthesis or bone tissue. Samples were homogenized in 4M GuHCl (Figure 1B), analyzed using LC–MS/MS, and the raw intensity of the proteins were determined using MaxQuant (Table S1).36
The amount of matrisome, based on raw intensity, was significantly different in the GuHCl homogenized M, J, and T samples, 1.8 ± 0.3, 13.8 ± 2.7, and 98.5 ± 0.1%, respectively (average ±S.D., n = 3 biological replicates; Figure 2A, Table S2).
Figure 2.

Distribution of proteins identified by LC–MS/MS. (A) Raw intensities of GuHCl homogenates and CS and insoluble fractions from the fractionation protocol were plotted as percent of raw intensity and tissue compartment. Tissue was harvested from 5 month-old murine soleus muscle–tendon units. M = muscle; J = junction; T = tendon; average of n = 3 biological replicates. Two-way ANOVA revealed that the effect of cellular compartments between tissues was significant (p < 0.0001). For Tukey’s multiple comparisons post hoc analysis comparing the effect of tissue on % raw intensity of cellular compartments, see Table S2. (B) Raw intensities of the matrisome compartment from (A) were divided into different ECM categories (see Table S1). Two-way ANOVA revealed that the effect of ECM category was significant between tissues (p < 0.0001). For Tukey’s multiple comparisons post hoc analysis comparing the effect of tissue on % raw intensity of ECM category, see Table S5.
In an attempt to increase the number of matrisome-related identities from M and J tissues, another set of soleus muscles were harvested and fractionated following ref 35 to isolate the ECM (Figure 1C). Using buffers of increasing stringency (Table S3), the more soluble intracellular proteins were extracted and the final two fractions, CS and insoluble, were analyzed using LC–MS/MS (Table S4). The coverage of ECM slightly increased for M and J tissues to 4.5 ± 2.4 and 17.9 ± 3.1%, respectively, and the amount of matrisome was still significantly different across all tissues (average ±S.D., n = 3 biological replicates; Figure 2A, Table S2).
The matrisome can be categorized into six different types of ECM proteins; collagens, proteoglycans, and glycoproteins are considered to be part of the “core matrisome,” whereas secreted factors, ECM-affiliated proteins, and ECM regulators are “matrisome-associated.”14 Collagens dominated the raw intensity of both extraction methods, being significantly more prevalent in T than M. Significantly more secreted factors were identified in M compared to J and T in the GuHCl homogenate (Figure 2B, Table S5). In addition, there were more glycoproteins and proteoglycans in the GuHCl homogenates and CS fractions of M compared with T (Figure 2B, Table S5). Components of the matrisome identified using either extraction method are summarized in Table 1.
Table 1.
Components of the Matrisome Found in M, J, and T Tissues via LC–MS/MS
| protein name | Uniprot ID | gene symbol | category | muscle | junction | tendon | M citations | J citations | T citations |
|---|---|---|---|---|---|---|---|---|---|
| ABI gene family member 3 (NESH) binding protein | B2RWZ0 | Abi3bp | glycoproteins | b | b | + | [38]b | ||
| angiopoietin-like 7 | Q8R1Q3 | Angptl7 | secreted factors | a | + | [39]b | [32] | ||
| annexin A1 | P10107 | Anxa1 | ECM-affiliated | a | a | [20] | [33] | [28] | |
| annexin A11 | P97384 | Anxa11 | ECM-affiliated | a | [20] | [30] | |||
| annexin A2 | P07356 | Anxa2 | ECM-affiliated | + | + | + | [20] | [33] | [30] |
| annexin A4 | P97429 | Anxa4 | ECM-affiliated | a | a | [19] | [29] | ||
| annexin A5 | P48036 | Anxa5 | ECM-affiliated | a | + | b | [20] | [33] | [30] |
| annexin A6 | P14824 | Anxa6 | ECM-affiliated | + | + | + | [20] | [33] | [30] |
| asporin | Q99MQ4 | Aspn | proteoglycans | + | + | + | [20] | [28] | |
| biglycan | P28653 | Bgn | proteoglycans | + | + | + | [20] | [33] | [28] |
| chondroadherin | O55226 | Chad | proteoglycans | b | + | [20] | [29] | ||
| cartilage intermediate layer protein 2 | D3Z7H8 | Cilp2 | glycoproteins | + | + | [40]b | [29] | ||
| C-type lectin domain family 3 member a | Q9EPW4 | Clec3a | ECM-affiliated | + | [27] | ||||
| tetranectin | P43025 | Clec3b | ECM-affiliated | b | [20] | [27] | |||
| collagen, type I, alpha 1 | P11087 | Col1a1 | collagens | + | + | + | [20] | [33] | [28] |
| collagen, type I, alpha 2 | Q01149 | Col1a2 | collagens | + | + | + | [20] | [33] | [28] |
| collagen, type II, alpha 1 | P28481 | Col2a1 | collagens | a | a | + | [16] | [28] | |
| collagen, type III, alpha 1 | P08121 | Col3a1 | collagens | + | + | + | [16] | [31] | |
| collagen, type IV, alpha 1 | P02463 | Col4a1 | collagens | + | + | a | [16] | [41]c | [25] |
| collagen, type IV, alpha 2 | P08122 | Col4a2 | collagens | + | + | + | [16] | [41]c | [25] |
| collagen, type V, alpha 1 | O88207 | Col5a1 | collagens | + | + | + | [16] | [25] | |
| collagen, type V, alpha 2 | Q3U962 | Col5a2 | collagens | + | + | + | [16] | [25] | |
| collagen, type V, alpha 3 | Q9JLI2 | Col5a3 | collagens | + | [19] | [25] | |||
| collagen, type VI, alpha 1 | Q04857 | Col6a1 | collagens | + | + | + | [16] | [33] | [31] |
| collagen, type VI, alpha 2 | Q02788 | Col6a2 | collagens | + | + | + | [16] | [33] | [31] |
| collagen, type VI, alpha 3 | E9PWQ3 | Col6a3 | collagens | + | + | + | [16] | [33] | [25] |
| collagen, type VI, alpha 6 | Q8C6K9 | Col6a6 | collagens | b | b | [42]c | |||
| collagen, type XI, alpha 1 | Q61245 | Col11a1 | collagens | + | + | + | [43]b | [31] | |
| collagen, type XI, alpha 2 | Q64739 | Col11a2 | collagens | a | a | + | [30] | ||
| collagen, type XII, alpha 1 | Q60847 | Col12a1 | collagens | + | + | [20] | [33] | [28] | |
| collagen, type XV, alpha 1 | O35206 | Col15a1 | collagens | + | + | + | [44] | [25] | |
| collagen, type XVI, alpha 1 | Q8BLX7 | Col16a1 | collagens | a | [39] | [28] | |||
| collagen, type XVIII, alpha 1 | P39061 | Col18a1 | collagens | b | [19] | [31] | |||
| collagen, type XXII, alpha 1 | E9Q7P1 | Col22a1 | collagens | + | [45] | [46]c | [31] | ||
| cartilage oligomeric matrix protein | Q9R0G6 | Comp | glycoproteins | + | + | [20] | [31] | ||
| cathepsin B | P10605 | Ctsb | ECM regulators | a | a | [18] | [32] | ||
| cathepsin D | P18242 | Ctsd | ECM regulators | a | a | [18] | [32] | ||
| decorin | P28654 | Dcn | proteoglycans | + | + | + | [18] | [28] | |
| dermatopontin | Q9QZZ6 | Dpt | glycoproteins | + | + | + | [19] | [31] | |
| fibrillin-1 | Q61554 | Fbn1 | glycoproteins | + | + | + | [16] | [31] | |
| fibrinogen alpha chain | E9PV24 | Fga | glycoproteins | b | b | b | [16] | [29] | |
| fibrinogen gamma chain | Q8VCM7 | Fgg | glycoproteins | b | b | + | [16] | [29] | |
| fibromodulin | P50608 | Fmod | proteoglycans | a | + | + | [19] | [33] | [28] |
| fibronectin | P11276 | Fn1 | glycoproteins | + | + | [16] | [28] | ||
| perlecan | Q05793 | Hspg2 | proteoglycans | + | + | + | [19] | [28] | |
| inter-alpha trypsin inhibitor heavy chain 1 | Q61702 | Itih1 | ECM regulators | a | a | [18] | [25] | ||
| keratocan | O35367 | Kera | proteoglycans | + | + | [20] | [30] | ||
| laminin, alpha 2 | Q60675 | Lama2 | glycoproteins | + | + | [19] | [33] | [32] | |
| laminin, alpha 4 | P97927 | Lama4 | glycoproteins | + | + | [19] | [32] | ||
| laminin, beta 1 | P02469 | Lamb1 | glycoproteins | + | + | [19] | [32] | ||
| laminin, beta 2 | Q61292 | Lamb2 | glycoproteins | + | + | a | [19] | [28] | |
| laminin, gamma 1 | P02468 | Lamc1 | glycoproteins | + | + | [19] | [32] | ||
| galectin-1 | P16045 | Lgals1 | ECM-affiliated | + | + | b | [19] | [47] | |
| lysyl oxidase | P28301 | Lox | ECM regulators | + | [25] | ||||
| lumican | P51885 | Lum | proteoglycans | + | + | + | [19] | [28] | |
| matrilin-2 | O08746 | Matn2 | glycoproteins | b | [30] | ||||
| microfibrillar-associated protein 5 | Q9QZJ6 | Mfap5 | glycoproteins | a | a | [19] | [26] | ||
| milk fat globule-EGF factor 8 protein | P21956 | Mfge8 | glycoproteins | a | + | [19] | [29] | ||
| nidogen-1 | P10493 | Nid1 | glycoproteins | + | + | a | [19] | [41]c | [10]c |
| nidogen-2 | O88322 | Nid2 | glycoproteins | + | a | [19] | [25] | ||
| osteoglycin/mimecan | Q62000 | Ogn | proteoglycans | + | + | + | [19] | [33] | [28] |
| procollagen C-endopeptidase enhancer | Q61398 | Pcolce | glycoproteins | b | [19] | [30] | |||
| periostin | Q62009 | Postn | glycoproteins | + | + | [19] | [30] | ||
| prolargin | Q9JK53 | Prelp | proteoglycans | + | + | + | [19] | [33] | [29] |
| lubricin | Q9JM99 | Prg4 | proteoglycans | + | [40]b | [28] | |||
| calpactin | P08207 | S100a10 | secreted factors | a | a | a | [17] | [25] | |
| alpha-1-antitrypsin | P22599 | Serpina1a | ECM regulators | a | a | a | [20] | [28] | |
| Serpin B6 | F8WIV2 | Serpinb6a | ECM regulators | a | a | [17] | [32] | ||
| pigment epithelium-derived factor | P97298 | Serpinf1 | ECM regulators | + | + | [20] | [25] | ||
| Serpin H1/Heat shock protein 47 | P19324 | Serpinh1 | ECM regulators | + | + | + | [20] | [32] | |
| osteopontin | P10923 | Spp1 | glycoproteins | a | [48]b | [32] | |||
| transforming growth factor beta induced | P82198 | Tgfbi | glycoproteins | + | + | [20] | [28] | ||
| transglutaminase 2 | P21981 | Tgm2 | ECM regulators | + | + | [20] | b | ||
| thrombospondin 1 | P35441 | Thbs1 | glycoproteins | a | + | [48]b | [29] | ||
| thrombospondin 2 | Q03350 | Thbs2 | glycoproteins | + | [39]b | [32] | |||
| thrombospondin 4 | Q9Z1T2 | Thbs4 | glycoproteins | + | + | [20] | [29] | ||
| tubulointerstitial nephritis antigen-like 1 | Q99JR5 | Tinagl1 | glycoproteins | a | a | [19] | [25] | ||
| tenascin C | Q80YX1 | Tnc | glycoproteins | a | + | [18] | [8]c | [28] | |
| tenascin XB | O35452 | Tnxb | glycoproteins | + | + | + | [20] | [28] | |
| versican | Q62059 | Vcan | proteoglycans | + | [19] | [28] | |||
| vitrin | Q8VHI5 | Vit | glycoproteins | b | [25] | ||||
| von Willebrand factor A domain containing 5A | Q99KC8 | Vwa5a | glycoproteins | a | [20] | [32] |
+—found in both GuHCl and fractionated samples. a—found only in GuHCl samples. b—found only in fractionated samples.
Gene array or in situ only.
IHC only.
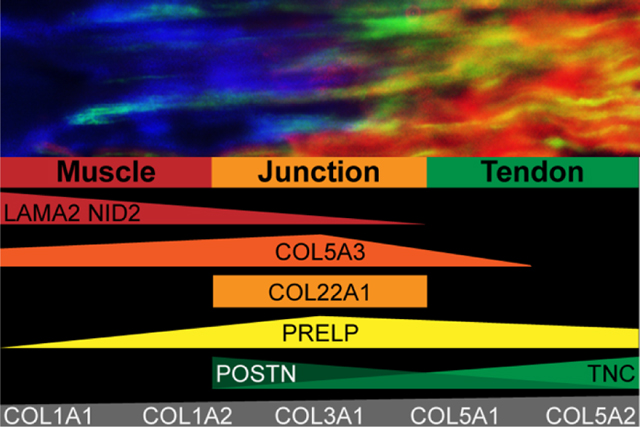
To visualize the relative abundance of the matrisome across M, J, and T tissues, raw intensities of ECM proteins identified in GuHCl samples were plotted as a heat map (Figure 3). Rows were manually arranged to group proteins that were found in specific tissues. Basal lamina components (e.g., HSPG2, NID1, NID2, LAMA2, LAMB1, and LAMC2) were more abundant in M and J, whereas type I collagen and associated proteins (e.g., COL1A1, COL1A2, FMOD, and BGN) were more highly enriched in T and J tissues. An alternative version of this heat map was generated, arranged by the ECM category, to facilitate the identification of proteins driving the trends observed in Figure 2B (Figure S2). Pearson correlation coefficients revealed low correlation between ECM proteins in M and T tissues, and the J samples were in between, more closely associated with M (Figure S1). Some ECM proteins identified in multiple tissues across the interface appeared to be more enriched in J (Figure 3). The amount of M in J samples was determined by estimating the distribution of matrisome categories in M and T samples with J, we generated volcano plots comparing the measured intensity with the theoretical intensity of individual ECM (Figure S3). Several proteins, including POSTN, FBN1, LGALS, and PRELP, were higher in J than predicted if the concentration was governed by an 80:20 or 90:10 mixture of M/T.
Figure 3.

Heat map comparing raw intensities of matrisome proteins identified in GuHCl homogenate from muscle (M), junction (J), and tendon (T) tissue. Raw intensities were log10 transformed, and individual boxes represent each biological replicate for n = 3 M, T, and J samples (see also Table S1). Tissue was harvested from 5 month-old murine soleus muscle–tendon units. Rows were manually grouped to indicate the proteins found in specific tissues (see alternative arrangement in Figure S2).
Interestingly, COL5A1, COL5A2, and COL3A1, collagens that are known to mediate type I collagen fiber assembly, were found at different abundances in M versus T tissues. While the relative ratio of α1(1):α2(I) was very similar, there were significant differences in the ratios of α1(V):α2(V) and α1(I):α1(III) (Tables 2 and S1), indicating that the distribution of these chains is tissue-specific.
Table 2.
Ratios of Collagen Chains Related to Type I Collagen Fibrillogenesis, Based off GuHCl Samples (Table S1)
| M | T | p | |
|---|---|---|---|
| α1(I):α2(I) | 1.64 ± 0.12 | 1.74 ± 0.05 | 0.25 |
| α1(V):α2(V) | 0.59 ± 0.06 | 0.10 ± 0.01 | 0.00015 |
| α1(I):α1(V) | 96.60 ± 14.35 | 15,831 ± 4168 | 0.0028 |
| α1(I):α2(V) | 57.51 ± 13.17 | 1565 ± 345.5 | 0.0016 |
| α1(I):α1(III) | 1.55 ± 0.03 | 54.59 ± 7.84 | 0.00031 |
It was not feasible to build a comparative heat map between the GuHCl solubilized and the fractionated samples because of the different processing steps as only a subset of the latter tissue was analyzed via LC–MS/MS. Nevertheless, most of the ECM identified (60/85) were found using both extraction protocols, and of those only identified in one (25/85), most were of low intensity (Table 1). Furthermore, the 30 most abundant proteins identified using both protocols were the same for J and T, and 29/30 were similar in M (Tables 1, S1, and S4).
To further investigate some of the proteomic trends, IHC analyses were conducted on cryosectioned soleus muscle–tendon units. TNC, which was only found in T and J tissues via LC–MS/MS (Figure 3), localized to the T in cryosections (green, Figure 4A). NID2 and LAMA2 were only visualized in muscle (blue, Figure 4), consistent with the proteomic data. COL22A1 (red) was restricted to the J and followed the fine extension of T into the M (arrowheads, Figures 4A and S4). While the antibody against all α chains of type V collagen stained each tissue (green, Figure 4B), COL5A3 was localized to the J, with lower distribution in M and T (red, Figure 4B). ECM enriched at J compared with theoretical predictions (Figure S3) were also investigated. PRELP and POSTN (red, Figure 4C,D) localized to the interface between specific markers for T (TNC, green) and M (LAMA2, MY32, blue). PRELP overlapped with TNC within the T and at the J (Figure 4C), whereas POSTN appeared to form a distinct interface between T and M (Figure 4D).
Figure 4.
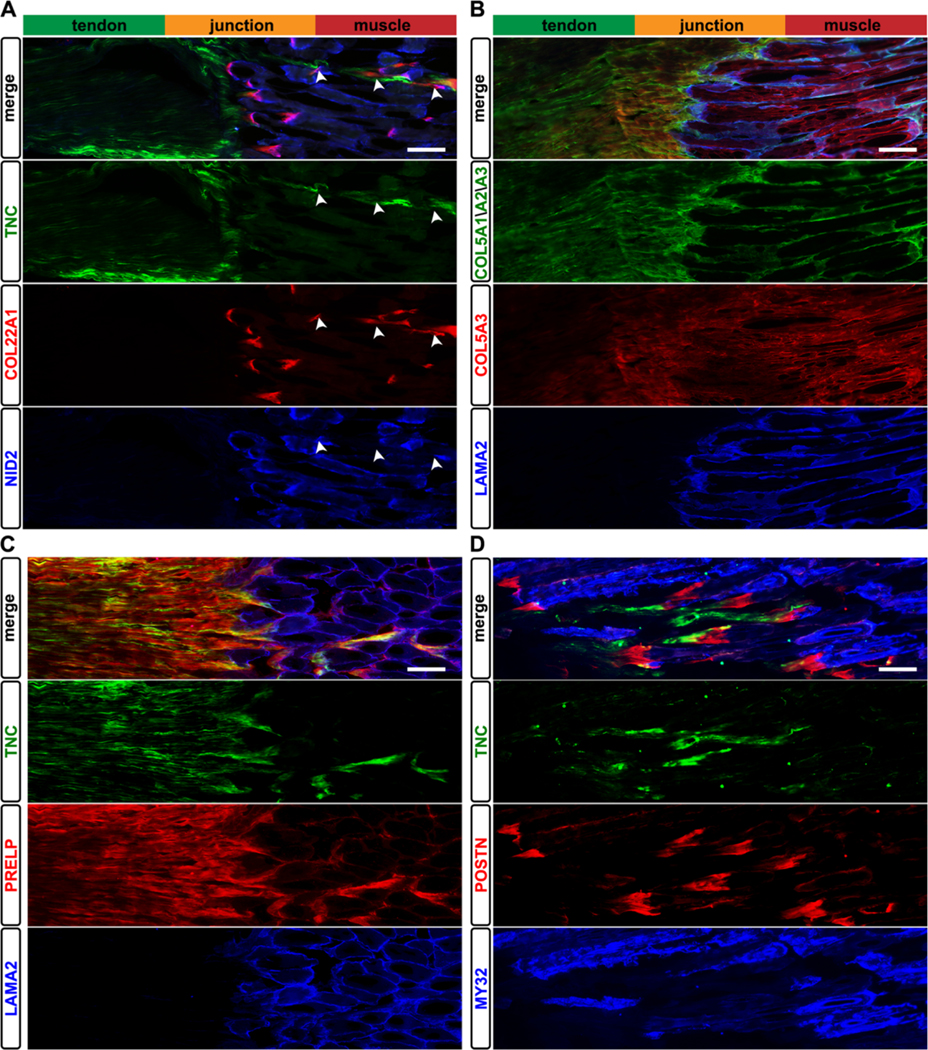
Immunolocalization of ECM to distinct regions of the soleus muscle–tendon unit. (A) TNC (green) was restricted to the tendon, whereas type XXII collagen (COL22A1, red) was found only at the J and where the T extended into the M (arrowheads; see also Figure S4). Nidogen-2 (NID2, blue) was localized to the M, consistent with the proteomics data (Table S1). (B) Type V collagen was found in all three tissues (COL5A1/A2/A3, green); however, the α3 chain of type V collagen (COL5A3, red) was visualized in the M, T, and J, contrasting with the proteomic identification of COL5A3 only in the J (Table S1). The α2 laminin chain (LAMA2, blue) was restricted to the J and basal lamina of M. (C) Prolargin (PRELP, red) was enriched in T and J tissues, overlapping with TNC (green) expression. (D) Periostin (POSTN, red) was only visualized at the interface between M (MY32, blue) and T (TNC, green) tissues. Images representative of N = 3 biological replicates; bars = 100 μm.
Matrisome constituents found using both protocols are summarized in Figure 5. If a protein was found in only M and J tissues via LC–MS/MS, the protein was assigned to the muscle group. Similarly, if a protein was found in only J and T tissues, it was included in the tendon group. Proteins only found in the J tissue, COL22A1 and COL5A3, were ascribed to the junction; however, COL5A3 is underlined to highlight the discrepancy between the proteomic and IHC data (Figure 5). Some proteins were found using both protocols but had differential distributions, these are indicated in gray (Figure 5).
Figure 5.

Summary of ECM identified in both GuHCl and fractionation samples. Proteins in black were consistent between protocols, whereas proteins in gray were found in both data sets but with different tissue distributions. If a protein was found either in tendon alone or tendon + junction, it was included in the tendon group. Similarly, if a protein was found in either muscle alone or muscle + junction, it was included in the muscle group. COL5A3 is underlined to highlight the discrepancy between the proteomic and IHC data (see Figures 3, 4 and Table S1).
DISCUSSION
Collectively, our data demonstrate that there are many ECM proteins found across the muscle–tendon unit, in particular, components associated with type I collagen fibers (Figure 5). The ECM identified exclusively in M are primarily related to the basal lamina, whereas those specific to T and J tissue include thrombospondins and other matricellular ECM. We validated the enrichment of specific proteins at the J (COL22A1, COL5A3, PRELP, and POSTN) by visualizing these ECM with respect to markers specific to T (TNC) and M (NID2, LAMA2, and MY32; Figure 4). This comparative map identifies tissue-specific ECM that can guide both spatial visualization of M, J, and T tissues, as well as inform regenerative therapies that aim to restore functionality across damaged muscle–tendon units.
Type I collagen is one of the most prevalent proteins in the body,50 as well as the most abundant ECM found in all three tissues in this study (Figure 3; Tables S1 and S4). One of the primary roles of type I collagen is to confer strength in tension. A type I collagen-rich connective tissue appeared to be continuous across the myotendinous junction,51 which is needed for the smooth transition of muscle-generated forces from the myofibrils across the tendon to bone. Many components were found in all three tissues (Figure 3, Table 1), supporting the hypothesis that the ECM is continuous across the MTJ. For example, critical organizers of type I collagen fibrils were found in all three tissues, including type III and V collagens, as well as small leucine-rich proteoglycans (SLRPs; e.g., ASPN, BGN, DCN, LUM, OGN, and PRELP; Table 1).50,52–54 Interestingly, BGN, DCN, and PRELP were more highly expressed in J and T, whereas ASPN and OGN were enriched in J, and LUM was higher in M and J (Figure 3). However, global LC–MS/MS analysis does not provide information about the precise source, localization, or binding partners of the ECM proteins, and it is unknown whether individual fibrils extend across the junction as well.55
Type I collagen is a heterotrimer of α1(I) and α2(I) chains, thought to exist primarily as α1(I)2α2(I);50 however, a homotrimer, α1(I)3, also forms fibers in COL1A2 knockout mice, albeit with inferior mechanical properties.56 In our study, the ratio of α1(I):α2(I) in GuHCl extracted samples was consistent across M and T tissues [α1(I):α2(I) = 1.6 and 1.7, respectively; Table 2], which is close to the ratio typically associated with type I collagen [α1(I):α2(I) = 2.0]. Type III collagen has a single isoform, COL3A1, which forms independent fibrils as well as heterotypic complexes with type I collagen,53 and was found at significantly different ratios in M and T tissues (Table 2). Furthermore, we found a significant difference in the ratios of type V collagen chains. Previous studies reported type V collagen can be found as different isoforms made up of the three known chains, including α1(V)2α2(V), α1(V)α2(V)α3(V), and α1(V)3.52 In GuHCl extracted tissues, the ratio of α1(V):α2(V) significantly varied between M and T [α1(V):α2(V) = 0.6 and 0.1, respectively], as well as the ratio of α1(I):α1(V) and α1(I):α2(V) (Table 2). These results indicate that the ratios can vary widely between tissues and may be driven by the need for specific ECM architectures to withstand differences in the mechanical environment.
A comparative analysis of type I collagen fibril diameter has not been conducted across the M, J, and T tissues of a single muscle–tendon unit. Recently, serial block-face scanning electron microscopy provided evidence that type I collagen fibrils can be continuous along a tendon; however, that study did not extend the investigation into the muscle.57 Nevertheless, the differences in the expression of fibril-associated collagens and SLRPs likely lead to different geometries. Indeed, it was previously shown that there is a heterogeneous distribution of collagen fibril diameters along the equine superficial digital flexor tendon where there was a mix of small and large diameter fibrils proximal to the myotendinous junction and an increasing amount of larger diameter fibrils through the midsubstance toward the enthesis.58 Changes in fibril diameter correlated with variations in the distribution of type V collagen58 and is supported by our data showing that there is more type V collagen relative to type I collagen in M compared with T (Table 2).
In addition to varying ratios of ECM components throughout the muscle–tendon unit, the different mechanical demands of muscle and tendon are reflected in the tissue-specific ECM identified in this study (Figure 4). The basal lamina components LAMA2, LAMB1, LAMC1, and NID2 were only found in M tissue, consistent with the description of laminin-211 as the primary laminin in the muscle basal lamina.59 Together with HSPG2, these ECM form a tightly knit sheath that transmits myofiber-generated force to the interstitial matrix, as well as protect these cells from contraction-induced injury, which can disrupt the muscle cell membrane and lead to necrosis, as seen in models of muscular dystrophy.60 Other basal lamina proteins, NID1, COL4A1, COL4A2, and LAMB2 were found in all tissues. This was unexpected as the bulk tendon tissue does not typically include basal lamina components; however, these may be localized to the epithelium-like sheath that surrounds many tendons to prevent adhesion, which was reported to include COL4A2 and NID1.10
COL12A1, KERA, MFGE8, THBS1, THBS4, TNC, and VCAN were restricted to tendon as previously reported in a comparative genomic analysis of musculoskeletal tissues.11VCAN is a large proteoglycan decorated with many chondroitin sulfate chains and is primarily found in the pericellular matrix surrounding the 1D cell arrays.6 The ability of VCAN to sequester large amounts of water may act to protect the tendon cell bodies from internal compressive forces generated when isotonic muscle contractions uniaxially load the tissues.61 The matricellular thrombospondins and TNC are oligomeric proteins that contain multiple domains and are dynamically expressed during development and wound healing.62,63 Their roles in homeostatic adult tendon are not clear, but the multimeric structure and localization to tissues and interfaces that undergo high mechanical loads may help confer stability to the tissue as well as mediate mechanical signals from the ECM to the cells.62,63 In contrast, other transcriptomic and proteomic reports also found these components in muscle (Table 1). Unfortunately, the purity of the muscle in these studies is unclear, and there is significant potential that tendinous tissues from the insertion ends or aponeuroses were included, which prevents our ability to thoroughly compare ECM identified in the M samples with other muscle proteomic studies. Indeed, this is why we picked the soleus as the tendon and muscle could be easily isolated.
It was feasible to compare the matrisome found in tendon in our study with those in the literature because of the ease of isolating tendon tissue from adjacent muscle. Notably, all of the 67 matrisome components identified in T were also found in other tendon studies (Table 1). Many of the proteins reported in other studies that were not identified here are either core matrisome (e.g., COL14A1, CILP1, and VTN) or matrisome-associated (e.g., ANXA11, MMP3, and TIMP3) that tend to be at low concentrations.25,26,28–30,64 For example, COL14A1 mainly plays a role during the early stages of collagen fibrillogenesis, and expression substantially decreases during tendon maturation.65 The resolution of LC–MS/MS is primarily dependent on the separation of peptides prior to analysis (e.g., time on an LC column and size-exclusion chromatography), influencing the identification of lower abundant proteins. Therefore, the absence of a specific protein in our study may be due to either a difference in physiology or the abundance being lower than the detection limit of the LC–MS/MS run.
Aggrecan (ACAN) was not found in T but was reported at moderate to high levels in other studies.25,26,29,30 This proteoglycan is typically found in regions where tendons are compressed;66 the soleus does not go around any pulleys and is predominantly loaded uniaxially. Nevertheless, other proteins typically associated with cartilage ECM were identified in T, including COL2A1, COL11A2, and CLEC3A.11 While COL2A1 may come from the insertion of the soleus into the calcaneus, care was taken to remove those regions. Furthermore, COL2A1 and COL11A2 were also found in the J and M samples, away from the enthesis, suggesting that these proteins are more prevalent in muscle–tendon units than previously thought.
A surprising result was that fibronectin (FN1) was not identified in M tissue (Figures 3 and 4). FN1 is critical for the assembly of fibrillar ECM, such as type I collagen and fibrillins,67 and shown to be expressed in homeostatic muscle.68 This absence may be due to the low abundance of FN1 in homeostatic muscle,69 in tandem with the ECM making up less than 5% of the raw intensity for M tissues, and may explain why it was not found in another ECM-focused proteomics study.16 In addition, components of elastic fibers, including ELN and FBLN1, were not identified here but are known to be a part of muscle and tendon ECM.11,70,71 Elastic fibers are highly crosslinked and challenging to identify via LC–MS/MS using standard protocols.25,72 Adding an elastase digestion step can help,29 but it is not always effective.26 Furthermore, elastase has many cleavage sites, which will cleave proteins into peptides that are too small for identification using LC–MS/MS.73 Future studies that aim to investigate the role of elastic fibrils should test additional digestion steps (e.g., elastase after trypsin digestion73) to ensure the identification of these components.
Notably, there were two ECM found only in the J tissue via LC–MS/MS (Figure 3). COL22A1 is localized to tissue junctions46,74 and, when knocked down in zebrafish, causes a muscular dystrophy phenotype because of disruption of the myotendinous during muscle contraction.45 IHC confirmed the specification of COL22A1 to the interface between muscle and tendon. In contrast, IHC revealed COL5A3 in the T proximal to J and throughout the M. The lack of proteomic identification of COL5A3 in T samples may be attributed to low protein abundance in T tissue (Figure 1A). As described above, the low percentage of ECM identified in M (Figure 2A), combined with an overall low abundance of COL5A3 (Figure 3), likely prevented the identification of this protein using the LC–MS/MS parameters implemented in this study. While COL5A3 has not been previously attributed to the myotendinous junction, consistent with IHC (Figure 4B), it was reported in the epimysium surrounding muscle during murine development, as well as the quiescent niche of satellite cells in adult muscle.75,76 The difference between the localization of the pan-COL5 and the COL5A3 staining can be attributed to the differential expression of α chains within tissues as noted above.52 The IHC and proteomic analyses indicate that the predominant heterotrimer in T is composed of α1(V) and α2(V) chains, whereas in J and M, α3(V) chains are also present, though at lower concentrations (Figures 3 and 4). The discrepancy in the staining for type V collagen in M may be due to differences in epitopes that the pan-COL5 and COL5A3 were raised against.
In addition to the two ECM only identified in J, there were other proteins that were enriched at the interface (Figures 3 and S3). PRELP is an SLRP that binds with both type I collagen and basal lamina proteins.77 Previous reports described PRELP localization proximal to the basal lamina in various tissues, and it was identified in a proteomics study on MTJ isolated via laser capture microdissection.33,77 Using IHC, we confirmed these descriptions by visualizing PRELP at the J (Figure 4C). The glycoprotein POSTN, which binds with many ECM, including FN1, collagens, and TNC,78 was localized to J in a pattern similar to COL22A1 (Figure 4D). POSTN was previously shown to play a role in linking skeletal muscle to the myoseptum in zebrafish.79 While other proteomic studies identified POSTN in skeletal muscle,18–20 we did not, which may be attributed to contamination with T, as described above. However, POSTN is upregulated in injured muscle80 and critical for promoting fibroblast activity and fibrosis.81 It is likely that POSTN localization at J is part of a fibrous ECM that increases the mechanical integrity at the interface between the basal lamina of muscle fibers and type I collagen in tendons. While PRELP and POSTN were found in both T and J tissues via LC–MS/MS, IHC resolved the different spatial distribution of these ECM. These results emphasize the need to combine both proteomics and IHC to gain a comprehensive picture of the organization of the ECM within and across different tissues.
Care should be taken before using these markers to spatially identify tissues in muscle–tendon units other than that from the homeostatic adult. For example, TNC is considered to be specific for J and T tissues in uninjured adult muscles (Figure 3; ref 82); however, during development, compensatory hypertrophy and regeneration, TNC is upregulated throughout the muscle tissue.83–85 Similarly, LAMA2 is found only in the basal lamina of wild-type murine muscle (Figure 3) but was identified within the tendon of a α7β1 integrin knockout model.41
Surprisingly, our attempt to fractionate for ECM in the muscle did not greatly enhance the amount of ECM within the insoluble fraction (Figure 2) or increase the number of identified proteins (Table 1). In fact, we identified fewer soluble matrisome factors, likely from the removal of C, N, and Mem buffer-soluble proteins (Figure 2B). This lack of enrichment may be attributed to the large amount of contractile CS proteins in myofibers, which appear to be less soluble than other intracellular proteins (Figure 2A). Because of the minimal enrichment of ECM by tissue fractionation (Figure 2A), GuHCl extraction is recommended for future comparative musculoskeletal studies as it involves fewer processing steps and allows for a direct comparison of relative amounts of ECM composition between M, J, and T tissues (Figure 3). In addition, future studies focusing on the interface will benefit from increased separation of the peptides during LC–MS/MS to enhance resolution as there may be additional J-specific ECM that are in low abundance. We expect the results of this study to provide a baseline of matrisome distribution in the adult muscle–tendon unit to which studies investigating pathological musculoskeletal phenotypes can be compared.
Supplementary Material
ACKNOWLEDGMENTS
The authors would like to thank the Purdue Proteomics Core, Tamara Kinzer-Ursem for sharing wild-type mice and members of the Calve laboratory for critical feedback on interpretation of the results.
Funding
This work was supported by the National Institutes of Health (R01 AR071359 and DP2 AT009833 to S.C.).
ABBREVIATIONS
- CS
cytoskeletal
- ECM
extracellular matrix
- GuHCl
guanidine hydrochloride
- J
myotendinous junction
- LC–MS/MS
liquid chromatography–tandem mass spectrometry
- M
muscle
- SLRP
small leucine-rich proteoglycan
- T
tendon
Footnotes
ASSOCIATED CONTENT
Supporting Information
The Supporting Information is available free of charge at https://pubs.acs.org/doi/10.1021/acs.jproteome.0c00248.
Pearson correlation plot based on raw intensity of ECM proteins found in GuHCl homogenate; heat map by ECM category of matrisome proteins identified in GuHCl homogenate from M, J, and T tissues; identification of ECM enriched in J; immunolocalization of COL22A1 and a muscle-specific marker; cell compartment statistics; matrisome category statistics; and experimental details on reagents used for IHC (PDF)
Protein ID for GuHCl Samples (XLSX)
Compartmentalization Buffer Table (XLSX)
Protein IDs for Fractionated Samples (XLSX)
MaxQuant Parameters (XLSX)
Notes
The authors declare no competing financial interest.
Contributor Information
Kathryn R. Jacobson, Purdue University Interdisciplinary Life Science Program, West Lafayette, Indiana 47907, United States
Sarah Lipp, Weldon School of Biomedical Engineering, Purdue University, West Lafayette, Indiana 47907, United States.
Andrea Acuna, Weldon School of Biomedical Engineering, Purdue University, West Lafayette, Indiana 47907, United States.
Yue Leng, Weldon School of Biomedical Engineering, Purdue University, West Lafayette, Indiana 47907, United States.
Ye Bu, Weldon School of Biomedical Engineering, Purdue University, West Lafayette, Indiana 47907, United States.
Sarah Calve, Purdue University Interdisciplinary Life Science Program, West Lafayette, Indiana 47907, United States; Weldon School of Biomedical Engineering, Purdue University, West Lafayette, Indiana 47907, United States.
REFERENCES
- (1).Sanes JR The basement membrane/basal lamina of skeletal muscle. J. Biol. Chem 2003, 278, 12601–12604. [DOI] [PubMed] [Google Scholar]
- (2).Kjær M. Role of extracellular matrix in adaptation of tendon and skeletal muscle to mechanical loading. Physiol. Rev 2004, 84, 649–698. [DOI] [PubMed] [Google Scholar]
- (3).Grounds MD Complexity of extracellular matrix and skeletal muscle regeneration. In Skeletal Muscle Repair and Regeneration; Schiaffino S, Partridge T, Eds.; Springer: Netherlands, 2008; Vol. 3, pp 269–301. [Google Scholar]
- (4).Okita M; Yoshimura T; Nakano J; Motomura M; Eguchi K. Effects of reduced joint mobility on sarcomere length, collagen fibril arrangement in the endomysium, and hyaluronan in rat soleus muscle. J. Muscle Res. Cell Motil 2004, 25, 159–166. [DOI] [PubMed] [Google Scholar]
- (5).Tozer S; Duprez D. Tendon and ligament: development, repair and disease. Birth Defects Res., Part C 2005, 75, 226–236. [DOI] [PubMed] [Google Scholar]
- (6).Ritty TM; Roth R; Heuser JE Tendon cell array isolation reveals a previously unknown fibrillin-2-containing macromolecular assembly. Structure 2003, 11, 1179–1188. [DOI] [PubMed] [Google Scholar]
- (7).Halper J; Kjaer M. Basic components of connective tissues and extracellular matrix: elastin, fibrillin, fibulins, fibrinogen, fibronectin, laminin, tenascins and thrombospondins. Adv. Exp. Med. Biol 2014, 802, 31–47. [DOI] [PubMed] [Google Scholar]
- (8).Järvinen TAH; Józsa L; Kannus P; Järvinen TLN; Hurme T; Kvist M; Pelto-Huikko M; Kalimo H; Järvinen M. Mechanical loading regulates the expression of tenascin-C in the myotendinous junction and tendon but does not induce de novo synthesis in the skeletal muscle. J. Cell Sci 2003, 116, 857–866. [DOI] [PubMed] [Google Scholar]
- (9).Gerdin B; Hällgren R. Dynamic role of hyaluronan (HYA) in connective tissue activation and inflammation. J. Intern. Med 1997, 242, 49–55. [DOI] [PubMed] [Google Scholar]
- (10).Taylor SH; Al-Youha S; Van Agtmael T; Lu Y; Wong J; McGrouther DA; Kadler KE Tendon is covered by a basement membrane epithelium that is required for cell retention and the prevention of adhesion formation. PLoS One 2011, 6, No. e16337. [DOI] [PMC free article] [PubMed] [Google Scholar]
- (11).Jelinsky SA; Archambault J; Li L; Seeherman H. Tendon-selective genes identified from rat and human musculoskeletal tissues. J. Orthop. Res 2010, 28, 289–297. [DOI] [PubMed] [Google Scholar]
- (12).Hill RC; Calle EA; Dzieciatkowska M; Niklason LE; Hansen KC Quantification of extracellular matrix proteins from a rat lung scaffold to provide a molecular readout for tissue engineering. Mol. Cell. Proteomics 2015, 14, 961–973. [DOI] [PMC free article] [PubMed] [Google Scholar]
- (13).Lennon R; Byron A; Humphries JD; Randles MJ; Carisey A; Murphy S; Knight D; Brenchley PE; Zent R; Humphries MJ Global analysis reveals the complexity of the human glomerular extracellular matrix. J. Am. Soc. Nephrol 2014, 25, 939–951. [DOI] [PMC free article] [PubMed] [Google Scholar]
- (14).Naba A; Clauser KR; Hoersch S; Liu H; Carr SA; Hynes RO The matrisome: in silico definition and in vivo characterization by proteomics of normal and tumor extracellular matrices. Mol. Cell. Proteomics 2012, 11, M111.014647. [DOI] [PMC free article] [PubMed] [Google Scholar]
- (15).Schiller HB; Fernandez IE; Burgstaller G; Schaab C; Scheltema RA; Schwarzmayr T; Strom TM; Eickelberg O; Mann M. Time- and compartment-resolved proteome profiling of the extracellular niche in lung injury and repair. Mol. Syst. Biol 2015, 11, 819. [DOI] [PMC free article] [PubMed] [Google Scholar]
- (16).Barrett AS; Wither MJ; Hill RC; Dzieciatkowska M; D’Alessandro A; Reisz JA; Hansen KC Hydroxylamine chemical digestion for insoluble extracellular matrix characterization. J. Proteome Res 2017, 16, 4177–4184. [DOI] [PMC free article] [PubMed] [Google Scholar]
- (17).Eimre M; Kasvandik S; Ivask M; Kõks S. Proteomic dataset of wolframin-deficient mouse heart and skeletal muscles. Data Brief 2018, 21, 616–619. [DOI] [PMC free article] [PubMed] [Google Scholar]
- (18).Lang F; Aravamudhan S; Nolte H; Türk C; Hölper S; Müller S; Günther S; Blaauw B; Braun T; Krüger M. Dynamic changes in the mouse skeletal muscle proteome during denervationinduced atrophy. Dis. Models Mech 2017, 10, 881–896. [DOI] [PMC free article] [PubMed] [Google Scholar]
- (19).Schönke M; Björnholm M; Chibalin AV; Zierath JR; Deshmukh AS Proteomics analysis of skeletal muscle from leptin-deficient ob/ob mice reveals adaptive remodeling of metabolic characteristics and fiber type composition. Proteomics 2018, 18, 1700375. [DOI] [PubMed] [Google Scholar]
- (20).Zabielski P; Lanza IR; Gopala S; Holtz Heppelmann CJ; Bergen HR 3rd; Dasari S; Nair KS Altered skeletal muscle mitochondrial proteome as the basis of disruption of mitochondrial function in diabetic mice. Diabetes 2016, 65, 561–573. [DOI] [PMC free article] [PubMed] [Google Scholar]
- (21).Kleinert M; Parker BL; Jensen TE; Raun SH; Pham P; Han X; James DE; Richter EA; Sylow L. Quantitative proteomic characterization of cellular pathways associated with altered insulin sensitivity in skeletal muscle following high-fat diet feeding and exercise training. Sci. Rep 2018, 8, 10723. [DOI] [PMC free article] [PubMed] [Google Scholar]
- (22).Deshmukh AS; Murgia M; Nagaraj N; Treebak JT; Cox J; Mann M. Deep proteomics of mouse skeletal muscle enables quantitation of protein isoforms, metabolic pathways, and transcription factors. Mol. Cell. Proteomics 2015, 14, 841–853. [DOI] [PMC free article] [PubMed] [Google Scholar]
- (23).Højlund K; Yi Z; Hwang H; Bowen B; Lefort N; Flynn CR; Langlais P; Weintraub ST; Mandarino LJ Characterization of the human skeletal muscle proteome by one-dimensional gel electrophoresis and HPLC-ESI-MS/MS. Mol. Cell. Proteomics 2008, 7, 257–267. [DOI] [PMC free article] [PubMed] [Google Scholar]
- (24).Mullins Y; Keogh K; Kenny DA; Kelly A; P OB; Waters SM Label-free quantitative proteomic analysis of M. longissimus dorsi from cattle during dietary restriction and subsequent compensatory growth. Sci. Rep 2020, 10, 2613. [DOI] [PMC free article] [PubMed] [Google Scholar]
- (25).Ashraf Kharaz Y; Zamboulis D; Sanders K; Comerford E; Clegg P; Peffers M. Comparison between chaotropic and detergent-based sample preparation workflow in tendon for mass spectrometry analysis. Proteomics 2017, 17, 1700018. [DOI] [PMC free article] [PubMed] [Google Scholar]
- (26).Hakimi O; Ternette N; Murphy R; Kessler BM; Carr A. A quantitative label-free analysis of the extracellular proteome of human supraspinatus tendon reveals damage to the pericellular and elastic fibre niches in torn and aged tissue. PLoS One 2017, 12, No. e0177656. [DOI] [PMC free article] [PubMed] [Google Scholar]
- (27).Kuntz LA; Rossetti L; Kunold E; Schmitt A; von Eisenhart-Rothe R; Bausch AR; Burgkart RH Biomarkers for tissue engineering of the tendon-bone interface. PLoS One 2018, 13, No. e0189668. [DOI] [PMC free article] [PubMed] [Google Scholar]
- (28).Little D; Thompson JW; Dubois LG; Ruch DS; Moseley MA; Guilak F. Proteomic differences between male and female anterior cruciate ligament and patellar tendon. PLoS One 2014, 9, No. e96526. [DOI] [PMC free article] [PubMed] [Google Scholar]
- (29).Sato N; Taniguchi T; Goda Y; Kosaka H; Higashino K; Sakai T; Katoh S; Yasui N; Sairyo K; Taniguchi H. Proteomic analysis of human tendon and ligament: solubilization and analysis of insoluble extracellular matrix in connective tissues. J. Proteome Res 2016, 15, 4709–4721. [DOI] [PubMed] [Google Scholar]
- (30).Smith SM; Thomas CE; Birk DE Pericellular proteins of the developing mouse tendon: a proteomic analysis. Connect. Tissue Res 2012, 53, 2–13. [DOI] [PMC free article] [PubMed] [Google Scholar]
- (31).Thorpe CT; Peffers MJ; Simpson D; Halliwell E; Screen HR; Clegg PD Anatomical heterogeneity of tendon: Fascicular and interfascicular tendon compartments have distinct proteomic composition. Sci. Rep 2016, 6, 20455. [DOI] [PMC free article] [PubMed] [Google Scholar]
- (32).Wunderli SL; Blache U; Beretta Piccoli A; Niederöst B; Holenstein CN; Passini FS; Silván U; Bundgaard L; Auf dem Keller U; Snedeker JG Tendon response to matrix unloading is determined by the patho-physiological niche. Matrix Biol. 2020, 89, 11–26. [DOI] [PubMed] [Google Scholar]
- (33).Can T; Faas L; Ashford DA; Dowle A; Thomas J; O’Toole P; Blanco G. Proteomic analysis of laser capture microscopy purified myotendinous junction regions from muscle sections. Proteome Sci. 2014, 12, 25. [DOI] [PMC free article] [PubMed] [Google Scholar]
- (34).Hsueh M-F; Khabut A; Kjellström S; Önnerfjord P; Kraus VB Elucidating the molecular composition of cartilage by proteomics. J. Proteome Res 2016, 15, 374–388. [DOI] [PMC free article] [PubMed] [Google Scholar]
- (35).Saleh AM; Jacobson KR; Kinzer-Ursem TL; Calve S. Dynamics of Non-Canonical Amino Acid-Labeled Intra- and Extracellular Proteins in the Developing Mouse. Cell. Mol. Bioeng 2019, 12, 495–509. [DOI] [PMC free article] [PubMed] [Google Scholar]
- (36).Cox J; Mann M. MaxQuant enables high peptide identification rates, individualized p.p.b.-range mass accuracies and proteome-wide protein quantification. Nat. Biotechnol 2008, 26, 1367–1372. [DOI] [PubMed] [Google Scholar]
- (37).Ashburner M; Ball CA; Blake JA; Botstein D; Butler H; Cherry JM; Davis AP; Dolinski K; Dwight SS; Eppig JT; Harris MA; Hill DP; Issel-Tarver L; Kasarskis A; Lewis S; Matese JC; Richardson JE; Ringwald M; Rubin GM; Sherlock G. Gene Ontology: tool for the unification of biology. Nat. Genet 2000, 25, 25–29. [DOI] [PMC free article] [PubMed] [Google Scholar]
- (38).Bandyopadhyay A; Kubilus JK; Crochiere ML; Linsenmayer TF; Tabin CJ Identification of unique molecular subdomains in the perichondrium and periosteum and their role in regulating gene expression in the underlying chondrocytes. Dev. Biol 2008, 321, 162–174. [DOI] [PMC free article] [PubMed] [Google Scholar]
- (39).Kong X; Yao T; Zhou P; Kazak L; Tenen D; Lyubetskaya A; Dawes BA; Tsai L; Kahn BB; Spiegelman BM; Liu T; Rosen ED Brown Adipose Tissue Controls Skeletal Muscle Function via the Secretion of Myostatin. Cell Metab. 2018, 28, 631–643. [DOI] [PMC free article] [PubMed] [Google Scholar]
- (40).Lach-Trifilieff E; Minetti GC; Sheppard K; Ibebunjo C; Feige JN; Hartmann S; Brachat S; Rivet H; Koelbing C; Morvan F; Hatakeyama S; Glass DJ An antibody blocking activin type II receptors induces strong skeletal muscle hypertrophy and protects from atrophy. Mol. Cell. Biol 2014, 34, 606–618. [DOI] [PMC free article] [PubMed] [Google Scholar]
- (41).Miosge N; Klenczar C; Herken R; Willem M; Mayer U. Organization of the myotendinous junction is dependent on the presence of alpha7beta1 integrin. Lab. Invest 1999, 79, 1591–1599. [PubMed] [Google Scholar]
- (42).Gara SK; Grumati P; Urciuolo A; Bonaldo P; Kobbe B; Koch M; Paulsson M; Wagener R. Three Novel Collagen VI Chains with High Homology to the α3 Chain. J. Biol. Chem 2008, 283, 10658–10670. [DOI] [PubMed] [Google Scholar]
- (43).Barbé C; Bray F; Gueugneau M; Devassine S; Lause P; Tokarski C; Rolando C; Thissen J-P Comparative proteomic and transcriptomic analysis of follistatin-induced skeletal muscle hypertrophy. J. Proteome Res 2017, 16, 3477–3490. [DOI] [PubMed] [Google Scholar]
- (44).Eklund L; Piuhola J; Komulainen J; Sormunen R; Ongvarrasopone C; Fassler R; Muona A; Ilves M; Ruskoaho H; Takala TES; Pihlajaniemi T. Lack of type XV collagen causes a skeletal myopathy and cardiovascular defects in mice. Proc. Natl. Acad. Sci. U.S.A 2001, 98, 1194–1199. [DOI] [PMC free article] [PubMed] [Google Scholar]
- (45).Charvet B; Guiraud A; Malbouyres M; Zwolanek D; Guillon E; Bretaud S; Monnot C; Schulze J; Bader HL; Allard B; Koch M; Ruggiero F. Knockdown of col22a1 gene in zebrafish induces a muscular dystrophy by disruption of the myotendinous junction. Development 2013, 140, 4602–4613. [DOI] [PubMed] [Google Scholar]
- (46).Zwolanek D; Veit G; Eble JA; Gullberg D; Ruggiero F; Heino J; Meier M; Stetefeld J; Koch M. Collagen XXII binds to collagen-binding integrins via the novel motifs GLQGER and GFKGER. Biochem. J 2014, 459, 217–227. [DOI] [PubMed] [Google Scholar]
- (47).Chang J; Garva R; Pickard A; Yeung C-YC; Mallikarjun V; Swift J; Holmes DF; Calverley B; Lu Y; Adamson A; Raymond-Hayling H; Jensen O; Shearer T; Meng QJ; Kadler KE Circadian control of the secretory pathway maintains collagen homeostasis. Nat. Cell Biol 2020, 22, 74–86. [DOI] [PMC free article] [PubMed] [Google Scholar]
- (48).Goetsch SC; Hawke TJ; Gallardo TD; Richardson JA; Garry DJ Transcriptional profiling and regulation of the extracellular matrix during muscle regeneration. Physiol. Genomics 2003, 14, 261–271. [DOI] [PubMed] [Google Scholar]
- (49).Oliva F; Zocchi L; Codispoti A; Candi E; Celi M; Melino G; Maffulli N; Tarantino U. Transglutaminases expression in human supraspinatus tendon ruptures and in mouse tendons. Biochem. Biophys. Res. Commun 2009, 379, 887–891. [DOI] [PubMed] [Google Scholar]
- (50).Birk DE; Brückner P Collagens, suprastructures, and collagen fibril assembly. In The Extracellular Matrix: An Overview; Mecham RP, Ed.; Springer Berlin Heidelberg: Berlin, Heidelberg, 2011; pp 77–115. [Google Scholar]
- (51).Passerieux E; Rossignol R; Letellier T; Delage J. Physical continuity of the perimysium from myofibers to tendons: involvement in lateral force transmission in skeletal muscle. J. Struct. Biol 2007, 159, 19–28. [DOI] [PubMed] [Google Scholar]
- (52).Birk DE Type V collagen: heterotypic type I/V collagen interactions in the regulation of fibril assembly. Micron 2001, 32, 223–237. [DOI] [PubMed] [Google Scholar]
- (53).Fleischmajer R; Douglas MacDonald E; Perlish JS; Burgeson RE; Fisher LW Dermal collagen fibrils are hybrids of type I and type III collagen molecules. J. Struct. Biol 1990, 105, 162–169. [DOI] [PubMed] [Google Scholar]
- (54).Chen S; Birk DE The regulatory roles of small leucine-rich proteoglycans in extracellular matrix assembly. FEBS J. 2013, 280, 2120–2137. [DOI] [PMC free article] [PubMed] [Google Scholar]
- (55).Gillies AR; Lieber RL Structure and function of the skeletal muscle extracellular matrix. Muscle Nerve 2011, 44, 318–331. [DOI] [PMC free article] [PubMed] [Google Scholar]
- (56).Andriotis OG; Chang SW; Vanleene M; Howarth PH; Davies DE; Shefelbine SJ; Buehler MJ; Thurner PJ Structure-mechanics relationships of collagen fibrils in the osteogenesis imperfecta mouse model. J. R. Soc., Interface 2015, 12, 20150701. [DOI] [PMC free article] [PubMed] [Google Scholar]
- (57).Svensson RB; Herchenhan A; Starborg T; Larsen M; Kadler KE; Qvortrup K; Magnusson SP Evidence of structurally continuous collagen fibrils in tendons. Acta Biomater. 2017, 50, 293–301. [DOI] [PubMed] [Google Scholar]
- (58).Watanabe T; Imamura Y; Hosaka Y; Ueda H; Takehana K. Graded arrangement of collagen fibrils in the equine superficial digital flexor tendon. Connect. Tissue Res 2007, 48, 332–337. [DOI] [PubMed] [Google Scholar]
- (59).Yurchenco PD Basement membranes: cell scaffoldings and signaling platforms. Cold Spring Harbor Perspect. Biol 2011, 3, a004911. [DOI] [PMC free article] [PubMed] [Google Scholar]
- (60).Han R; Kanagawa M; Yoshida-Moriguchi T; Rader EP; Ng RA; Michele DE; Muirhead DE; Kunz S; Moore SA; Iannaccone ST; Miyake K; McNeil PL; Mayer U; Oldstone MBA; Faulkner JA; Campbell KP Basal lamina strengthens cell membrane integrity via the laminin G domain-binding motif of alpha-dystroglycan. Proc. Natl. Acad. Sci. U.S.A 2009, 106, 12573–12579. [DOI] [PMC free article] [PubMed] [Google Scholar]
- (61).Wight TN; Kinsella MG; Evanko SP; Potter-Perigo S; Merrilees MJ Versican and the regulation of cell phenotype in disease. Biochim. Biophys. Acta 2014, 1840, 2441–2451. [DOI] [PMC free article] [PubMed] [Google Scholar]
- (62).Chiquet-Ehrismann R; Tucker RP Tenascins and the importance of adhesion modulation. Cold Spring Harbor Perspect. Biol. 2011, 3, a004960. [DOI] [PMC free article] [PubMed] [Google Scholar]
- (63).Adams JC; Lawler J. The thrombospondins. Cold Spring Harbor Perspect. Biol 2011, 3, a009712. [DOI] [PMC free article] [PubMed] [Google Scholar]
- (64).Kannus P; Jozsa L; Järvinen TAH; Järvinen TLN; Kvist M; Natri A; Järvinen M. Location and distribution of non-collagenous matrix proteins in musculoskeletal tissues of rat. Histochem. J 1998, 30, 799–810. [DOI] [PubMed] [Google Scholar]
- (65).Ansorge HL; Meng X; Zhang G; Veit G; Sun M; Klement JF; Beason DP; Soslowsky LJ; Koch M; Birk DE Type XIV Collagen Regulates Fibrillogenesis: Premature collagen fibril growth and tissue dysfunction in null mice. J. Biol. Chem 2009, 284, 8427–8438. [DOI] [PMC free article] [PubMed] [Google Scholar]
- (66).Thorpe CT; Birch HL; Clegg PD; Screen HRC The role of the non-collagenous matrix in tendon function. Int. J. Exp. Pathol 2013, 94, 248–259. [DOI] [PMC free article] [PubMed] [Google Scholar]
- (67).Schwarzbauer JE; DeSimone DW Fibronectins, their fibrillogenesis, and in vivo functions. Cold Spring Harbor Perspect. Biol 2011, 3, a005041. [DOI] [PMC free article] [PubMed] [Google Scholar]
- (68).Ringelmann B; Röder C; Hallmann R; Maley M; Davies M; Grounds M; Sorokin L. Expression of laminin alpha1, alpha2, alpha4, and alpha5 chains, fibronectin, and tenascin-C in skeletal muscle of dystrophic 129ReJ dy/dy mice. Exp. Cell Res 1999, 246, 165–182. [DOI] [PubMed] [Google Scholar]
- (69).Gulati AK; Reddi AH; Zalewski AA Distribution of fibronectin in normal and regenerating skeletal muscle. Anat. Rec 1982, 204, 175–183. [DOI] [PubMed] [Google Scholar]
- (70).Grant TM; Thompson MS; Urban J; Yu J. Elastic fibres are broadly distributed in tendon and highly localized around tenocytes. J. Anat 2013, 222, 573–579. [DOI] [PMC free article] [PubMed] [Google Scholar]
- (71).Kurose T; Asai Y; Mori E; Daitoku D; Kawamata S. Distribution and change of collagen types I and III and elastin in developing leg muscle in rat. Hiroshima J. Med. Sci 2006, 55, 85–91. [PubMed] [Google Scholar]
- (72).Hedtke T; Schrader CU; Heinz A; Hoehenwarter W; Brinckmann J; Groth T; Schmelzer CEH A comprehensive map of human elastin cross-linking during elastogenesis. FEBS J. 2019, 286, 3594. [DOI] [PubMed] [Google Scholar]
- (73).Dau T; Gupta K; Berger I; Rappsilber J. Sequential digestion with trypsin and elastase in cross-linking mass spectrometry. Anal. Chem 2019, 91, 4472–4478. [DOI] [PMC free article] [PubMed] [Google Scholar]
- (74).Koch M; Schulze J; Hansen U; Ashwodt T; Keene DR; Brunken WJ; Burgeson RE; Bruckner P; Bruckner-Tuderman L. A novel marker of tissue junctions, collagen XXII. J. Biol. Chem 2004, 279, 22514–22521. [DOI] [PMC free article] [PubMed] [Google Scholar]
- (75).Imamura Y; Scott IC; Greenspan DS The Pro-α3(V) Collagen Chain. J. Biol. Chem 2000, 275, 8749–8759. [DOI] [PubMed] [Google Scholar]
- (76).Baghdadi MB; Castel D; Machado L; Fukada S. -i.; Birk DE; Relaix F; Tajbakhsh S; Mourikis P. Reciprocal signalling by Notch-Collagen V-CALCR retains muscle stem cells in their niche. Nature 2018, 557, 714–718. [DOI] [PMC free article] [PubMed] [Google Scholar]
- (77).Bengtsson E; Mörgelin M; Sasaki T; Timpl R; Heinegård D; Aspberg A. The leucine-rich repeat protein PRELP binds perlecan and collagens and may function as a basement membrane anchor. J. Biol. Chem 2002, 277, 15061–15068. [DOI] [PubMed] [Google Scholar]
- (78).Kudo A; Kii I. Periostin function in communication with extracellular matrices. J. Cell Commun. Signal 2018, 12, 301–308. [DOI] [PMC free article] [PubMed] [Google Scholar]
- (79).Kudo H; Amizuka N; Araki K; Inohaya K; Kudo A. Zebrafish periostin is required for the adhesion of muscle fiber bundles to the myoseptum and for the differentiation of muscle fibers. Dev. Biol 2004, 267, 473–487. [DOI] [PubMed] [Google Scholar]
- (80).Özdemir C; Akpulat U; Sharafi P; Yıldız Y; Onbaşılar İ; Kocaefe Ç. Periostin is temporally expressed as an extracellular matrix component in skeletal muscle regeneration and differentiation. Gene 2014, 553, 130–139. [DOI] [PubMed] [Google Scholar]
- (81).Hara M; Yokota K; Saito T; Kobayakawa K; Kijima K; Yoshizaki S; Okazaki K; Yoshida S; Matsumoto Y; Harimaya K; Nakashima Y; Okada S. Periostin Promotes Fibroblast Migration and Inhibits Muscle Repair After Skeletal Muscle Injury. J. Bone Jt. Surg 2018, 100, No. e108. [DOI] [PubMed] [Google Scholar]
- (82).Mayer U; Saher G; Fässler R; Bornemann A; Echtermeyer F; Mark H. v. d. ; Miosge N; Pösch E; Mark K. v. d. Absence of integrin alpha 7 causes a novel form of muscular dystrophy. Nat. Genet 1997, 17, 318–323. [DOI] [PubMed] [Google Scholar]
- (83).Calve S; Isaac J; Gumucio JP; Mendias CL Hyaluronic acid, HAS1, and HAS2 are significantly upregulated during muscle hypertrophy. Am. J. Physiol.: Cell Physiol 2012, 303, C577–C588. [DOI] [PMC free article] [PubMed] [Google Scholar]
- (84).Calve S; Odelberg SJ; Simon H-G A transitional extracellular matrix instructs cell behavior during muscle regeneration. Dev. Biol 2010, 344, 259–271. [DOI] [PMC free article] [PubMed] [Google Scholar]
- (85).Chiquet M; Fambrough DM Chick myotendinous antigen. I. A monoclonal antibody as a marker for tendon and muscle morphogenesis. J. Cell Biol 1984, 98, 1926–1936. [DOI] [PMC free article] [PubMed] [Google Scholar]
Associated Data
This section collects any data citations, data availability statements, or supplementary materials included in this article.