Abstract
ATP and GTP are exceptionally important molecules in biology with multiple, and often discrete, functions. Therefore, enzymes that bind to either of them must develop robust mechanisms to selectively utilize one or the other. Here, this specific problem is addressed by molecular studies of the human NMP kinase AK3 which uses GTP to phosphorylate AMP. AK3 plays an important role in the citric acid cycle where it is responsible for GTP/GDP recycling. By combining a structural biology approach with functional experiments, we present a comprehensive structural and mechanistic understanding of the enzyme. We discovered that AK3 functions by recruitment of GTP to the active site, while ATP is rejected and non-productively bound to the AMP binding site. Consequently, ATP acts as an inhibitor with respect to GTP and AMP. The overall features with specific recognition of the correct substrate and non-productive binding by the incorrect substrate bears strong similarity to previous findings for the ATP specific NMP kinase adenylate kinase. Taken together we are now able to provide the fundamental principles for GTP and ATP selectivity in the large NMP kinase family. As a side-result originating from non-linearity of chemical shifts in GTP and ATP titrations, we find that protein surfaces offer a general and weak binding affinity for both GTP and ATP. These non-specific interactions likely act to lower the available intra-cellular GTP and ATP concentrations and may have driven evolution to adapt the Michaelis constants of NMP kinases accordingly.
Graphical Abstract
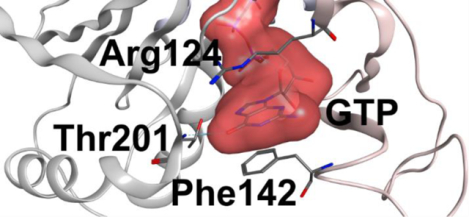
INTRODUCTION:
Enzymes perform the formidable task of recognizing their endogenous substrates within the complex1 and crowded2 cellular milieu. The complexity rises even further when substrates with similar chemical structures needing to be accepted or rejected at the active site are considered. To overcome these difficulties, enzymes can employ positive and negative selection mechanisms to recruit and reject substrates respectively, both of which require evolution of distinct molecular mechanisms3. A particular example is the ability of enzymes to discriminate between adenosine triphosphate (ATP) and guanosine triphosphate (GTP) (Figure 1). ATP is utilized as a general cellular energy carrier4 and a phosphoryl donor in phosphorylation5. For this broad role of ATP, various enzymes bind ATP for their functions in the cell. GTP, on the other hand, is found to have a narrower range of cellular functions in, for instance, protein synthesis6 and signaling7. Therefore, the selectivity of GTP from ATP is necessary for functional aspects and also to maintain the cellular GTP pool.
Figure 1. Chemical structures of GTP and ATP.
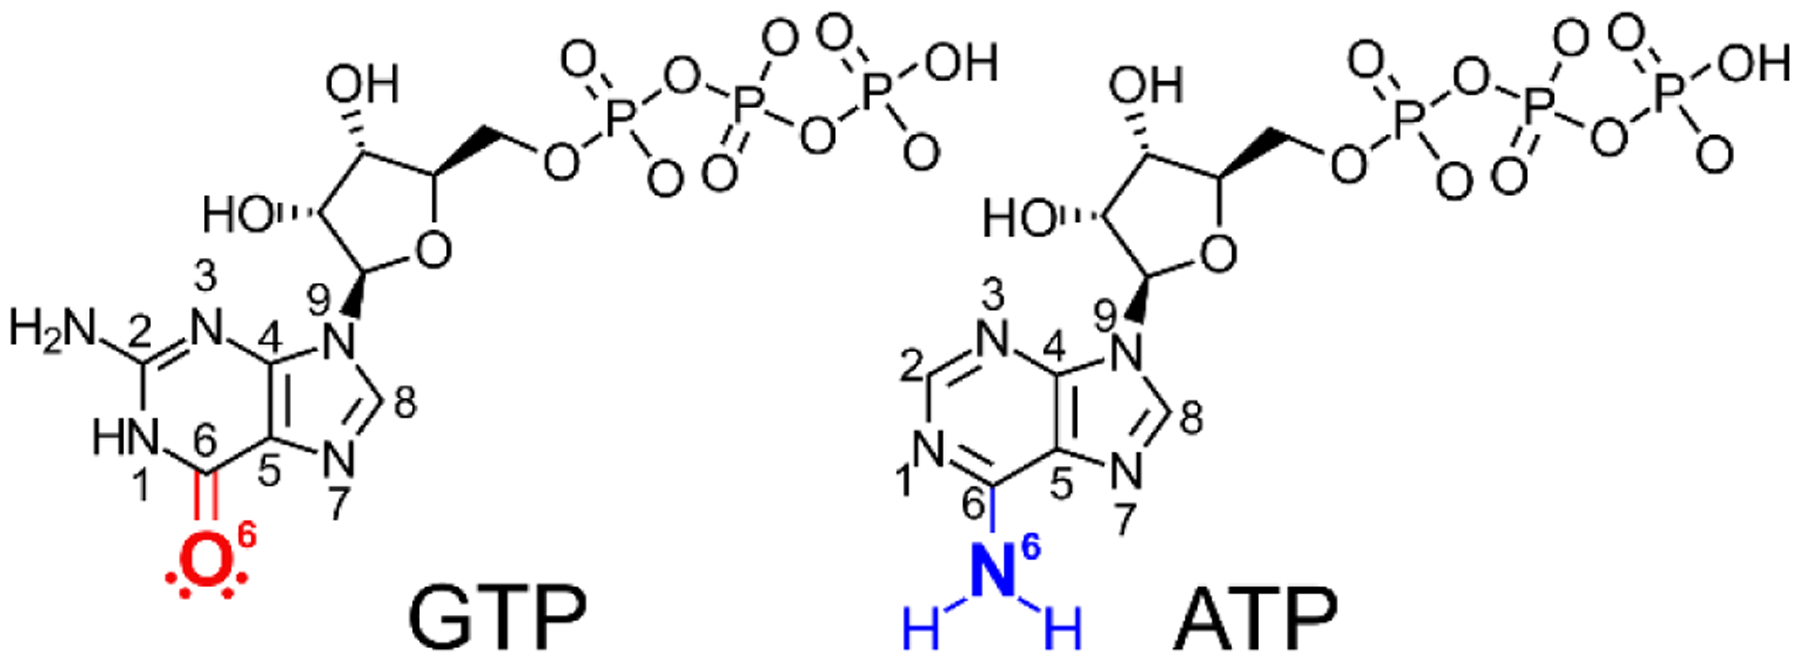
The nomenclature of the nucleobases are indicated together with the substituents at the C6 position that are key for selective binding of GTP and ATP. In GTP the free electron pairs at the O6 oxygen serves as hydrogen bond acceptors, while the hydrogens on the N6 atom of ATP serves as hydrogen bond donors.
Given the importance of ATP and GTP for cellular function we undertook a systematic investigation to decode molecular principles of enzymatic ATP and GTP recognition. To this end, we have focused on members of the nucleotide monophosphate (NMP) kinase family8 as model systems. Members of this family are selective either for ATP9 or GTP10 and use these substrates as phosphoryl donors. Based on their structures, NMP kinases are divided into three major classes: (1) monomeric and long9, (2) monomeric and short11 and (3) trimeric and short12. Long and short refer to the presence or absence of an INSERT segment in the nucleotide triphosphate binding domain, respectively (Figure S1). Specifically, we have studied two monomeric and long NMP kinases: adenylate kinase isolated from E. coli, AKeco, and human adenylate kinase isoform 3, AK3. The two enzymes phosphorylate adenosine monophosphate (AMP) by making use of GTP (in AK3) or ATP (in AKeco), respectively.
We have previously discovered principles for; (1) the molecular mechanisms of AKeco that governs selective recognition of ATP13, (2) nucleation of an induced fit transition by ATP14 and (3) negative selection of GTP13. In short, the key interaction for selective recognition of ATP is a hydrogen bond formed between N6 of the adenine base and the backbone carbonyl oxygen of Lys20013. This backbone mediated ATP recognition is conserved not only among NMP kinases which use ATP but also in eukaryotic protein kinases13, 15. Activation of AKeco by a large-scale conformational change of the ATP binding domain (ATPlid) is nucleated by formation of a cation-π (or stacking) interaction between the sidechain of Arg119 and the aromatic system of the adenine base14. This cationic “sensing” of the aromatic system of the substrate is conserved for NMP kinases14. Finally, the 60-fold difference of the catalytic activity of AKeco between ATP and GTP is attributed to a mechanism where GTP binds to and arrests the enzyme in an open and catalytically incompetent state13. Here, we focus on the molecular understanding of GTP recognition and GTP versus ATP selectivity of AK3. This enzyme is expressed in the human mitochondrial matrix10 and its role is to shuttle GTP into GDP as GDP is used by succinyl-CoA synthetase in the citric acid (TCA) cycle10. Through an integrative structural biology approach combining X-ray crystallography, NMR spectroscopy and molecular dynamics simulations, we reveal the molecular mechanisms that underlie the GTP selectivity of AK3. In addition and by examining observations off non-linearity of chemical shifts in GTP and ATP titrations, we find that protein surfaces offer a general and weak affinity for both GTP and ATP.
MATERIALS AND METHODS
Expression and purification of human AK3.
The gene for AK3 (UniProt Accession ID: Q9UIJ7) was cloned into a pET24 plasmid and the protein was expressed in BL21 (DE3) E. coli cells. Two labeling schemes for NMR experiments were used: 2H, 13C and 15N triple labeling for samples used in sequential assignment and 15N labeling for chemical shift perturbation and binding experiments. Both types of labeling were performed by growing the expression cells in the M9 minimal media where suitable labeled nutrients were added. The triple labeling media was based on 100% D2O and used 13C glucose and 15NH4Cl as the sole sources for carbon and nitrogen respectively. For 15N-labeling, the medium was based on H2O with 15NH4Cl used as the sole source of nitrogen. The expressed protein was purified using a two stage purification using first a Blue Sepharose (GE healthcare) column and in the second step a HiPrep 26/60 Sephacryl S-100 HR (GE healthcare) gel filtration column, the same procedure as for E. coli adenylate kinase published earlier16.
Activity of AK3.
The activity of AK3 was determined using a coupled enzymatic assay where the production of ADP and GDP was coupled to the oxidation of NADH to NAD+ using pyruvate kinase and lactate dehydrogenase. The oxidation of NADH was monitored by absorption spectroscopy at 340 nm17. Reaction rates, V (unit M s−1) were determined for substrate concentrations ranging between 0.6 and 220 μM. In all cases, 300 μM of the complementary substrate was used. 2 mM of MgCl2 was added to provide the essential Mg2+ ions to the enzyme. The reaction rates were normalized by the total enzyme concentration, [E]0 prior to analysis and KM and kcat where obtained by fitting of normalized reaction rates, , to the Michaelis-Menten equation (equation 1).
| (eq 1) |
In inhibition studies, 1.7 mM of ATP was added to the reaction mixture for the enzymatic assay, and the data were analyzed by non-linear fits of the data to different kinetic models. The modified Michaelis-Menten equation for the case of mixed inhibition is:
| (eq 2) |
where;
and
KI and KI´ corresponds to inhibition constants for non-competitive and competitive inhibition, respectively, and [I] corresponds to the concentration of the inhibitor ATP.
ITC.
Isothermal calorimetry titrations (ITC) were conducted using a MicroCal Auto-iTC200 at 25 °C. A solution of either 1.6 mM of ATP or 1.5 mM of GTP, was titrated into a solution of 140 μM AK3 in 20 steps up to 2:1 molar ratio of ligand to protein. Data was analyzed to determine dissociation constant (Kd), binding enthalpy (ΔH0), the binding entropy (-TΔS0), and binding ratio (n) using the analysis program provided by the ITC manufacturer. All experiments were conducted in 30 mM MOPS buffer at pH 7.0 supplemented with 50 mM NaCl. Three technical replicates were run to determine the accuracy of the measurements.
NMR.
All NMR experiments were recorded in a 30 mM MOPS buffer with 50 mM of NaCl at pH 7.0 with 7% D2O used in all samples to provide the lock signal. The temperature was 298 K or 25 °C for all experiments. Experiments for backbone assignments were recorded using 180 μl 700 μM 2H, 13C, 15N labeled AK3 in a 3 mm NMR tube. The experiments were acquired using targeted acquisition18 at a Bruker Avance III spectrometer operating at 800 MHz with a 3 mm cryoprobe at the Swedish NMR center, Gothenburg. The acquired data was processed using compressed sensing IRLS algorithm in the mddnmr software19, 20. AK3 sequential assignments were obtained by combining the targeted acquisition approach19, 21, 22 and automated assignment using the FLYA module of CYANA23. The assignments were manually checked and extended using CARA24. The assignments were deposited in Biological Magnetic Resonance Data Bank (BMRB ID: 50369).
To determine binding properties and chemical shift perturbations 15N-HSQC spectra were recorded using samples of 200 μM 15N-labeled AK3. Ligands were titrated into the sample over nine steps across a range of 50 μM to 20 mM. The spectra were recorded using either an 850 MHz Bruker Avance III spectrometer equipped with a 5mm HCN cryoprobe or a 600 MHz Bruker Avance III equipped with a BBO broadband cryoprobe. The chemical shift perturbations induced by each ligand were determined by comparing spectra with saturating concentration to spectra recorded in the absence of ligand (apo-state).
Binding data were analyzed by fitting of either a one-site model (equation 3) or a two independent sites model (equation 4) to the chemical shift induced by ligand binding as a function of the ligand concentration.
| (eq. 3) |
| (eq 4) |
Where Δω([L]) is the chemical shift change as a function of ligand concentration in PPM, Δωsat is the chemical shift change at saturating ligand concentration in PPM, [E] is the enzyme concentration in M, [L] is the ligand concentration in M, and Ka is the association constant (Kd−1) in M−1. In the two site model the 1 and 2 in Ka and Δωsat indicate the different sites.
The 1H and 15N chemical shifts of each amino acid residue with its peak assigned in the 15N-HSQC spectra were fitted against one or two, depending on the model, global Kas using a MatLab script written by the authors.
X-ray crystallography.
Purified AK3 was dialyzed against 50 mM NaCl and 30 mM 3-(N-morpholino)propanesulfonic acid (MOPS) buffer (pH 7.0) and concentrated to 15–18 mg·ml−1 using an Amicon ultracentrifugal filter device (Millipore; 3 kDa molecular weight cutoff) and co-crystallized at 18°C with a threefold excess of: P1 -(5’-guanosyl)-P5 - (5’-adenosyl) pentaphosphate (Gp5A), P1,P5-di(adenosine-5′)pentaphosphate (Ap5A), or ATP, using the vapor-diffusion hanging drop method. In general, crystallization drops of all three AK3-complexes contained between 0.1–1 μL of protein solution mixed with 0.1–1 μL of precipitant and equilibrated against 1 mL of precipitant solution containing for AK3-Gp5A: 20% isopropanol, 0.1 M NaCitrate pH 5.6 and 20% PEG 4000; for AK3-Ap5A: 0.2 M CaCl2, 0.1 M Tris-HCl pH 8.0 and 20% PEG 6000 (AK3-Ap5A); and for AK3-ATP: 0.2 M MgCl2, 0.1 M Tris-HCl pH 5.8, and 20% PEG 6000.
Crystals of hAK3-Ap5A and hAK3-ATP were cryo-protected in 30% PEG 6000 before vitrification in a N2 gas stream maintained at 100 K using a Cryostream Cooler (Oxford Cryosystems). Crystals of AK3-Gp5A were taken directly from the growing drop and vitrified. High-resolution synchrotron diffraction data at 100 K were collected at the ESRF laboratory (Grenoble, France), and using a Bruker Microstar-H rotating anode equipped with a Platinum 135 CCD Detector. Data were processed and scaled using XDS25, Pointless, and Aimless from the CCP4 suite26. Data- collection statistics are listed in Table 1. The phases for structure determination were obtained by molecular replacement using the program PHASER from the PHENIX suite27 and the AK3 structure (pdb code 1zd8, unpublished) as the search model. Noteworthy, the 1zd8 structure includes an ADP molecule that is not modelled in the coordinates, but clearly visible in the electron density. Analysis of the AK3-Gp5A diffraction data showed that molecules packed in the crystal were related with translational non-crystallographic symmetry (TNCS). PHASER automatically consider TNCS when detected in the diffraction data. However, in this case only 4 of the 6 protein molecules in the asymmetric unit were related with TNCS. Therefore, the structure was solved in two steps: First, the 4 structures related by TNCS were found, and secondly the remaining 2 protein molecules were found by i) including and fix the correctly placed 4 structures, and ii) inactivate the option to account for translational NCS in the PHASER program. All AK3-complex structures were built and refined using the programs COOT28 and PHENIX REFINE. The atomic coordinates and structure factors (pdb codes 6ZJB (hAK3-Gp5A), 6ZJD (hAK3-APT), and 6ZJE (hAK3-Ap5A)) were deposited in the Protein Data Bank, Research Collaboratory for Structural Bioinformatics, Rutgers University, New Brunswick, NJ (Hypertext).
Table 1.
Data collection and refinement statistics for three hAK3 complexes.
| Data-collection statistics | hAK3-Gp5A | hAK3-ATP | hAK3-Ap5A |
|---|---|---|---|
| Synchrotron /In-house | ESRF-ID29 | In-house | ESRF-ID23–2 |
| Wavelength (Å) | 0.976 | 1.5418 | 0.873 |
| Space group | P1 | P21 | P21 |
| Unit-cell parameters (Å,°) | 45.47, 66.76, 105.91 |
42.52, 62.52, 49.80 |
42.72, 62,64, 50.15 |
| 93.79, 93. 96, 89.71 | 90.0, 108.21, 90.0 | 90, 108.01, 90 | |
| Resolution limitsa (Å) | 45.35–1.88 (1.95–1.88) | 26.86–1.75 (1.81–1.75) | 42.72–1.48 (1.53–1.48) |
| No. of unique reflections | 103037 (9068) | 45601 (2335) | 39892 (3174) |
| Multiplicity | 1.9 (1.8) | 7.0 (1.9) | 6.0 (4.3) |
| Completeness (%) | 93.1 (80.9) | 96.2 (79.9) | 95.1 (76.1) |
| Rmerge | 0.064 (0.644) | 0.058 (0.420) | 0.050 (0.852) |
| RPIM | 0.093 (0.600) | 0.023 (0.203) | 0.033 (0.707) |
| <I/σ (I)> | 7.3 (1.1) | 22.3 (4.4) | 14.9 (1.3) |
| CC1/2 | 0.995 (0.632) | 0.999 (0.887) | 0.999 (0.521) |
| R factor (%) | 0.200 (0.361) | 0.169 (0.276) | 0.161 (0.215) |
| R free (%) | 0.255 (0.433) | 0.222 (0.326) | 0.198 (0.283) |
| No. of protein atoms | 10429 | 1772 | 1867 |
| No. of water molecules | 773 | 432 | 308 |
| No. of ligand atoms | 354 | 69 | 61 |
| Bond length (Å) | 0.014 | 0.010 | 0.009 |
| Bond angles (°) | 1.59 | 1.24 | 1.05 |
| Clash score | 5.27 | 2.17 | 3.3 |
| Residues in most favored regions (%) | 99.1 | 100.0 | 100.0 |
| Residues in disallowed regions (%) | 0.0 | 0 | 0.0 |
| Average B-factor protein (Å2) | 38.4 | 17.4 | 27.4 |
| Average B-factor ligands (Å2) | 29.7 | 24.4 | 60.5 |
| Average B-factor solvent (Å2) | 36.2 | 29.5 | 42.0 |
| PDB code | 6ZJB | 6ZJD | 6ZJE |
Values in parenthesis are for the high-resolution shell. Resolution limits were determined by applying a cut-off based on the mean intensity correlation coefficient of half-datasets, CC1/2.
Molecular dynamics (MD) simulations.
Atomic coordinates for the Gp5A-bound AK3 were based on the X-ray structure determined in the present study (PDB code: 6ZJB), and the model for the Ap5A-bound Adk was based on the PDB X-ray structure (PDB code: 1AKE)29. Protonation states of the residues with titratable groups were determined from their pKa values in water while the protonation of the histidine imidazole side chain was assigned to maintain the optimal hydrogen bond network within the protein. The ATP, AMP, and GTP ligands were re-constructed from the inhibitor coordinates by the removal of one phosphate group. The systems were solvated in a 69 Å (AK3) and 72 Å (AKeco) cubic box with explicit water model TIP3P30, followed by removal of any water molecule that overlapped with the protein atoms. 0.15 M of NaCl buffer was added to neutralize each protein, and the salt ions were distributed throughout the solvent phase randomly. The systems’ total number of atoms were 30,372 (AK3) and 36,245 (AKeco), respectively. All atoms were described with the CHARMM2731, 32 force field parameters, and the CMAP33, 34 correction was applied to the backbone dihedrals to maintain structural stability of the protein.
MD simulations were performed for 500 ns using the leap-frog Verlet scheme with a 2 fs integration timestep following application of the SHAKE35 algorithm to constrain all bonds to hydrogen atoms. Throughout the simulation, the temperature and pressure of the systems were maintained at 300 K and 1 bar with the Langevin thermostat and piston methods36. Electrostatic interactions were handled by the particle mesh Ewald summation (PME) method37 with the real-space cutoff distance of 12 Å. The force-based switching function was used for the evaluation of the van der Waals interactions between 10 Å and 12 Å. The energy minimization and equilibration were performed using the CHARMM c42a238 while the production MD was handled by the OpenMM239 with GPU acceleration.
RESULTS & DISCUSSION
Catalytic GTP versus ATP selectivity of AK3.
AK3 displays a distinct preference for GTP over ATP as a substrate in the phosphorylation of AMP (Figure 2), revealed by their quantification with a coupled ATPase assay17. Substrate turnover by AK3 follows Michaelis-Menten kinetics, and (57 ± 2 s−1) and KM (10 ± 1.5 μM) are on the same order of magnitude as previously reported for AKeco40( of 360 ± 10 s−1 and KM 63 ± 7 μM, respectively). In terms of the specificity constant, kcat/KM, the values are close to identical for the two enzymes with 5.7 ± 0.9 (s−1 μM−1) and 5.7 ± 0.7 (s−1 μM−1) for AK3 and AKeco, respectively. Nevertheless, the for AK3 is smaller by around 6-fold than of AKeco. As we show in the following sections, this is related to the dependence of kcat on the free energy of substrate binding. The ratio of the observed kcat values for AK3 defined as, equals to 41 ± 3 and again, this is similar to the ratio of kcat for ATP versus GTP turnover, .of 59 ± 17 reported for AKeco13. For AKeco we have demonstrated that the catalytic ATP versus GTP selectivity is predominantly dependent on the coordination of GTP to the enzyme in an open and catalytically inactive conformation13. Here, as we present below, we find that AK3 adopts a related mode of substrate selection mechanism.
Figure 2. AK3 is selective for GTP over ATP.
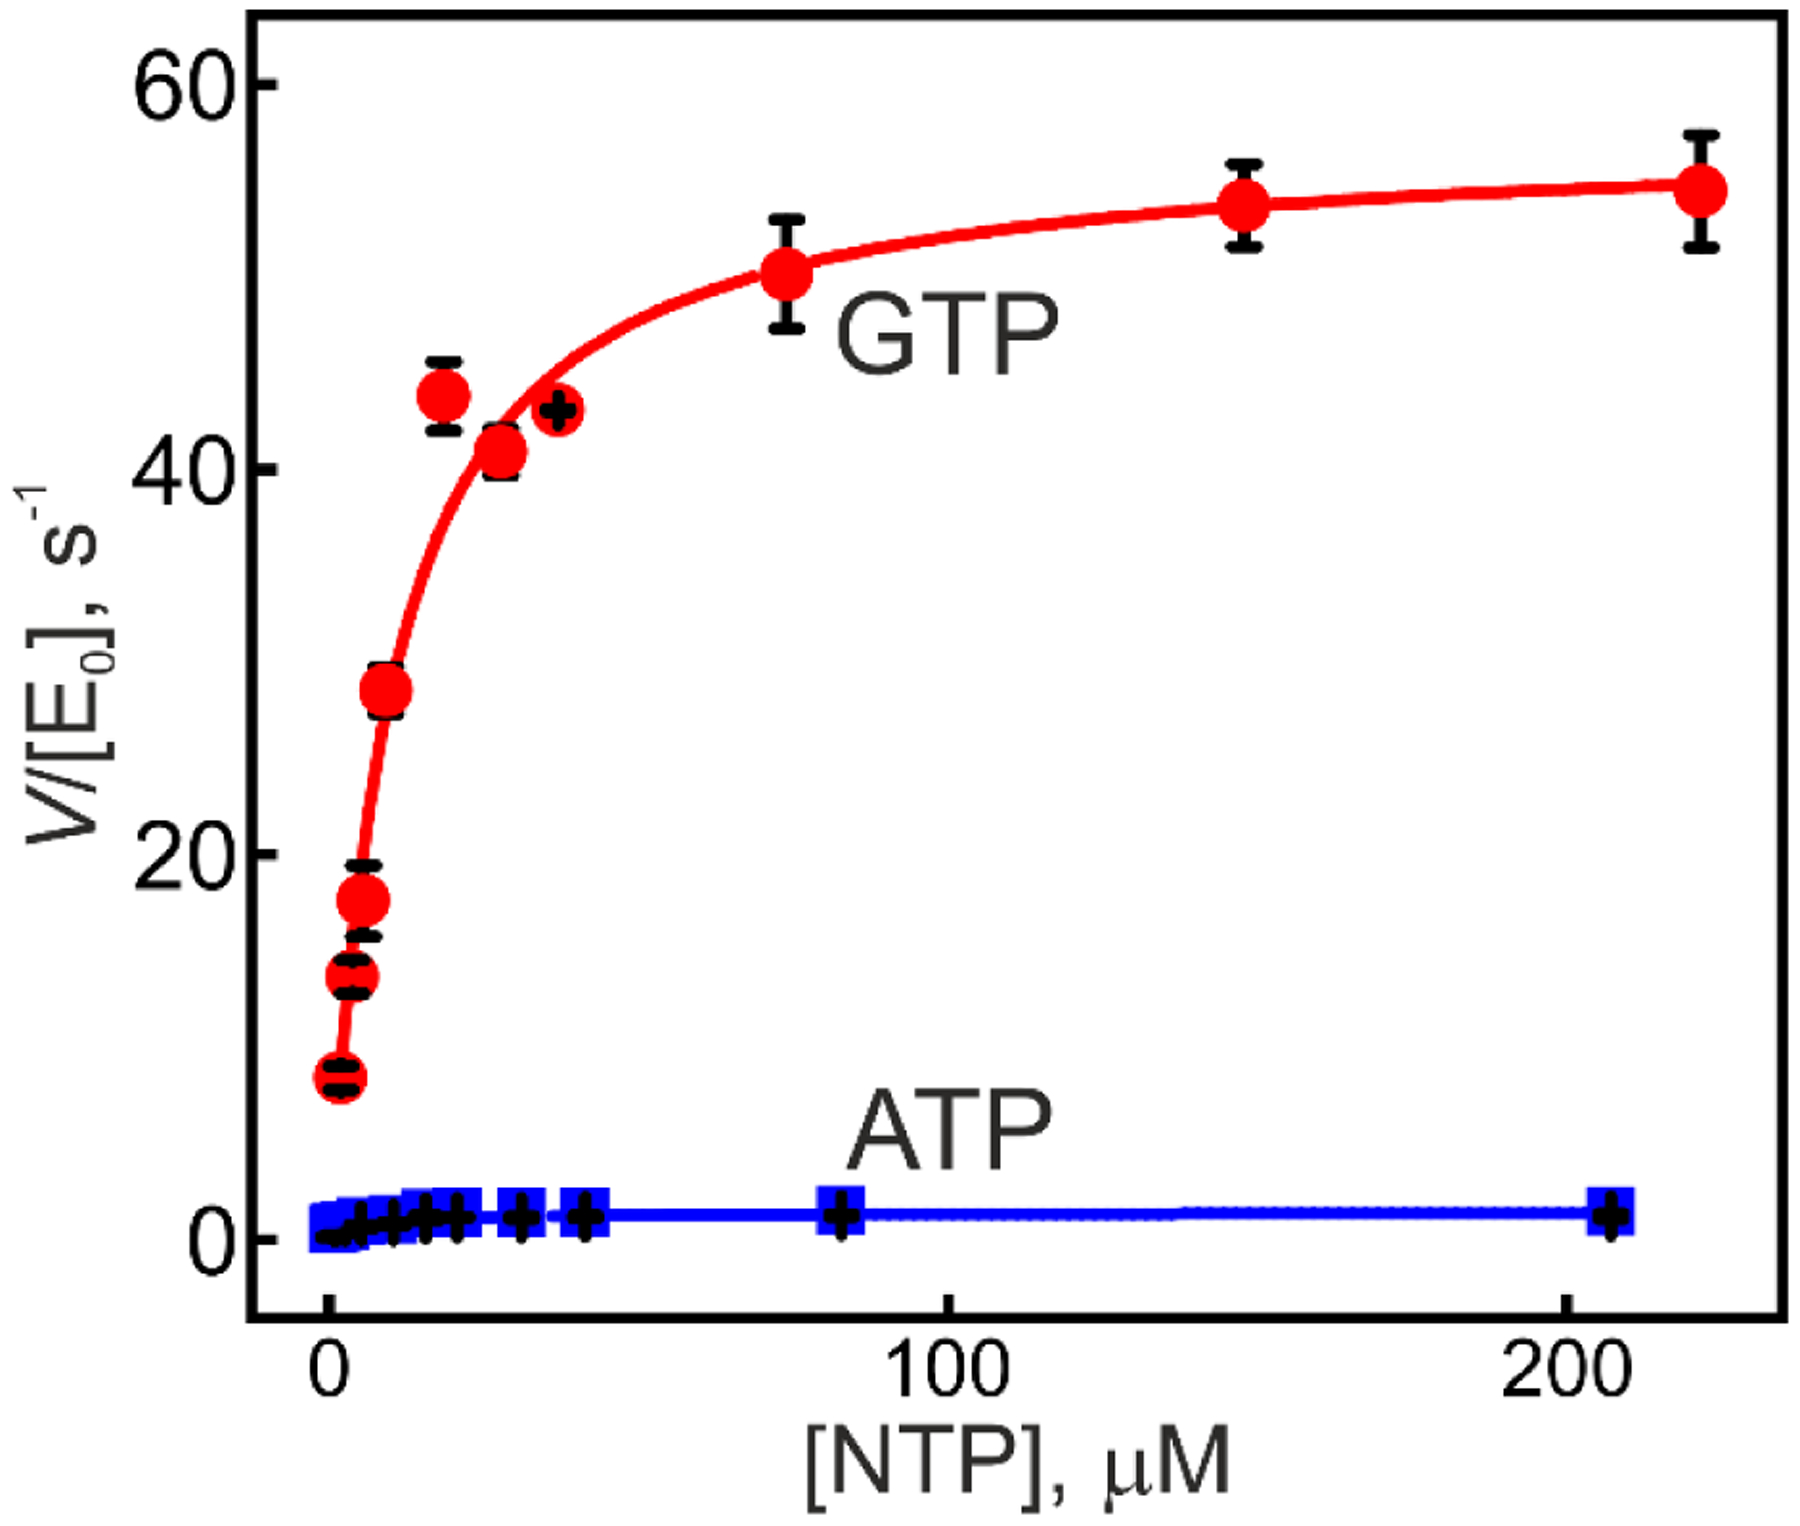
The phosphoryl donor capacity of GTP (red) and ATP (blue) were quantified at constant AMP concentration by using the coupled ATPase assay. The velocity of the reaction, V, as a function of substrate concentration is scaled with the total enzyme concentration ([E0]). Catalysis follows the Michaelis-Menten kinetics and the best-fitted curves (equation 1) are shown as solid lines, which asymptotically converge towards kcat=Vmax/[E0]. The errors are estimated as the standard deviations from three technical replicates.
Structural basis for GTP recognition by AK3.
In order to investigate substrate binding and GTP selectivity in AK3 we solved a 1.9 Å co-crystal structure of AK3 in complex with the bi-substrate mimic P1-(guanosine-5´)-P5-(adenosine-5´) pentaphosphate (Gp5A) (Figure 3A and Table 1). Gp5A is essentially a GTP molecule fused with an AMP molecule with an additional phospho-diester bond (Figure 3B). Thus, in contrast to the scenario with the endogenous substrates (GTP and AMP) containing four phosphorus atoms, the Gp5A molecule contains five phosphorus atoms and is therefore not a transition state mimic but rather a tight binding inhibitor. The co-crystal structure establishes that AK3 has the conserved NMP-kinase fold with two nucleotide binding domains (GTPlid and AMPbd) and a central core domain41. An overlay of the structure with that of closed AKeco in complex with P1,P5-di(adenosine-5’)pentaphosphate (Ap5A) demonstrates that AK3 is in a closed conformation in the Gp5A complex (Figure S2). Overall, the recognition of both the tri- and mono- nucleotide phosphates follows the patterns expected for an NMP kinase. The GTP moiety of Gp5A is sandwiched between residues in the GTPlid and core sub-domains and the AMP moiety is engulfed by residues in the AMPbd (Figure 3A).
Figure 3. Structural basis for GTP recognition by AK3.
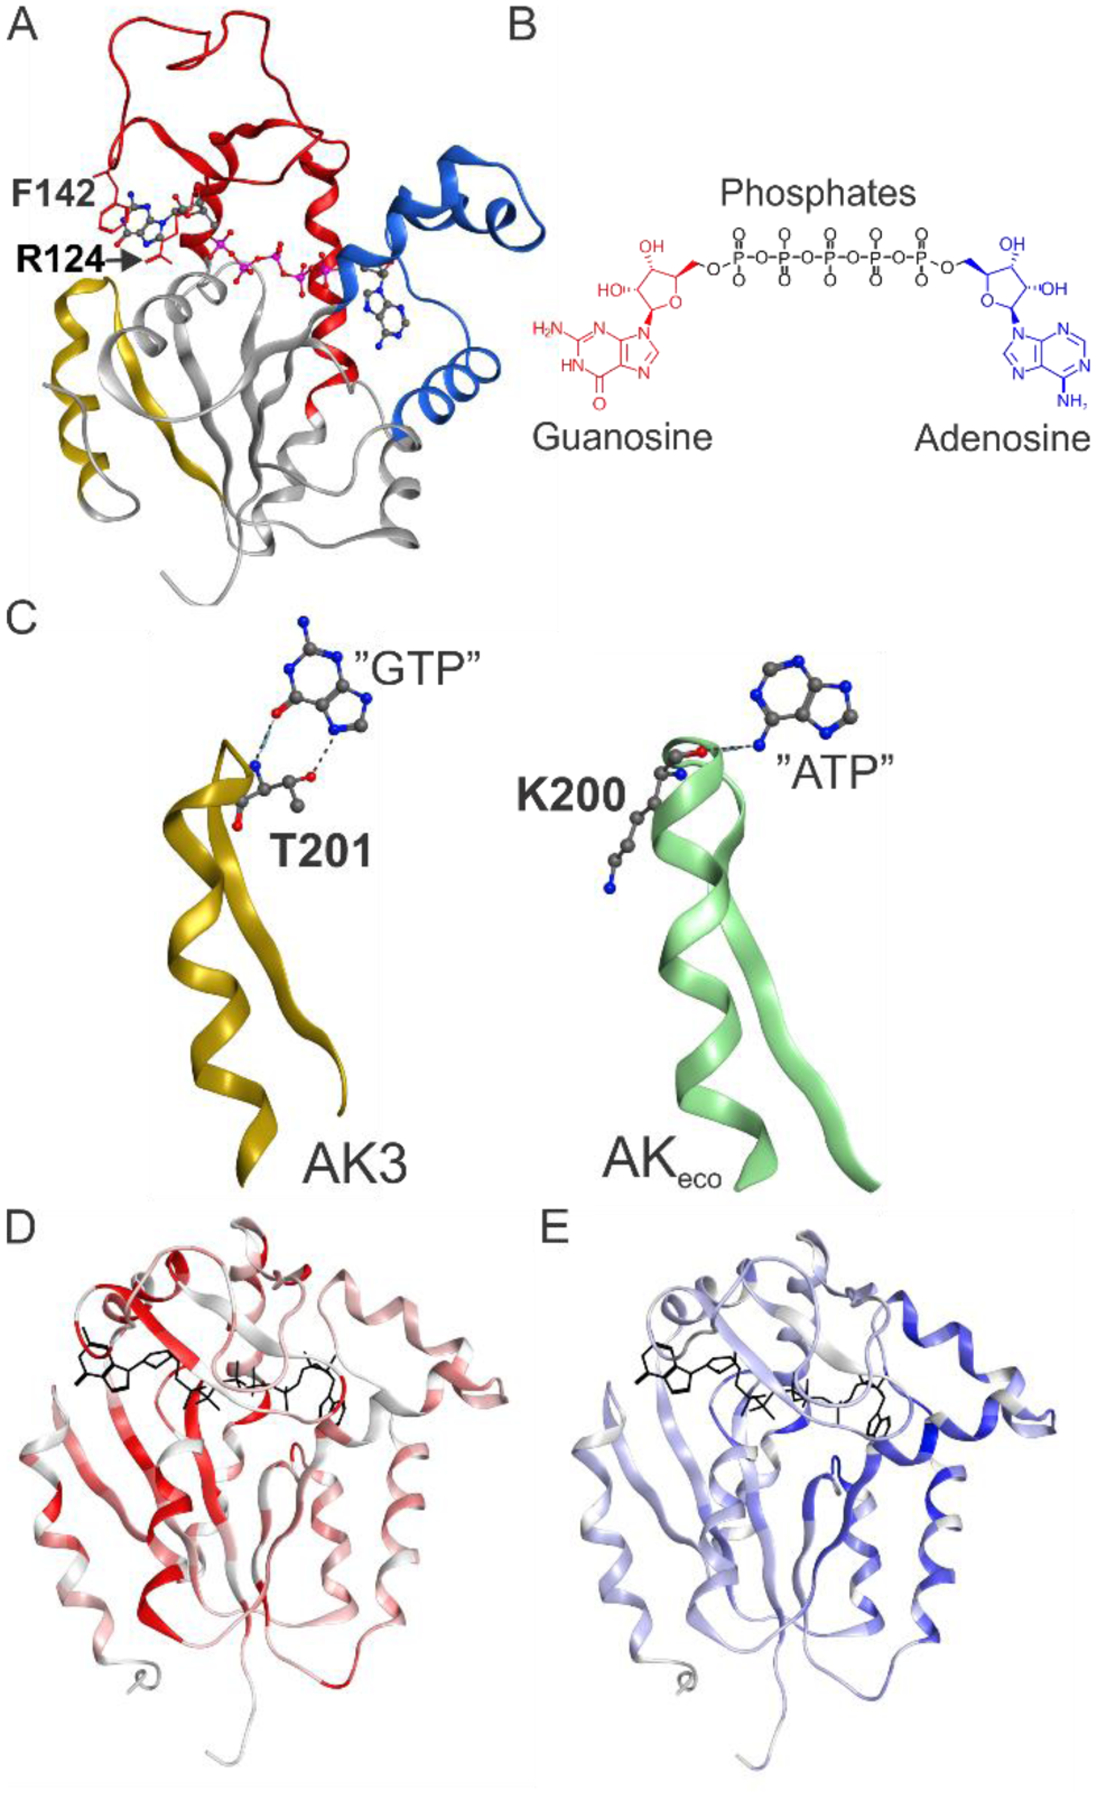
(A) 1.75 Å crystallographic structure of closed AK3 in complex with the inhibitor Gp5A. The GTP and AMP binding domains are colored red and blue, respectively, and the selectivity motif that specifically recognizes the O6 atom of guanosine is colored in gold. Phe140 and Arg124 that stack to the guanosine base are indicated. (B). Chemical structure of the inhibitor Gp5A. (C) Comparison of the GTP specific selectivity loop in AK3 with the corresponding ATP specific selectivity loop in AKeco (PDB ID: 1AKE). In AK3 the O6 atom of GTP is recognized by donation of a hydrogen bond from the backbone amide proton of Thr201. Furthermore, N7 is hydrogen bonded by the sidechain of Thr201. In AKeco the N6 atom of ATP is recognized by a hydrogen bond formed with the backbone carbonyl oxygen of Lys200. (D) Chemical shift perturbations for AK3 in response to GTP binding displayed on the closed AK3 structure. The red color intensity is proportional to the magnitude of the chemical shift perturbation. (E) Chemical shift perturbations for AK3 in response to AMP binding displayed on the closed AK3 structure. The blue color intensity is proportional to the magnitude of the chemical shift perturbation. See Figure S5 and S6 primary data.
The central element in AK3 catalysis is the specific recognition of the guanosine base. Inspection of the structure reveals two key interactions both of which follow the pattern identified previously for ATP recognition by AKeco13, 14. The first interaction is a hydrogen bond formed between the backbone amine of Thr201 and the O6 carbonyl oxygen in GTP (Figure 3C). The corresponding hydrogen bonding interaction in AKeco occurs between the backbone carbonyl oxygen of Lys200 and the N6 amine group of ATP (Figure 3C). The second interaction is the cation-π (or stacking) interaction between the aromatic ring of the guanosine base and Arg124 in the GTPlid domain (Figure 3A). The corresponding interaction in AKeco occurs between Arg119 in the ATPlid and the adenosine base14, and we have shown that this interaction nucleates the ATP dependent closure of the ATPlid in AKeco14. On basis of the critical role of backbone recognition of GTP by Thr201 in AK3 and ATP by Lys200 in AKeco, we denote the loop where they are located as the “selectivity loop”, which connects the C-terminal beta strand with the C-terminal alpha helix (Figure 3C). Taken together, the specific recognition of GTP and ATP has evolved by precise three-dimensional positioning of a hydrogen bond donor (the GTP case) or a hydrogen bond acceptor (the ATP case). Unlike AKeco, the selectivity loop of AK3 forms an additional hydrogen bonding interaction between the sidechain of Thr201 and the N7 nitrogen of GTP. This dual involvement of backbone and side-chain interactions from one amino acid residue is related to the recognition of GTP by H-Ras where the backbone and sidechain of Ser145, both hydrogen bond to the C6 oxygen42. In addition to these interactions the guanosine base is stacked in between Arg124 and Phe142 and this interaction is discussed below in conjunction with quantification of binding affinities.
A conserved feature of long NMP-kinases is that they exist in open substrate-free states and closed and active substrate bound states, where the closed states can be stabilized for instance with an inhibitor like Ap5A (Figure S3). It has been shown that substrate turn-over by AKeco is rate-limited by the transition from the closed to the open state in complex with bound substrate/product43, 44. Chemical shifts are sensitive markers for conformational states of proteins45–47 and large chemical shift perturbations are observed following saturation of AK3 with either GTP or AMP (Figures 3D, E and Figures S4–S6). To determine the spatial location of the shifted residues we assigned 90% of the backbone resonances of AK3 using a combination of targeted acquisition18 and both automated22 and manual assignment procedures. The accuracy of the assignments was validated by a comparison of the secondary structure elements predicted from chemical shifts with those from the co-crystal structure with Gp5A (Figure S4). This is indicative of substantial conformational changes for both nucleotide binding domains following substrate binding, comparable to the open to closed transition observed by AKeco48. Thus, although we do not have the atomic structure of substrate free AK3, the NMR observation indicates that AK3 has an open substrate-free structure as expected for an NMP kinase. On the other hand and consistent with the NMR observations, direct experimental observation of an open state of the GTPlid in AK3 is avaliable in crystallographic co-crystal structures of AK3 with both Ap5A and ATP as described in the next paragraph and in the section “Catalysis: Mixed inhibition of AK3 by ATP”.
Even though GTP is the endogenous substrate for phosphoryl transfer by AK3, the enzyme has residual activity also with ATP (Figure 2). In an attempt to understand the structural basis for this activity we determined a 1.5 Å crystal structure with the inhibitor Ap5A which is similar to Gp5A (Figure 4) but is fully symmetric with two adenosine bases. Ap5A has been an exceptionally useful compound in structural biology studies of ATP dependent NMP kinases in that it stabilizes the fully closed conformation29, 48. The most prevalent feature of the complex is that although the adenine moiety is correctly coordinated to the AMP binding domain the GTPlid fails to collapse over the adenosine moiety corresponding to ATP (Figure 4). Thus, the Ap5A complex provides the structure of the GTPlid in an open conformation. Inspection of three key residues important for coordination of GTP namely Thr201, Arg124 and Phe142 reveals that the adenosine base of ATP is in a position that is incompatible with recruitment of their respective and specific interactions. Specifically, the distance between the backbone NH atom of Thr201 and the N6 atom of the adenosine base is 5 Å which can be compared to the corresponding distance of 2.8 Å in the Gp5A complex. The open orientation of the GTPlid in the AP5A complex does not explain the residual ATP dependent activity of AK3, hence it is possible that the activity is explained by a small fraction of closed enzyme in complex with ATP in solution. On the other hand, it is possible that the AP5A co-crystal structure is resembling an encounter complex where a search for a specific hydrogen bond to the C6 substituent of the NTP has been interrupted due to the chemical difference in this position between ATP and GTP.
Figure 4. 1.5 Å co-crystal structure of AK3 with Ap5A.
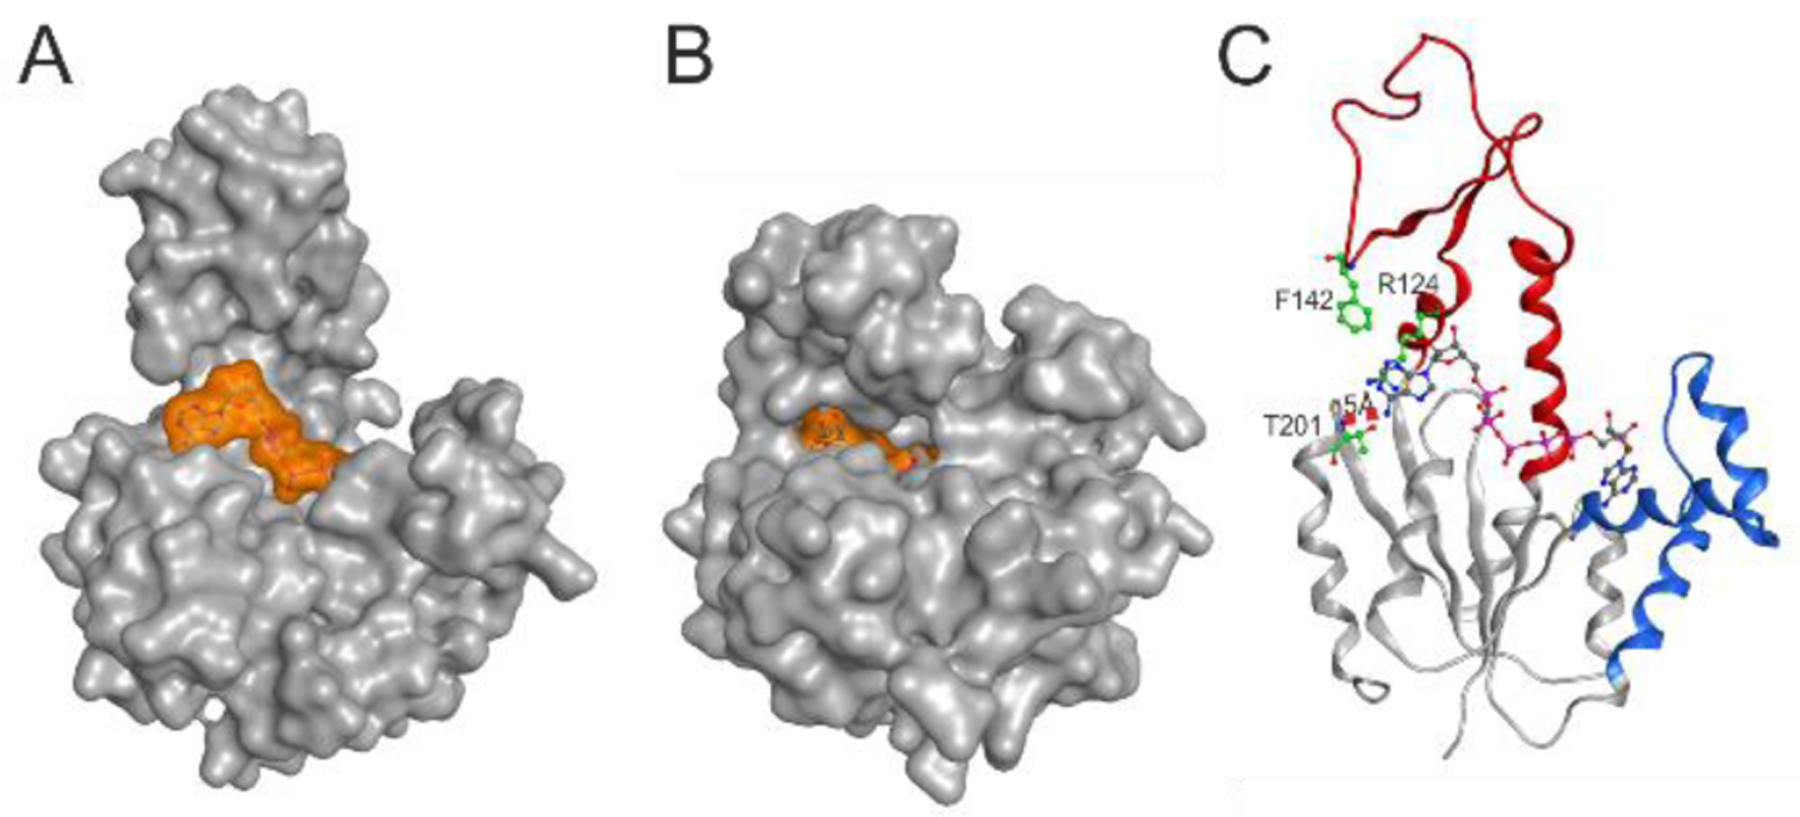
(A) Surface representation of AK3 in complex with Ap5A. AK3 is colored in gray and Ap5A is colored in transparent orange. (B) Surface representation of AK3 in complex with Gp5A. AK3 is colored in gray and Gp5A is colored in transparent orange. (C) Ribbon representation of AK3 in complex with Ap5A (ball & sticks). The GTPlid and AMPbd are colored in red and blue respectively. Key residues for the specific interactions with GTP (Arg124, Phe142 and Thr201) are highlighted together with the distance between the backbone NH atom of Thr201 and the N6 atom of the adenosine base corresponding to ATP.
Binding: GTP and ATP specific and non-specific effects.
Enzymatic catalysis following the Michaelis-Menten mechanism can broadly be divided into two consecutive steps corresponding to substrate binding and catalysis. These two fundaments of AK3 catalysis is explored in this and the following section. Equilibrium affinity measurements with isothermal titration calorimetry (ITC) reveal that GTP and ATP bind to AK3 with Kd values of ~2 and ~13 μM, respectively (Figure 5A, B & Table 2). Binding either of the two nucleotide triphosphates is enthalpically driven with a one to one stoichiometry and the overall thermodynamic signatures are very similar to each other. The binding affinity of AK3 for the “endogenous” substrate GTP is relatively high compared to the binding affinity of ATP to AKeco (Kd = 50 μM48. The tight binding of GTP to AK3 can be attributed to the ordered stacking formed between the guanosine base, Phe142, and Arg124 (Figure 5C). The equivalent stacking in AKeco is less well ordered and built up from, in addition to Arg119, several amino acid residues (Figure 5D). This is consistent with the molecular dynamics (MD) simulation results showing the tight stacking of GTP between Arg124 and Phe142 during the 500 ns MD simulations, whereas the corresponding MD simulations with ATP for AKeco show larger fluctuation of the ATP base and Arg119 (Figure 6 & S7). In addition, this difference results in a larger overall RMSD than the corresponding value of AK3 (Figure S8).
Figure 5. Quantification of GTP, ATP and AMP binding affinities to AK3.
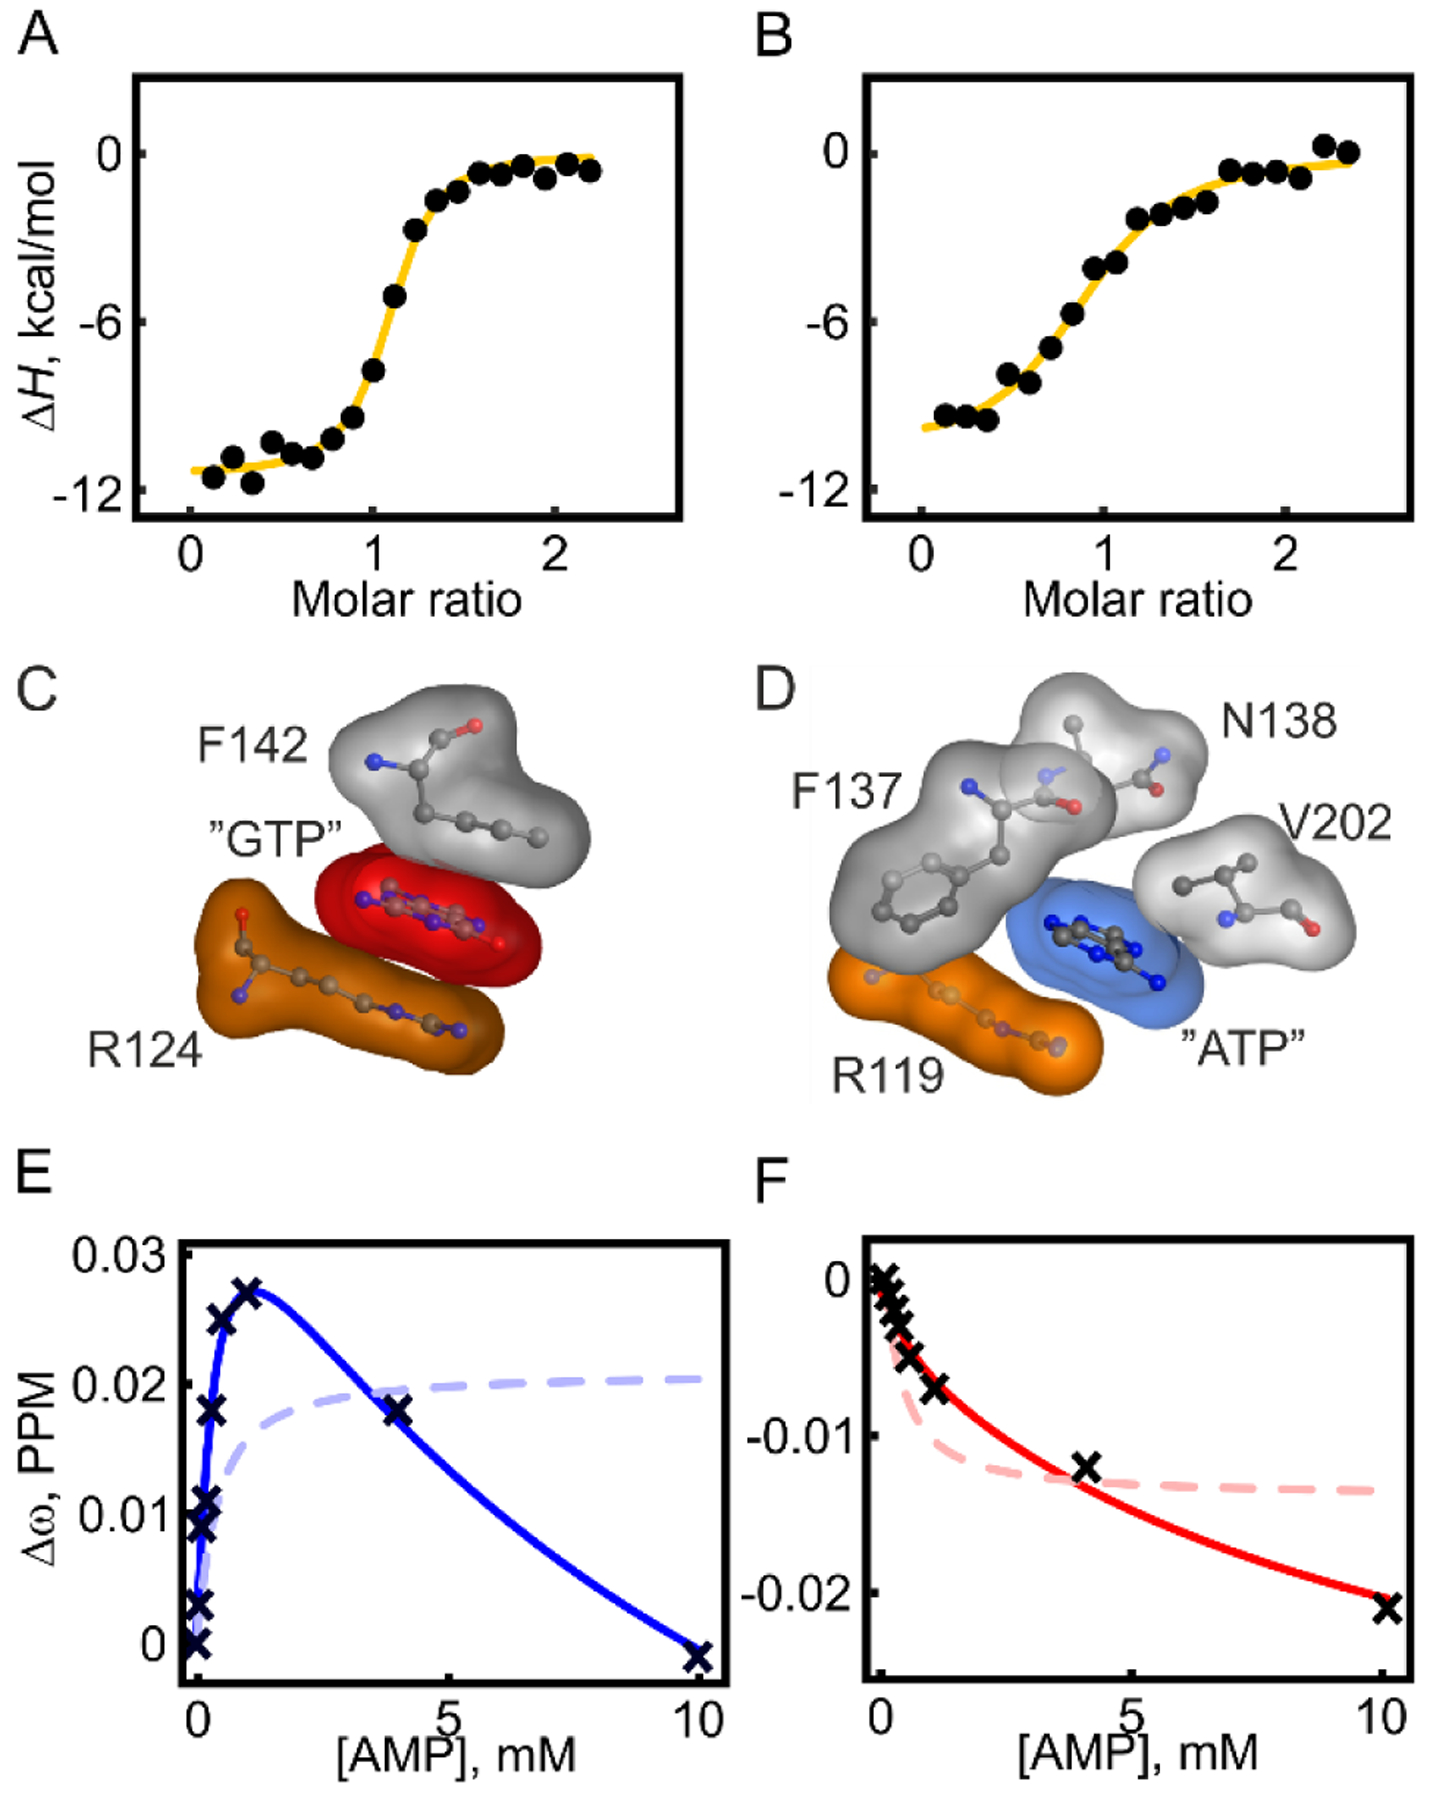
Dissociation constants (Kd) were quantified with ITC for GTP and ATP and with NMR spectroscopy for AMP. The choice of technique is dependent on the magnitude of the Kd values, i.e. ITC for stronger binding and NMR for weaker binding. (A) ITC quantification of GTP binding, shown are integrated heats of injections together with the best fitted one-site binding model (yellow line). (B) ITC quantification of ATP binding (details as in A). (C) Structural details of the stacking of the guanosine base (red transparent surface) between Phe142 and Arg124 in AK3. (D) The corresponding interaction network for the adenosine base (blue transparent surface) in AKeco (1AKE29) consists of Arg119, Phe137, Asn138 and Val202. (E, F) NMR detected binding of AMP at residue Asp94. One-site (equation 2, dashed line) and two-sites (equation 3, solid lines) binding models were fitted to both 15N chemical shifts (E) and 1H chemical shifts (F).
Table 2.
Thermodynamics for binding of GTP and ATP to AK3
| Kda) | n | ||||
|---|---|---|---|---|---|
| GTP | 2.1 ± 0.5 | −11.3 ± 0.3 | 3.5 ± 0.4 | −7.8 ± 0.1 | 1.07 ± 0.025 |
| ATP | 13 ± 2 | −11.1 ± 0.5 | 4.4 ± 0.6 | −6.7 ± 0.1 | 0.94 ± 0.015 |
Reported values and standard deviations are averages based on three technical replicates
Figure 6. Variation of atomic displacement from the average position in AK3 and AKeco.
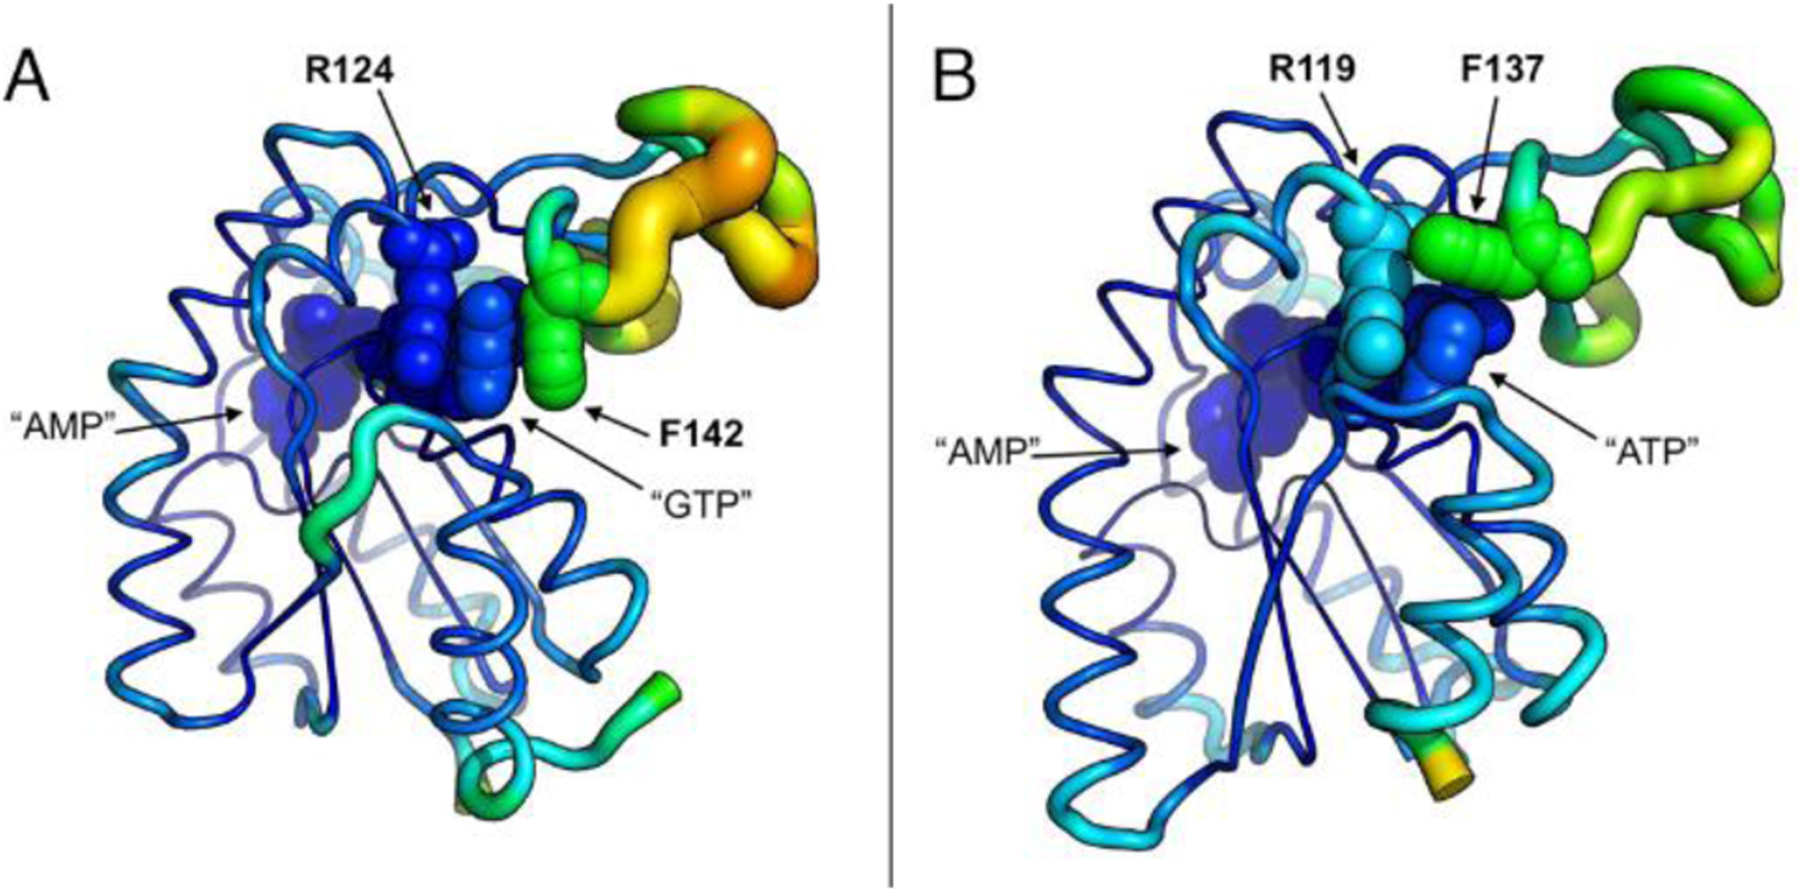
RMSF values for the backbone atoms are used to quantify AK3 and AKeco flexibility over the course of 500 ns MD simulation and projected on the respective average structures. The color scale ranging from blue to orange represents a transition from the most rigid to the most flexible end of the spectrum. (A) The structure of AK3 in complex with the AMP and GTP ligands. The stacking interaction of Arg124 and Phe142 effectively arrests the GTP base in place despite high mobility of the enclosing GTPlid domain. (B) The structure of AKeco in complex with the AMP and ATP ligands. Atomic fluctuations of the ATPlid are weaker than those in AK3, but penetrate deeper into the ATP binding region, and include Arg119 which fails to maintain a stable stacking with the ATP base, thus making it discernibly more flexible than the GTP base.
For AMP binding, due to the relatively low binding affinity, this event was quantified with NMR spectroscopy. A number of residues displayed curved chemical shift perturbation patterns indicating the existence of two binding events with distinguishable binding affinities (Figure 5E, 5F). Fits to these data were improved from a statistical standpoint (F-test) by invoking two independent binding sites and the resulting Kd vales were 210 ± 7 μM and 4.8 ± 0.2 mM, respectively. The stronger binding affinity is close to the Kd for AMP binding to AKeco (210 ± 66 μM48).
In light of the weak secondary binding affinity of AK3 to AMP we investigated if similar effects were also present for ATP and GTP. For both ATP and GTP, curved chemical shift perturbation patterns were observed indicating at least two binding events with distinguishable affinities. For the first binding event, their binding affinities (Kd = 2 μM and 13 μM from ITC above) were too strong to be accurately quantified with NMR. On the other hand, the weak biding affinities could be quantified to be 1.7 ± 1 mM and 9.0 ± 3.8 mM for GTP and ATP respectively (Figure 7A, B). Since attractive interactions between any pair of molecules arise from the correlation between the motions of their electrons by London dispersion interactions49, we assumed that the weak binding events are due to non-specific interactions with the protein surface. To test this hypothesis, we quantified the ATP binding affinity of AKeco with its adenosine binding sites blocked with the tight binding inhibitor AP5A (Müller et. al.29 and Figure 7C). In this experiment the strong ATP binding event was absent while the weak binding event was preserved (12 ± 2.1 mM). We further tested the hypothesis by quantifying the ATP binding affinity of two proteins void of known ATP binding sites, human α-synuclein50, and LcrG51 from Yersinia pseudotuberculosis. Both proteins displayed chemical shift perturbation patterns indicative of weak ATP binding events (Figure 7D, E). The resulting affinities were 13 ± 2.4 mM and 12 ± 0.8 mM for α-synuclein and LcrG, respectively. Together, we conclude that the weak binding affinity of ATP and GTP observed by NMR is due to non-specific interactions with protein surfaces.
Figure 7. Non-specific binding of GTP and ATP to protein surfaces.
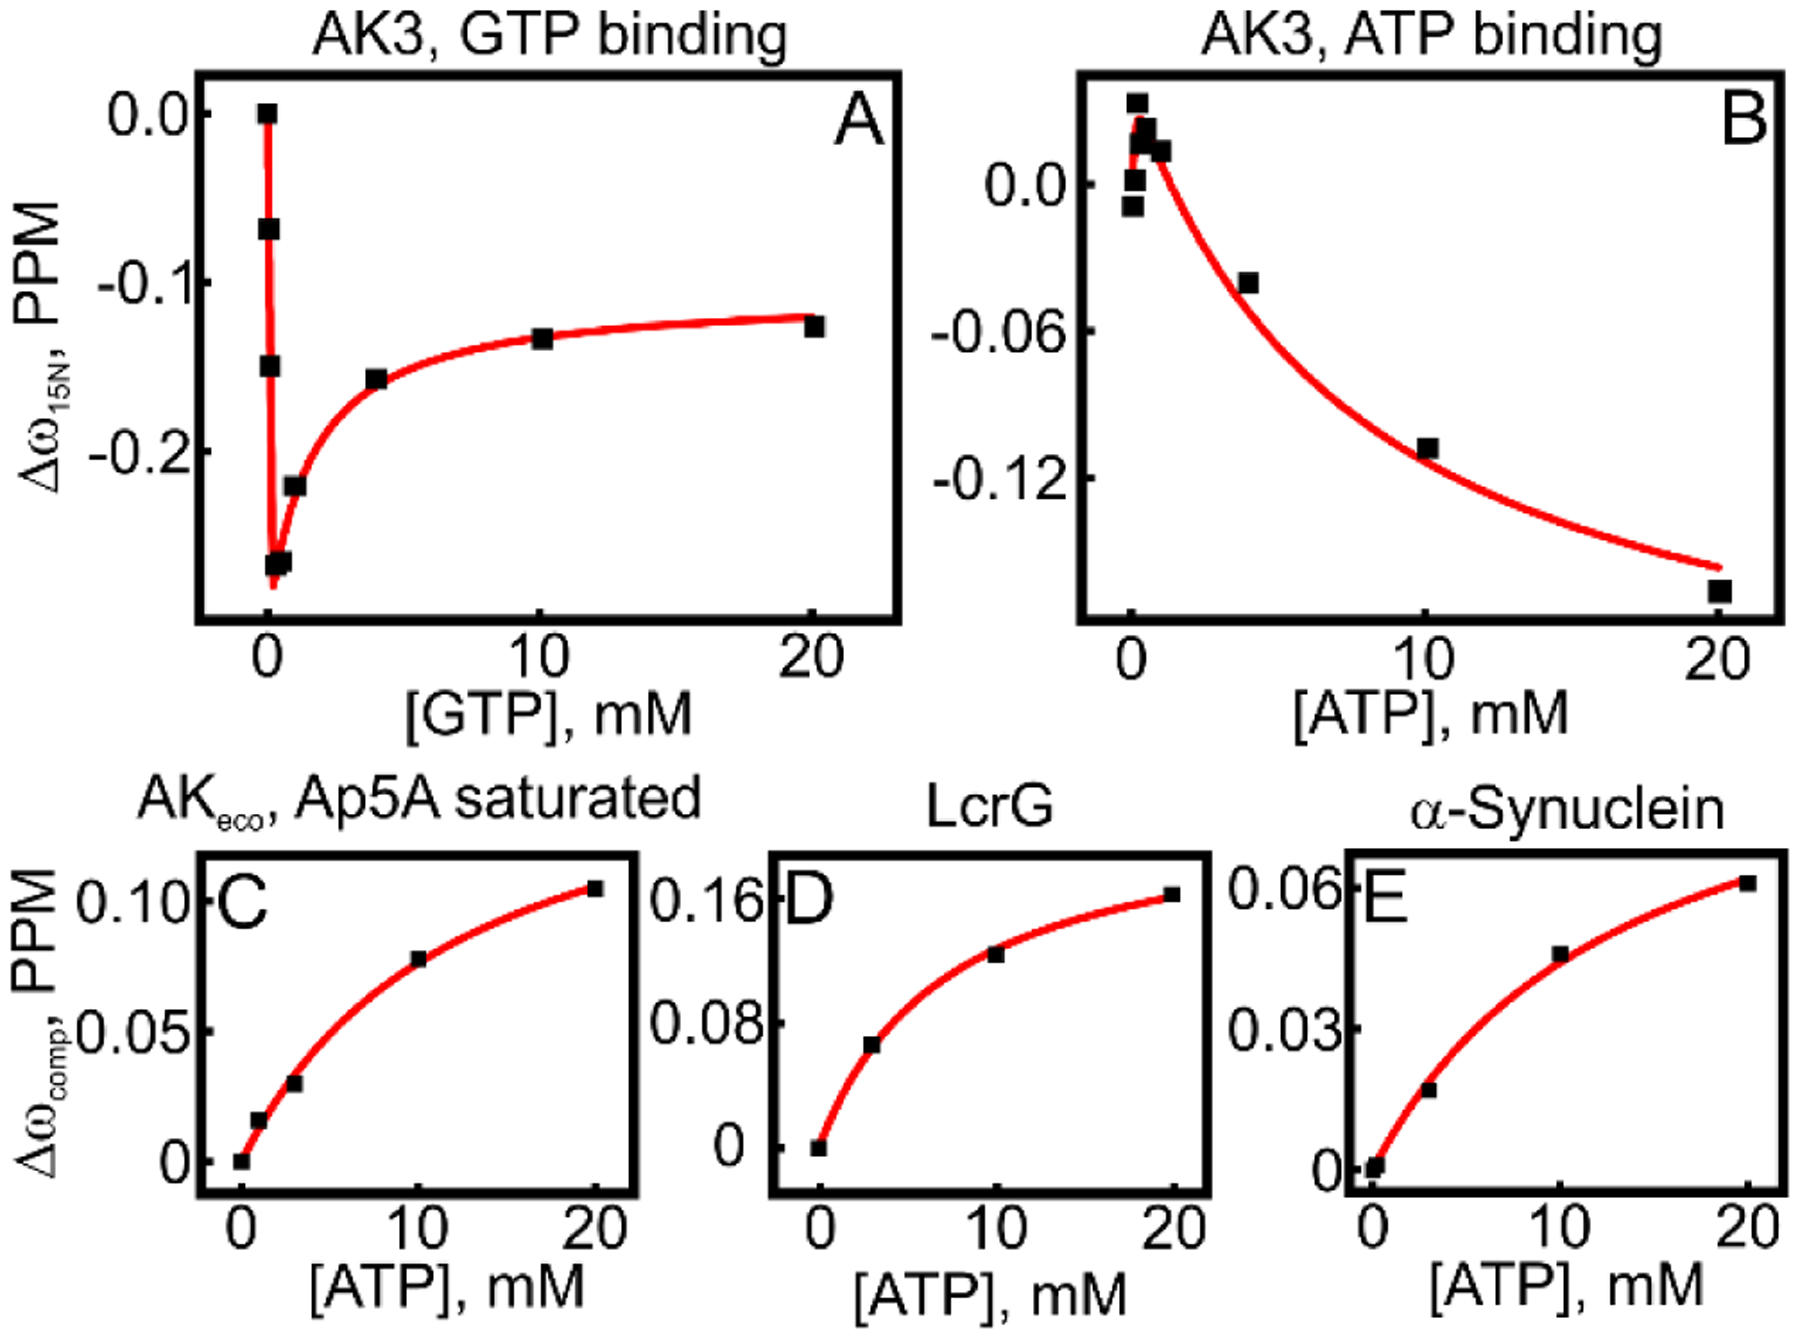
Weak binding affinities of GTP to AK3 and ATP to three different proteins, in addition to AK3, were quantified with NMR spectroscopy. In all panels the GTP or ATP induced chemical shift perturbations for one example amino acid residue are shown against the ATP/GTP concentration. (A) and (B) GTP and ATP binding curves to AK3 fitted to a two-site model (equation 4) are shown by the red line. (C) ATP binding to AKeco where the endogenous ATP and AMP binding sites have been occluded by presence of excess of the tight binding inhibitor Ap5A. (D) ATP binding to the Yersinia pseudotuberculosis protein LcrG. (E) ATP binding to the human protein α-synuclein. In C-E the best fitted one-site model (equation 3) is shown as a solid red line.
The core of our catalytic model for the NMP kinase AKeco is that the turnover of substrates is rate-limited by product release, caused by the slow opening of substrate binding sub-domains43, 44. It should also be noted that there exists a contradicting model where ultra-fast opening and closing dynamics are utilized by AKeco to stochastically populate a catalytically competent state52. In line with our model, we have previously established a thermodynamic signature for this rate limitation with a linear relation between free energy values of catalysis versus binding53. When displayed together with various AKeco variants, different substrates, and AKeco under different conditions, AK3 thermodynamics are consistent with the established linearity (Figure 8). Thus, we argue that AK3 substrate turn-over is rate-limited by product release and that the kcat of around 60 s−1 (compare to 360 s−1 for AKeco) is a consequence of the strong GTP binding affinity.
Figure 8. Linear free energy relationship between substrate turnover and binding affinities.
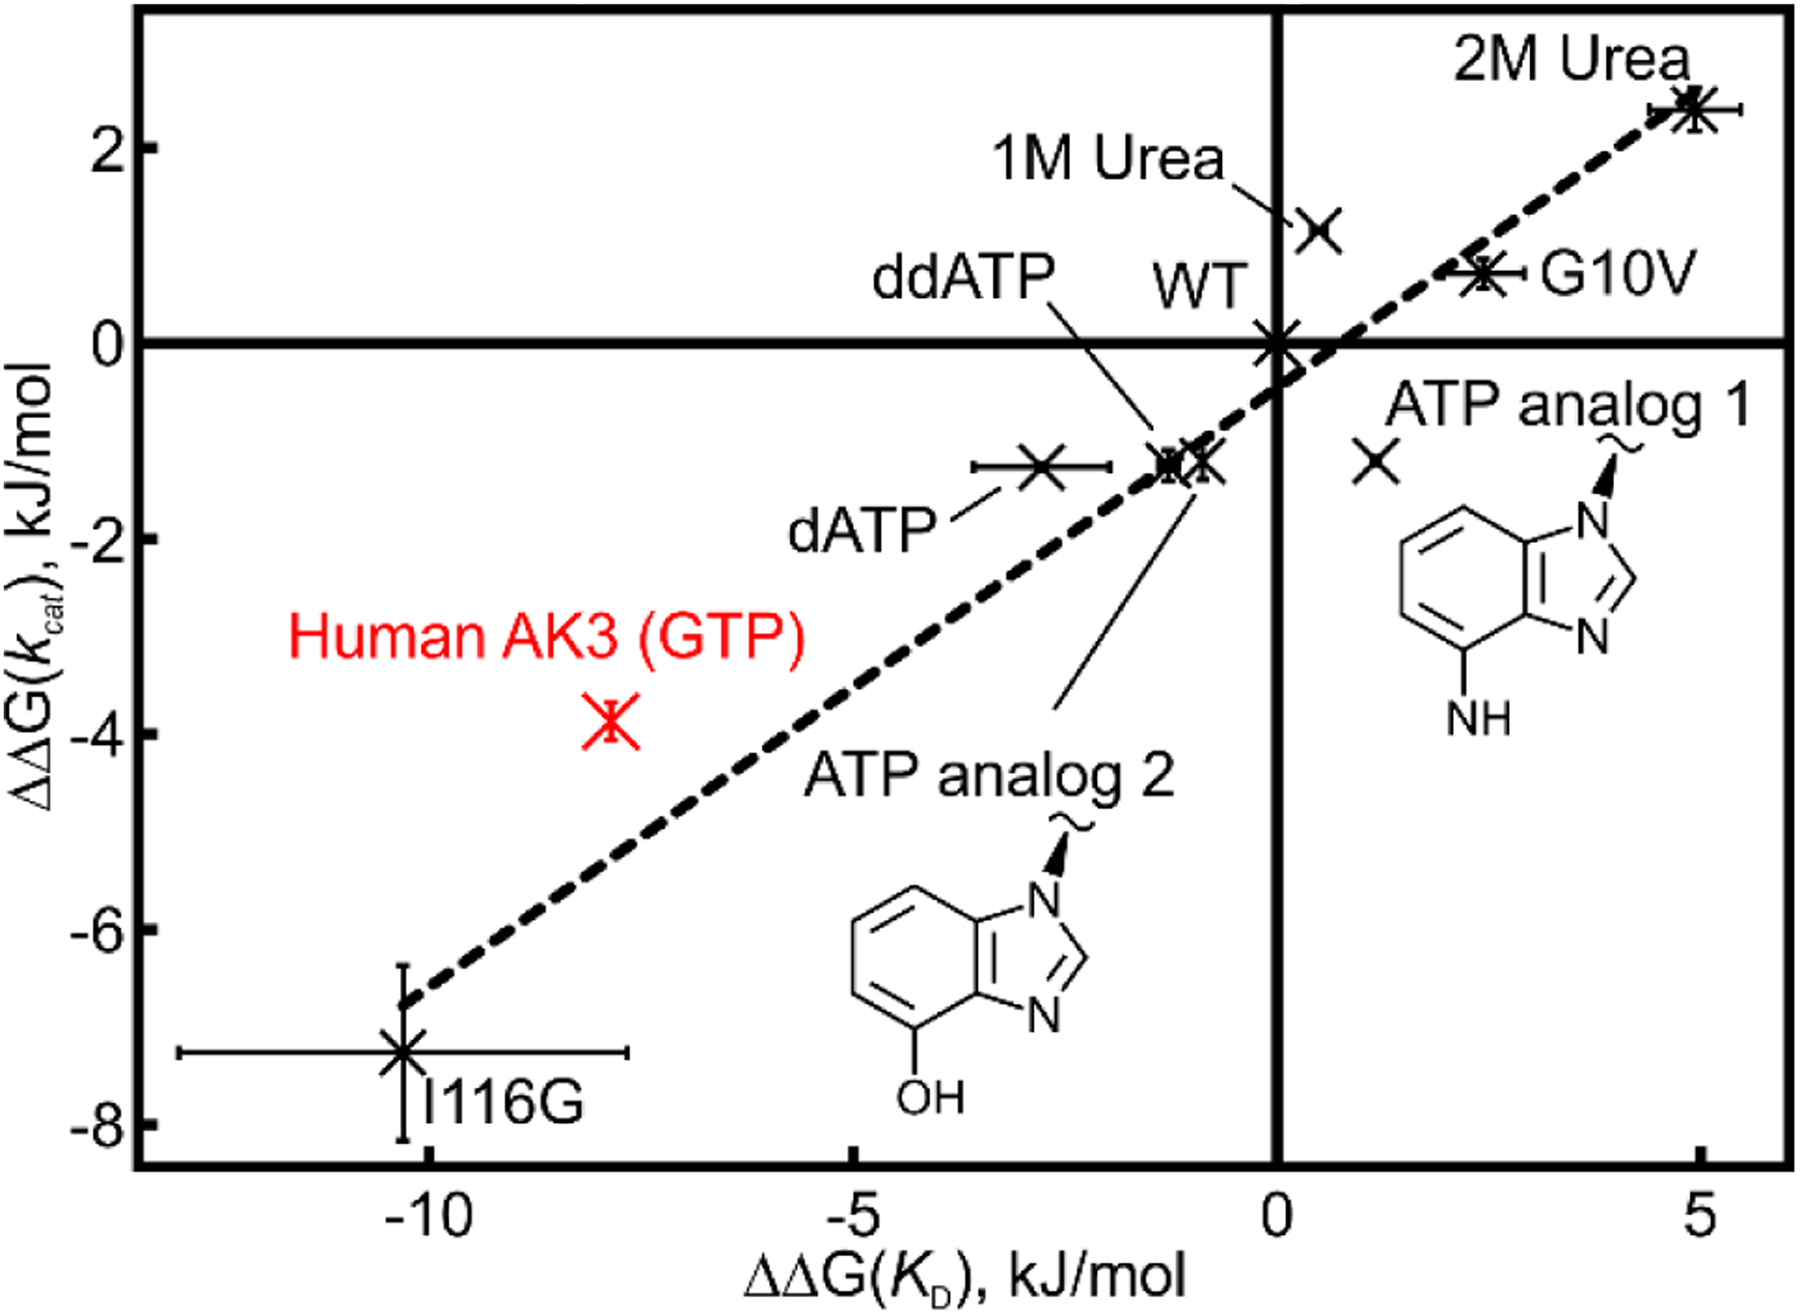
A linear free energy relationship between substrate turnover and binding affinity has previously been established for AKeco53. The ΔΔG values are calculated relative to wild-type AKeco. In the original representation of correlation we compared different AKeco variants and also wild-type AKeco performed in different urea concentrations. Here the corresponding values for AK3 were added to the correlation and it is evident that AK3 follows the general energetic relationship as observed for AKeco. In addition, values for AKeco catalysis with modified nucleotide tri-phosphates have been added. These variants include dATP, ddATP and two designed ATP analogs (analogs 1 & 2) where analog 1 has the hydrogen bond donor at C6 replaced from “NH2” to “OH” and analog 2 has the N1 and N3 nitrogens replaced with carbons. Analog 2 was used previously in our study of the inhibited AKeco:GTP complex13. The errors, in both dimensions, are estimated as the standard deviations based on three technical replicates.
Catalysis: Mixed inhibition of AK3 by ATP.
Although GTP is the endogenous nucleoside triphosphate used for phosphorylation by AK3, the similarity of the chemical structures between GTP and ATP (Figure 1) prompted us to explore the potential inhibitory power of ATP.
To this end, we employed the standard ATPase activity17 assay with a constant concentration of ATP (1.7 mM) and varying concentrations of either GTP or AMP, with a subsequent fit of the data to different kinetic models. These models included: (1) no changes to either kcat or KM, i.e. no inhibitory effect of ATP, (2) competitive inhibition, i.e. an increased observed KM (3) noncompetitive inhibition, i.e. a decreased observed kcat, and (4) mixed inhibition, i.e. an increased observed KM together with a decreased observed kcat. Fits to the four kinetic models for both variation of GTP and AMP are shown in Figure 9. It is evident that mixed inhibition models (eq.2 in materials and methods) provides the best explanation of the experimental data for both GTP and AMP and that in both cases the second best model was non-competitive inhibition. The statistical relevance for the improved fits in the mixed models were accessed with F-tests. In the case of GTP the F-value for mixed versus noncompetitive inhibition was 9.25 which makes the mixed inhibition model statistically relevant at the 90% confidence level (critical F-value equals 5.46). Likewise, in the AMP case the F-value for mixed versus noncompetitive inhibition was 50 which makes the mixed inhibition model statistically relevant at the 99% confidence level (critical F-value equals 31). For the scenario of mixed inhibition, the inhibition constants are defined as KI and KI´ for noncompetitive and competitive inhibition, respectively. For GTP variation, KI and KI´ were found to be 850 and 655 μM, respectively, whereas the corresponding values for AMP variation were 1700 and 200 μM. Among these inhibition constants, the strongest effect was observed for competitive inhibition of AMP with an inhibition constant of 200 μM.
Figure 9. ATP inhibition of AK3.
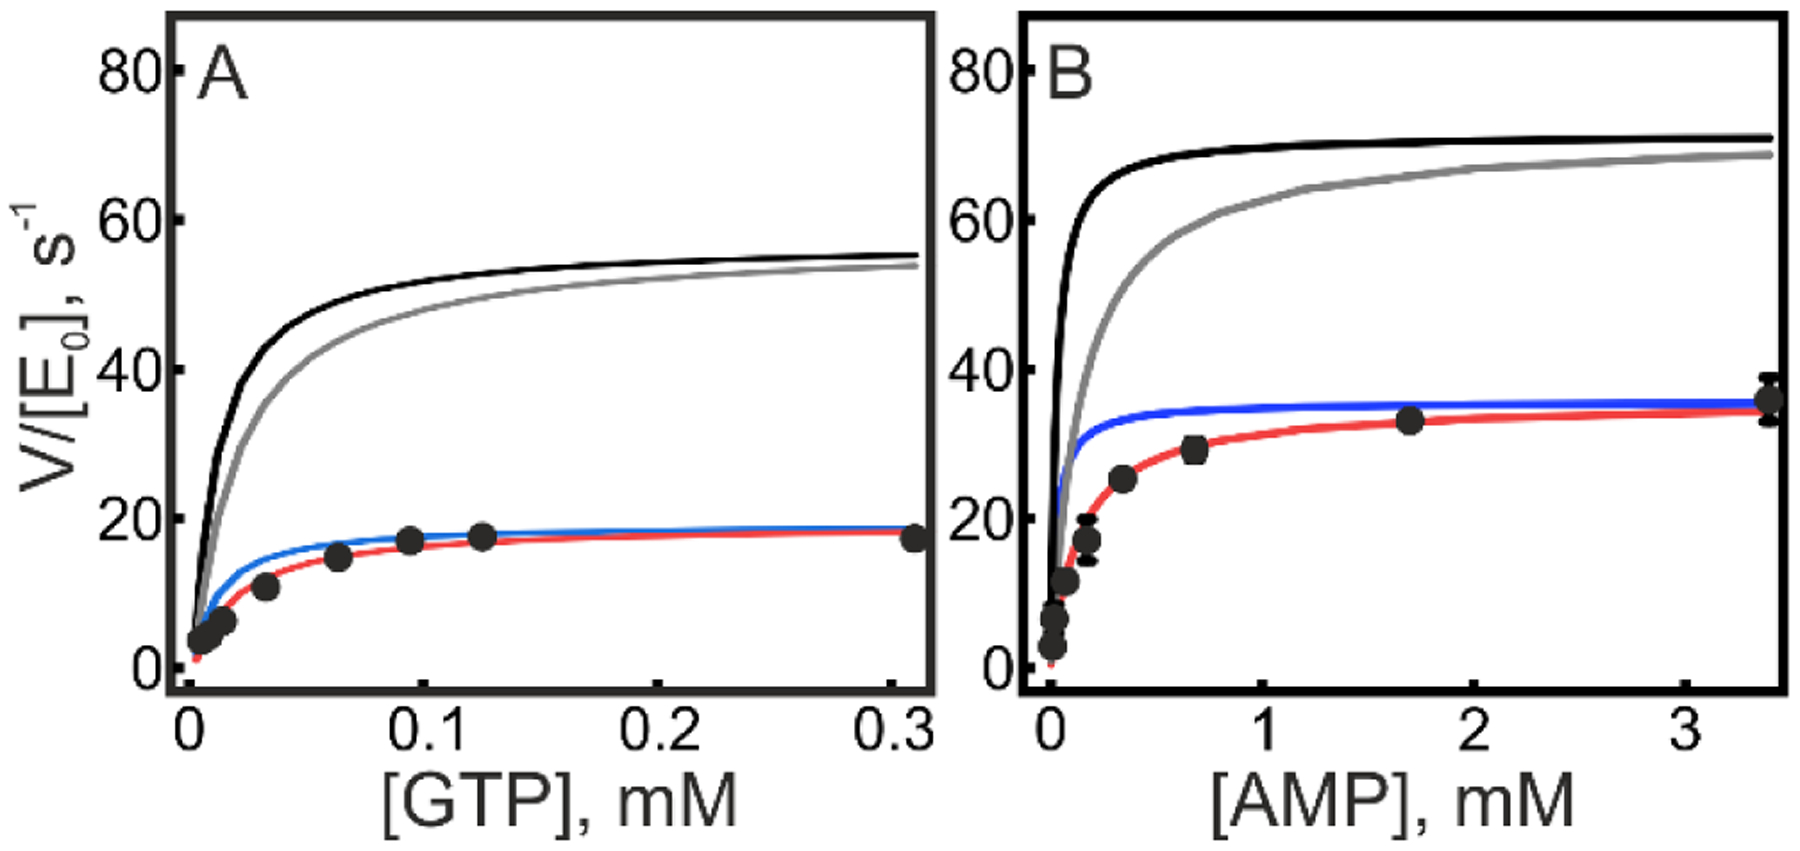
The effect on ATP (at 1.7 mM) on AK3 catalysis was quantified by fitting kinetic data from coupled ATPase assays to different models. Kinetic rates equal to V/E0 are plotted against (A) GTP concentration or (B) AMP concentration. The solid lines corresponds to fits to kinetic models as follows; black: no inhibitory effect of ATP, gray: competitive inhibition, blue: noncompetitive inhibition and red: mixed inhibition.
These ATP inhibition patterns implies that the binding of ATP likely interferes with the AMP binding site. To verify this model, we used solution state NMR chemical shift perturbation analysis. Structural changes were monitored by quantifying the ligand-induced changes in chemical shifts in 1H-15N HSQC experiments which provided a unique fingerprint of the structural state occupied by the protein under defined conditions. By comparing spectra of apo and ATP saturated AK3 (Figure S9), it is evident that the chemical shifts of a set of amino acid residues were significantly perturbed as expected for a binding process with Kd of 13 μM.
Quantitative analysis was performed by comparing the AK3 spectra in three defined states saturated respectively with AMP, GTP and ATP. Here the spectra of AK3 in complex with AMP and GTP served as reference states. The ATP saturated spectra showed a striking similarity with the AMP reference spectra while the resemblance of the GTP state was much weaker. This difference was quantified by linear regression of the chemical shifts of the ATP state with those of the reference states (Figure 10A, B). The analysis reveals a robust correlation (R2=0.93 and a slope of 1.06) between ATP and AMP chemical shifts whereas the ATP and GTP chemical shifts are essentially uncorrelated. Collectively, these NMR results demonstrate that the primary site of ATP binding is the AMP site. This binding mode is consistent with the competition pattern observed for ATP against GTP and AMP (Figure 9) and also with the inability of AK3 to close its GTPlid over Ap5A (Figure 4). In order to determine the molecular details of ATP binding to the AMP site, we solved a 1.75 Å co-crystal structure of AK3 in complex with ATP. As predicted from the NMR analysis the structure has ATP coordinated to the AMP between AK3 and the adenosine group in the ATP inhibited structure is very similar to the pattern observed in the closed structure in complex with Gp5A. Taken together, we have discovered the molecular underpinning of the inhibitory effect of ATP on AK3 catalysis from a combination of enzymatic assays, NMR and x-ray crystallography. The mechanism of ATP inhibition by binding to the AMP site is dependent on the bi-substrate nature of AK3 catalysis and the chemical similarity between ATP and AMP.
Figure 10. Structural basis for ATP inhibition of AK3.
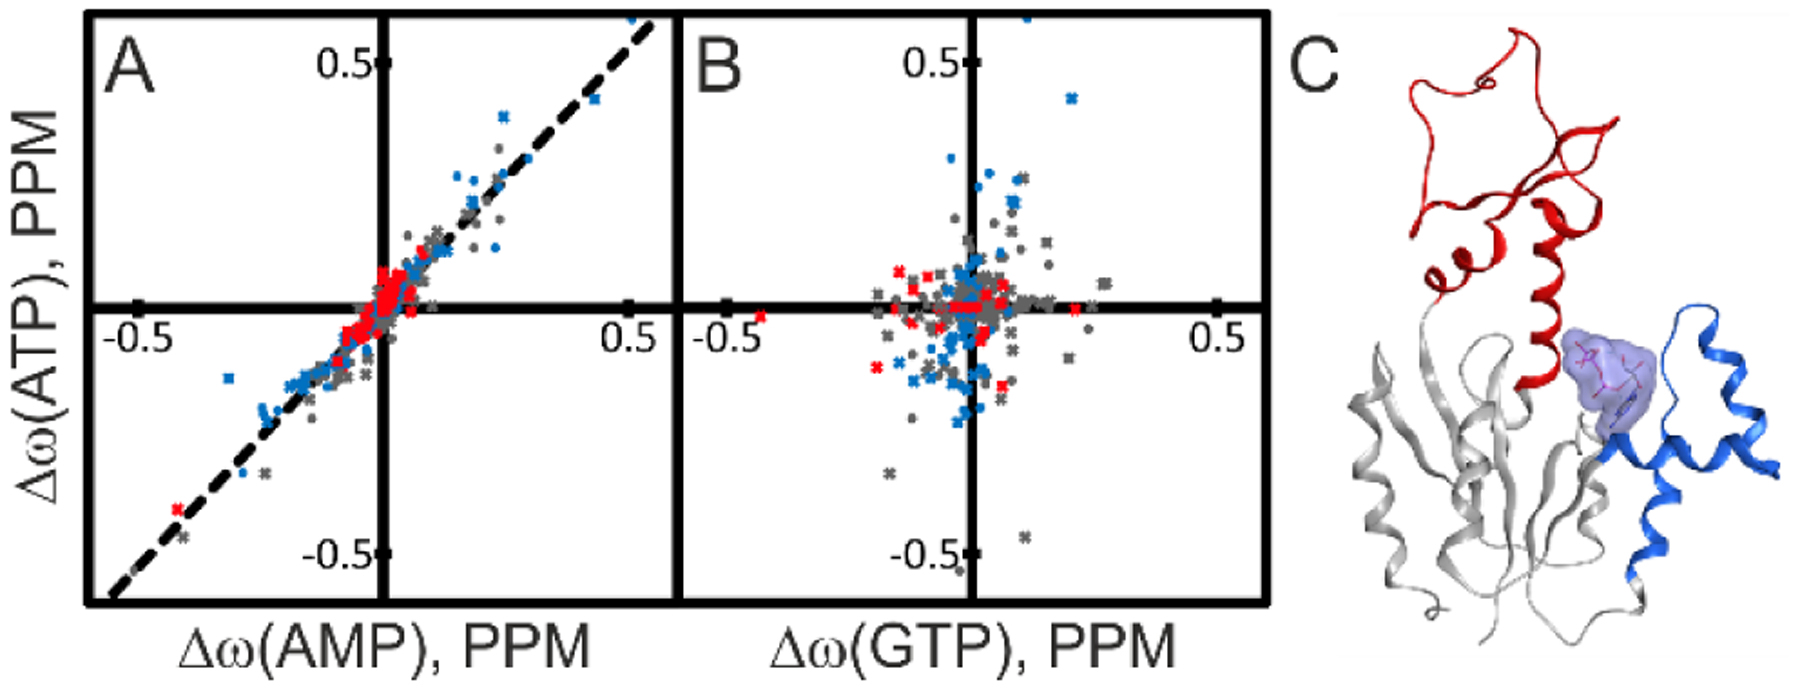
The spatial location of ATP binding to AK3 was identified from comparisons of chemical shift perturbations induced by ATP with those induced by AMP and GTP. (A) Correlation between chemical shift perturbations induced by ATP and AMP. The identity of residues in the AMP binding (red), GTP binding (blue) and core sub-domains (gray) are indicated in the plot. The best fitted linear correlation is indicated with the straight line (Δω(ATP)=1.06* Δω(AMP), R2: 0.93). The strong linear correlation indicates that ATP binds to the AMP binding site of AK3. (B) Comparison of ATP and GTP induced chemical shift perturbations with color-coding as in (A). The lack of correlation excludes the possibility that ATP binds to the GTP binding site. (C) 1.75 Å co-crystal structure of AK3 in complex with ATP. ATP binds to the AMP biding site as predicted from the NMR results in (A) and (B). The GTP and AMP binding sites are colored in blue and red, respectively.
CONCLUSIONS
The production of the universal energy carrier, ATP, from the combined action of the citric acid (TCA) cycle and oxidative phosphorylation is a key event in biology. One of the steps in the citric acid cycle is the conversion of succinyl-CoA to succinate by the action of succinyl-CoA synthase10. During the succinyl-CoA conversion, GDP is phosphorylated to GTP, which implies that GTP must be recycled into GDP in the mitochondrial matrix. Here, we provide molecular insights into the function of AK3 that is responsible for GTP to GDP recirculation, and a detailed insight in its selectivity for GTP over the similar and abundant ATP. The key aspect for specific recognition of the guanosine moiety of GTP by AK3 is the formation of a backbone-mediated hydrogen bond between the amide proton of Thr201 and the O6 carbonyl oxygen of the nucleobase. Backbone-mediated hydrogen bonding for specific recognition of GTP has also been found in other enzymes. For example, in H-Ras, GTP is, in part, coordinated by a hydrogen bond donated from the amide proton of Ser14542, and in EF-Tu it is hydrogen bonded in a similar manner by residue Leu176 (1EFT.pdb)54. The involvement of backbone atoms in the mechanism underlying binding or catalysis is robust from an evolutionary perspective because the backbone is insensitive to mutational perturbation. A well-established example of this is the proteolytic mechanism of serine proteases, which depends on an oxyanion hole formed by backbone amide protons to stabilize the enzyme-acyl intermediate55.
Our structural data reveal that the almost 40-fold catalytic GTP versus ATP specificity of AK3 is primarily dependent on ATP being coordinated by the endogenous AMP binding site. As such, ATP acts as a non-competitive inhibitor with respect to GTP and this mechanism provides a robust way to ensure that GTP is the primary phosphoryl donor used by AK3 inside the mitochondrial matrix. This mechanism is dependent on the bi-substrate nature of AK3 and bears similarities to how AKeco selects ATP over GTP. In AKeco, GTP binding arrests the enzyme in an open, catalytically incompetent state, shown by the X-ray crystallographic structure of AKeco in complex with a non-hydrolysable GTP analogue determined to 1.4 Å resolution13. The findings for AK3 and AKeco summarize how members of the NMP-kinase family have evolved to utilize positive and negative selections for GTP and ATP (Figure 11). During the course of the discovery that ATP binds to the AMP binding site in AK3, we have also found that GTP and ATP have a tendency to bind non-specifically to proteins. This effect complicates the analysis of NMR titrations by causing a curvature in the ligand concentration dependent chemical shift perturbations. From a functional standpoint the dissociation constant (Kd) for non-specific interactions with proteins is in the range of 1.3 – 13 mM which is on par with the intracellular ATP concentrations that are in the milli-molar range56. Thus, the intracellular activity of GTP and ATP, is expected to be lowered by non-specific protein interactions, and this concept has been discussed previously in different context where ATP has been put forward as a hydrotrope57. In contrast, the KM values for GTP for AK3 (10 μM) and for ATP for AKeco (63 μM40) are unexpectedly low compared to the millimolar intracellular concentrations of ATP and GTP56. This apparent discrepancy may have evolved to compensate the limited availability of free ATP as a results of its non-pecific interactions with protein surfaces.
Figure 11. Principles of ATP and GTP selectivity in NMP kinases.
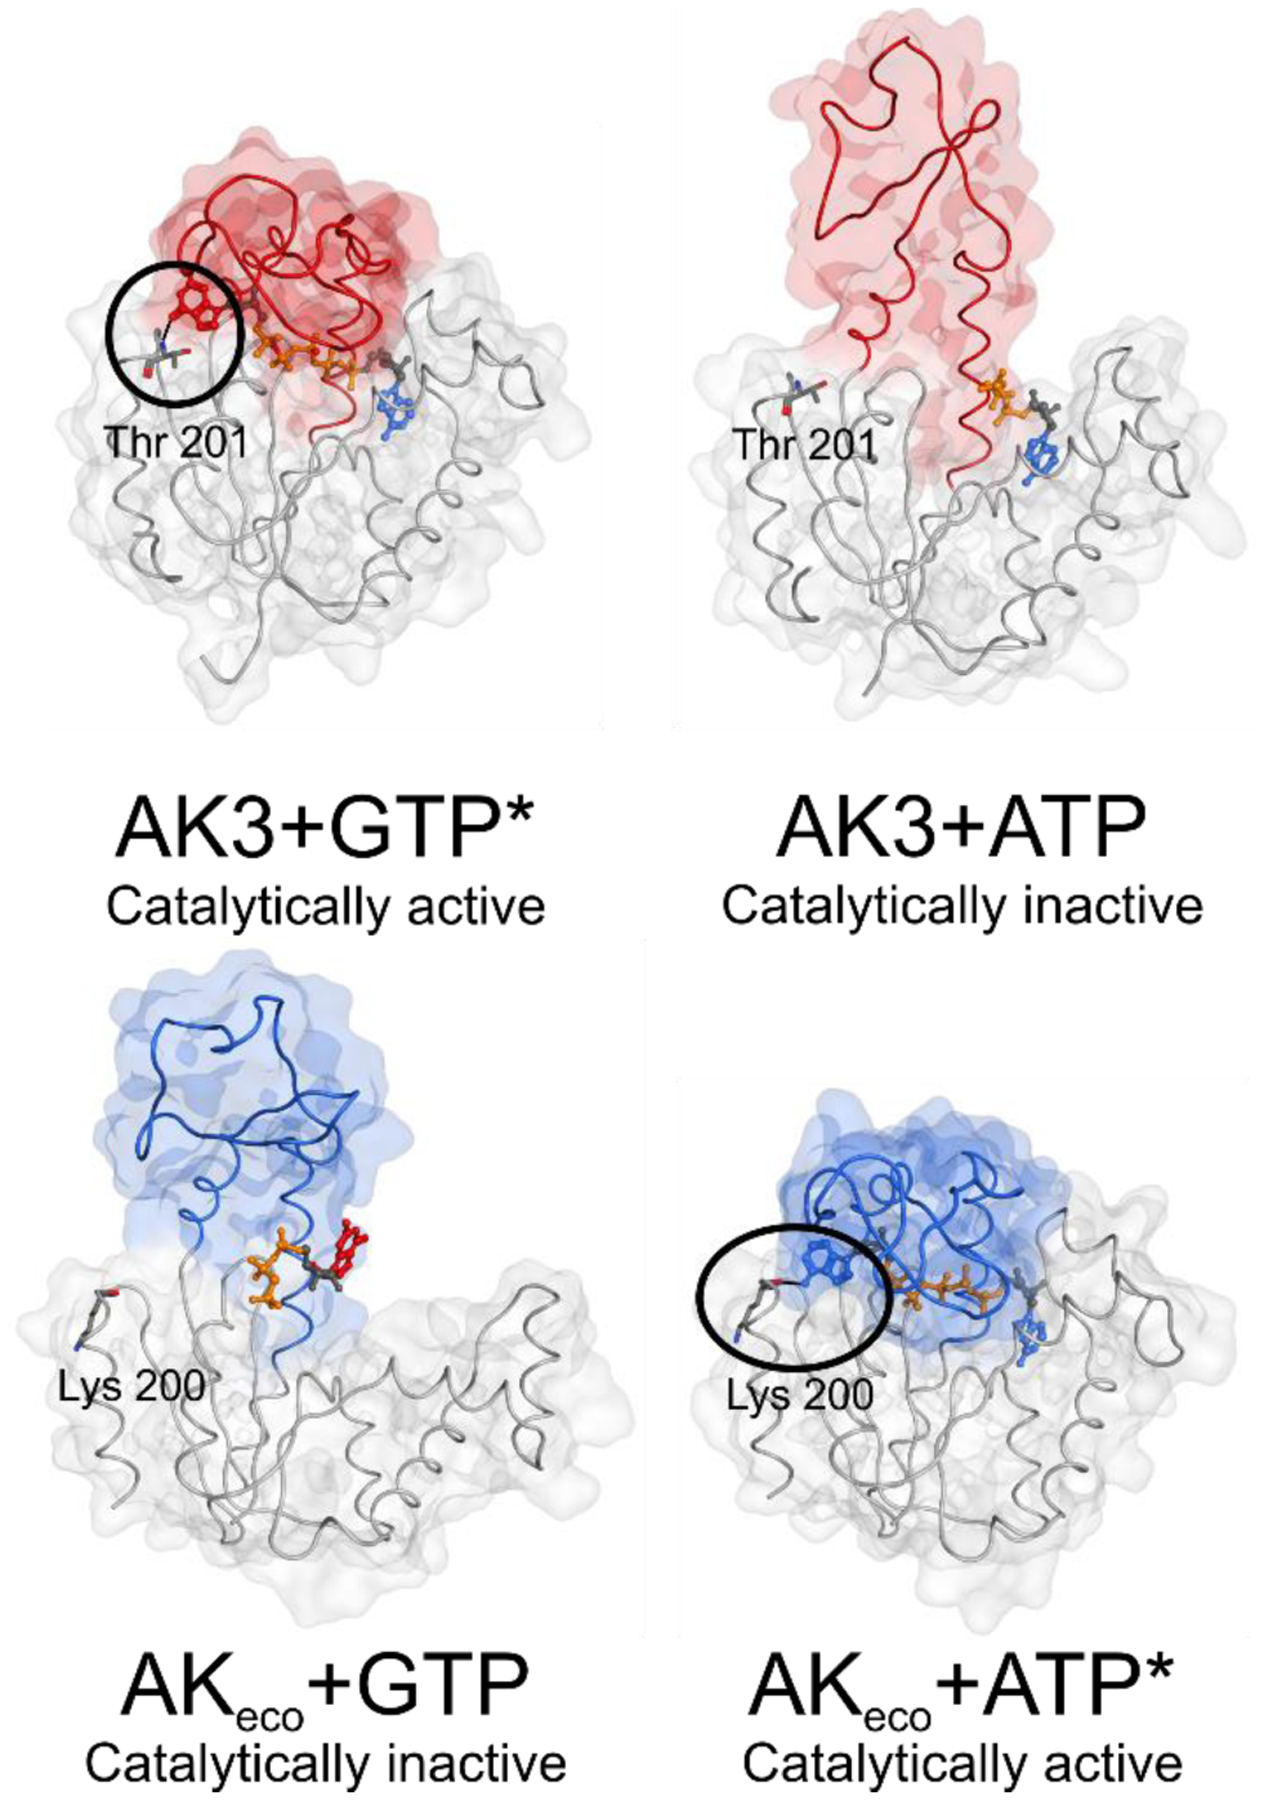
The principles are based on the findings for AK3 (GTP specific NMP kinase) presented here and for AKeco (ATP specific NMP kinase) described previously13. The function of the enzymes is dependent on positive selection via formation of a catalytically active, closed, state with the “correct” substrate, and negative selection via formation of a catalytically inactive, open, complex with the “incorrect” substrate. Top: For AK3 the catalytically active complex (left panel, PdB entry 6ZJB) with the endogenous substrate GTP is, in part, dependent on a hydrogen bond between the backbone amide proton of Thr201 and the O6 atom of the guanosine base (encircled). A catalytically incompetent state of AK3 in complex with ATP (right panel, PdB entry 6ZJD) is formed by coordination of ATP to the AMP binding domain. Bottom: In the case of the ATP specific NMP kinase AKeco a catalytically incompetent state with GTP (left panel) is obtained through arrest of an open conformation mediated through contacts with the guanosine base by residues in the ATP binding domain (PdB entry 6F7U13). The catalytically competent state of AKeco with ATP (right panel) is, in part, stabilized with a backbone hydrogen bond between Lys200 and the N6 hydrogen of the adenosine base (encircled) (PdB entry 1AKE29).
*Figures of the active complexes are shown with the inhibitors Gp5A and Ap5A for AK3 and AKeco respectively, showing the closed state of the NTP binding lid.
Supplementary Material
ACKNOWLEDGEMENTS
We acknowledge the European Synchrotron Radiation Facility for provision of synchrotron radiation facilities. The Swedish NMR centre at Umeå and University and the University of Gothenburg is acknowledged for support and NMR time. Computer resources were provided by the Swedish National Infrastructure for Computing (SNIC) at the High Performance Center North (HPC2N). We also thank the staff of the Protein Expertise Platform (PEP) at Umeå University for cloning services.
Funding
This work was supported from the Swedish Research Council to MWW (2017-04203) and A.E.S.-E. (2019-03771), and to C.H (2019-05384), and from Knut and Alice Wallenberg Foundation Grant KAW to C.H (2013.0187), and from the National Institutes of General Medical Sciences of the National Institute of Health to KN (R01 GM132481). J.G was supported by the University of York through Erasmus+ (Key Action 103).
ABBREVIATIONS
- Gp5A
P1-(guanosine-5´)-P5-(adenosine-5´) pentaphosphate
- Ap5A
P1,P5-di(adenosine-5’)pentaphosphate
- AK3
isoform 3 of human adenylate kinase
- AKeco
E. coli adenylate kinase
- GTPlid
the GTP binding domain of AK3
- ATPlid
the ATP binding domain of AKeco
- AMPbd
the AMP binding domain in either AK3 or AKeco
- RMSF
root-mean-square fluctuations (of atomic positions)
- RMSD
root-mean-square displacement
Footnotes
Supporting information
Additional figures are provided as supporting information.
Accession Codes
Protein data bank entries: 6ZJB (AK3 with Gp5A), 6ZJD (AK3 with ATP) and 6ZJE (AK3 with Ap5A); BMRB entry: 50369 (backbone NMR assignments of AK3); Uniprot Accession ID’s: Q9UIJ7 (Human AK3), P69441 (adenylate kinase from Escherichia coli).
The authors declare no competing financial interests.
REFERENCES
- (1).Wennerström H; Vallina Estrada E; Danielsson J; Oliveberg M, (2020) Colloidal stability of the living cell. Proc. Natl. Acad. Sci. U. S. A 117, 10113–10121. [DOI] [PMC free article] [PubMed] [Google Scholar]
- (2).McGuffee SR; Elcock AH, (2010) Diffusion, crowding & protein stability in a dynamic molecular model of the bacterial cytoplasm. PLoS Comput. Biol 6, 18. [DOI] [PMC free article] [PubMed] [Google Scholar]
- (3).Wong KB; Clarke J; Bond CJ; Neira JL; Freund SMV; Fersht AR; Daggett V, (2000) Towards a complete description of the structural and dynamic properties of the denatured state of barnase and the role of residual structure in folding. J. Mol. Biol 296, 1257–1282. [DOI] [PubMed] [Google Scholar]
- (4).Berg JM; Tymoczko JL; Stryer L, Biochemistry. Fifth ed.; W.H. Freeman and Company: New York, USA, 2002. [Google Scholar]
- (5).Alberts B; Johnson A; Lewis J; Raff M; Roberts K; Walter P, Molecular biology of the cell. 4th ed.; Garland Science: New York, NY, USA, 2002. [Google Scholar]
- (6).Grela P; Helgstrand M; Krokowski D; Boguszewska A; Svergun D; Liljas A; Bernado P; Grankowski N; Akke M; Tchorzewski M, (2007) Structural characterization of the ribosomal P1A-P2B protein dimer by small-angle X-ray scattering and NMR spectroscopy. Biochemistry 46, 1988–1998. [DOI] [PubMed] [Google Scholar]
- (7).Corrons JLV; Garcia E; Tusell JJ; Varughese KI; West C; Beutler E, (2003) Red cell adenylate kinase deficiency: molecular study of 3 new mutations (118G > A, 190G > A, and GAC deletion) associated with hereditary nonspherocytic hemolytic anemia. Blood 102, 353–356. [DOI] [PubMed] [Google Scholar]
- (8).van Rompay AR; Johansson M; Karlsson A, (2000) Phosphorylation of nucleosides and nucleoside analogs by mammalian nucleoside monophosphate kinases. Pharmacol. Therapeut 87, 189–198. [DOI] [PubMed] [Google Scholar]
- (9).Berry MB; Meador B; Bilderback T; Liang P; Glaser M; Phillips GN, (1994) The closed conformation of a highly flexible protein - The structure of Escherichia-coli adenylate kinase with bound AMP and AMPPNP. Proteins 19, 183–198. [DOI] [PubMed] [Google Scholar]
- (10).Noma T; Fujisawa K; Yamashiro Y; Shinohara M; Nakazawa A; Gondo T; Ishihara T; Yoshinobu K, (2001) Structure and expression of human mitochondrial adenylate kinase targeted to the mitochondrial matrix. Biochem. J 358, 225–232. [DOI] [PMC free article] [PubMed] [Google Scholar]
- (11).Moon S; Kim J; Bae E, (2017) Structural analyses of adenylate kinases from Antarctic and tropical fishes for understanding cold adaptation of enzymes. Sci. Rep 7, 12. [DOI] [PMC free article] [PubMed] [Google Scholar]
- (12).Vonrhein C; Bonisch H; Shafer G; Schulz GE, (1998) The structure of a trimeric archaeal adenylate kinase. J. Mol. Biol 282, 167–179. [DOI] [PubMed] [Google Scholar]
- (13).Rogne P; Rosselin M; Grundström C; Hedberg C; Sauer UH; Wolf-Watz M, (2018) Molecular mechanism of ATP versus GTP selectivity of adenylate kinase. Proc. Natl. Acad. Sci. U. S. A 115, 3012–3017. [DOI] [PMC free article] [PubMed] [Google Scholar]
- (14).Rogne P; Andersson D; Grundström C; Sauer-Eriksson E; Linusson A; Wolf-Watz M, (2019) Nucleation of an Activating Conformational Change by a Cation−π Interaction. Biochemistry 58, 3408–3412. [DOI] [PubMed] [Google Scholar]
- (15).Manning G; Whyte DB; Martinez R; Hunter T; Sudarsanam S, (2002) The protein kinase complement of the human genome. Science 298, 1912–1934. [DOI] [PubMed] [Google Scholar]
- (16).Reinstein J; Brune M; Wittinghofer A, (1988) Mutations in the nucleotide binding loop of adenylate kinase of Escherichia coli. Biochemistry 27, 4712–4720. [DOI] [PubMed] [Google Scholar]
- (17).Rhoads DG; Lowenstein JM, (1968) Initial velocity and equilibrium kinetics of myokinase. J. Biol. Chem 243, 3963–3972. [PubMed] [Google Scholar]
- (18).Jaravine VA; Orekhov VY, (2006) Targeted acquisition for real-time NMR spectroscopy. J. Am. Chem. Soc 128, 13421–13426. [DOI] [PubMed] [Google Scholar]
- (19).Kazimierczuk K; Orekhov VY, (2011) Accelerated NMR Spectroscopy by Using Compressed Sensing. Angew. Chem 50, 5556–5559. [DOI] [PubMed] [Google Scholar]
- (20).Mayzel M; Kazimierczuk K; Orekhov VY, (2014) The causality principle in the reconstruction of sparse NMR spectra. ChemComm. 50, 8947–8950. [DOI] [PubMed] [Google Scholar]
- (21).Jaravine VA; Zhuravleva AV; Permi P; Ibraghimov I; Orekhov VY, (2008) Hyperdimensional NMR spectroscopy with nonlinear sampling. J. Am. Chem. Soc 130, 3927–3936. [DOI] [PubMed] [Google Scholar]
- (22).Isaksson L; Mayzel M; Saline M; Pedersen A; Rosenlow J; Brutscher B; Karlsson BG; Orekhov VY, (2013) Highly efficient NMR assignment of intrinsically disordered proteins: application to B- and T cell receptor domains. PLoS One 8, 8. [DOI] [PMC free article] [PubMed] [Google Scholar]
- (23).Schmidt E; Guntert P, (2012) A new algorithm for reliable and general NMR resonance assignment. J. Am. Chem. Soc 134, 12817–12829. [DOI] [PubMed] [Google Scholar]
- (24).Keller RJL, The computer aided resonance assignment tutorial. Cantina verlag: 2004. [Google Scholar]
- (25).Kabsch W, (2010) XDS. Acta Crystallogr. D 66, 125–132. [DOI] [PMC free article] [PubMed] [Google Scholar]
- (26).Winn MD; Ballard CC; Cowtan KD; Dodson EJ; Emsley P; Evans PR; Keegan RM; Krissinel EB; Leslie AGW; McCoy A; McNicholas SJ; Murshudov GN; Pannu NS; Potterton EA; Powell HR; Read RJ; Vagin A; Wilson KS, (2011) Overview of the CCP4 suite and current developments. Acta Crystallogr. D 67, 235–242. [DOI] [PMC free article] [PubMed] [Google Scholar]
- (27).Adams PD; Afonine PV; Bunkoczi G; Chen VB; Davis IW; Echols N; Headd JJ; Hung LW; Kapral GJ; Grosse-Kunstleve RW; McCoy AJ; Moriarty NW; Oeffner R; Read RJ; Richardson DC; Richardson JS; Terwilliger TC; Zwart PH, (2010) PHENIX: a comprehensive Python-based system for macromolecular structure solution. Acta Crystallogr. D 66, 213–221. [DOI] [PMC free article] [PubMed] [Google Scholar]
- (28).Emsley P; Cowtan K, (2004) Coot: model-building tools for molecular graphics. Acta Crystallogr. D 60, 2126–2132. [DOI] [PubMed] [Google Scholar]
- (29).Müller CW; Schulz GE, (1992) Structure of the complex between adenylate kinase from Escherichia coli and the inhibitor AP5A refined at 1.9 A resolution - A model for a catalytic transition-State. J. Mol. Biol 224, 159–177. [DOI] [PubMed] [Google Scholar]
- (30).Jorgensen WL; Chandrasekhar J; Madura JD; Impey RW; Klein ML, (1983) Comparison of simple potential functions for simulating liquid water. J. Chem. Phys 79, 926–935. [Google Scholar]
- (31).Foloppe N; MacKerell AD, (2000) All-atom empirical force field for nucleic acids: I. Parameter optimization based on small molecule and condensed phase macromolecular target data. J. Comput. Chem 21, 86–104. [Google Scholar]
- (32).MacKerell AD; Bashford D; Bellott M; Dunbrack RL; Evanseck JD; Field MJ; Fischer S; Gao J; Guo H; Ha S; Joseph-McCarthy D; Kuchnir L; Kuczera K; Lau FTK; Mattos C; Michnick S; Ngo T; Nguyen DT; Prodhom B; Reiher WE; Roux B; Schlenkrich M; Smith JC; Stote R; Straub J; Watanabe M; Wiorkiewicz-Kuczera J; Yin D; Karplus M, (1998) All-atom empirical potential for molecular modeling and dynamics studies of proteins. J. Phys. Chem. B 102, 3586–3616. [DOI] [PubMed] [Google Scholar]
- (33).Mackerell AD; Feig M; Brooks CL, (2004) Extending the treatment of backbone energetics in protein force fields: Limitations of gas-phase quantum mechanics in reproducing protein conformational distributions in molecular dynamics simulations. J. Comput. Chem 25, 1400–1415. [DOI] [PubMed] [Google Scholar]
- (34).MacKerell AD; Feig M; Brooks CL, (2004) Improved treatment of the protein backbone in empirical force fields. J. Am. Chem. Soc 126, 698–699. [DOI] [PubMed] [Google Scholar]
- (35).Ryckaert JP; Ciccotti G; Berendsen HJC, (1977) Numerical-integration of cartesian equations of motions of a system with constraints - molecular-dynamics of N-alkanes. J. Comput. Phys 23, 327–341. [Google Scholar]
- (36).Feller SE; Zhang YH; Pastor RW; Brooks BR, (1995) Constant-pressure molecular-dynamics simulation - the langevin piston method. J. Chem. Phys 103, 4613–4621. [Google Scholar]
- (37).Essmann U; Perera L; Berkowitz ML; Darden T; Lee H; Pedersen LG, (1995) A smooth particle mesh ewald method. J. Chem. Phys 103, 8577–8593. [Google Scholar]
- (38).Brooks BR; Brooks CL; Mackerell AD; Nilsson L; Petrella RJ; Roux B; Won Y; Archontis G; Bartels C; Boresch S; Caflisch A; Caves L; Cui Q; Dinner AR; Feig M; Fischer S; Gao J; Hodoscek M; Im W; Kuczera K; Lazaridis T; Ma J; Ovchinnikov V; Paci E; Pastor RW; Post CB; Pu JZ; Schaefer M; Tidor B; Venable RM; Woodcock HL; Wu X; Yang W; York DM; Karplus M, (2009) CHARMM: The Biomolecular Simulation Program. J. Comput. Chem 30, 1545–1614. [DOI] [PMC free article] [PubMed] [Google Scholar]
- (39).Eastman P; Swails J; Chodera JD; McGibbon RT; Zhao YT; Beauchamp KA; Wang LP; Simmonett AC; Harrigan MP; Stern CD; Wiewiora RP; Brooks BR; Pande VS, (2017) OpenMM 7: Rapid development of high performance algorithms for molecular dynamics. PLoS Computat. Biol 13. [DOI] [PMC free article] [PubMed] [Google Scholar]
- (40).Åden J; Verma A; Schug A; Wolf-Watz M, (2012) Modulation of a pre-existing conformational equilibrium tunes adenylate kinase activity. J. Am. Chem. Soc 134, 16562–16570. [DOI] [PubMed] [Google Scholar]
- (41).Rundqvist L; Åden J; Sparrman T; Wallgren M; Olsson U; Wolf-Watz M, (2009) Noncooperative folding of subdomains in adenylate kinase. Biochemistry 48, 1911–1927. [DOI] [PubMed] [Google Scholar]
- (42).Pai EF; Krengel U; Petsko GA; Goody RS; Kabsch W; Wittinghofer A, (1990) Refined crystal-structure of the triphosphate conformation of H-RAS P21 at 1.35 A resolution - implications for the mechanism of GTP hydrolysis. EMBO J. 9, 2351–2359. [DOI] [PMC free article] [PubMed] [Google Scholar]
- (43).Wolf-Watz M; Thai V; Henzler-Wildman K; Hadjipavlou G; Eisenmesser EZ; Kern D, (2004) Linkage between dynamics and catalysis in a thermophilic-mesophilic enzyme pair. Nat. Struct. Mol. Biol 11, 945–949. [DOI] [PubMed] [Google Scholar]
- (44).Kovermann M; Åden J; Grundström C; Sauer-Eriksson AE; Sauer UH; Wolf-Watz M, (2015) Structural basis for catalytically restrictive dynamics of a high-energy enzyme state. Nat. Commun 6. [DOI] [PMC free article] [PubMed] [Google Scholar]
- (45).Kovermann M; Rogne P; Wolf-Watz M, (2016) Protein dynamics and function from solution state NMR spectroscopy. Q. Rev. Biophys 49. [DOI] [PubMed] [Google Scholar]
- (46).Selvaratnam R; VanSchouwen B; Fogolari F; Mazhab-Jafari MT; Das R; Melacini G, (2012) The projection analysis of NMR chemical shifts reveals extended EPAC autoinhibition determinants. Biophys. J 102, 630–639. [DOI] [PMC free article] [PubMed] [Google Scholar]
- (47).Masterson LR; Yu T; Shi L; Wang Y; Gustavsson M; Mueller MM; Veglia G, (2011) cAMP-Dependent Protein Kinase A Selects the Excited State of the Membrane Substrate Phospholamban. J. Mol. Biol 412, 155–164. [DOI] [PMC free article] [PubMed] [Google Scholar]
- (48).Åden J; Wolf-Watz M, (2007) NMR identification of transient complexes critical to adenylate kinase catalysis. J. Am. Chem. Soc 129, 14003–14012. [DOI] [PubMed] [Google Scholar]
- (49).Evans DF; Wennerström H, The colloidal domain: Where physics, chemistry, biology, and technology meet. 2nd ed.; Wileey-VCH: New Jersey, USA, 1999. [Google Scholar]
- (50).Eliezer D; Kutluay E; Bussell R; Browne G, (2001) Conformational properties of alpha-synuclein in its free and lipid-associated states. J. Mol. Biol 307, 1061–1073. [DOI] [PubMed] [Google Scholar]
- (51).Bergman T; Håkansson S; Forsberg A; Norlander L; Macellaro A; Backman A; Bolin I; Wolfwatz H, (1991) Analysis of the V-antigen lcrGVH-yopBD operon of Yersinia pseudotuberculosis - evidence for a regulatory role of LcrH and LcrV. J. Bacteriol 173, 1607–1616. [DOI] [PMC free article] [PubMed] [Google Scholar]
- (52).Aviram HY; Pirchi M; Mazal H; Barak Y; Riven I; Haran G, (2018) Direct observation of ultrafast large-scale dynamics of an enzyme under turnover conditions. Proc. Natl. Acad. Sci. U. S. A 115, 3243–3248. [DOI] [PMC free article] [PubMed] [Google Scholar]
- (53).Rogne P; Wolf-Watz M, (2016) Urea-dependent adenylate kinase activation following redistribution of structural states. Biophys. J 111, 1385–1395. [DOI] [PMC free article] [PubMed] [Google Scholar]
- (54).Fersht AR, Structure and mechanism in protein science. W.H.Freeman Co Ltd: New York, USA, 1999. [Google Scholar]
- (55).Kjeldgaard M; Nissen P; Thirup S; Nyborg J, (1993) The crystal-structureof elongation-factor EF-TU from Thermus aquaticus in the GTP conformation. Structure 1, 35–50. [DOI] [PubMed] [Google Scholar]
- (56).Hedstrom L, (2002) Serine protease mechanism and specificity. Chem. Rev 102, 4501–4523. [DOI] [PubMed] [Google Scholar]
- (57).Traut TW, (1994) Physiological concentrations of purines and pyrimidines. Mol. Cell. Biochem 140, 1–22. [DOI] [PubMed] [Google Scholar]
- (58).Patel A; Malinovska L; Saha S; Wang J; Alberti S; Krishnan Y; Hyman AA, (2017) ATP as a biological hydrotrope. Science 356, 753–756. [DOI] [PubMed] [Google Scholar]
Associated Data
This section collects any data citations, data availability statements, or supplementary materials included in this article.


