Keywords: coordinate transformations, frontal eye field, intraparietal cortex, multisensory, superior colliculus
Abstract
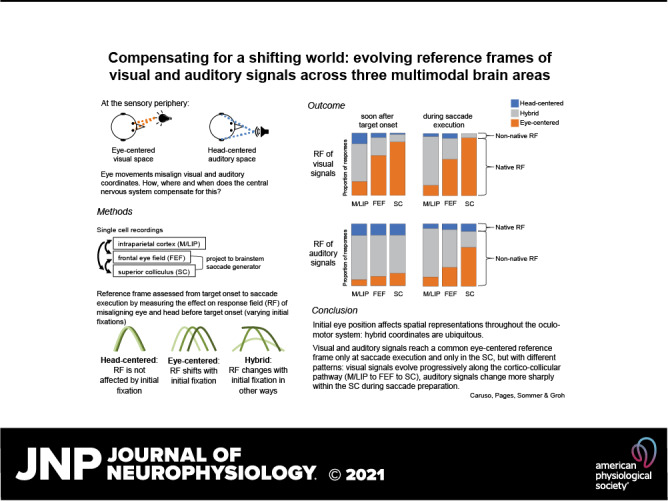
Stimulus locations are detected differently by different sensory systems, but ultimately they yield similar percepts and behavioral responses. How the brain transcends initial differences to compute similar codes is unclear. We quantitatively compared the reference frames of two sensory modalities, vision and audition, across three interconnected brain areas involved in generating saccades, namely the frontal eye fields (FEF), lateral and medial parietal cortex (M/LIP), and superior colliculus (SC). We recorded from single neurons in head-restrained monkeys performing auditory- and visually guided saccades from variable initial fixation locations and evaluated whether their receptive fields were better described as eye-centered, head-centered, or hybrid (i.e. not anchored uniquely to head- or eye-orientation). We found a progression of reference frames across areas and across time, with considerable hybrid-ness and persistent differences between modalities during most epochs/brain regions. For both modalities, the SC was more eye-centered than the FEF, which in turn was more eye-centered than the predominantly hybrid M/LIP. In all three areas and temporal epochs from stimulus onset to movement, visual signals were more eye-centered than auditory signals. In the SC and FEF, auditory signals became more eye-centered at the time of the saccade than they were initially after stimulus onset, but only in the SC at the time of the saccade did the auditory signals become “predominantly” eye-centered. The results indicate that visual and auditory signals both undergo transformations, ultimately reaching the same final reference frame but via different dynamics across brain regions and time.
NEW & NOTEWORTHY Models for visual-auditory integration posit that visual signals are eye-centered throughout the brain, whereas auditory signals are converted from head-centered to eye-centered coordinates. We show instead that both modalities largely employ hybrid reference frames: neither fully head- nor eye-centered. Across three hubs of the oculomotor network (intraparietal cortex, frontal eye field, and superior colliculus) visual and auditory signals evolve from hybrid to a common eye-centered format via different dynamics across brain areas and time.
INTRODUCTION
The locations of objects we see or hear are determined differently by our visual and auditory systems. Yet, we perceive space as unified, and our actions do not routinely depend on whether they are elicited by light or sound. This suggests that sensory modality-dependent signals ultimately become similar in the lead-up to action. This study addresses how, where, and when this happens in the brain. In particular, we focus on the neural representations that permit saccadic eye movements to both visual and auditory targets.
Differences between visual and auditory localization originate at the sensory organs. Light from different directions excites different retinal receptors, producing an eye-centered map of space that is passed along to thalamic and cortical visual areas. By contrast, sound source localization involves computing differences in sound intensity and arrival time between the two ears, and evaluating spectral cues arising from the filtering action of the outer ear. These physical cues are head-centered and independent of eye movements.
How signals are transformed from one reference frame to another is a comparative question. Many brain areas, including those in the primate oculomotor system, exhibit signals that are not clearly well characterized by a single reference frame either at the neuron or population levels (e.g., Refs. 1–17). This makes the signal flow across different brain areas unclear, and requires a quantitative comparison across studies using the same experimental methods.
Here, we compared the reference frames of visual and auditory signals during a sensory-guided saccade task across three main hubs in the network controlling saccade target selection and execution. We examined new experimental data from frontal eye fields (FEF), as well as previously presented findings from the main input and output regions to the FEF (Fig. 1A; 18): the medial and lateral intraparietal cortices (M/LIP) and superior colliculus (SC) (2, 8, 10, 11). We found that hybrid signals (i.e., not purely head- or eye-centered) were common in both modalities and across all three brain areas. Visual and auditory signals differed from each other during most temporal epochs, but reached a similar eye-centered format via different dynamics through M/LIP to FEF to SC.
Figure 1.
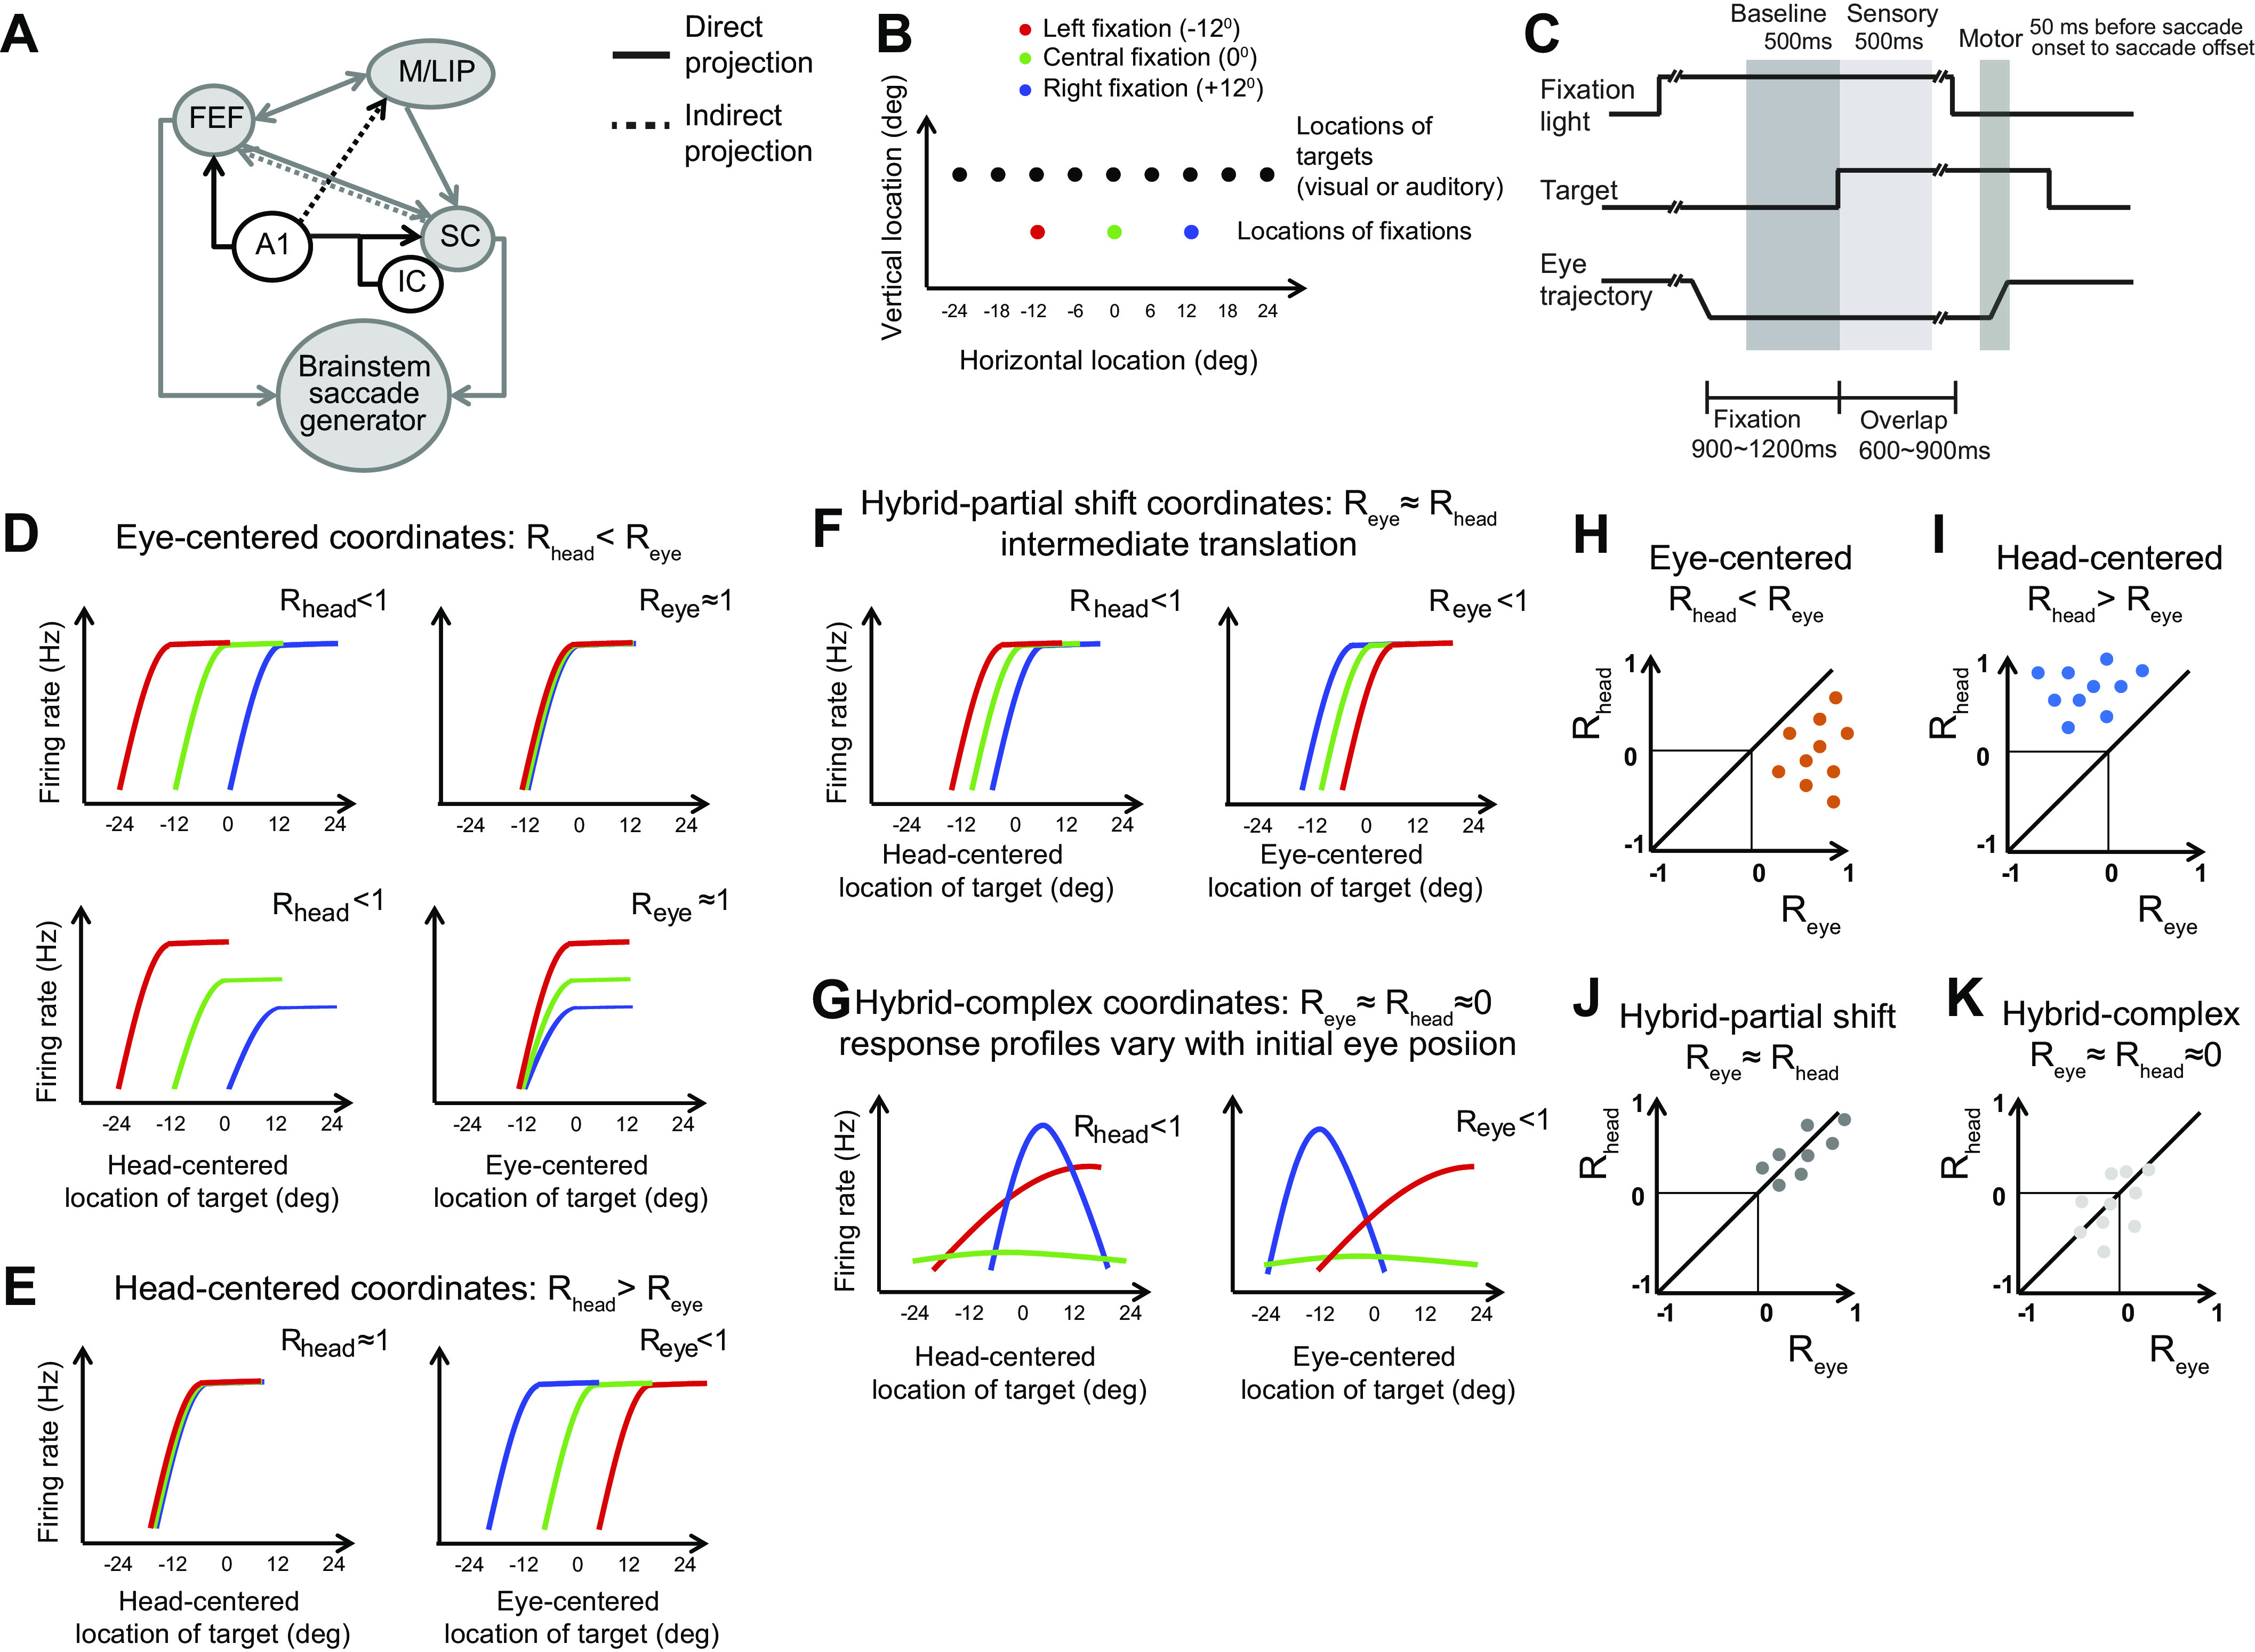
Rationale of the study: the brain areas, stimuli, task, and quantification of reference frame. A: anatomical connections and auditory inputs of M/LIP, FEF, and SC. FEF and M/LIP receive auditory inputs from the primary auditory cortex (A1). The SC receives auditory inputs from the inferior colliculus (IC), auditory cortex, M/LIP, and FEF. B: locations of stimuli and initial fixations. All visual stimuli were green lights: the different colors of the fixation lights in the schematics serve to distinguish tuning curves constructed from different initial fixations in the following graphs. C: task: each trial starts with the appearance of a light which the monkey is required to fixate. After a variable delay of 900–1,200 ms, a visual or auditory target is presented. After a second variable delay of 600–900 ms, the fixation light disappears and the monkey reports the location of the target by saccading to it. D–G: schematics of the relative alignment of the tuning curves from three initial fixation positions plotted in head- and eye-centered coordinates. The strength of the tuning curve alignment in eye- and head-centered coordinates is quantified with the indices Reye and Rhead, which reflect the average correlation between tuning curves. D: eye-centered coordinates. The three tuning curves align well in eye-centered coordinates (Reye≈1, right) and are separated by the distance between the initial eye positions in head-centered coordinates (Rhead ≈ 0, left). Gain differences across tuning curve do not contribute to the metric chosen to quantify their alignment (bottom). E: head-centered coordinates. The pattern is the opposite of D. F: hybrid-partial shift coordinates. The three tuning curves are not perfectly aligned in either head- or eye-centered coordinates, but are separated by less than the distance between the fixation locations in both coordinate systems. G: hybrid-complex coordinates. Both the shape and the alignment vary with the initial eye location. H–K: assessment of reference frame trough the statistical comparison of Reye vs. Rhead for each cell. The coordinates systems are classified as eye-centered if Reye > Rhead (orange dots) (H), head-centered if Rhead > Reye (blue) (I), hybrid-partial shift if Reye ≈ Rhead ≠ 0 (dark gray) (J), hybrid complex if Reye ≈ Rhead ≈ 0 (light gray) (K). The quantitative comparison was carried out via a bootstrap analysis (see material and methods). FEF, frontal eye field; M/LIP, lateral and medial parietal cortex; SC, superior colliculus.
MATERIALS AND METHODS
The behavioral task, neural recording procedures, and analysis methods were identical across brain areas (2, 8, 10, 11, 19). All experimental procedures conformed to the National Institutes of Health (NIH) guidelines (2011) (20) and were approved by the Institutional Animal Care and Use Committee of Duke University or Dartmouth College. Portions of the data have been previously presented (2, 8, 10, 11).
Experimental Design
Six monkeys (2 per each brain area) performed saccades to visual or auditory targets from a range of initial eye locations. Each trial started with the onset of a visual fixation light. On a correct trial, the monkey initiated fixation within 3,000 ms. During fixation, after a delay of 900 to 1,200 ms, a visual or auditory target turned on in one of nine positions (Fig. 1B). After a second delay of 600 to 900 ms, the fixation light turned off, while the target stimulus stayed on. The monkey was required to saccade toward the target within 500 ms from fixation offset. To prevent exploratory saccades, the money had to keep fixation on the target for 200 to 500 ms. Then the target turned off and the monkey was rewarded with a few drops of diluted juice or water.
The delay (600–900 ms) between target onset and fixation stimulus offset permitted the dissociation of sensory-related activity (i.e., time-locked to stimulus onset) from motor-related activity (i.e., time-locked to the saccade). The targets were placed in front of the monkeys at eye level (0° elevation) and at −24°, −18°, −12°, −6°, 0°, +6°, +12°, +18°, and +24° relative to the head along the horizontal direction (Fig. 1B). The three initial fixation lights were located at −12°, 0°, and +12° along the horizontal direction. The elevation of the fixation ranged from −12° to −4° below eye level and from +6° to +14° above eye level. For each isolated neuron, the fixation elevation was chosen as follows. The monkey performed a few prescreening trials to two targets located at (−12°,0°) or (0°,+12°), and starting from two fixation locations, one above and one below eye-level [symmetrical, e.g., (0°,−6°), (0°,+6°)]. We chose the fixation elevation (above or below) that was accompanied by qualitatively stronger motor bursts.
The auditory stimuli consisted of white noise bursts (band-passed between 500 Hz and 18 kHz) produced by Cambridge SoundWorks MC50 speakers at 55 dB spl. The visual stimuli consisted of small green spots (0.55 min of arc, luminance of 26.4 cd/m2) produced by light emitting diodes (LEDs).
Recordings
All monkeys (adult rhesus macaques) were implanted with a head holder to restrain the head, a recording cylinder to access the area of interest (M/LIP, FEF, or SC) and a scleral search coil to track eye movements. In one of the monkeys, a video eye-tracking system (EyeLink 1000; SR Research, ON, Canada) substituted the search coil in a minority of recording sessions (62 over 171; 19). The recording cylinders were placed over the left and right M/LIP (monkeys B and C), over the left or the right FEF (monkeys F and N), and over the left and right SC (monkeys W and P). Locations of the recording chambers were confirmed with MRI scans and by assessment of functional properties of the recorded cells (10, 11, 19).
The behavioral paradigm and the recordings of eye gaze and of single cell spiking activity were directed by the Beethoven program (Ryklin Software). The trajectory of eye gaze was sampled at 500 Hz. Extracellular activity of single neurons was acquired with tungsten micro-electrodes (FHC, 0.7 to 2.5 MΩ at 1 kHz). A hydraulic pulse microdrive (Narishige MO-95) controlled the electrodes position. A Plexon system (Sort Client software, Plexon) controlled the recordings of single neurons spiking activity.
Data Sets
The basic auditory properties and the visual reference frame of the FEF data set have been previously described (2, 19). The analysis of the auditory reference frame is novel. In total, we analyzed 324 single cells from the left and right FEF of two monkeys (monkey F, male, and monkey P, female).
The data from M/LIP and SC have been previously described (10, 11) and are reanalyzed here to permit comparison between all three brain regions. In total, we reanalyzed 179 single cells from the left and right SC of two monkeys (monkey W, male, and monkey P, female), and 275 single cells from the left and right M/LIP of two other monkeys (monkey B, male, and monkey C, female).
Statistical Analysis
All analyses were carried out with custom-made routines in MATLAB (the MathWorks Inc.). Only correct trials were considered. The physical positions of the targets were used for all analyses. Although saccades to auditory targets tend to be more variable than those to visual targets (e.g., Ref. 20), using saccade endpoints instead of actual target locations did not change the general pattern of results reported here.
For all brain areas, we defined a “baseline,” 500 ms of fixation before target onset, and two response periods. The “sensory period” comprised the 500 ms following target onset (thus including both transient and sustained responses). The pattern of results did not change when the sensory period was shortened to 200 ms (as also indicated by the time-course analysis in Fig. 3, G and H and Fig. 7). The “motor period” varied according to the temporal profile of the saccade burst: from 150 ms (M/LIP) or 50 ms (FEF) or 20 ms (SC) before saccade onset to saccade offset. Saccade onset and offset were measured as the time in which the instantaneous speed (sampled at 2 ms resolution) of the eye movement crossed a threshold of 25°/s. We also analyzed the entire interval between target onset and saccade using sliding windows of 100 ms (with 50 ms steps), as shown in Fig. 3, G and H and Fig. 7.
Figure 3.
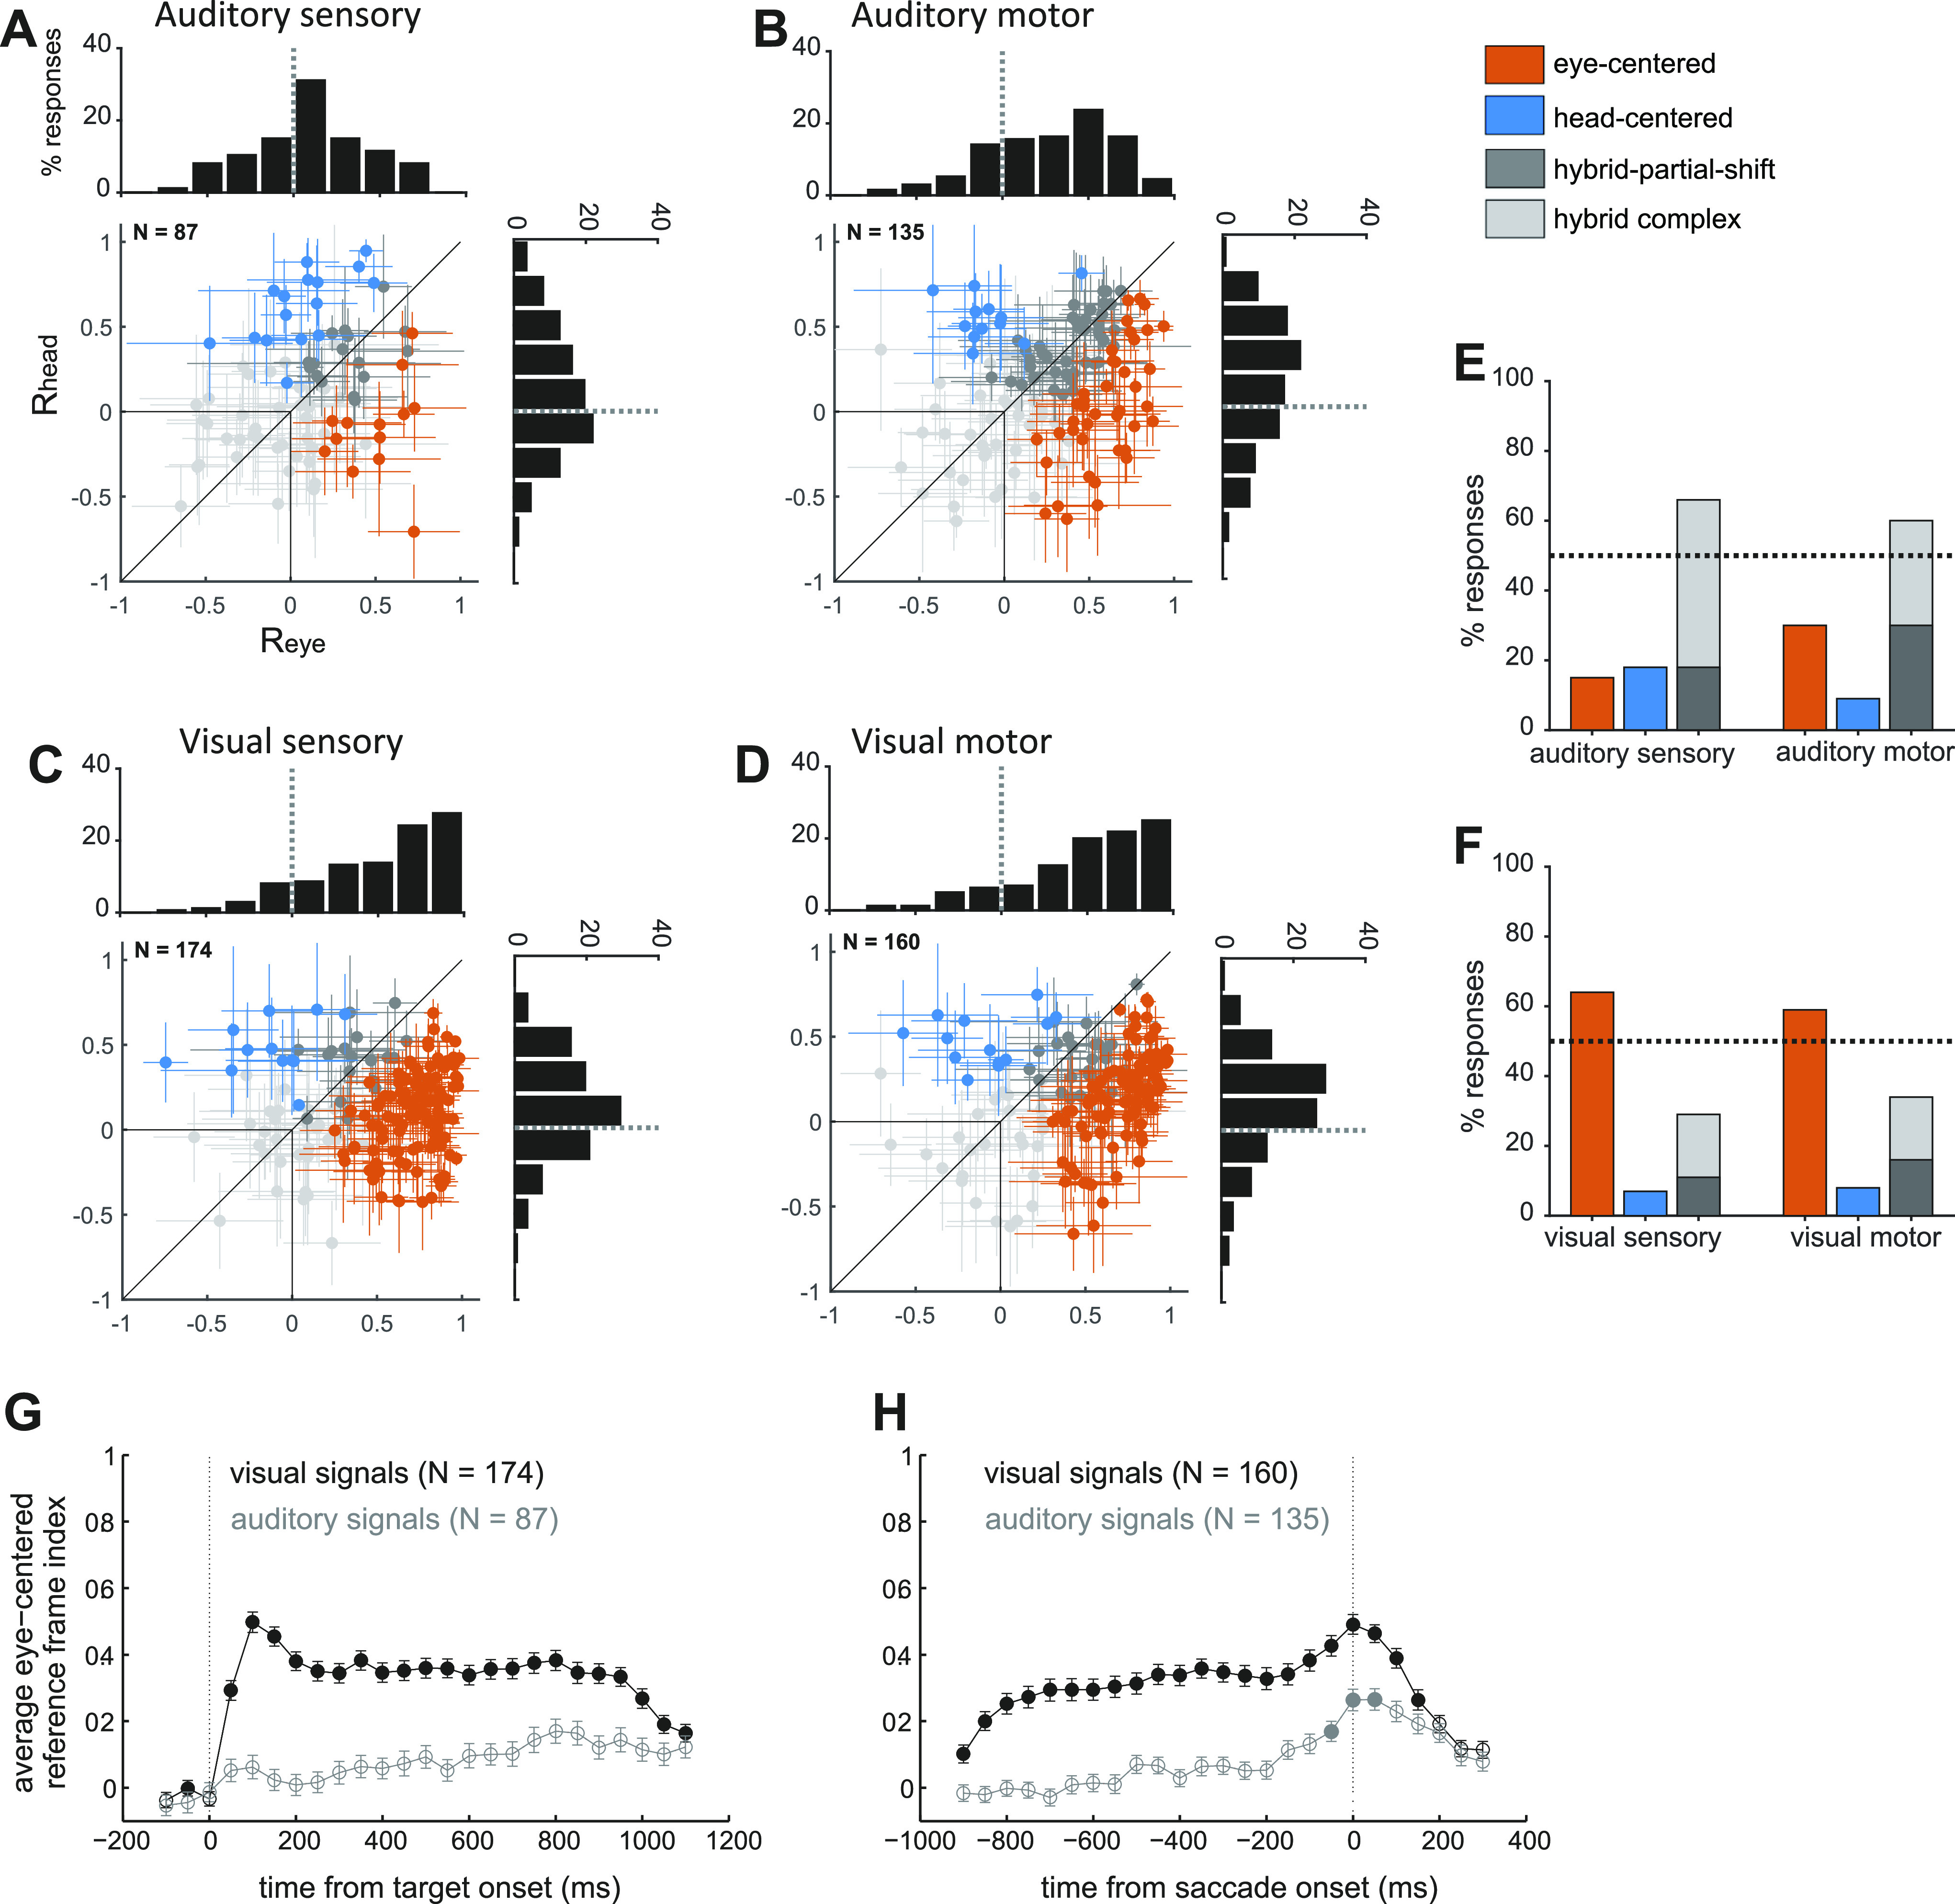
Frontal eye field (FEF) single cell reference frames for visual and auditory targets. A–D: the reference frame indices in head-centered and eye-centered coordinates (Rhead and Reye) are plotted for each individual neuron’s response to visual and auditory targets, in the sensory and motor periods. Auditory sensory (A), auditory motor (B), visual sensory (C), and visual motor (D). Responses are classified and color-coded as eye-centered, head-centered, hybrid-partial shift and hybrid-complex, based on the statistical comparison between their Reye and Rhead. The histogram insets show the distribution of Reye (horizontal histogram) and Rhead (vertical histogram) across the population of cells. Percentage of auditory (E) and visual (F) responses classified as eye-centered, head-centered, hybrid-partial shift, and hybrid-complex during the sensory and motor periods. Color code as in A. Time course of the average reference frame index (means ± SE) in eye-centered coordinates (Reye) for the visual and auditory populations, aligned to target onset (G) and saccade onset (H). The Reye are calculated in bins of 100 ms, sliding with a step of 50 ms. Filled circles indicate bins in which Reye was significantly greater than Rhead (as assessed with a t test, P value <0.05). Visual data were previously presented in Caruso et al. (2).
Figure 7.
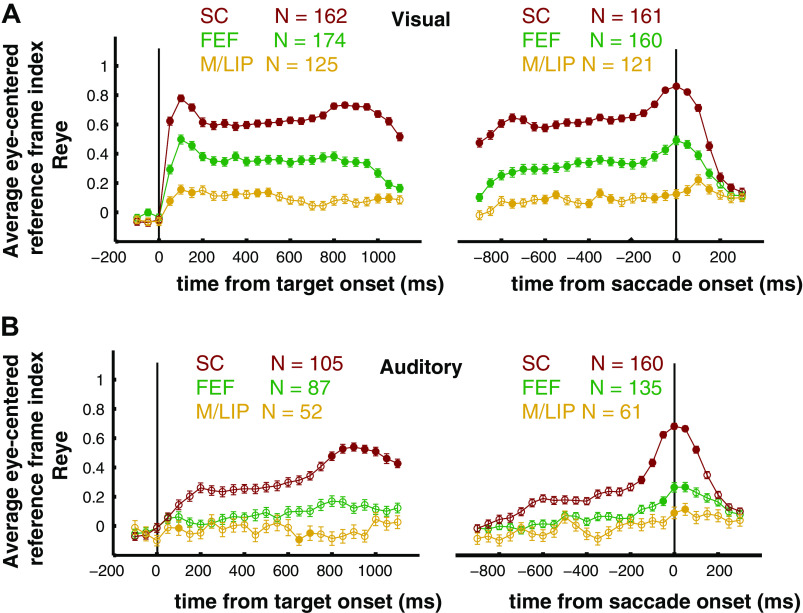
Time course of the eye-centered reference frame indices in M/LIP, FEF, and SC. The average eye-centered reference frame index, Reye (means ± SE) was computed in 100 ms bins (sliding with a step of 50 ms). Filled circles indicate that Reye was statistically larger than Rhead (see materials and methods). A: visual signals, aligned to the target onset (left) and to the saccade onset (right). B: auditory signals, aligned to the target onset (left) and to the saccade onset (right). FEF, frontal eye field; M/LIP, lateral and medial parietal cortex; SC, superior colliculus.
Spatial selectivity.
The reference frame can only be assessed if the neural response is modulated by target locations. Thus, for each modality and response period, we assessed “responsiveness” with a two-tailed t test between baseline and response periods, and “spatial selectivity” with 2 two-way ANOVAs measuring the effect of target and fixation location in head- and in eye-centered coordinates on the responses. The inclusion criteria was either a significant main effect for target location or a significant interaction between target and fixation locations, at an uncorrected level of 0.05 for either ANOVA (2, 8, 10).
Reference frame analysis.
To determine the reference frame of visual and auditory signals, we quantified the relative alignment between the tuning curved computed in eye-centered or head-centered coordinates for individual neurons. To be specific, for each cell, modality, and response period, we computed the three response tuning curves for the three initial fixations twice: once with target locations defined in head-centered coordinates, and once with target locations defined in eye-centered coordinates. For each triplet of tuning curves, we quantified the relative alignment by defining a “reference frame index” according to Eq. 1 (10).
| (1) |
In Eq. 1, rL,i, rC,i, and rR,i are the vectors of the time-average responses of the neuron to a target at location i and fixation on left (L), right (R), or center (C), and ; is the average response across all fixation and target locations. The time windows for the computation of R were the sensory and motor periods as defined in the section Statistical Analysis, for the analyses reported in Fig. 2, Fig. 3, A–F, Fig. 4, and Fig. 5, and a 100 ms long sliding window for Fig. 3, G and H and Fig. 7. The values of R vary from −1 to 1, with 1 indicating perfect alignment, 0 indicating no alignment, and −1 indicating perfect negative correlation.
Figure 2.
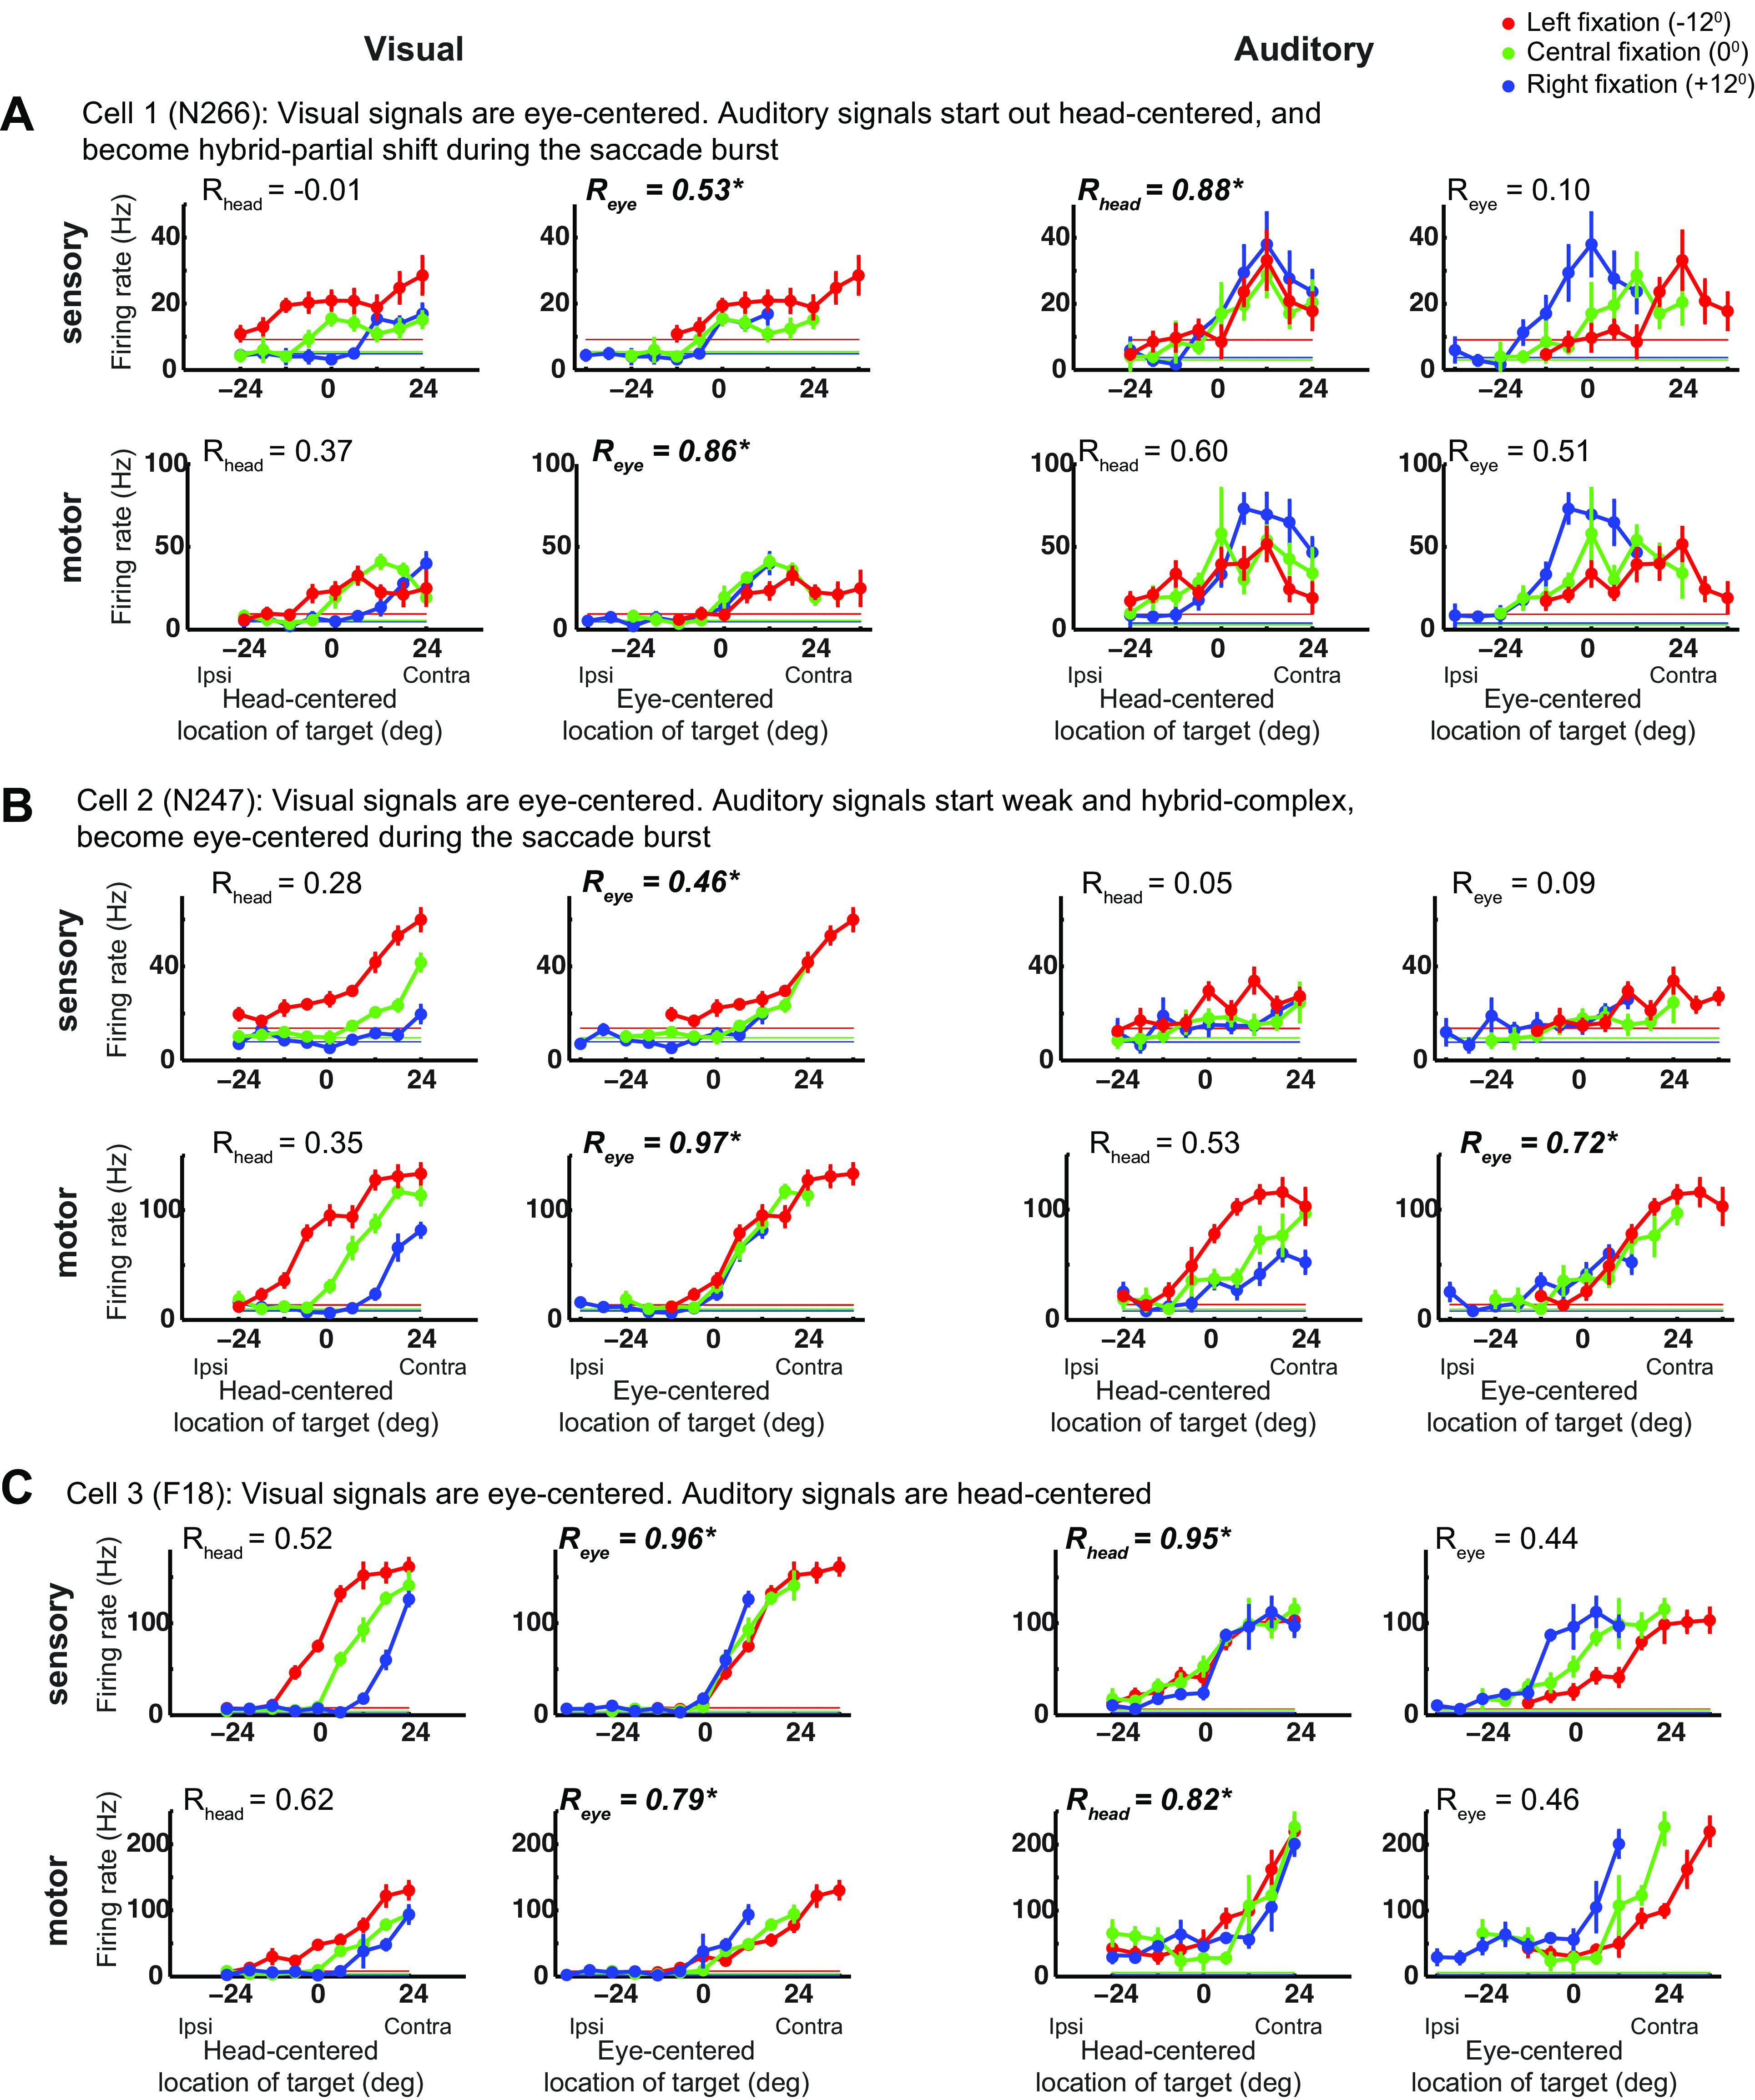
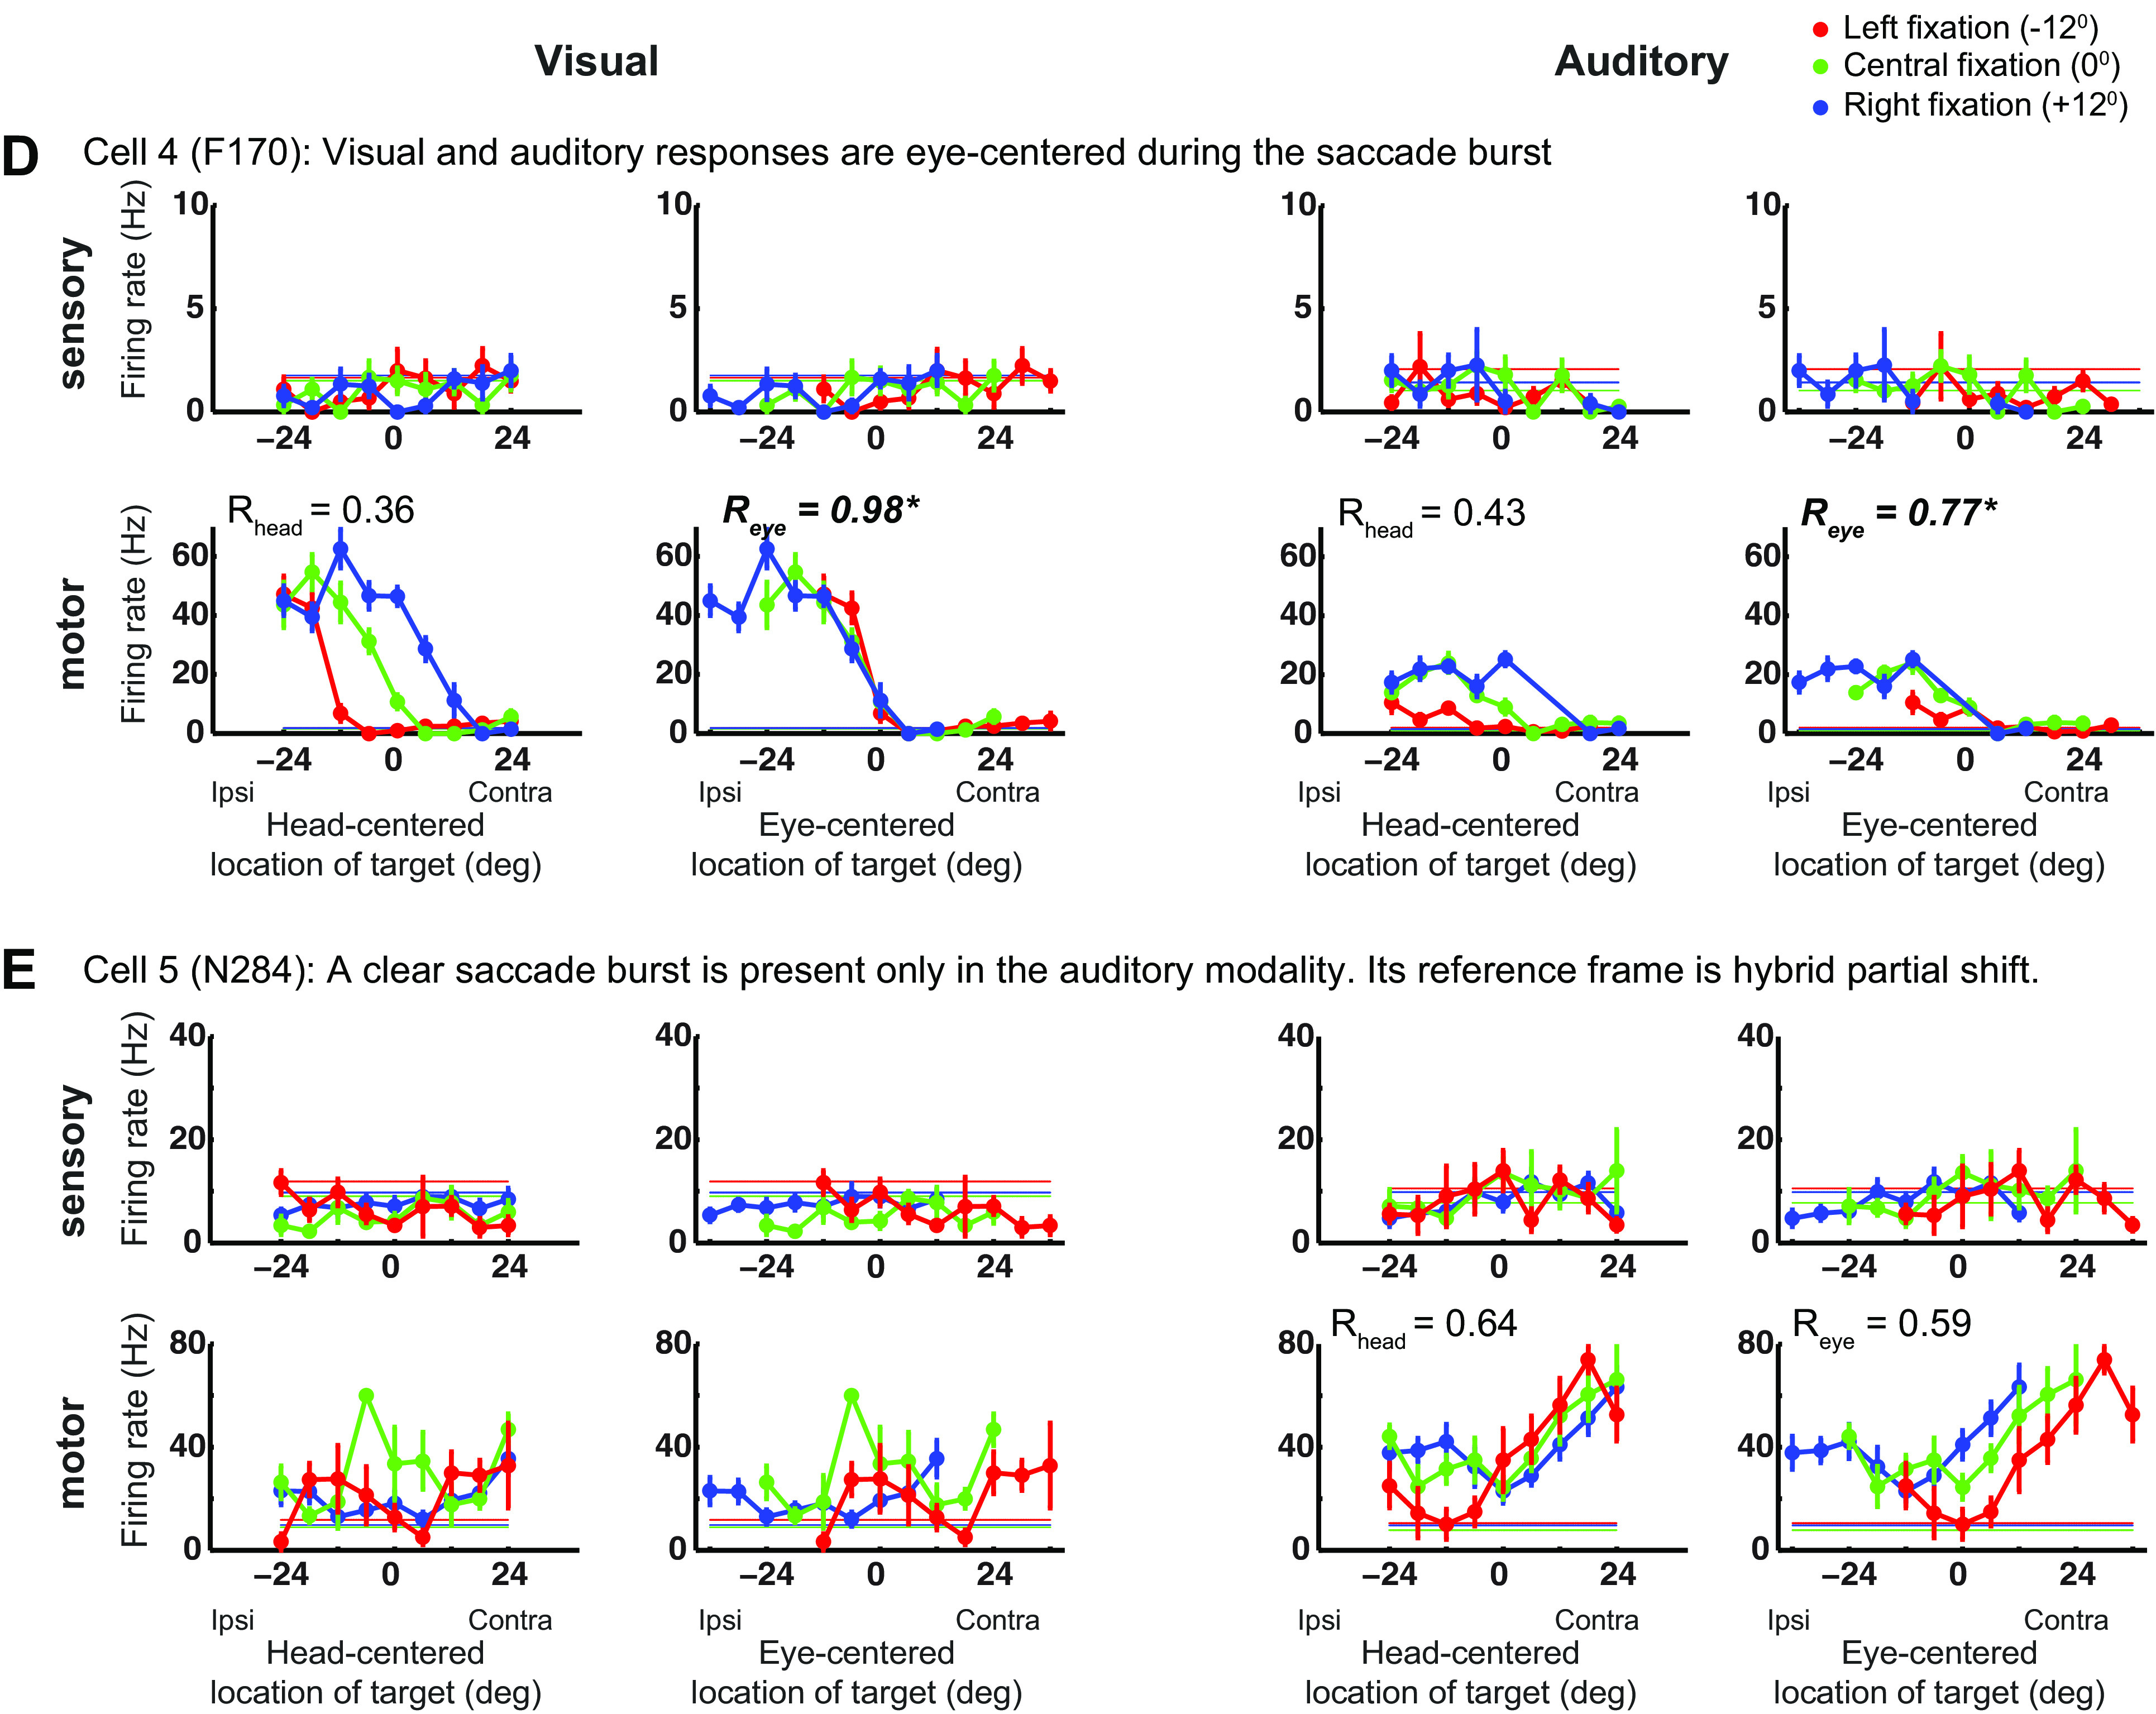
Examples of responses in the FEF. A–E: the three tuning curves from left fixation (in red), central fixation (in green), and right fixation (in blue) for an example cell during the sensory and motor period and in the visual and auditory modalities. The tuning curves are plotted in head-centered coordinates (left) and eye-centered coordinates (right). Note that sensory and motor panels have different scales. The horizontal lines indicate the baseline firing rate. The reference frame indices Rhead and Reye are indicated. See main text for a full description. FEF, frontal eye fields.
Figure 4.
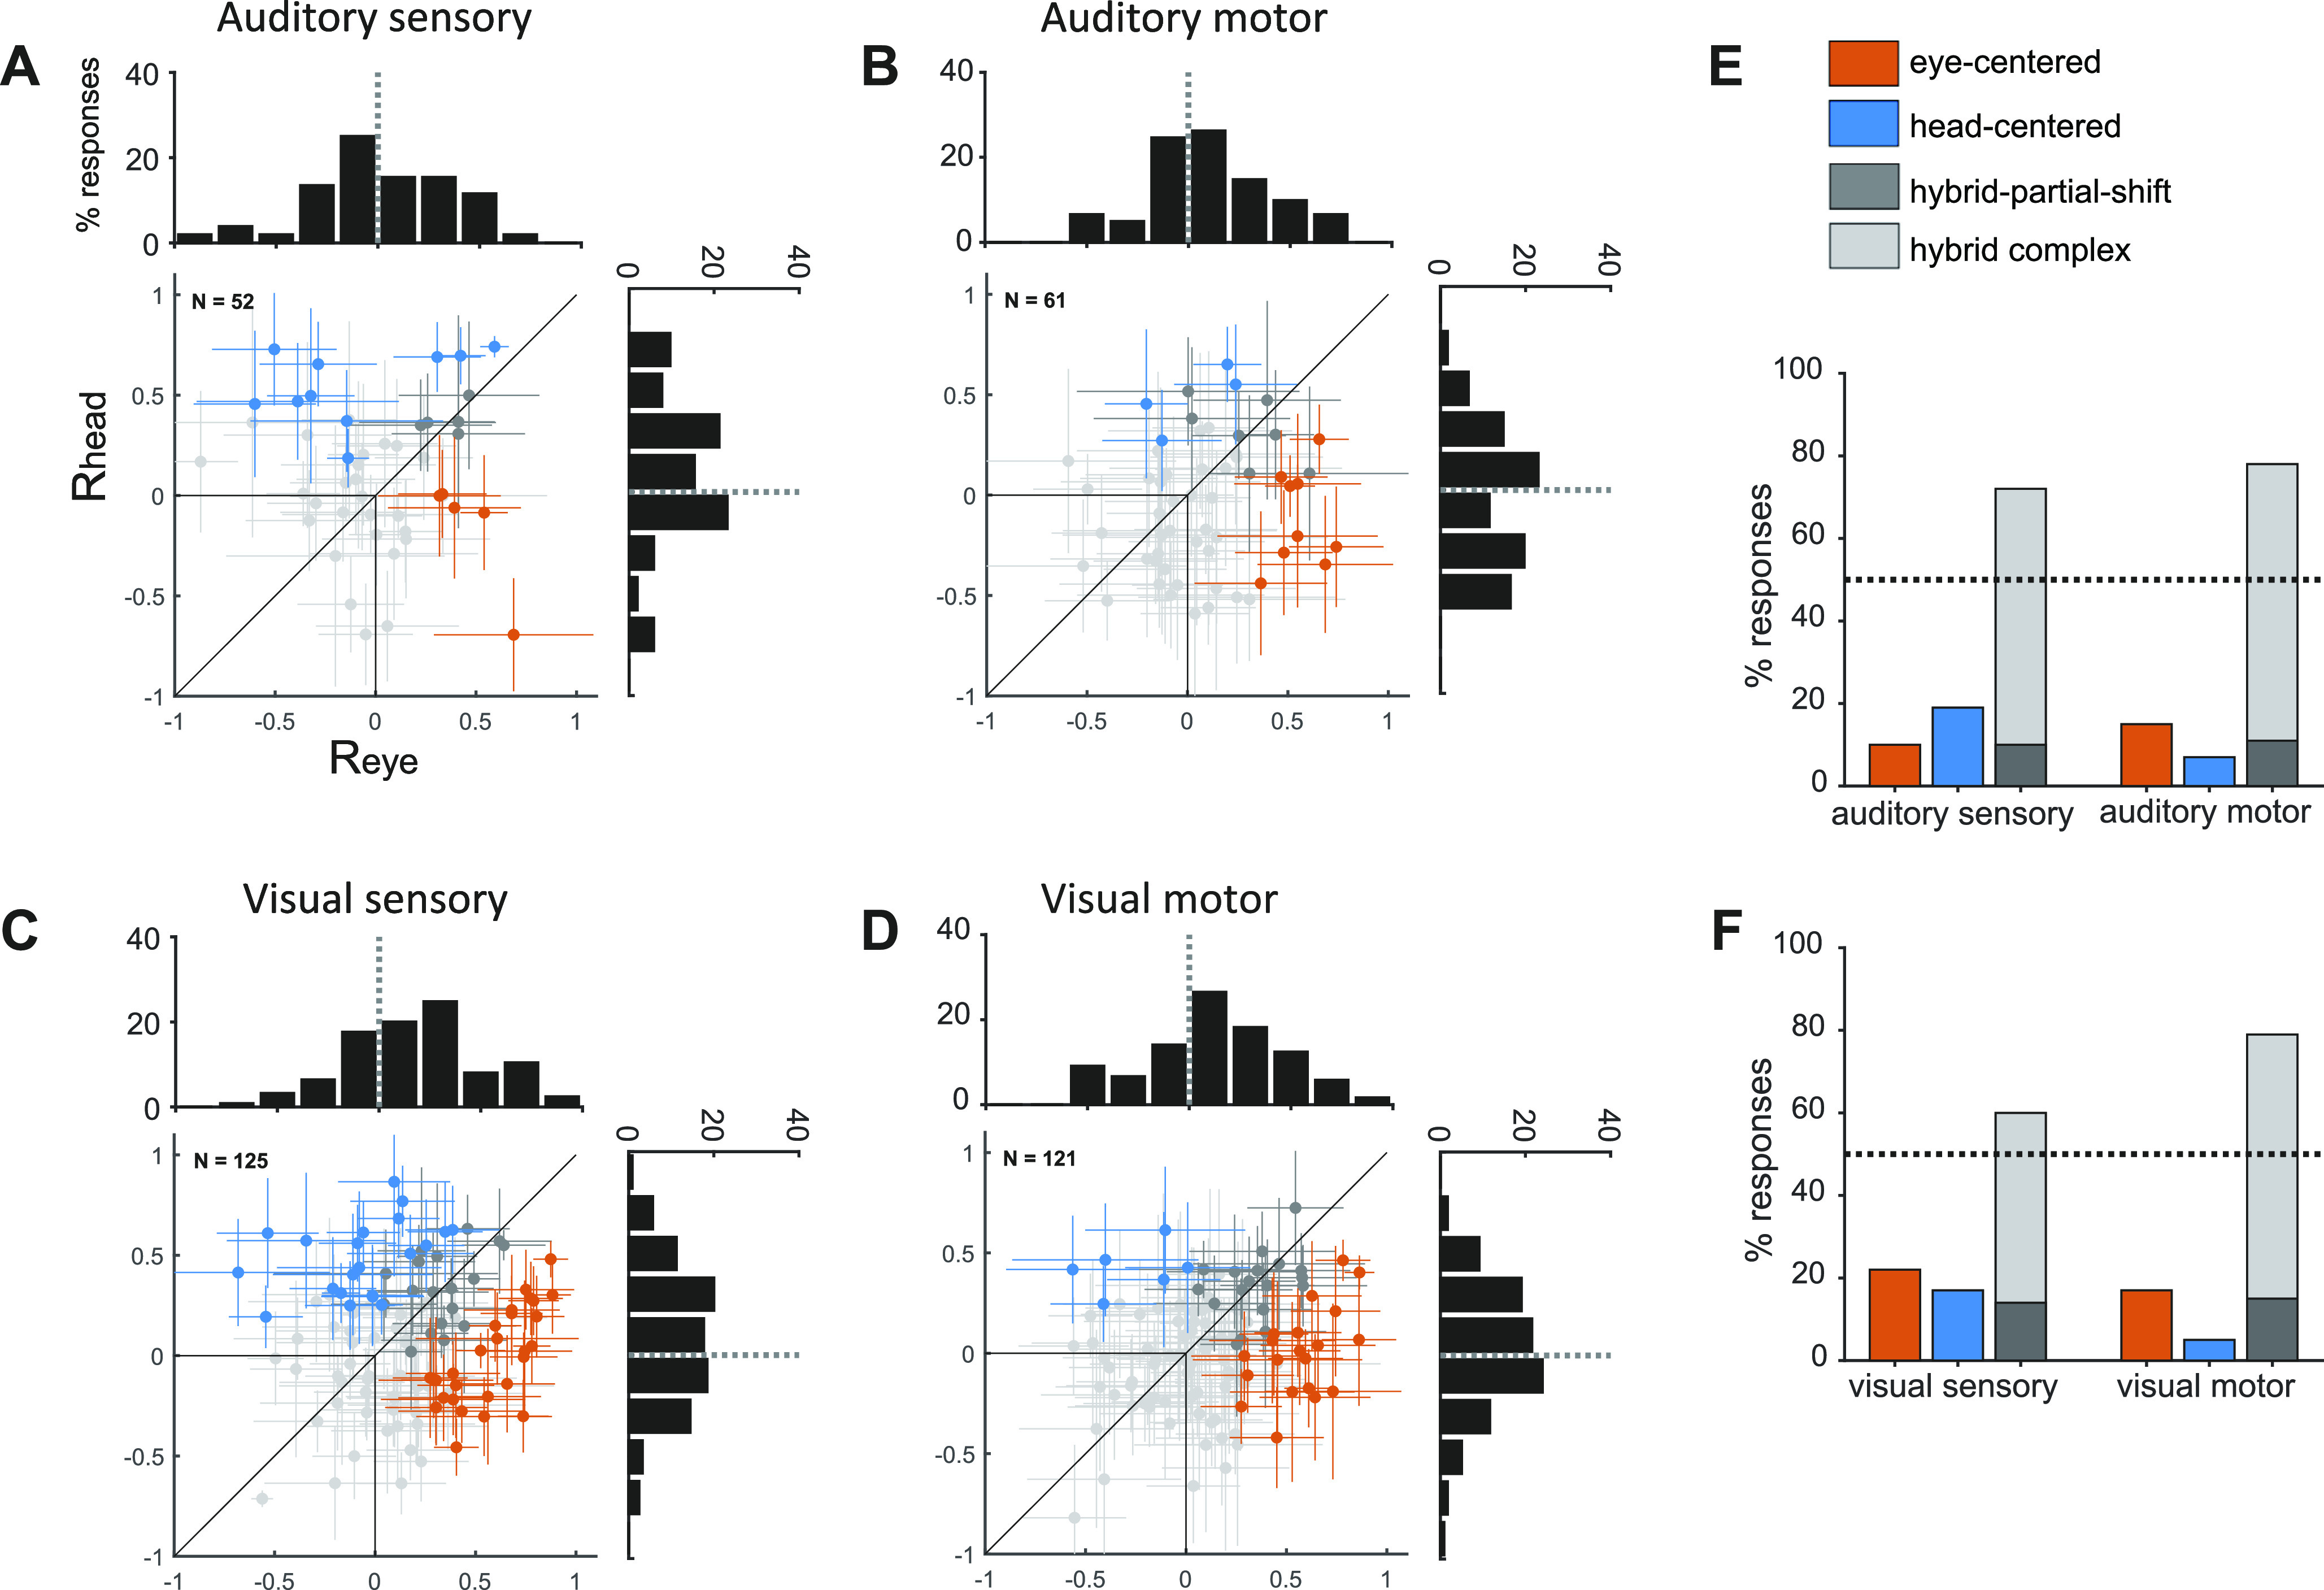
M/LIP single cell reference frames for visual and auditory targets. A–F: presented in the same format as Fig. 3, A–F. Data from Mullette-Gillman et al. (10, 11). M/LIP, lateral and medial parietal cortex.
Figure 5.
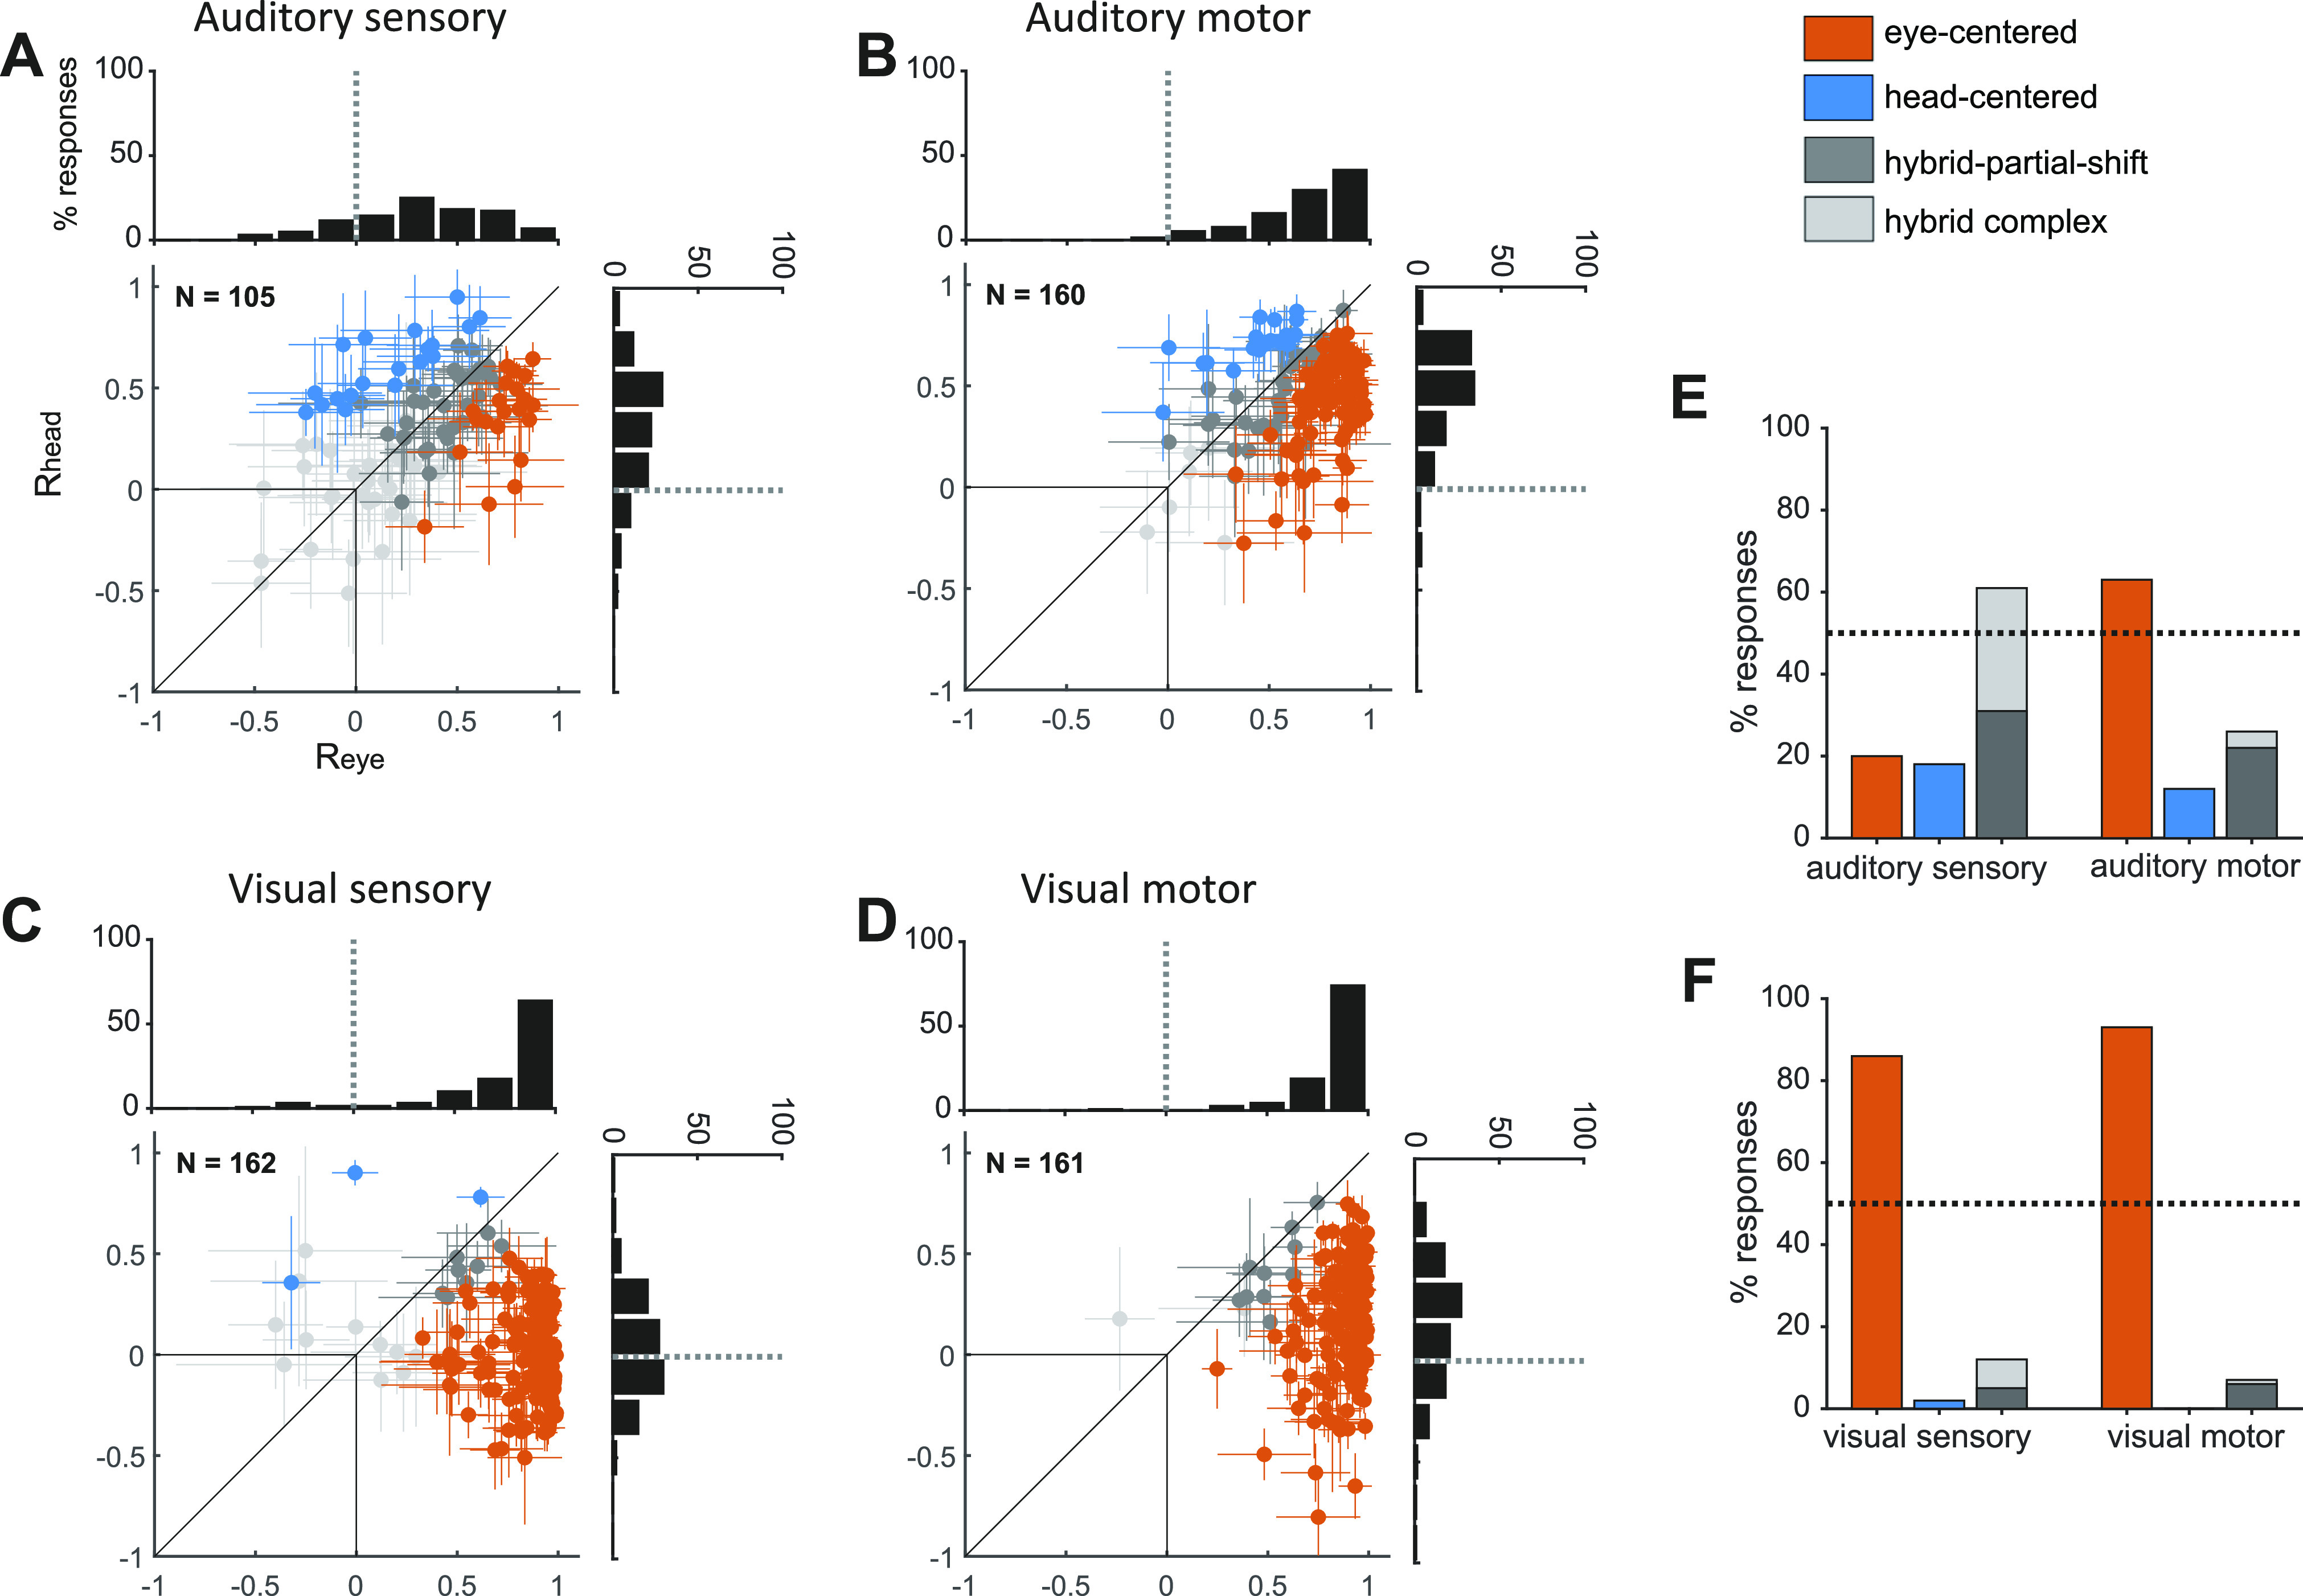
SC single cell reference frames for visual and auditory targets. A–F: presented in the same format as Fig. 3, A–F. Data from Lee and Groh (8). SC, superior colliculus.
We statistically compared Rhead and Reye with a bootstrap analysis (1,000 iterations of 80% of data for each target/fixation combination). This let us classify reference frames as:
eye-centered: if Reye was statistically greater than Rhead,
head-centered: if Rhead was statistically greater than Reye,
hybrid-partial shift: if Reye and Rhead were not statistically different from each other, but they were different from zero, and
hybrid-complex: Reye and Rhead were not statistically different from zero.
Note that the index R is similar to a correlation coefficient: it measures the relative translation of the three tuning curves, and is invariant to changes in gain as long as the recording captures a part of the receptive field (Fig. 1D). This was ensured here by including only spatially selective responses as noted in the paragraph Spatial selectivity; flat responses that do not vary with target location were not considered.
Only five target locations (−12°, −6°, 0°, +6°, and +12°) were included in the analysis, as these were present for all fixation positions in both head- and eye-centered frames of reference. This is a critical aspect of any reference frame comparison because unbalanced ranges of sampling can bias the results in favor of the reference frame sampled with the broader range. In the current study, this bias would have favored an eye-centered reference frame.
Note that any vertical shifts in the receptive field position that might accompany shifts in horizontal fixation were not assessed in this study. If sizeable, such shifts would likely result in the neuron under study being classified as hybrid-complex or hybrid-partial shift.
Data Availability
The data and computer code that support the findings of this study are available from the corresponding authors upon reasonable request.
RESULTS
Overview
We quantitatively evaluated the reference frames of visual and auditory targets represented in three brain areas (M/LIP, FEF, and SC) at target onset and during a saccade execution. We integrated new data (auditory representations in FEF) with previously reported data (2, 8, 10, 11, 19).
The task and recording techniques were the same across all brain areas: single unit recordings in two monkeys performing saccades to visual or auditory targets at variable horizontal locations and from different initial eye positions (Fig. 1, B and C).
Figure 1, D–K shows a summary of possible reference frames exemplified by three hypothetical tuning curves (color coded by the initial gaze direction and plotted in head-centered or eye-centered coordinates). Eye-centered tuning curves align well in eye-centered coordinates (Fig. 1D), while head-centered tuning curves align in head-centered coordinates (Fig. 1E). We show two possible ways in which cells deviated from this schema. Namely, we define a “hybrid-partial shift” frame, in which tuning curves with similar shapes are not perfectly aligned in eye- or head-centered coordinates (Fig. 1F), and a “hybrid-complex” frame, in which tuning curves vary in shape and location when the initial fixation changes (Fig. 1G). This classification was performed by measuring and comparing the relative alignment of each cell’s three tuning curves in head- and eye-centered coordinates with the reference frame indices, Rhead and Reye, as shown in Fig. 1, H–K. In eye-centered representations Reye is statistically greater than Rhead; in head-centered representations the opposite relation holds (Rhead > Reye); in hybrid-partial shift representations, the two indices are both statistically greater than zero but not different from each other (Reye ≈ Rhead ≠ 0); and in hybrid-complex representations the two indices are not statistically different from zero (Reye ≈ Rhead ≈ 0).
We included single neuron responses only if we were able to sample at least part of the receptive field during the recordings. Neurons were excluded if they did not exhibit responsiveness (t test comparing responses to all targets during relevant response period to baseline) and spatial selectivity to target location (ANOVAs; see materials and methods).
We first present the new data concerning the auditory reference frame in FEF, then turn to how visual and auditory signals change across brain areas.
FEF Auditory Response Patterns Are Predominantly Hybrid
Individually, neurons in the FEF showed considerable heterogeneity of reference frame. Figure 2 shows visual and auditory response profiles at target onset and at saccade execution for five example cells. In Fig. 2, A–C, visual responses are eye-centered, whereas auditory responses vary across cells and response period. In Fig. 2A, auditory signals are head-centered at target onset (compare Rhead and Reye: 0.88 vs. 0.1) and become hybrid-partial shift during the saccade (Rhead = 0.60 vs. Reye = 0.51). In Fig. 2B, auditory responses are hybrid-complex at target onset and become eye-centered during the saccade. Finally, in Fig. 2C, auditory signals are head-centered in both periods. Figure 2, D–E shows two cells that did not respond to visual and auditory targets, but fired during saccades. In Fig. 2D, such motor activity was classified as eye-centered in both modalities. In Fig. 2E, the auditory motor activity was classified as hybrid-partial shift, whereas the visual motor activity was not classified as it did not pass the tuning criteria (the response was higher than baseline but did not vary with target location, see materials and methods).
Although individual cells could be found anywhere along the spectrum from head-centered to eye-centered (Fig. 2 and Fig. 3, A–F), the majority of auditory responses in FEF were hybrid, at target onset as well as during saccade execution. When the Rhead and Reye values for individual neurons are plotted against each other (Fig. 3, A and B), the 95% confidence intervals of those values overlap, indicating that auditory responses from different initial eye positions are not better aligned in eye-centered or head-centered coordinates (gray cross hairs).
Treating reference frame as a category, fewer than 20% of FEF auditory sensory responses were cleanly classified as head-centered (18%) or eye-centered (15%) (orange and blue points in Fig. 3, A and B, orange and blue bars in Fig. 3E). At saccade execution, the proportion of eye-centered auditory responses doubled to 30%, whereas head-centered responses decreased to 9%. Thus, in the auditory modality, there was a limited shift in time toward eye-centered representations during saccade execution. However, auditory eye-centered responses remained modest in prevalence compared to auditory hybrid responses (stably around 60% throughout the task, Fig. 3E), and to visual eye-centered responses (also around 60% throughout the task, Fig. 3F). The difference between auditory and visual motor reference frames cannot be attributed to a difference in the strength of visual and auditory population responses, as these had a similar average magnitude (20).
The shift in auditory reference frame and the differences between visual and auditory coding were also evident in the distribution of values of the Reye and Rhead indices (see histograms in Fig. 3, A–D). For each condition, we compared the population-average magnitude of Reye and Rhead with a t test at a Bonferroni-adjusted α level of 0.0125 (0.05/4). For auditory signals, Reye was statistically greater than Rhead in the motor period (t test, P < 10−3), but not in the sensory period (t test, P = 0.8), whereas for visual signals Reye was consistently larger than Rhead (t test, P < 10−3).
This finding held for finer time scales as well: Fig. 3, G and H plot the average population values of Reye and Rhead across time (100 ms bins). Visual responses were predominantly, though not fully, eye-centered from target onset to saccade completion (2), whereas auditory responses only slightly shifted toward eye-centeredness at the time of a saccade and did not reach the level of eye-centeredness seen for visual signals. This indicates that the representations of these two modalities remained discrepant at this brain area and temporal stage of neural processing.
Evolution of Coordinates across M/LIP, FEF, and SC
The pattern of classification of auditory reference frames in the FEF appears intermediate to those we previously assessed in the M/LIP and SC with the same experimental paradigm, shown in Figs. 4 and 5 (8, 10, 11). The comparison of Fig. 3, A–F with Figs. 4 and 5 suggests that both visual and auditory signals undergo a reference frame transformation across areas: signals in M/LIP are less eye-centered/more hybrid than FEF for both modalities, and more eye-centered/less hybrid in the SC than FEF. However, although the final stage of this transformation is represented by eye-centered motor signals in the SC, the evolution across area and time appears different for visual and auditory signals: there is little change in reference frame across time for either modality in M/LIP whereas in the SC visual signals can largely be categorized as eye-centered in both temporal epochs and auditory signals become eye-centered by the time of the saccade.
To quantify the dynamics of coordinate transformation across modalities, we statistically compared the degree of eye-centeredness (mean Reye) by areas (M/LIP, FEF, SC), response period (sensory, motor), and target modality (visual, auditory) with a three-way ANOVA (Fig. 6, A and B and Table 1). Neural representations of target location became more eye-centered along the pathway from M/LIP to FEF to SC, but this trend was different across modality (Reye was higher and increased more steeply for visual signals, as indicated by the significant interaction between area and modality) and for sensory versus motor responses (Reye was higher and increased more steeply for motor responses, as indicated by the significant interaction between area and response period). For all areas, the degree of eye-centeredness of visual signals was fairly stable across sensory and motor periods, whereas auditory signals became more eye-centered during the motor period (interaction between modality and response period).
Figure 6.
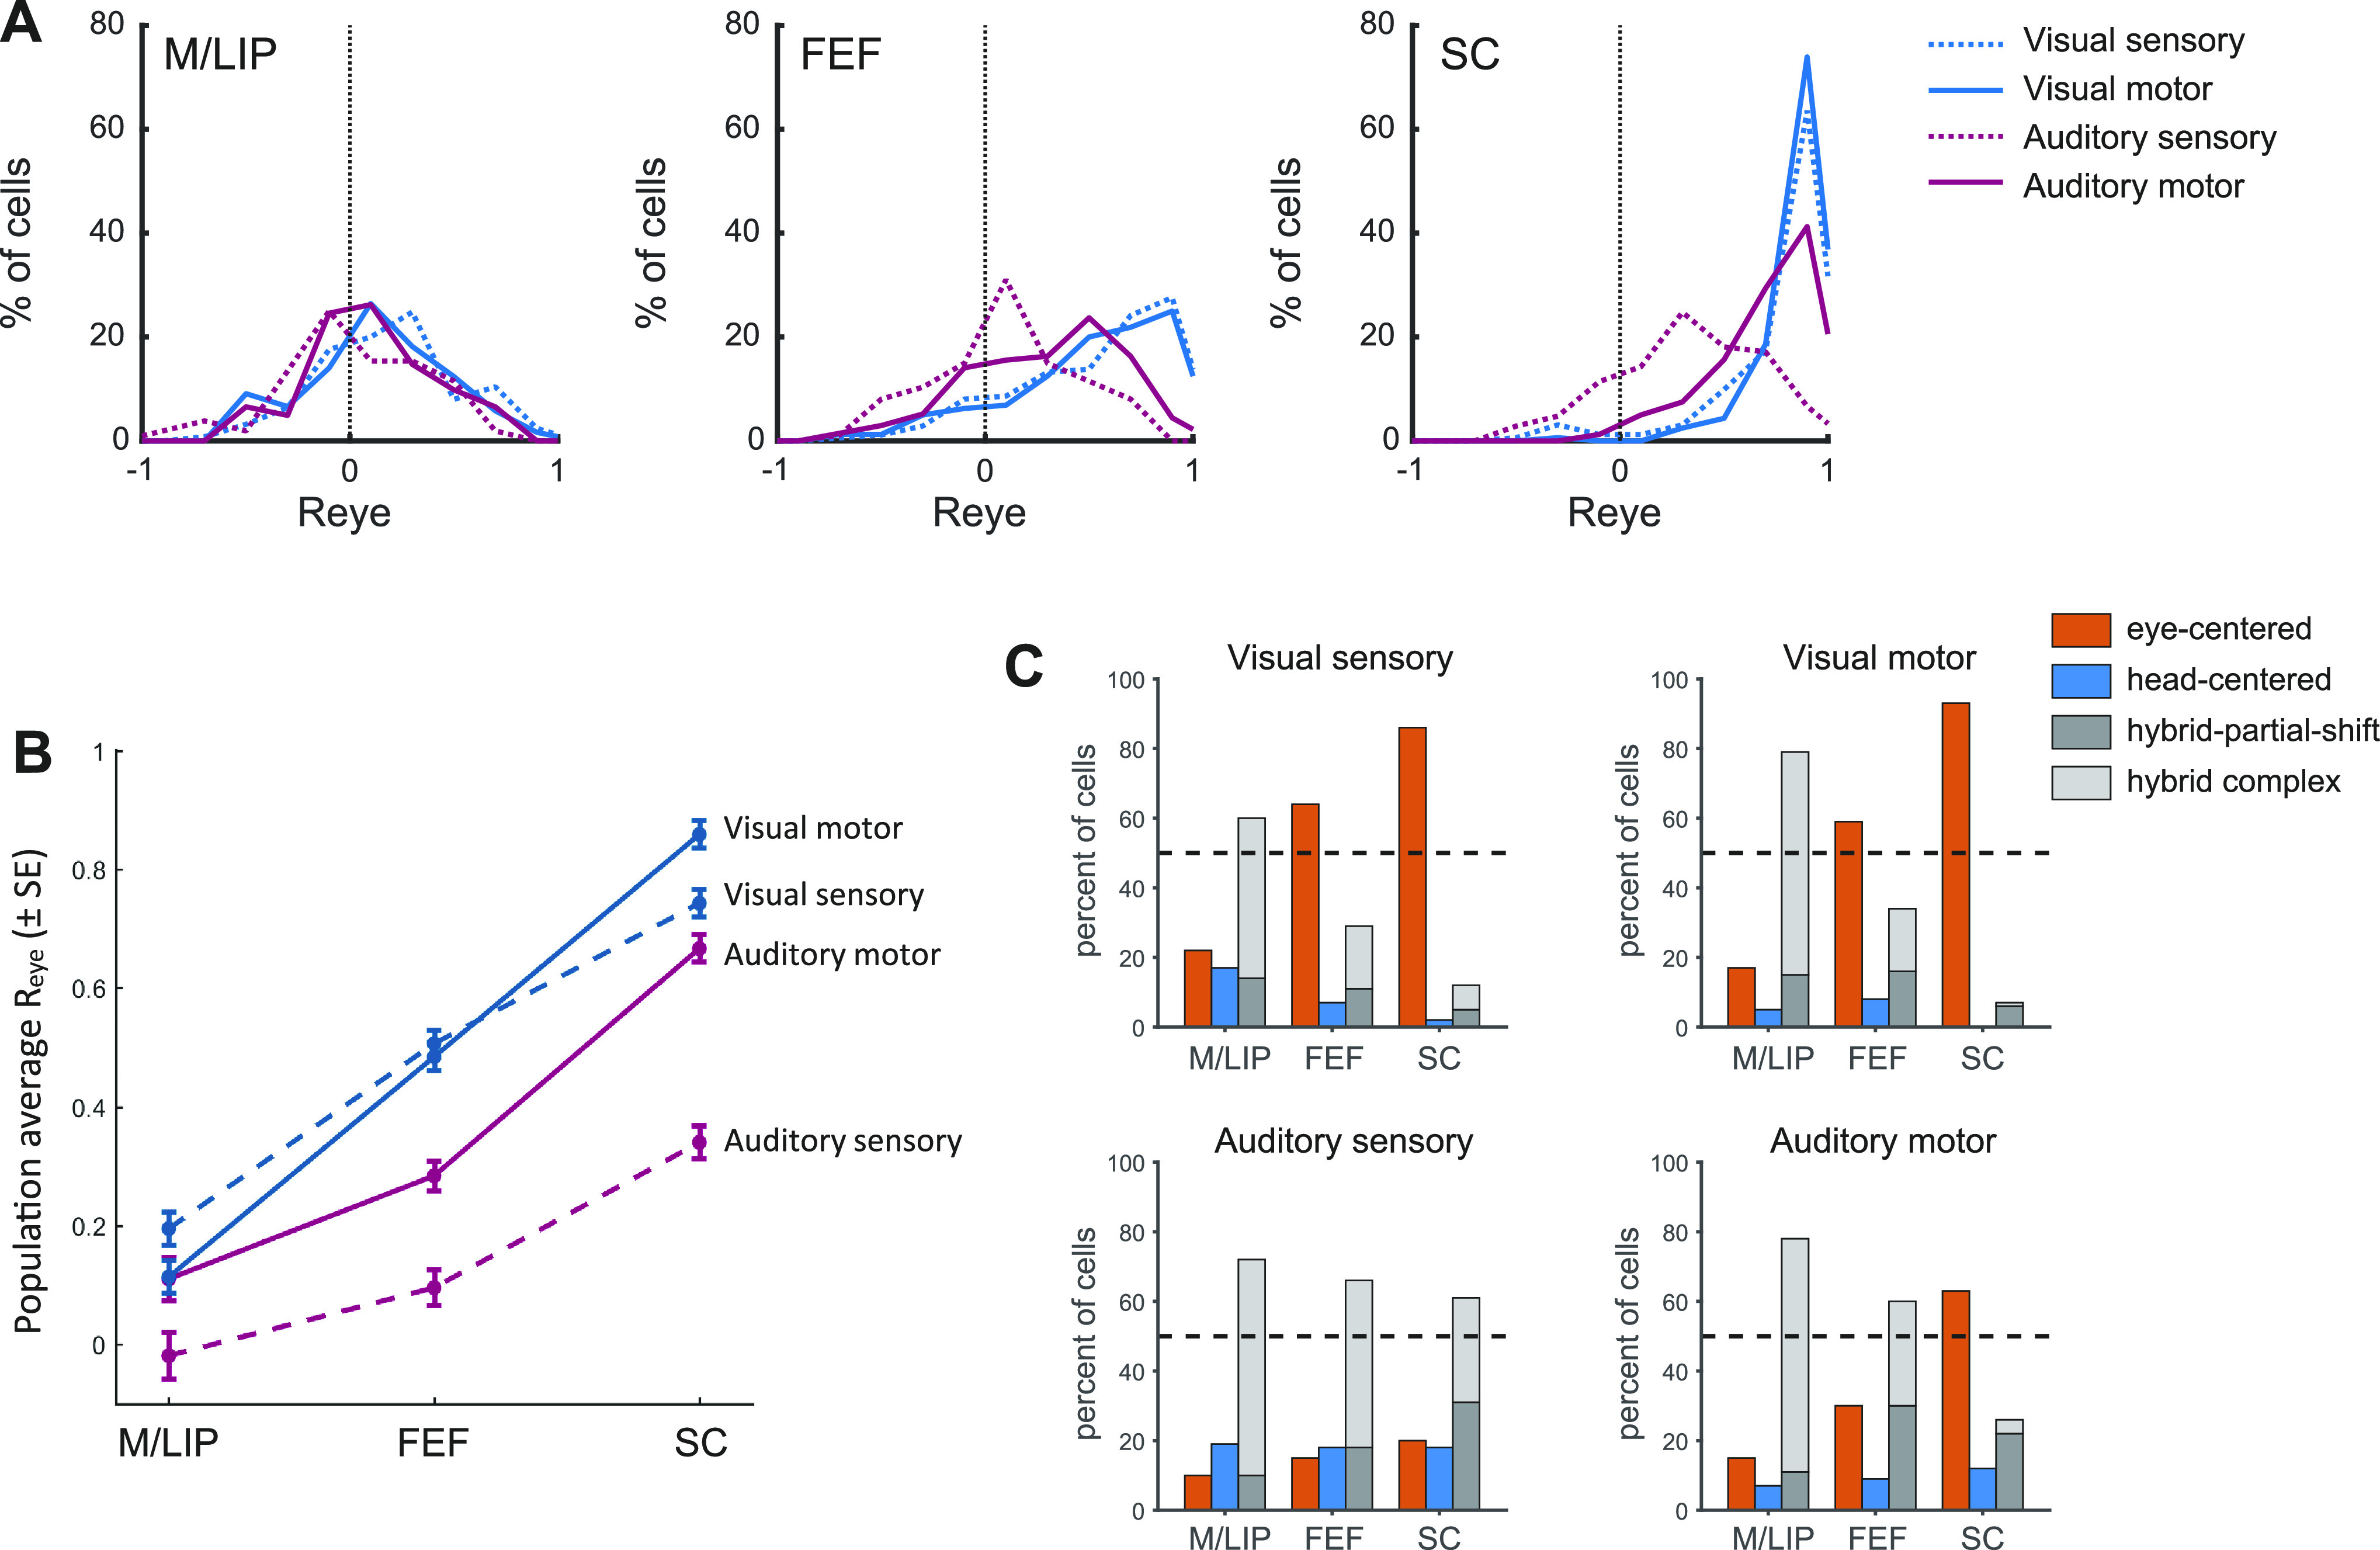
Coordinate transformation across brain areas, modality and response period. A: distribution of Reye for visual and auditory signals in the sensory and motor periods in each area (M/LIP, FEF, and SC). B: average degree of eye-centeredness (mean Reye) across neural populations in M/LIP, FEF, and SC for visual and auditory locations, at target onset, and at saccade execution. FEF, frontal eye field; M/LIP, lateral and medial parietal cortex; SC, superior colliculus.
Table 1.
Three-way ANOVA measuring the effect of recording location (M/LIP, FEF, SC), target modality (visual vs. auditory) and response period (target onset vs. saccade) on the average Reye
| Effect | df | F | P | η2 |
|---|---|---|---|---|
| Area | 2 | 343.1 | <10−3 | 0.253 |
| Modality | 1 | 226.1 | <10−3 | 0.083 |
| Response period | 1 | 34.5 | <10−3 | 0.013 |
| Area × modality | 2 | 30.8 | <10−3 | 0.023 |
| Area × period | 2 | 18.3 | <10−3 | 0.013 |
| Period × modality | 1 | 19.3 | <10−3 | 0.007 |
| Area × modality × period | 2 | 0.8 | 0.45 | 0.0006 |
The data were Fisher transformed for the analysis. FEF, frontal eye fields; M/LIP, lateral and medial parietal cortex; SC, superior colliculus.
The classification of individual neuronal responses as eye-centered, head-centered, and hybrid across areas, modality, and response period, confirmed the different dynamics in the visual and auditory coordinate transformation (Fig. 6C). The proportion of visual responses classified as eye-centered steadily grew from M/LIP to FEF to SC, whereas eye-centered auditory responses remained a minority in M/LIP and FEF and increased to over 60% in the SC in the motor period. Furthermore, Fig. 6C shows that across all areas the proportion of head-centered responses was very low at all times (<20%). Thus, the transformation occurs from hybrid to eye-centered coordinates. Among hybrid responses, the class of hybrid-complex, which captures changes other than partial shifts of the receptive fields, was the biggest category in the M/LIP for both visual and auditory responses and a sizeable category in FEF and SC during auditory sensory responses. This suggests that the variability of M/LIP neural responses might not be fully understood under the lens of shifting receptive fields.
This general pattern is confirmed by the fine time course of the population Reye across modality and area (Fig. 7): the degree of eye-centeredness was consistently higher in the SC than in the FEF, which was in turn higher than M/LIP. This was true for both visual (Fig. 7A) and auditory modalities (Fig. 7B). However, the SC was the only structure to consistently show an average eye-centeredness that exceeded 0.5, and it did so throughout for visual stimuli, but only at the time of the saccade for auditory stimuli.
In summary, the coordinate transformation for visual and auditory signals appears to reach a final eye-centered format via different dynamics through M/LIP and FEF to SC: visual signals gradually shift from hybrid to eye-centered, whereas auditory signals remain hybrid throughout the two cortical levels and only become eye-centered at the SC’s motor command stage.
DISCUSSION
We compared the reference frames for auditory and visual space in three brain areas (M/LIP, FEF, and SC) during a sensory guided saccade task. At sound onset, auditory signals were not encoded in pure eye-centered or head-centered reference frames, but rather employed hybrid codes in which the neural responses depended on both head-centered and eye-centered locations. During the saccade, auditory responses became more eye-centered in the SC and to a lesser extent in the FEF. The SC was the only region showing a majority of eye-centered auditory motor signals. Hybrid responses were also common in the visual modality, in particular in FEF and M/LIP. They constituted a majority of the response patterns in M/LIP. The proportion of eye-centered visual signals increased in the FEF and SC compared to M/LIP. Any potential differences within the intraparietal cortex, such as between the medial and lateral banks of the sulcus, were not investigated in the present study.
To quantify single neuron reference frames, we adopted a correlation approach and measured the degree to which neural signals were anchored to the locations of the eye or the head when these locations were experimentally misaligned. To avoid bias in the estimates of single neurons’ reference frame, we sampled space symmetrically in both coordinate systems, eliminating any “extra” locations that existed in one reference frame but not the other. Without such balanced sampling, the estimate would be erroneously high in favor of the more extensively sampled reference frame. For example, early studies in intraparietal cortex concluded that visual representations were eye-centered with an eye position gain modulation (e.g., Ref. 25), but a later study suggested that this finding may have been due to inadequate sampling in a head-centered frame of reference (11).
The limitations of our approach are related to the possibility that systematic changes in neural responses across populations and task conditions might affect measures of neural signals’ alignment. For example, low response strength, high trial-to-trial variability, and low spatial selectivity would each reduce the correlation measures in both coordinate systems, resulting in more hybrid estimates. However, we did characterize strong eye-centered and head-centered representations in all regions and modalities, indicating that multiple reference frames were active, beyond hybrid signals. Indeed, there is consensus in the literature that eye movements/changes in eye position affect visual and auditory signals in all of the areas we tested here (1, 5, 7, 8, 10–13, 15–17, 21–46).
Differences in how spatial information is coded across sensory systems pose problems for the perceptual integration of the different sensory inputs that arise from a common source, such as the sight and sound of someone speaking. As the discovery of auditory response functions that shift with changes in eye position (39), the model for visual-auditory integration has been that visual signals remain in eye-centered coordinates and auditory signals are converted into that same format. Some experimental results, however, cannot be explained under this view. In particular, “pure” reference frames, representations in which the responses are clearly better anchored to one frame of reference over all others, have proved surprisingly rare. In the experiments described here, only the SC contains strongly eye-centered representations, for visual signals during both sensory and motor periods, and for auditory signals only in the motor period. All other observed codes appear to be at least somewhat impure, with individual neurons exhibiting responses that are not well captured by a single reference frame as well as different neurons employing different reference frames across the population. Hybrid, intermediate, impure, or otherwise idiosyncratic reference frames have also been observed in numerous other studies (3, 4, 10, 11, 14, 15, 47).
A possible explanation for such hybrid states is that coordinate transformations might be computationally difficult to achieve and hybrid codes represent intermediate steps of a coordinate transformation that unfolds across brain regions and time. Our results lend empirical support to this notion of a gradual, transformative process. However, why such a transformation should unfold across time and brain areas is unclear from a theoretical perspective. Although some models of coordinate transformations involve multiple stages of processing (e.g., Refs. 40, 45, 48, and 49), there also exist computational models of coordinate transformations in one step (50). Thus, the computational or evolutionary advantages of such a system remain unclear. Models using time-varying signals such as eye velocity signals to accomplish the coordinate transformation would be a good place to start to explore how this computation unfolds dynamically (e.g., Refs. 40 and 51).
Regardless, hybrid codes contain the necessary information to keep track of where targets are with respect to multiple motor effectors, and may therefore facilitate flexible mappings of multiple behaviors or computations on the same stimuli in different contexts (52, 53). In other words, hybrid representations, at least hybrid partial-shift, are easily read-out codes. As such, hybrid might be the actual representational format for visual and auditory targets in the oculomotor system, rather than an intermediate step in a coordinate transformation. In this scenario, it is plausible that visual and auditory signals become maximally similar in the SC at the moment in which a particular behavioral response, namely a saccade, is executed, as the SC is a key control point in the oculomotor system, not only encoding target location in abstract, but also controlling the time profile and dynamic aspects of saccadic movements (54, 55).
The exact mechanism by which auditory signals become predominantly eye-centered in the SC is unknown. Our data do not fully resolve whether a coordinate transformation unfolds locally within the SC, or whether it reflects preferential sampling of eye-centered auditory information through mechanisms of gating or selective read-out. Indeed, the SC gets auditory inputs primarily from FEF and inferior colliculus (IC), both containing a variety of simultaneous auditory representations, from head-centered to eye-centered (see Fig. 3 and Ref. 56).
Apparent mixtures of different reference frames could also be a consequence of the use of different coding formats across time, with individual neurons switching between different reference frames for different individual epochs of time. Response measures that involve averaging across time and across trials would yield apparently hybrid or intermediate reference frames when in reality, one reference frame might dominate at each instant in time. We recently presented evidence that neurons can exhibit fluctuating activity patterns when confronted with two simultaneous stimuli and suggested that such fluctuations may permit both items to be encoded across time in the neural population (57). Similar activity fluctuations might permit interleaving of different reference frames across time, with the balance of which reference frame dominates shifting across brain areas and across time. At the moment, this hypothesis is difficult to test because the statistical methods deployed in Caruso et al. (57) require being able to ascertain the responses to each condition in isolation of the other, but every reference frame exists concurrently. Novel analysis methods, perhaps relying on correlations between the activity patterns of simultaneously recorded neurons, are needed to address this question.
A possible clue that activity fluctuations may be an important factor comes from studies of oscillatory activity. If neural activity fluctuates on a regular cycle and in synchrony with other neurons, the result is oscillations in the field potential. Indeed, studies of the coding of tactile stimuli in saccade tasks provide evidence for different reference frames encoded in different frequency bands, in different brain areas and at different periods of time. In the context of saccade generation, oscillations could allow the selection of one reference frame by adjusting the weights of spatial information received from different populations, in essence flexibly recruiting eye-centered populations (58–61).
In summary, our results suggest that new ways of thinking about how visual and auditory spaces are integrated, beyond simplistic notions of a single pure common reference frame and registration between visual and auditory receptive fields, are needed.
GRANTS
This work was supported by the National Institute of Health Grants NIH (NIDCD) R01 DC013906; NIH (NIDCD) R01 DC016363; and NIH R01 NS50942-05.
DISCLOSURES
No conflicts of interest, financial or otherwise, are declared by the authors.
AUTHOR CONTRIBUTIONS
V.C.C. and J.M.G. conceived and designed research; V.C.C. and D.S.P. performed experiments; V.C.C. analyzed data; V.C.C. and J.M.G. interpreted results of experiments; V.C.C. and J.M.G. prepared figures; V.C.C. and J.M.G. drafted manuscript; V.C.C., D.S.P., M.A.S., and J.M.G. edited and revised manuscript; V.C.C., D.S.P., M.A.S., and J.M.G. approved final version of manuscript.
ACKNOWLEDGMENTS
The authors are grateful to Jessi Cruger, Karen Waterstradt, Christie Holmes, and Stephanie Schlebusch for animal care, and to Tom Heil and Eddie Ryklin for technical assistance. The authors have benefitted from thoughtful discussions with Jungah Lee, Kurtis Gruters, Shawn M. Willett, Jeffrey M. Mohl, David Murphy, Bryce Gessell, and James Wahlberg.
REFERENCES
- 1.Andersen RA, Mountcastle VB. The influence of the angle of gaze upon the excitability of the light-sensitive neurons of the posterior parietal cortex. J Neurosci 3: 532–548, 1983. doi: 10.1523/JNEUROSCI.03-03-00532.1983. [DOI] [PMC free article] [PubMed] [Google Scholar]
- 2.Caruso VC, Pages DS, Sommer MA, Groh JM. Beyond the labeled line: variation in visual reference frames from intraparietal cortex to frontal eye fields and the superior colliculus. J Neurophysiol 119: 1411–1421, 2018. doi: 10.1152/jn.00584.2017. [DOI] [PMC free article] [PubMed] [Google Scholar]
- 3.Chang SW, Snyder LH. Idiosyncratic and systematic aspects of spatial representations in the macaque parietal cortex. Proc Natl Acad Sci USA 107: 7951–7956, 2010. doi: 10.1073/pnas.0913209107. [DOI] [PMC free article] [PubMed] [Google Scholar]
- 4.Chen X, Deangelis GC, Angelaki DE. Diverse spatial reference frames of vestibular signals in parietal cortex. Neuron 80: 1310–1321, 2013. doi: 10.1016/j.neuron.2013.09.006. [DOI] [PMC free article] [PubMed] [Google Scholar]
- 5.DeSouza JF, Dukelow SP, Gati JS, Menon RS, Andersen RA, Vilis T. Eye position signal modulates a human parietal pointing region during memory-guided movements. J Neurosci 20: 5835–5840, 2000. doi: 10.1523/JNEUROSCI.20-15-05835.2000. [DOI] [PMC free article] [PubMed] [Google Scholar]
- 6.Duhamel JR, Bremmer F, Ben-Hamed S, Graf W. Spatial invariance of visual receptive fields in parietal cortex neurons. Nature 389: 845–884, 1997.doi: 10.1038/39865. [DOI] [PubMed] [Google Scholar]
- 7.Jay MF, Sparks DL. Sensorimotor integration in the primate superior colliculus. II. Coordinates of auditory signals. J Neurophysiol 57: 35–55, 1987. doi: 10.1152/jn.1987.57.1.35. [DOI] [PubMed] [Google Scholar]
- 8.Lee J, Groh JM. Auditory signals evolve from hybrid- to eye-centered coordinates in the primate superior colliculus. J Neurophysiol 108: 227–242, 2012. doi: 10.1152/jn.00706.2011. [DOI] [PMC free article] [PubMed] [Google Scholar]
- 9.Monteon JA, Wang H, Martinez-Trujillo J, Crawford JD. Frames of reference for eye-head gaze shifts evoked during frontal eye field stimulation. Eur J Neurosci 37: 1754–1765, 2013. doi: 10.1111/ejn.12175. [DOI] [PubMed] [Google Scholar]
- 10.Mullette-Gillman OA, Cohen YE, Groh JM. Eye-centered, head-centered, and complex coding of visual and auditory targets in the intraparietal sulcus. J Neurophysiol 94: 2331–2352, 2005. doi: 10.1152/jn.00021.2005. [DOI] [PubMed] [Google Scholar]
- 11.Mullette-Gillman OA, Cohen YE, Groh JM. Motor-related signals in the intraparietal cortex encode locations in a hybrid, rather than eye-centered, reference frame. Cerebral Cortex 19: 1761–1775, 2009. doi: 10.1093/cercor/bhn207. [DOI] [PMC free article] [PubMed] [Google Scholar]
- 12.Russo GS, Bruce CJ. Frontal eye field activity preceding aurally guided saccades. J Neurophysiol 71: 1250–1253, 1994. doi: 10.1152/jn.1994.71.3.1250. [DOI] [PubMed] [Google Scholar]
- 13.Sajad A, Sadeh M, Yan X, Wang H, Crawford JD. Transition from target to gaze coding in primate frontal eye field during memory delay and memory-motor transformation. eNeuro 3: ENEURO.0040-16.2016, 2016. doi: 10.1523/ENEURO.0040-16.2016. [DOI] [PMC free article] [PubMed] [Google Scholar]
- 14.Schlack A, Sterbing-D'Angelo SJ, Hartung K, Hoffmann KP, Bremmer F. Multisensory space representations in the macaque ventral intraparietal area. J Neurosci 25: 4616–4625, 2005. doi: 10.1523/JNEUROSCI.0455-05.2005. [DOI] [PMC free article] [PubMed] [Google Scholar]
- 15.Stricanne B, Andersen RA, Mazzoni P. Eye-centered, head-centered, and intermediate coding of remembered sound locations in area LIP. J Neurophysiol 76: 2071–2076, 1996. doi: 10.1152/jn.1996.76.3.2071. [DOI] [PubMed] [Google Scholar]
- 16.Van Opstal AJ, Hepp K, Suzuki Y, Henn V. Influence of eye position on activity in monkey superior colliculus. J Neurophysiol 74: 1593–1610, 1995. doi: 10.1152/jn.1995.74.4.1593. [DOI] [PubMed] [Google Scholar]
- 17.Zirnsak M, Steinmetz NA, Noudoost B, Xu KZ, Moore T. Visual space is compressed in prefrontal cortex before eye movements. Nature 507: 504–507, 2014. doi: 10.1038/nature13149. [DOI] [PMC free article] [PubMed] [Google Scholar]
- 18.Robinson DA. Eye movement control in primates. The oculomotor system contains specialized subsystems for acquiring and tracking visual targets. Science 161: 1219–1224, 1968. doi: 10.1126/science.161.3847.1219. [DOI] [PubMed] [Google Scholar]
- 19.Caruso VC, Pages DS, Sommer MA, Groh JM. Similar prevalence and magnitude of auditory-evoked and visually-evoked activity in the frontal eye fields: implications for multisensory motor control. J Neurophysiol 115: 3162–3172, 2016. doi: 10.1152/jn.00935.2015. [DOI] [PMC free article] [PubMed] [Google Scholar]
- 20.NIH. Guide for the Care and Use of Laboratory Animals, 8 Edition. Washington, DC: National Academies Press, 2011. [PubMed] [Google Scholar]
- 21.Andersen RA, Essick GK, Siegel RM. Encoding of spatial location by posterior parietal neurons. Science 230: 456–458, 1985. doi: 10.1126/science.4048942. [DOI] [PubMed] [Google Scholar]
- 22.Andersen RA, Essick GK, Siegel RM. Neurons of area 7 activated by both visual stimuli and oculomotor behavior. Exp Brain Res 67: 316–322, 1987. doi: 10.1007/BF00248552. [DOI] [PubMed] [Google Scholar]
- 23.Andersen RA, Bracewell RM, Barash S, Gnadt JW, Fogassi L. Eye position effects on visual, memory, and saccade-related activity in areas LIP and 7a of macaque. J Neurosci 10: 1176–1196, 1990. doi: 10.1523/JNEUROSCI.10-04-01176.1990. [DOI] [PMC free article] [PubMed] [Google Scholar]
- 24.Andersen R, Zipser D. The role of the posterior parietal cortex in coordinate transformations for visual-motor integration. Can J Physiol Pharmacol 66: 488–501, 1988. doi: 10.1139/y88-078. [DOI] [PubMed] [Google Scholar]
- 25.Barash S, Bracewell RM, Fogassi L, Gnadt JW, Andersen RA. Saccade-related activity in the lateral intraparietal area: I. Temporal properties; comparison with area 7a. J Neurophysiol 66: 1095–1108, 1991. doi: 10.1152/jn.1991.66.3.1095. [DOI] [PubMed] [Google Scholar]
- 26.Barash S, Bracewell RM, Fogassi L, Gnadt JW, Andersen RA. Saccade-related activity in the lateral intraparietal area II. Spatial properties. J Neurophysiol 66: 1109–1124, 1991. doi: 10.1152/jn.1991.66.3.1109. [DOI] [PubMed] [Google Scholar]
- 27.Batista AP, Buneo CA, Snyder LH, Andersen RA. Reach plans in eye-centered coordinates. Science 285: 257–260, 1999. doi: 10.1126/science.285.5425.257. [DOI] [PubMed] [Google Scholar]
- 28.Berman RA, Heiser LM, Saunders RC, Colby CL. Dynamic circuitry for updating spatial representations. I. Behavioral evidence for interhemispheric transfer in the split-brain macaque. J Neurophysiol 94: 3228–3248, 2005. doi: 10.1152/jn.00028.2005. [DOI] [PubMed] [Google Scholar]
- 29.Berman RA, Heiser LM, Dunn CA, Saunders RC, Colby CL. Dynamic circuitry for updating spatial representations. III. From neurons to behavior. J Neurophysiol 98: 105–121, 2007. doi: 10.1152/jn.00330.2007. [DOI] [PMC free article] [PubMed] [Google Scholar]
- 30.Cassanello CR, Ferrera VP. Computing vector differences using a gain field-like mechanism in monkey frontal eye field. J Physiol 582: 647–664, 2007. doi: 10.1113/jphysiol.2007.128801. [DOI] [PMC free article] [PubMed] [Google Scholar]
- 31.Cohen YE, Andersen RA. Reaches to sounds encoded in an eye-centered reference frame. Neuron 27: 647–652, 2000. doi: 10.1016/S0896-6273(00)00073-8. [DOI] [PubMed] [Google Scholar]
- 32.Colby CL, Duhamel JR, Goldberg ME. The analysis of visual space by the lateral intraparietal area of the monkey: the role of extraretinal signals. In: Progress in Brain Research, edited by Hicks TP, Molotchnikoff S, Ono T. Amsterdam: Elsevier, 1993, pp 307–316. [DOI] [PubMed] [Google Scholar]
- 33.Colby CL, Berman RA, Heiser LM, Saunders RC. Corollary discharge and spatial updating: when the brain is split, is space still unified? Prog Brain Res 149: 187–205, 2005. doi: 10.1016/S0079-6123(05)49014-7. [DOI] [PubMed] [Google Scholar]
- 34.DeSouza JF, Keith GP, Yan X, Blohm G, Wang H, Crawford JD. Intrinsic reference frames of superior colliculus visuomotor receptive fields during head-unrestrained gaze shifts. J Neurosci 31: 18313–18326, 2011. doi: 10.1523/JNEUROSCI.0990-11.2011. [DOI] [PMC free article] [PubMed] [Google Scholar]
- 35.Duhamel JR, Colby CL, Goldberg ME. The updating of the representation of visual space in parietal cortex by intended eye movements. Science 255: 90–92, 1992. doi: 10.1126/science.1553535. [DOI] [PubMed] [Google Scholar]
- 36.Heiser LM, Colby CL. Spatial updating in area LIP is independent of saccade direction. J Neurophysiol 95: 2751–2767, 2006. doi: 10.1152/jn.00054.2005. [DOI] [PubMed] [Google Scholar]
- 37.Heiser LM, Berman RA, Saunders RC, Colby CL. Dynamic circuitry for updating spatial representations. II. Physiological evidence for interhemispheric transfer in area LIP of the split-brain macaque. J Neurophysiol 94: 3249–3258, 2005. doi: 10.1152/jn.00029.2005. [DOI] [PubMed] [Google Scholar]
- 38.Jay MF, Sparks DL. Sensorimotor integration in the primate superior colliculus. I. Motor convergence. J Neurophysiol 57: 22–34, 1987. doi: 10.1152/jn.1987.57.1.22. [DOI] [PubMed] [Google Scholar]
- 39.Jay MF, Sparks DL. Auditory receptive fields in primate superior colliculus shift with changes in eye position. Nature 309: 345–347, 1984. doi: 10.1038/309345a0. [DOI] [PubMed] [Google Scholar]
- 40.Keith GP, DeSouza JF, Yan X, Wang H, Crawford JD. A method for mapping response fields and determining intrinsic reference frames of single-unit activity: applied to 3D head-unrestrained gaze shifts. J Neurosci Methods 180: 171–184, 2009. doi: 10.1016/j.jneumeth.2009.03.004. [DOI] [PubMed] [Google Scholar]
- 41.Klier EM, Wang H, Crawford JD. The superior colliculus encodes gaze commands in retinal coordinates. Nat Neurosci 4: 627–632, 2001. doi: 10.1038/88450. [DOI] [PubMed] [Google Scholar]
- 42.Sadeh M, Sajad A, Wang H, Yan X, Crawford JD. Spatial transformations between superior colliculus visual and motor response fields during head-unrestrained gaze shifts. Eur J Neurosci 42: 2934–2951, 2015. doi: 10.1111/ejn.13093. [DOI] [PubMed] [Google Scholar]
- 43.Sajad A, Sadeh M, Keith GP, Yan X, Wang H, Crawford JD. Visual-motor transformations within frontal eye fields during head-unrestrained gaze shifts in the monkey. Cereb Cortex 25: 3932–3952, 2015. doi: 10.1093/cercor/bhu279. [DOI] [PMC free article] [PubMed] [Google Scholar]
- 44.Sommer MA, Wurtz RH. Influence of the thalamus on spatial visual processing in frontal cortex. Nature 444: 374–377, 2006. doi: 10.1038/nature05279. [DOI] [PubMed] [Google Scholar]
- 45.Zipser D, Andersen RA. A back-propagation programmed network that simulates response properties of a subset of posterior parietal neurons. Nature 331: 679–684, 1988. doi: 10.1038/331679a0. [DOI] [PubMed] [Google Scholar]
- 46.Zirnsak M, Moore T. Saccades and shifting receptive fields: anticipating consequences or selecting targets? Trends Cogn Sci 18: 621–628, 2014. doi: 10.1016/j.tics.2014.10.002. [DOI] [PMC free article] [PubMed] [Google Scholar]
- 47.Avillac M, Deneve S, Olivier E, Pouget A, Duhamel JR. Reference frames for representing visual and tactile locations in parietal cortex. Nat Neurosci 8: 941–949, 2005. doi: 10.1038/nn1480. [DOI] [PubMed] [Google Scholar]
- 48.Pouget A, Sejnowski TJ. Spatial transformations in the parietal cortex using basis functions. J Cogn Neurosci 9: 222–237, 1997. doi: 10.1162/jocn.1997.9.2.222. [DOI] [PubMed] [Google Scholar]
- 49.Smith MA, Crawford JD. Distributed population mechanism for the 3-D oculomotor reference frame transformation. J Neurophysiol 93: 1742–1761, 2005. doi: 10.1152/jn.00306.2004. [DOI] [PubMed] [Google Scholar]
- 50.Groh JM, Sparks DL. Two models for transforming auditory signals from head-centered to eye-centered coordinates. Biol Cybern 67: 291–302, 1992. doi: 10.1007/BF02414885. [DOI] [PubMed] [Google Scholar]
- 51.Droulez J, Berthoz A. A neural network model of sensoritopic maps with predictive short-term memory properties. Proc Natl Acad Sci USA 88: 9653–9657, 1991. doi: 10.1073/pnas.88.21.9653. [DOI] [PMC free article] [PubMed] [Google Scholar]
- 52.Bernier PM, Grafton ST. Human posterior parietal cortex flexibly determines reference frames for reaching based on sensory context. Neuron 68: 776–788, 2010. doi: 10.1016/j.neuron.2010.11.002. [DOI] [PubMed] [Google Scholar]
- 53.Crespi S, Biagi L, d'Avossa G, Burr DC, Tosetti M, Morrone MC. Spatiotopic coding of BOLD signal in human visual cortex depends on spatial attention. PLoS One 6: e21661, 2011. doi: 10.1371/journal.pone.0021661. [DOI] [PMC free article] [PubMed] [Google Scholar]
- 54.Stanford TR, Freedman EG, Sparks DL. Site and parameters of microstimulation: evidence for independent effects on the properties of saccades evoked from the primate superior colliculus. J Neurophysiol 76: 3360–3381, 1996. doi: 10.1152/jn.1996.76.5.3360. [DOI] [PubMed] [Google Scholar]
- 55.van Opstal AJ, Goossens HH. Linear ensemble-coding in midbrain superior colliculus specifies the saccade kinematics. Biol Cybern 98: 561–577, 2008. doi: 10.1007/s00422-008-0219-z. [DOI] [PMC free article] [PubMed] [Google Scholar]
- 56.Porter KK, Metzger RR, Groh JM. Representation of eye position in primate inferior colliculus. J Neurophysiol 95: 1826–1842, 2006. doi: 10.1152/jn.00857.2005. [DOI] [PubMed] [Google Scholar]
- 57.Caruso VC, Mohl JT, Glynn C, Lee J, Willett SM, Zaman A, Ebihara AF, Estrada R, Freiwald WA, Tokdar ST, Groh JM. Single neurons may encode simultaneous stimuli by switching between activity patterns. Nat Commun 9: 2715, 2018. doi: 10.1038/s41467-018-05121-8. [DOI] [PMC free article] [PubMed] [Google Scholar]
- 58.Buchholz VN, Jensen O, Medendorp WP. Multiple reference frames in cortical oscillatory activity during tactile remapping for saccades. J Neurosci 31: 16864–16871, 2011. doi: 10.1523/JNEUROSCI.3404-11.2011. [DOI] [PMC free article] [PubMed] [Google Scholar]
- 59.Buchholz VN, Jensen O, Medendorp WP. Parietal oscillations code nonvisual reach targets relative to gaze and body. J Neurosci 33: 3492–3499, 2013. doi: 10.1523/JNEUROSCI.3208-12.2013. [DOI] [PMC free article] [PubMed] [Google Scholar]
- 60.Buchholz VN, Jensen O, Medendorp WP. Different roles of alpha and beta band oscillations in anticipatory sensorimotor gating. Front Hum Neurosci 8: 446, 2014. doi: 10.3389/fnhum.2014.00446. [DOI] [PMC free article] [PubMed] [Google Scholar]
- 61.Haegens S, Nacher V, Luna R, Romo R, Jensen O. α-Oscillations in the monkey sensorimotor network influence discrimination performance by rhythmical inhibition of neuronal spiking. Proc Natl Acad Sci USA 108: 19377–19382, 2011. doi: 10.1073/pnas.1117190108. [DOI] [PMC free article] [PubMed] [Google Scholar]
Associated Data
This section collects any data citations, data availability statements, or supplementary materials included in this article.
Data Availability Statement
The data and computer code that support the findings of this study are available from the corresponding authors upon reasonable request.


