

Abstract
Balancing selection is frequently invoked as a mechanism that maintains variation within and across populations. However, there are few examples of balancing selection operating on loci underpinning complex traits, which frequently display high levels of variation. We investigated mechanisms that may maintain variation in a focal polymorphism—leaf chemical profiles of a perennial wildflower (Boechera stricta, Brassicaceae)—explicitly interrogating multiple ecological and genetic processes including spatial variation in selection, antagonistic pleiotropy, and frequency-dependent selection. A suite of common garden and greenhouse experiments showed that the alleles underlying variation in chemical profile have contrasting fitness effects across environments, implicating two ecological drivers of selection on chemical profile: herbivory and drought. Phenotype-environment associations and molecular genetic analyses revealed additional evidence of past selection by these drivers. Together, these data are consistent with balancing selection on chemical profile, likely caused by pleiotropic effects of secondary chemical biosynthesis genes on herbivore defense and drought response.
Editor’s Summary:
Evidence for balancing selection acting on loci that control complex traits is limited. Here, the authors show evidence for past selection on chemical profile in a perennial wildflower by two ecological drivers, herbivory and drought, consistent with balancing selection on this trait.
How genetic variation is maintained despite persistent natural selection is a central question in evolutionary biology. Theory demonstrates that both directional and stabilizing selection should reduce genetic variation within populations over time [1]. Since methods for quantifying phenotypic selection were standardized [2], hundreds of studies and thousands of measurements of selection have revealed that directional selection is common in nature [3]. Nevertheless, high levels of additive genetic variance are frequently documented within and among natural populations [4–5]. In addition to posing a fundamental puzzle, the persistence of widespread genetic diversity despite selection directly influences future adaptation: response to selection depends on the amount of genetic variation that exists for adaptive traits [1, 4]. Understanding whether and how populations can adapt to changing selective pressures is of critical importance [6–8], especially as environmental change accelerates in the Anthropocene [9].
Some models for persistent genetic diversity (e.g. [10]) suggest that a balance between new mutations and purifying selection may explain much of complex trait variation. However, recent experiments provide limited support for mutation-selection balance as a general explanation for standing genetic variation [11–12]. An alternative explanation in these cases is balancing selection, in which natural selection actively maintains genetic diversity within or among populations [13–14]. This process can maintain trait variation with simple genetic bases, including flower color [15] and self-incompatibility [16] in plants, and some immune traits in humans [17]. However, evidence that balancing selection maintains complex trait variation in nature is limited (but see [18]). Further, balancing selection can be generated by a variety of mechanisms, including negative frequency-dependent selection, overdominance, selection that is temporally variable within populations or spatially variable among populations, and antagonistic pleiotropy [19]. The relative importance of these mechanisms remains understudied, and ecological interactions generating them are often unclear [20]. Predicting evolutionary outcomes in heterogeneous environments requires a mechanistic understanding of how ecological interactions influence fitness [21] and genetic diversity.
Here, we explicitly test multiple ecological and genetic mechanisms that may contribute to balancing selection on a locus influencing complex trait variation. We focus on anti-herbivore defense, a complex plant trait comprising many constituent phenotypes – e.g. leaf toughness and hairiness [22], life-history, size and architecture [23], primary and secondary metabolites [24–25] – all of which may have their own complex genetic architectures. In Boechera stricta (Brassicaceae), a wild relative of Arabidopsis, glucosinolate (GS) secondary metabolites contribute to insect resistance and fitness; furthermore, the proportion of aliphatic GS derived from branched-chain amino acid (Val, Ile) precursors, called “BC-ratio”, is an important axis of GS variation controlled by a known biosynthetic locus [26]. Thus, BC-ratio in B. stricta is an intermediary physiological trait linking complex trait variation to a tractable genetic basis. Past work documented the molecular evolution that allowed for diversification of BC-ratio in B. stricta [26], but fine-scale patterns of chemical variation, as well as the specific mechanisms contributing to selection on this trait, remained unknown. Here, we report field experiments, greenhouse experiments, and molecular genetic analyses that test for balancing selection on this biochemical polymorphism, interrogating multiple ecological and genetic mechanisms that may drive it, including spatial and temporal variation in selection, antagonistic pleiotropy, and frequency-dependent selection.
Results
Glucosinolate variation is widespread in nature
To assess variation in BC-ratio across the species range, we used high performance liquid chromatography (HPLC) to characterize the GS profiles of accessions collected from 337 wild B. stricta populations grown in a common greenhouse environment. These new data provide the most detailed picture of GS variation in B. stricta to date. While past research has shown that BC-ratio varies spatially [26], this fine-scaled geographic survey shows that BC-ratio is highly polymorphic across the species range, often at small geographic scales (Figure 1). Because of this, we investigated a variety of evolutionary processes [13, 27–29] which may contribute to balancing selection on this trait.
Figure 1. Glucosinolate variation in B. stricta is highly polymorphic and widespread.

The proportion of aliphatic glucosinolates derived from branched-chain vs. unbranched amino acids (“BC-ratio”) is a quantitative trait that is bimodally distributed (inset) and intermixed geographically across the species range, as shown by this survey of 337 accessions derived from natural populations. Boxes: Close range view of northern (Idaho: ID) and southern (Colorado: CO) focal regions, showing the locations of the common gardens (filled yellow squares), temporary arrays (green triangles), and parental genotypes used for crosses and genome assembly (red and blue diamonds) in this study.
BCMA1/3 alleles confer contrasting fitness effects across environments
The tandemly-duplicated BCMA1/3 genes control BC-ratio in B. stricta by modulating the first step in the core aliphatic GS biosynthesis pathway [26]. To determine which processes may influence balancing selection on BC-ratio, we generated near-isogenic lines (NILs) derived from a largely homozygous F4 individual that was heterozygous for a narrow genomic region containing BCMA1/3 [26, 30]. We screened nearby PCR markers on F5 progeny, and two homozygous F6 closest-flanking recombinants (CFRs) were crossed together, yielding F1 and F2 CFR-NILs. Multiple independent F3 families provide replicated, homozygous, CFR-NILs differing at ten loci adjacent to BCMA1/3 (Methods). We used these CFR-NILs to test the effects of contrasting homozygous BCMA1/3 haplotypes conferring methionine-derived GS or branched chain amino acid-derived GS (homozygous “MM” and “BB” genotypes, respectively) on components of fitness in the field and laboratory.
Across 15 common garden field environments spanning 780 km, 11 sites (Figure 1, inset), and four years, there was significant variation in the effects of BCMA1/3 alleles on insect resistance (Supplementary Table 1). Contrasting alleles showed changes in rank resistance across environments, with MM and BB genotypes each conferring greater protection in some environments, and also differentially influenced resistance to a model herbivore (Trichoplusia ni [Lepidoptera: Noctuidae]) in the laboratory (Figure 2A). In B. stricta, herbivore damage decreases fitness by reducing reproductive output (Figure 2B; Supplementary Table 2); thus, glucosinolate traits that influence insect resistance are subject to variable selection by insect herbivores across environments.
Figure 2. Environmental variation in the effects of GS on fitness components.

a: Across 16 environments, contrasting BCMA1/3 alleles conferred variable effects on insect resistance (Supplementary Table 1; BCMA1/3×Environment: F5,5150=2.3623, P=0.0376; F8,2840.39=4.1884, P<0.0001; F1,6.8801=35.772, P=0.0006 in arrays, transplants, and laboratory, respectively). b: Herbivore damage reduces fitness by decreasing fruit size among plants that reproduce (Supplementary Table 2; Damage: F=5.5318, P=0.01867). c: In field environments (presented in order of herbivore damage, as in a), contrasting BCMA1/3 alleles also show variable effects on survival (Supplementary Table 3; BCMA1/3×Environment: χ2=27.839, P=0.0010 and χ2=61.769, P=0.0010 in arrays and transplants, respectively). d: Photo of a field transplant showing substantial herbivore damage to leaf tissue and flowering stalk. In a and c, different experiments are separated in boxes; L-R: temporary field arrays, permanent field transplants, and controlled laboratory conditions following a challenge with model herbivore Trichoplusia ni (Lepidoptera: Noctuidae). Within environments, circles show least-squares means of each fitness component after accounting for other model effects (Supplementary Tables 1–3), and error bars show ±1 standard error. Asterisks indicate pairwise significant differences among BCMA1/3 genotypes within each environment as follows: · = P < 0.10; * = P < 0.05; ** = P < 0.01; *** = P <0.0001. In b, black curve represents best-fit line from linear regression, and gray shaded areas represent the 95% confidence interval along the curve; herbivore damage was log-transformed in the linear model, and here the linear predictions are back-transformed to the raw data scale.
BCMA1/3 alleles also influenced survival in the field (Supplementary Table 3), with MM and BB genotypes changing in rank survival across environments (Figure 2C). However, herbivore resistance did not directly influence survival in these experiments (Supplementary Table 4). Thus, survival tradeoffs across environments implicate other ecological forces, along with herbivory, in shaping selection on BC-ratio.
Finally, by manipulating BCMA1/3 genotype frequencies in six field environments, we tested for frequency-dependent effects of BCMA1/3 alleles. Genotype frequency did not affect either insect resistance or survival (Extended Data Figure 1; Supplementary Tables 1 and 3). Thus, spatial variation in selection, rather than frequency-dependent selection, may maintain GS polymorphisms in this species.
Drought influences selection on BCMA1/3
Recent work in Arabidopsis has revealed that glucosinolates can modulate drought response by regulating stomatal aperture [31–32]. In a subset of our field experiments showing evidence of drought stress (Figure 3A), we tested whether drought also shapes selection on BC-ratio. Field arrays experiencing stronger viability selection via drought showed significant increases in the frequency of the MM genotype (Supplementary Table 5; Figure 3B). Thus, in addition to herbivory, drought influences selection on BC-ratio, and MM alleles appear to confer higher fitness under drought stress.
Figure 3. Drought influences selection on BCMA1/3.
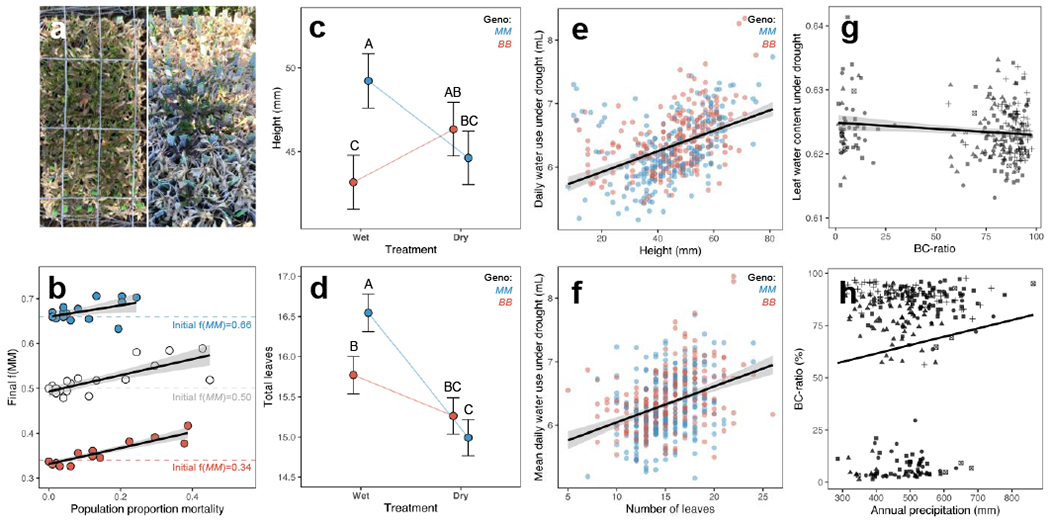
a: Drought stress in the field varies across sites (L: low; R: high). b: In Colorado field arrays, frequency of the MM genotype increased significantly in arrays that experienced stronger mortality following drought (effect of proportion mortality on f(MM): F=21.8870, P<0.0001; Supplementary Table 5). c-d: The MM CFR-NIL genotype suppresses growth (c: height, d: leaf number) under drought, relative to well-watered conditions (BCMA1/3×Environment: χ2=27.32, P<0.0001 and χ2=8.52, P=0.0035 for height and leaf number, respectively; Supplementary Table 6). The BB genotype does not. e-f: Phenotypes which MM genotypes suppress under drought (e: height; f: leaf number) are positively correlated with water use under drought (χ2=12.8290, P=0.0003, β=0.0074 and χ2=44.0913, P<0.0001, β=0.0480 for height and leaf number, respectively; Supplementary Table 7). g: Among 237 accessions, BC-ratio is genetically correlated with leaf water content under drought (F1,231=8.17, P=0.0046; Supplementary Table 8). h: Precipitation in 283 home environments is positively correlated with BC-ratio (F=12.68, P=0.0008, β=0.074; Supplementary Table 11); i.e., Met-GS are more common in drier habitats. In b and e-h, solid lines and gray shaded areas indicate linear predictions and 95% confidence intervals, respectively; in h, linear prediction reflects coefficient estimates modeled using genetic groups to control for population structure. In b, points represent summary statistics from arrays with genotype frequency shown by the color of points (blue: High = 66% MM; white: Mid = 50% MM; red: Low = 34% MM). Horizontal dashed lines show the starting genotype frequency in each treatment. In c-d, points represent least-squares mean estimates of traits in wet and dry greenhouse environments following a 2-week progressive dry-down; error bars show ±1 standard error. Upper case letters denote pairwise significant differences among means (Tukey’s HSD); means not connected by the same letter are significantly different (P<0.05). e-f show the least-squares mean daily water use under drought for each individual plant during dry-down, plotted against individual size (e: height, f: leaf number). Points are color-coded by BCMA3 genotype (blue: MM; red: BB). g-h: shapes denote broad genetic groups (COL: circles; NOR: triangles; UTA: squares; WES: crosses; Admixed: x-boxes).
In a controlled dry-down greenhouse experiment, we found that variation in drought response among CFR-NIL genotypes is underpinned by differing morphological responses to drought. Specifically, the MM genotype decreases its size under drought, compared to controls, while BB does not (Figure 3C–D; Extended Data Figure 2; Supplementary Table 6). Because size drives water use (Figure 3E–F; Supplementary Table 7), this suggests that MM alleles reduce water use in response to drought, which may yield higher fitness under drought stress in the field.
To determine whether GS also influence drought response in a broad range of genetic backgrounds, we performed a second greenhouse dry-down experiment with a panel of 350 accessions from across the species range (Figure 1). BC-ratio was genetically correlated with leaf water content under drought (Supplementary Table 8): low BC-ratio accessions maintained higher leaf water content under drought (Figure 3G).
Finally, in this diverse panel of accessions, precipitation-related climate variables in home environments predict the distribution of BC-ratio phenotypes across the landscape (Supplementary Tables 9–11; Extended Data Figures 3–4). The best climatic predictor of BC-ratio was annual precipitation (Supplementary Table 11); natural accessions producing low BC-ratio GS phenotypes were found in drier environments (Figure 3H). After controlling for population structure, this genotype-environment association is evidence for large-scale geographically heterogeneous selection on BC-ratio by climate [33].
Our findings build upon recent evidence for the involvement of GS in drought response [31–32], suggesting that BCMA1/3 alleles altering BC-ratio confer contrasting morphological responses to drought stress. Thus, environmental variation in drought stress as well as herbivory may favor diverse GS profiles across the landscape.
LD decays rapidly around BCMA3
Tightly linked loci near BCMA1/3 might covary with BCMA1/3 alleles, possibly contributing to observed phenotypic patterns. Using a de novo long-read assembly around BCMA1/3 (Methods), we scanned patterns of FST along chromosome 7 to identify flanking regions in which the MM and BB CFR-NIL haplotypes have divergent SNPs. This revealed the BCMA1/3 haplotype to be 212 kb in length, spanning position 11,737 to 11,949 kb on chromosome 7, extending 42 kb in the 5’ direction and 167 kb in the 3’ direction of BCMA3 (Figure 4A). A total of 41 SNPs fall within this haplotype.
Figure 4. The BCMA1/3 CFR-NIL interval contains ten flanking loci, but they show little correlation (LD) in natural populations.

a: Comparisons of GBS data between BB and MM CFR-NIL genotypes show an FST peak around the BCMA3 gene (red line), revealing a ~212 kb non-recombinant interval (delimited by blue lines) among the CFR-NILs. b: Eleven B. stricta genes occur in the non-recombinant CFR-NIL haplotype, including BCMA3. Shaded rows indicate that homologs in A. thaliana (At) have variable expression in response to drought. Shaded rows with bold text indicate that At homologs have impacts on drought response which have been validated with functional genetic studies. Shaded row with bold red text indicates that At homologs have functionally verified effects on both insect resistance and drought response. c: Heatmaps showing pairwise linkage disequilibrium (r2) in a 712 kb interval surrounding BCMA3, for three groups of accessions: (L-R) 157 COL accessions, 126 UTA accessions, and 233 pooled COL+UTA accessions. Blue numbers on diagonals indicate the position on chromosome 7, in bp, of the BCMA3 gene and the closest SNP to the limits of the surrounding non-recombinant region in the CFR-NILs. In b, all B. stricta gene positions reflect the version_2 SAD12 reference genome, and fall on chromosome 7.
The version_2 SAD12 reference genome shows a total of eleven genes, including BCMA1/3, in this CFR-NIL interval. Prior studies have shown that, besides BCMA1/3, several of these genes may contribute to drought response or change expression in response to drought (Figure 4B). Thus, other loci within the nonrecombinant interval could influence the phenotypes observed in our common garden experiments. To determine whether flanking genes covary with BCMA3 in nature, we used sequence data from a range-wide panel of natural accessions [34] to characterize LD around BCMA3. In geographic areas with high genetic diversity (COL and UTA [34]), LD surrounding BCMA3 is low (Figure 4C). Thus, while nearby regions cosegregate with BCMA3 in the CFR-NILs, low LD between BCMA3 and surrounding regions suggests that linked loci are unlikely to explain genetic correlations between BC-ratio and drought response (Figure 3G) or phenotype-environment associations between BC-ratio and drought in home environments (Figure 3H).
Molecular signatures are consistent with balancing selection on BCMA
Prior research identified functional amino acid (AA) substitutions in the BCMA3 enzyme that influence BC-ratio [26]. To characterize genetic variants underlying BC-ratio phenotypes, we performed Sanger sequencing on BCMA3 in a panel of 110 accessions. In addition to the previously described AA substitutions altering enzyme activity [26], at least two structural variants are present in BCMA3 (Supplementary Table 12). An 8bp deletion causes a frameshift mutation upstream of both AA substitutions of interest, disrupting the BCMA3 enzyme after 137 AA. Additionally, several accessions showed premature stop codons later in the AA sequence caused by nonsense mutations. All premature stop codons are associated with low BC-ratio (Figure 5A; Supplementary Table 12), presumably because they disrupt function of the BCMA3 enzyme. These derived mutations are geographically widespread; among the accessions we assayed, we found stop codon only and stop codon + deletion variants spanning 328 km and 729 km of the species range, respectively (Figure 5B). Given low seed dispersal [35] and outcrossing [36] in Boechera, widespread variants in natural habitats suggest that the functional genetic bases of variation in GS phenotypes have been maintained over long periods of time, and are not ephemeral novel mutants.
Figure 5. Molecular evidence of balancing selection on BCMA3.

a: Sanger sequencing of BCMA3 alleles reveals structural genetic variation influencing BC-ratio; the presence of a premature stop codon disrupting BCMA3 expression significantly predicts some low BC-ratio phenotypes (F=6.8141, P=0.0110; Supplementary Table 12), in addition to critical amino acid residues in positions 148 and 268 of BCMA3 [26]. Data points represent the genetic mean BC-ratio for each accession, and shapes denote genetic group [37]. Boxplots delineate 25th, 50th, and 75th percentiles with boxes and 1.5x the interquartile range with whiskers. Colors show BCMA3 enzyme molecular phenotype, with L148/V268 (blue) matching the SAD12 parental genotype, and V148/M268 (red) matching the LTM parental genotype. Purple accessions have critical amino acid residues at 148/268 that are intermediate to the CFR-NIL parental genotypes. b: Genetic variants underlying BC-ratio are geographically widespread across the species range. c: BCMA3 has high nucleotide diversity (π BCMA3 = 0.00591) relative to comparable genes in the B. stricta genome (); π BCMA3 (red arrow) exceeds the 5% tail (dashed line) of 1,689 comparable genes in the B. stricta genome (P=0.0290).
Finally, a molecular hallmark of balancing selection is elevated nucleotide variation within genes under selection [13]. We characterized nucleotide diversity (π) within BCMA3 and genes of similar size across a panel of 54 accessions. Consistent with predictions for balancing selection, we found that BCMA3 is more polymorphic than 97.1% of 1,689 comparable loci across the genome (Figure 5C).
Effect size of BCMA1/3
Since we aim to understand selection on genes that influence complex trait variation, we estimated the average effect of the BCMA1/3 polymorphism on herbivore damage in nature. The mean effect size of BCMA1/3 on herbivore damage was 0.172 standard deviations, indicating that it is a small effect QTL [37] influencing herbivore damage and fitness in nature.
Discussion
The degree to which different evolutionary processes may explain the maintenance of polymorphism has been the subject of debate for decades [38–39]. Our experiments document spatial variation in selection driving evolution of the BCMA1/3 polymorphism in B. stricta. Specifically, functional links between genetic variation in BCMA1/3, chemical (GS) and physiological (drought tolerance) functional traits, and fitness in nature reveal tradeoffs of BCMA1/3 alleles across environments. Changes in the sign of allelic effects on fitness across environments are hallmarks of balancing selection [13, 40–41]. Our data thus show that balancing selection has maintained complex trait variation in GS profiles across the landscape. This conclusion is corroborated by molecular analyses, which reveal that nucleotide diversity within BCMA3 is elevated compared to other genes in this species, and that glucosinolate phenotypes in common garden are genetically correlated with drought conditions in home environments. Finally, while the BCMA1/3 polymorphism evolved after B. stricta diverged from its close congener (Extended Data Figure 5), genetic variants underlying GS profiles are geographically widespread, suggesting that selection has maintained multiple variants over time.
While we see clear evidence of functional trait and fitness tradeoffs conferred by BCMA1/3 alleles across environments, alleles also had synergistic effects on fitness components in some environments; conducting our experiments in a subset of sites or years could have led to the erroneous conclusion that only one allele was favored by selection. For example, in the GTH-2016 and 401-2016 environments, the MM allele confers both higher survival and reduced herbivore damage (Figure 2A,C). Conditional neutrality was also common; in 7 of 15 tested field environments, contrasting BCMA1/3 alleles conferred no detectable differences in either insect resistance or survival. Furthermore, in many environments in which fitness tradeoffs were detectable, the magnitude of allelic effects was small. These findings suggest that experiments must deploy large sample sizes in many environments to detect changes in allelic effects when they do occur [42–43], and that the relative lack of empirical evidence for balancing selection may be influenced by limited statistical power. Beyond this practical concern, these findings reveal biologically relevant environmental variation in the expression of tradeoffs, emphasizing the critical importance of environmental context in understanding complex patterns of natural selection.
Our results are consistent with examples of QTL expressing contrasting effects on fitness under variable laboratory and field conditions [44–45], as well as pleiotropic effects of SNPs across environments contributing to polygenic trait variation [18]. Our work builds upon these studies by offering explanations of functional consequences for allelic variation across environments on complex phenotypes that underlie fitness. Such mechanistic understanding has been achieved previously in now-classic studies focusing on traits with simple genetic architecture, including flower color [15] and self-incompatibility [16] in plants, as well as HLA loci in humans [17]. While we have emphasized the effects of a gene of interest, the ecological and genetic signatures of selection on BCMA1/3 show that tractable genes with large physiological effects may have small effects on ecologically important traits, thus influencing genetic variation of complex traits in nature. Similarly, approaches emphasizing tractable intermediary phenotypes have helped identify genetic bases of human metabolic variation (e.g. [46])
In addition to revealing the genetic basis of cross-environment fitness tradeoffs that drive balancing selection on BCMA1/3, we identify two key drivers of selection on glucosinolate evolution in B. stricta: herbivore pressure and drought stress. The magnitude of selection exerted by each of these likely varies and/or covaries across the landscape. For example, drought stress may alter herbivore pressure directly by changing arthropod abundance or activity, or indirectly by influencing plant growth and secondary metabolites. This could yield complex, non-additive fitness landscapes influencing trait variation across environments. We encourage further research into the implications of ecological interactions among selective drivers on the maintenance of polymorphism.
Finally, our results build on evidence that GS are multi-functional biomolecules that, in conjunction with hormones such as auxin and IAA, help to coordinate organismal responses to both biotic and abiotic stressors [31, 47–49]. While classically known for mediating biotic interactions with herbivores and microbes [50], recent functional genetics studies in Arabidopsis have shown that mutant lines with knockouts of BCMA1/3 orthologs have reduced drought tolerance [31] due to the effects of GS degradation products on stomatal aperture [32]. This study suggests that allelic variation in GS molecular structure, in addition to presence/absence or up/down-regulation of GS, may elicit differential responses to drought as well as herbivores. Ultimately, traits that mediate biotic and abiotic interactions, such as GS, are likely to experience complex patterns of natural selection that may decrease the likelihood of a single variant rising to fixation. Thus, these results highlight how multiple ecological drivers of selection can influence balancing selection on complex traits.
Methods
Characterizing GS variation across the landscape
We characterized the chemical profiles of 337 natural accessions collected from across the species range [34]. Progeny of wild-collected seeds were self-pollinated under controlled greenhouse conditions to minimize maternal effects. We then measured GS profiles using high-performance liquid chromatography (HPLC) following [51] and estimated the least-squares mean value of BC-ratio per accession by fitting a restricted maximum likelihood (REML) model with accession ID and greenhouse block as random effects (Supplementary Methods - HPLC).
Generation of CFR-NILs
We chose wild-collected accessions with high and low BC-ratio phenotypes (“LTM” and “SAD12” from MT and CO, respectively; Figure 1) to generate the experimental genotypes used here via a crossing pedigree described in Extended Data Figure 7. Previously [26] we identified a near-isogenic F4 derived from the SAD12 x LTM cross, screened 5,213 F5s for recombination near BCMA1/3, and then scored 13 tightly linked PCR markers on 205 homozygous F6 recombinants. Here, we identified two F6 homozygous closest flanking recombinants (CFRs), which were crossed together, generating a heterozygous double-recombinant F1. In the F2 we self-pollinated multiple MM and BB homozygotes, yielding F3 families representing replicated homozygous MM and BB CFR-NILs (below, “families”). Using genotyping by sequencing (GBS) (Supplementary Methods - Genotyping-by-sequencing), we determined the extent of the non-recombinant BCMA1/3 haplotype (below).
Laboratory herbivory experiment
We grew 225 juvenile CFR-NILs in a randomized complete block design under controlled greenhouse conditions (18-21° C day / 13-16° C night; 16 h day length; watering to saturation daily; fertilization at 300 ppm N weekly) for 6 weeks before challenging them with a model herbivore. Five blocks each contained 45 individuals, with five replicates per independent CFR-NIL family (4 BB families and 5 MM families). We confined trays containing full statistical blocks in plexiglass chambers with mesh panels for ventilation. There, we applied a single second-instar cabbage looper larva (Trichoplusia ni, Lepidoptera: Noctuidae) to each plant. Larvae roamed within the chambers, feeding freely within a block for five days. We then scored each plant for insect damage as in [52].
We used a REML mixed-effects model to test for the effect of genotype on resistance to T. ni; we fit herbivore damage in response to the fixed effect of BCMA1/3 genotype, the random effect of block, and the random effect of family nested within genotype. We tested the significance of the fixed effect using both Satterthwaite’s method and Kenward-Roger’s method, which yielded similar results (Supplementary Table 1), and tested the significance of random effects using likelihood ratio tests.
Field experiments: common gardens
We transplanted 6,860 CFR-NILs into three experimental gardens in central Idaho and two experimental gardens in southwest Colorado, near the source populations for the parental accessions (Figure 1). We transplanted cohorts containing 360-1,350 individuals between 2013 and 2015, using a randomized complete block design. Transplants were spaced at constant density and planted directly into surrounding vegetation. Each cohort contained replicates using at least 8 CFR-NIL families to control for possible effects of unlinked loci outside of the BCMA1/3 region. We measured herbivore damage, survival, and reproduction on these individuals to estimate effects of BCMA1/3 alleles on fitness-related traits in different environments, and to test the effects of herbivore damage on reproductive fitness.
To asses variation in insect resistance across environments (N = 3,674), we used REML mixed-effects models to test for BCMA1/3 × environment effects on herbivore damage; we modeled herbivory in response to fixed effects of BCMA1/3, environment, and the BCMA1/3 × environment interaction, and random effects of statistical block and CFR-NIL line nested within BCMA1/3 genotype. We tested the significance of fixed effects using both Satterthwaite’s method and Kenward-Roger’s method, which yielded similar results (Supplementary Table 1). We tested the significance of random effects using likelihood ratio tests.
To assess variation in survival across environments (N = 6,860), we used a generalized linear mixed effects model (binomial distribution; logit link) to fit survival in response to the same fixed and random effects used in the herbivory model. We tested the significance of fixed effects using both Wald tests and parametric bootstrapping, which yielded qualitatively similar results (Supplementary Table 3), and tested the significance of random effects using likelihood ratio tests. In both models, if we detected a significant genotype × environment interaction, we used pairwise contrasts to compare allelic effects within each environment.
We tested for natural selection by herbivory across all transplant environments (N = 3,094) using a generalized linear mixed-effects regression with a binomial distribution and a logit link function; we fit reproductive success (0/1) in response to fixed effects of herbivore damage, environment, and the damage × environment interaction, and a random effect of block. A significant negative effect of herbivory on reproduction indicates that selection favors increased herbivore resistance (Supplementary Table 2). Further, in one environment with high sample sizes (SCH-2016; N = 848), we used a linear mixed-effects model to fit log-transformed total reproductive output of reproductive plants (number of fruits × average fruit length) in response to the fixed effect of herbivore damage and the random effect of block (Supplementary Table 2). Finally, in the same environment (SCH-2016; N = 1,219), we tested for effects of herbivore damage on survival; we used a generalized linear mixed-effects model with a binomial distribution and logit link to fit survival in 2017 in response to the fixed effect herbivore damage in 2016 and the random effect of block (Supplementary Table 4). In all models testing for natural selection by herbivory, we tested the significance of fixed effects using Wald tests with Type III sums of squares, and of random effects using likelihood ratio tests.
Full details about experimental conditions and statistical analyses are provided in Supplementary Methods - Common garden experiments.
Field experiments: temporary arrays
In 2016, we deployed 5,880 CFR-NILs into six environments in Colorado (Figure 1) to test for frequency-dependent effects of the BCMA1/3 haplotype. We grew juvenile plants in 98-cell “cone-tainer” racks and assigned racks to three treatments with different starting frequencies of the MM genotype: high (66% MM), medium (50% MM), and low (34% MM). Plants were randomized within each treatment rack, and we used 10 CFR-NIL families to account for possible effects of unlinked loci outside the BCMA1/3 region. We arranged 10 racks (3 high, 4 mid, and 3 low MM frequency (f(MM))) in a random configuration in each of the six array sites in CO, and sunk each rack flush with the soil and native vegetation. We watered arrays twice per week for the first two weeks of the growing season, and then every other day. After 8 weeks in field conditions, we censused for survival and herbivore damage as described above. We used these data to test for variation across environments in the effects of BCMA1/3 on herbivore defense and survival, as well as effects of genotype frequency on fitness components. Statistical models for herbivory (N = 5,193) and survival (N = 5,880) in temporary arrays were identical to those described above for permanent field transplants, but included additional fixed effects of BCMA1/3 allele frequency and a genotype × frequency interaction (Supplementary Tables 1, 3).
Finally, we tested for array-level response to selection. Using least squares ANCOVA, we regressed the array-level final f(MM) onto the proportion mortality of the arrays, fixed effects of environment and starting f(MM), and the proportion mortality × starting f(MM) interaction (Supplementary Table 5). Full details about the experimental design and statistical analyses are provided (Supplementary Methods - Field measurements).
Greenhouse dry-down experiments
We performed two controlled progressive dry-down experiments in the greenhouse to test for variation in drought response among CFR-NILs (2 genotypes × 5 families per genotype ×100 replicates = 1,000 individuals) and a broad panel of genotypes (350 genotypes × 6 replicates = 2,100 individuals). In both experiments, we withheld water incrementally to simulate drought during the growing season. Importantly, we controlled for individual variation in drought stress by weighing all pots daily during the drought treatments, and watering pots with the specific volumes of water required to maintain a uniform volumetric water content across replicates (Supplementary Methods - CFR-NIL dry-down). We compared the morphological and physiological responses of genotypes across drought and well-watered treatments to test the effects of BCMA1/3 alleles (CFR-NIL experiment) and of BC-ratio (broad accession panel) on drought response.
Specifically, in the CFR-NIL experiment, we used linear mixed-effects models to fit each phenotypic response variable (Supplementary Table 6) in response to fixed effects of genotype, drought treatment, and the genotype × drought interaction, the fixed covariate of initial height, and random effects of block and family line. We tested the significance of fixed effects using Wald tests with Type III sums of squares, and of random effects using likelihood ratio tests. If we detected a significant genotype × treatment effect, we assessed pairwise group differences using a Tukey HSD post-hoc test. Further, for individuals in the drought treatment, we tested whether genotype influences water use under drought using a suite of linear mixed-effects models; we fit least-squares mean daily water use (averaged over the duration of the drought treatment) in response to fixed effects of a single morphological variable, genotype, and the genotype × morphology interaction, and random effects of block and family line (Supplementary Table 7).
In the experiment using a broad panel of accessions, we tested for genetic covariance among drought response and GS profile by regressing least-squares mean leaf water content upon least-squares mean BC-ratio for each accession (see above) in a linear model. We used three different statistical approaches to control for population structure (Supplementary Methods - Phenotype-environment correlations), all of which yielded similar results (Supplementary Table 8).
Full details of both experimental designs, drought treatment standardization methods, and statistical analyses are provided in the Supplementary Methods.
Phenotype-environment correlations
To test for past selection on GS profile in B. stricta, we assessed phenotype-environment associations between BC-ratio and climatic variables from the locations of origin for a suite of accessions across the species range. First, we accounted for covariance among climate variables using principal components analysis. We then used a linear model to regress genetic mean BC-ratio for each accession upon latitude, longitude, and elevation of origin as well as the first 5 principal component axes for climate variation (Supplementary Table 9). We identified a targeted subset of climate variables based on loading onto the climate axis identified as a significant multivariate predictor of BC-ratio (Supplementary Table 10). Finally, we tested for correlations among each of these target climate variables and BC-ratio using linear models. Due to non-normal residuals, we validated P-values using permutation tests (Supplementary Methods - Phenotype-environment correlations; Supplementary Table 11; Extended Data Figure 4). In all of our phenotype-environment association models, we took three different statistical approaches to controlling for population structure (Supplementary Methods - Plant measurements and data analysis). These approaches all consistently identified climate Principal Component Axis 1 as the best multivariate predictor of BC-ratio (Supplementary Table 9), but sometimes differed qualitatively in identifying which raw climate variables loading onto PCA1 predicted BC-ratio (Supplementary Table 11). However, all modeling approaches consistently detected significant positive correlations between BC-ratio and the following climate variables (Supplementary Table 11): annual precipitation (Figure 3H), precipitation in the wettest month (Extended Data Figure 3B), and precipitation in the wettest quarter (Extended Data Figure 3B).
Dissecting the BCMA1/3 region
To characterize genetic variation in the segregating CFR-NIL region, we assembled version_2 reference genomes for the LTM (BC-GS) and SAD12 (Met-GS) parental accessions, providing high quality long-read coverage in the BCMA1/3 region (Extended Data Figure 6). We then aligned GBS reads (Supplementary Information) from 65 replicate CFR-NIL families to the SAD12 reference to identify SNPs segregating among CFR-NILs. We calculated FST [34] between MM and BB homozygotes in 20 kb non-overlapping windows along chromosome 7 and used high FST SNPs to identify the extent of the segregating BCMA1/3 locus in the CFR-NILs.
In addition, we aligned published Illumina sequence data [34] to the de novo version_2 SAD12 reference genome for 233 accessions from the COL and UTA genetic groups, which show high genetic diversity [34] and are polymorphic in BC-ratio. We estimated pairwise LD (r2) [53] between each pair of SNPs within a 712 kb interval around BCMA1/3 (spanning the 212 kb CFR region, plus 250 kb on each side; Supplementary Methods - Linkage disequilibrium near BCMA1/3).
Polymorphism in BCMA3
To explore the extent of genetic variation underlying the BC-ratio polymorphism, we Sanger-sequenced a subset of 110 accessions from the panel of 337 described above. After trimming and aligning sequences (Supplementary Methods - Polymorphism in BCMA3), we assigned accessions to three structural variant categories: complete exons vs. premature stop and 8bp deletion vs. premature stop and no deletion. We also predicted amino acid (AA) sequences of the BCMA3 enzyme for each accession by translating the gene sequence data using the ‘Biostrings’ package in R [54], and identified the AA variants at positions 148 and 268, which are hypothesized to cause differential GS biosynthesis between the SAD12 and LTM genotypes [26]. We used linear models to test how structural variants and AA variants influence phenotypic variation in BC-ratio (Supplementary Methods - Polymorphism in BCMA3).
Molecular population genetic signatures of selection
To determine whether BCMA3 showed molecular signatures of balancing selection, we compared the observed level of nucleotide diversity (π) in BCMA3 to the distribution of π in a subset of comparable genes in the B. stricta genome across 54 accessions from the COL and UTA genetic groups, all of which have complete BCMA3 exons (i.e., are not pseudogenes). Following [34], we calculated the observed π among silent sites in BCMA3 and other genes of similar length (1,689 genes), and compared the value for BCMA3 to the distribution of π across other genes (Supplementary Information).
Extended Data
Extended Data Fig. 1. Genotype frequency does not alter the effect of BCMA1/3 on herbivore resistance or survival.

In experimental arrays in which we manipulated the starting genotype frequency of the BCMA1/3 homozygotes, there was no effect of genotype frequency on herbivore damage or survival. In each panel, points represent least-squares means estimates of the response variable for each genotype in each BCMA1/3 frequency treatment, and error bars represent +/− one standard error.
Extended Data Fig. 2. Genetic variation in norms of reaction to drought stress.

BCMA1/3 alleles in the CFR-NIL background confer contrasting response to drought by altering morphological traits such as leaf size and number as well as physiological traits such as growth. Both genotypes reduce leaf water content under drought, but genetic differences in this response were only marginally significant. In each panel, points represent least-squares means estimates of the response variable for each genotype in each BCMA1/3 frequency treatment, and error bars represent +/− one standard error.
Extended Data Fig. 3. Drought-related climate variables are correlated with multivariate climatic predictors of BC-ratio.

A: BC-ratio varies across climate space, with PC1 the strongest predictor (Supplementary Table 9). B: Linear models and permutation tests reveal that low BC-ratio phenotypes are significantly correlated with drier environments of origin. Points in all panels represent phenotypic (LS mean BC-ratio) and environmental variation (WorldClim data from the location of origin) of a broad panel of accessions. Colors represent BC-ratio, ranging from 0% (blue) to 100% (red). Shapes denote genetic groups as described in Wang et al. (2019). COL: circles; NOR: triangles; UTA: squares; WES: crosses. Black lines represent lines of best fit estimated using linear models using discrete groups to control for population structure (“approach A”) as described in Supplementary Methods.
Extended Data Fig. 4. Permuted vs. observed F-statistics relating BC-ratio to climate variables.

Panes correspond to linear models presented in Supplementary Table 11. In each pane, gray bars show the frequency distribution of the test statistic relating each climate variable to BC-ratio from 10,000 permutations shuffling BC-ratio values without replacement (Supplementary Methods), red arrows show the observed F-statistic from each true model (Supplementary Table 11), and dashed lines mark the location of the extreme 95% tail in the empirical cumulative distribution function of permuted F-statistics, using three different methods to control for population structure (columns A-C; Supplementary Methods).
Extended Data Fig. 5. Functional and copy number variation in BCMA evolved recently within B. stricta.

Maximum likelihood phylogenetic reconstruction of BCMA copy sequences (excluding severely truncated copies) elucidates the evolutionary history of BCMA duplications in Boechera. Colored boxes behind (pseudo)gene names categorize features as follows: blue boxes contain nonfunctional BCMA pseudogenes on chromosome 7, light yellow boxes contain functional copies of BCMA2 on chromosome 2, and dark yellow boxes contain functional copies of BCMA3 and BCMA1 on chromosome 7. Shaded boxes indicate paralogs in B. retrofracta, and green box indicates the A. thaliana ortholog (CYP79F1). Scale bar shows genetic distance in nucleotide differences per base pair.
Extended Data Fig. 6. Long-read assemblies of the LTM and SAD12 parents reveal substantial variation in tandem repeats and BCMA copy number in a 200 kb region on chromosome 7.

Functional BCMA gene copies are indicated in yellow; red circles show severely truncated, non-functional BCMA copies; blue ellipses indicate close-to-full-length copies of BCMA containing frameshift deletions or transposon insertions. Blue and yellow elements match those shown in Extended Data Figures 5 and 9.
Extended Data Fig. 7. BCMA1/3 CFR-NILs: Chromosome 7 Pedigree.

Chromosomal pedigree showing how closest flanking recombinant near-isogenic lines (CFR-NILs) were generated for use in laboratory and field experiments. See Methods and Supplementary Information for details. Within each step, diploid homologous pairs of Chromosome 7 are shown.
Extended Data Fig. 8. Gene duplication and loss events yield variable BCMA copy number across genetic groups and accessions.

Colored lines indicate the distribution of estimated BCMA copy number for population groups as characterized in Wang et al. (2019), determined by read depth of genomic sequence data (Supplementary Methods). Arrows indicate the distribution of estimated copy number, for parental genotypes used to generate CFR-NILs: CO (SAD; gold) and MT (LTM; red).
Extended Data Fig. 9. Inferred evolutionary history of BCMA duplications in B. stricta.

a: Following the initial duplication event from chromosome 2 to chromosome 7, BCMA1/3 was copied several more times, with both BCMAa (BCMA3) and BCMAc (BCMA1) yielding progeny copies (labels following Extended Data Figure 5). b: Sequence alignment reveals insertions and deletions that convert most gene copies into non-functional pseudogenes, leaving high copy number in the LTM parent. c: Proposed mechanisms causing the secondary loss of BCMA1, as in the SAD12 (CO CFR-NIL parental) genotype. Due to the prevalence of repetitive elements in the BCMA region on chromosome 7, it is possible that recombination events among inverted repeats (visible in Extended Data Figure 6) excised BCMA1 from some genetic backgrounds, either within a chromosome (left) or during crossing-over among chromosomes (right). The latter scenario could also contribute to the proliferation of the BCMA pseudogenes and flanking elements present in some lineages (see Extended Data Figures 5 and 6).
Extended Data Fig. 10. Nucleotide diversity is negatively correlated with gene size.

Each point represents one gene in the B. stricta genome for which π data was calculable and greater than 0 among a subset of 54 genotypes (see Supplementary Methods). Levels of nucleotide diversity (π) are highest for genes with few silent sites. To account for this, we compared πBCMA to π of genes across the genome with a similar number of silent sites. BCMA3 contains 364 silent sites, so our threshold was 360 (indicated by red line).
Supplementary Material
Acknowledgments
We thank the Duke University greenhouse staff, Eli Hornstein, Sam Mahanes, Laurel Schumm, Robin Bingham, Nick Niezgoda, Corinne Ried, Anita Simha, Will de Vries, Elsa Cousins, and Kristina Stinson for assistance with fieldwork in Colorado; Evan Raskin, Chris Strock, Brandon Guyton, Wes Mitchell, Jake Lessing, Max Olszack, Ash Zemenick, Marshall McMunn, Kara Stiff, Sailee Clemens, Tim Park, Sara Shriber-Olds, and Rob Colautti for assistance with fieldwork in Idaho; and Jennie Reithel, Shannon Sprott, and Connie Heald for logistical support that facilitated fieldwork. We thank the Rocky Mountain Biological Laboratory, the Crested Butte Land Trust, the US Forest Service, Dick Finlayson, Randy Capps, Art Mears and Paula Lehr for permission to conduct field experiments. We thank Victoria Grant and Amy Zhao for assistance with laboratory experiments, Edwin Iversen at the Duke University Statistical Consulting Center for guidance regarding some analyses, and Kathleen Donohue, Mark Rausher, Bill Morris, and two reviewers for feedback which greatly improved this manuscript. We are grateful to the Computer and Information Networking Center, National Taiwan University for high-performance computing facilities and the Technology Commons, College of Life Science, National Taiwan University for molecular biology equipment. This work was supported by the Ministry of Science and Technology of Taiwan (108-2636-B-002-004 to CRL), the Guangdong Natural Science Funds for Distinguished Young Scholar (2018B030306040 to BW) the National Institutes of Health (R01 GM086496 to TMO), and the Rocky Mountain Biological Laboratory (Snyder Endowment graduate fellowship to LNC).
Footnotes
Competing interests statement
The authors declare no competing interests.
Code availability statement
Code used for this manuscript is archived in the Dryad digital repository (DOI:10.5061/dryad.7h44j0zsr) [63].
Data availability statement
New reference genome assemblies and raw Nanopore reads for SAD12 and LTM genotypes have been submitted to NCBI (BioProject number PRJNA609209). The short reads of the GBS data for CFR-NIL families have been submitted to NCBI (BioProject number PRJNA659863). Previously published genomic data are archived with [55]. All other data reported in this manuscript are archived in the Dryad digital data repository (DOI:10.5061/dryad.7h44j0zsr) [63]. All biological materials are available from the Arabidopsis Biological Resource Center (ABRC) or from the authors.
References
- 1.Falconer DS & Mackay TFC Introduction to Quantitative Genetics. Essex, England: Longman; (1996). [Google Scholar]
- 2.Lande R & Arnold SJ The measurement of selection on correlated characters. Evolution 37, 1210–1226 (1983). [DOI] [PubMed] [Google Scholar]
- 3.Kingsolver JG, Diamond SE, Siepielski AM & Carlson SM Synthetic analyses of phenotypic selection in natural populations: lessons, limitations and future directions. Evolutionary Ecology 26, 1101–1118 (2012). [Google Scholar]
- 4.Barrett RDH & Schluter D Adaptation from standing genetic variation. Trends in Ecology and Evolution 23, 38–44 (2008). [DOI] [PubMed] [Google Scholar]
- 5.Kulbaba MW, Sheth SN, Pain RE, Eckhart VM & Shaw RG Additive genetic variance for lifetime fitness and the capacity for adaptation in an annual plant. Evolution 73, 1746–1758 (2019). [DOI] [PubMed] [Google Scholar]
- 6.Lande R & Shannon S The role of genetic variation in adaptation and population persistence in a changing environment. Evolution 50, 434–437 (1996). [DOI] [PubMed] [Google Scholar]
- 7.Etterson JR & Shaw RG Constraint to adaptive evolution in response to global warming. Science 294, 151–154 (2001). [DOI] [PubMed] [Google Scholar]
- 8.Anderson JT, Inouye DW, McKinney AM, Colautti RI & Mitchell-Olds T Phenotypic plasticity and adaptive evolution contribute to advancing flowering phenology in response to climate change. Proceedings of the Royal Society B: Biological Sciences 279, 3843–3852 (2012). [DOI] [PMC free article] [PubMed] [Google Scholar]
- 9.Steffen W, Crutzen PJ & McNeil JR The Anthropocene: are humans now overwhelming the great forces of nature? Ambio 36, 614–621 (2007). [DOI] [PubMed] [Google Scholar]
- 10.Zhang X-S & Hill WG Genetic variability under mutation selection balance. Trends in Ecology and Evolution 20, 468–470 (2005). [DOI] [PubMed] [Google Scholar]
- 11.McGuigan K, Aguirre JD & Blows MW Simultaneous estimation of additive and mutational genetic variance in an outbred population of Drosophila serrata.” Genetics 201, 1239–1251 (2015). [DOI] [PMC free article] [PubMed] [Google Scholar]
- 12.Huang W, et al. Spontaneous mutations and the origin and maintenance of quantitative genetic variation. eLife 5, e14625 (2016). [DOI] [PMC free article] [PubMed] [Google Scholar]
- 13.Mitchell-Olds T, Willis JH & Goldstein DB Which evolutionary processes influence natural genetic variation for phenotypic traits? Nature Reviews Genetics 8, 845–856 (2007). [DOI] [PubMed] [Google Scholar]
- 14.Charlesworth B Causes of natural variation in fitness: evidence from studies of Drosophila populations. Proceedings of the National Academy of Sciences of the USA 112, 1662–1669 (2015). [DOI] [PMC free article] [PubMed] [Google Scholar]
- 15.Subramaniam B & Rausher MD Balancing selection on a floral polymorphism. Evolution 54, 691–695 (2000). [DOI] [PubMed] [Google Scholar]
- 16.Charlesworth D Balancing selection and its effects on sequences in nearby genome regions. PLoS Genetics 2, e64 (2006). [DOI] [PMC free article] [PubMed] [Google Scholar]
- 17.Hedrick PW & Thomson G Evidence for balancing selection at HLA. Genetics 104, 449–456 (1983). [DOI] [PMC free article] [PubMed] [Google Scholar]
- 18.Troth A, Puzey JR, Kim RS, Willis JH & Kelly JK Selective trade-offs maintain alleles underpinning complex trait variation in plants. Science 361, 475–478 (2018). [DOI] [PubMed] [Google Scholar]
- 19.Delph LF & Kelly JK On the importance of balancing selection in plants. New Phytologist 201, 45–56 (2014). [DOI] [PMC free article] [PubMed] [Google Scholar]
- 20.Anderson JT, Wagner MR, Rushworth CA, Prasad KVSK & Mitchell-Olds T The evolution of quantitative traits in complex environments. Heredity 112, 4–12 (2014). [DOI] [PMC free article] [PubMed] [Google Scholar]
- 21.Anderson JT & Wadgymar SM Climate change disrupts local adaptation and favours upslope migration. Ecology Letters 23, 181–192 (2020). [DOI] [PubMed] [Google Scholar]
- 22.Agrawal AA & Fishbein M Plant defense syndromes. Ecology 87, S132–S149 (2006). [DOI] [PubMed] [Google Scholar]
- 23.Carmona D, Lajeunesse MJ & Johnson MT Plant traits that predict resistance to herbivores. Functional Ecology 25, 358–367 (2011). [Google Scholar]
- 24.DeLucia EH, Nabity PD, Zavala JA & Berenbaum MR Climate change: resetting plant-insect interactions. Plant Physiology 160, 1677–1685 (2012). [DOI] [PMC free article] [PubMed] [Google Scholar]
- 25.Mithöfer A & Boland W Plant defense against herbivores: Chemical aspects. Annual Review of Plant Biology 63, 431–450 (2012). [DOI] [PubMed] [Google Scholar]
- 26.Prasad KVSK, et al. A gain-of-function polymorphism controlling complex traits and fitness in nature. Science 337, 1081–1084 (2012). [DOI] [PMC free article] [PubMed] [Google Scholar]
- 27.Bergelson J, Dwyer G & Emerson JJ Models and data on plant-enemy coevolution. Annual Review of Genetics 35, 469–499 (2001). [DOI] [PubMed] [Google Scholar]
- 28.Hodgins KA & Barrett SCH Female reproductive success and the evolution of mating-type frequencies in tristylous populations. New Phytologist 171, 569–580 (2006). [DOI] [PubMed] [Google Scholar]
- 29.Trotter MV & Spencer HG Complex dynamics occur in a single-locus, multiallelic model of general frequency-dependent selection. Theoretical Population Biology 76, 292–298 (2009). [DOI] [PubMed] [Google Scholar]
- 30.Tuinstra MR, Ejeta G & Goldsbrough PB Heterogeneous inbred family (HIF) analysis: a method for developing near-isogenic loci that differ at quantitative traits. Theoretical and Applied Genetics 95, 1005–1011 (1997). [Google Scholar]
- 31.Salehin M et al. Auxin-sensitive Aux/IAA proteins mediate drought tolerance in Arabidopsis by regulating glucosinolate levels. Nature Communications 10, 4021 (2019). [DOI] [PMC free article] [PubMed] [Google Scholar]
- 32.Hossain MS et al. Glucosinolate degradation products, isothiocyanates, nitriles, and thiocyanates, induce stomatal closure accompanied by peroxidase-mediated reactive oxygen species production in Arabidopsis thaliana. Bioscience, Biotechnology and Biochemistry 77, 977–983 (2013). [DOI] [PubMed] [Google Scholar]
- 33.Mitchell-Olds T & Schmitt J Genetic mechanisms and evolutionary significance of natural variation in Arabidopsis. Nature 441, 947–952 (2006). [DOI] [PubMed] [Google Scholar]
- 34.Wang B et al. Ancient polymorphisms contribute to genome-wide variation by long-term balancing selection and divergent sorting in Boechera stricta. Genome Biology 20, 126 (2019). [DOI] [PMC free article] [PubMed] [Google Scholar]
- 35.Bloom TC, Baskin JM & Baskin CC Ecological life history of the facultative woodland biennial Arabis laevigata variety laevigata (Brassicaceae): seed dispersal. Journal of the Torrey Botanical Society 129, 21–28 (2002). [Google Scholar]
- 36.Song B-H et al. Multilocus patterns of nucleotide diversity, population structure, and linkage disequilibrium in Boechera stricta, a wild relative of Arabidopsis. Genetics 181, 1021–1033 (2009). [DOI] [PMC free article] [PubMed] [Google Scholar]
- 37.Mackay T, Stone E & Ayroles J The genetics of quantitative traits: challenges and prospects. Nature Reviews Genetics 10, 565–577 (2009). [DOI] [PubMed] [Google Scholar]
- 38.Hedrick PW Genetic polymorphism in heterogeneous environments: a decade later. Annual Review of Ecology and Systematics 17, 535–566 (1986). [Google Scholar]
- 39.Hedrick PW Antagonistic pleiotropy and genetic polymorphism: a perspective. Heredity 82, 126–133 (1999). [Google Scholar]
- 40.Turelli M & Barton NH Polygenic variation maintained by balancing selection: pleiotropy, sex-dependent allelic effects and G x E interactions. Genetics 166, 1053–1079 (2004). [DOI] [PMC free article] [PubMed] [Google Scholar]
- 41.Gillespie JH & Langley CH A general model to account for enzyme variation in natural populations. Genetics 76, 837–848 (1974). [DOI] [PMC free article] [PubMed] [Google Scholar]
- 42.Anderson JT, Willis JH, & Mitchell-Olds T Evolutionary genetics of plant adaptation. Trends in Genetics 27: 258–266 (2011). [DOI] [PMC free article] [PubMed] [Google Scholar]
- 43.Anderson JT, Lee C-R, Rushworth CA, Colautti RI, & Mitchell-Olds T Genetic trade-offs and conditional neutrality contribute to local adaptation. Molecular Ecology 22: 699–708 (2013). [DOI] [PMC free article] [PubMed] [Google Scholar]
- 44.Oakley CG, Ågren J, Atchison RA & Schemske DW (2014) QTL mapping of freezing tolerance: links to fitness and adaptive trade-offs. Molecular Ecology 23, 4304–4315. [DOI] [PubMed] [Google Scholar]
- 45.Price N et al. Combining population genomics and fitness QTLs to identify the genetics of local adaptation in Arabidopsis thaliana. Proceedings of the National Academy of Sciences of the USA 115, 5028–5033 (2018). [DOI] [PMC free article] [PubMed] [Google Scholar]
- 46.Kettunen J et al. Genome-wide association study identifies multiple loci influencing human serum metabolite levels. Nature Genetics 44, 269–276 (2012). [DOI] [PMC free article] [PubMed] [Google Scholar]
- 47.Abuelsoud W, Hirschmann F, & Papenbrock J Sulfur metabolism and drought stress tolerance in plants. pp. 227–248 in Hosssain MA, Wani SH, Bhattacharjee S, Burritt DJ, and Phan Tan L-S, eds.: Drought Stress in Plants, Volume 1. Switzerland: Springer; (2016). [Google Scholar]
- 48.Nguyen D, Rieu I, Mariani C, and van Dam NM How plants handle multiple stresses: hormonal interactions underlying responses to abiotic stress and insect herbivory. Plant Molecular Biology 91: 727–740 (2016). [DOI] [PMC free article] [PubMed] [Google Scholar]
- 49.Shani EM et al. Plant stress tolerance requires auxin-sensitive Aux/IAA transcriptional repressors. Current Biology 27: 437–444 (2017). [DOI] [PMC free article] [PubMed] [Google Scholar]
- 50.Hopkins RJ, van Dam NM, and van Loon JJA Role of glucosinolates in insect-plant relationships and multitrophic interactions. Annual Review of Entomology 54: 57–83 (2009). [DOI] [PubMed] [Google Scholar]
- 51.Burow M, Müller R, Gershenzon J & Wittstock U Altered glucosinolate hydrolysis in genetically engineered Arabidopsis thaliana and its influence on the larval development of Spodoptera littoralis. Journal of Chemical Ecology 32, 2333–2349 (2006). [DOI] [PubMed] [Google Scholar]
- 52.Wagner MR, & Mitchell-Olds T Plasticity of plant defense and its evolutionary implications in wild populations of Boechera stricta. Evolution 72, 1034–1049 (2018). [DOI] [PMC free article] [PubMed] [Google Scholar]
- 53.Purcell S et al. PLINK: A tool set for whole- genome association and population-based linkage analyses. American Journal of Human Genetics 81, 559–575 (2007). [DOI] [PMC free article] [PubMed] [Google Scholar]
- 54.Pagès H, Aboyoun P, Gentleman R & DebRoy S Biostrings: efficient manipulation of biological strings. R package version 2.56.0 (2020). [Google Scholar]
- 55.Wang et al. Correction to: Ancient polymorphisms contribute to genome-wide variation by long-term balancing selection and divergent sorting in Boechera stricta. Genome Biology 20, 16 (2019). [DOI] [PMC free article] [PubMed] [Google Scholar]
- 56.Atkinson NJ, Lilley CJ & Urwin PE Identification of genes involved in the response of Arabidopsis to simultaneous biotic and abiotic stresses. Plant Physiology 162, 2028–2041 (2013). [DOI] [PMC free article] [PubMed] [Google Scholar]
- 57.Sharma A et al. Comprehensive analysis of plant rapid alkalization factor (RALF) genes. Plant Physiology and Biochemistry 106, 82–90 (2016). [DOI] [PubMed] [Google Scholar]
- 58.Dutilleul C, Jourdain A, Bourguignon J & Hugouvieux V The Arabidopsis putative selenium-binding protein family: Expression study and characterization of SBP1 as a potential new player in cadmium detoxification processes. Plant Physiology 147, 239–251 (2008). [DOI] [PMC free article] [PubMed] [Google Scholar]
- 59.Jiang S-C et al. Crucial roles of the pentatricopeptide repeat protein SOAR1 in Arabidopsis response to drought, salt and cold stresses. Plant Molecular Biology 88, 369–385 (2015). [DOI] [PMC free article] [PubMed] [Google Scholar]
- 60.Wen J, Vanek-Krebitz M, Hoffmann-Sommergruber K, Scheiner O & Breitender H The potential of Betv1 homologues, a nuclear multigene family, as phylogenetic markers in flowering plants. Molecular Phylogenetics and Evolution 8, 317–333 (1997). [DOI] [PubMed] [Google Scholar]
- 61.Koo AJ, Fulda M, Browse J & Ohlrogge JB Identification of a plastid acyl-acyl carrier protein synthetase in Arabidopsis and its role in the activation and elongation of exogenous fatty acids. The Plant Journal 44, 620–632 (2005). [DOI] [PubMed] [Google Scholar]
- 62.Henrissat B et al. Conserved catalytic machinery and the prediction of a common fold for several families of glycosyl hydrolases. Proceedings of the National Academies of Sciences of the USA 92, 7090–97094 (1995). [DOI] [PMC free article] [PubMed] [Google Scholar]
- 63.Carley L et al. , Data to accompany: Ecological factors influence balancing selection on leaf chemical profiles of a wildflower, Dryad Data, 10.5061/dryad.7h44j0zsr (2021). [DOI] [PMC free article] [PubMed] [Google Scholar]
Associated Data
This section collects any data citations, data availability statements, or supplementary materials included in this article.
Supplementary Materials
Data Availability Statement
New reference genome assemblies and raw Nanopore reads for SAD12 and LTM genotypes have been submitted to NCBI (BioProject number PRJNA609209). The short reads of the GBS data for CFR-NIL families have been submitted to NCBI (BioProject number PRJNA659863). Previously published genomic data are archived with [55]. All other data reported in this manuscript are archived in the Dryad digital data repository (DOI:10.5061/dryad.7h44j0zsr) [63]. All biological materials are available from the Arabidopsis Biological Resource Center (ABRC) or from the authors.