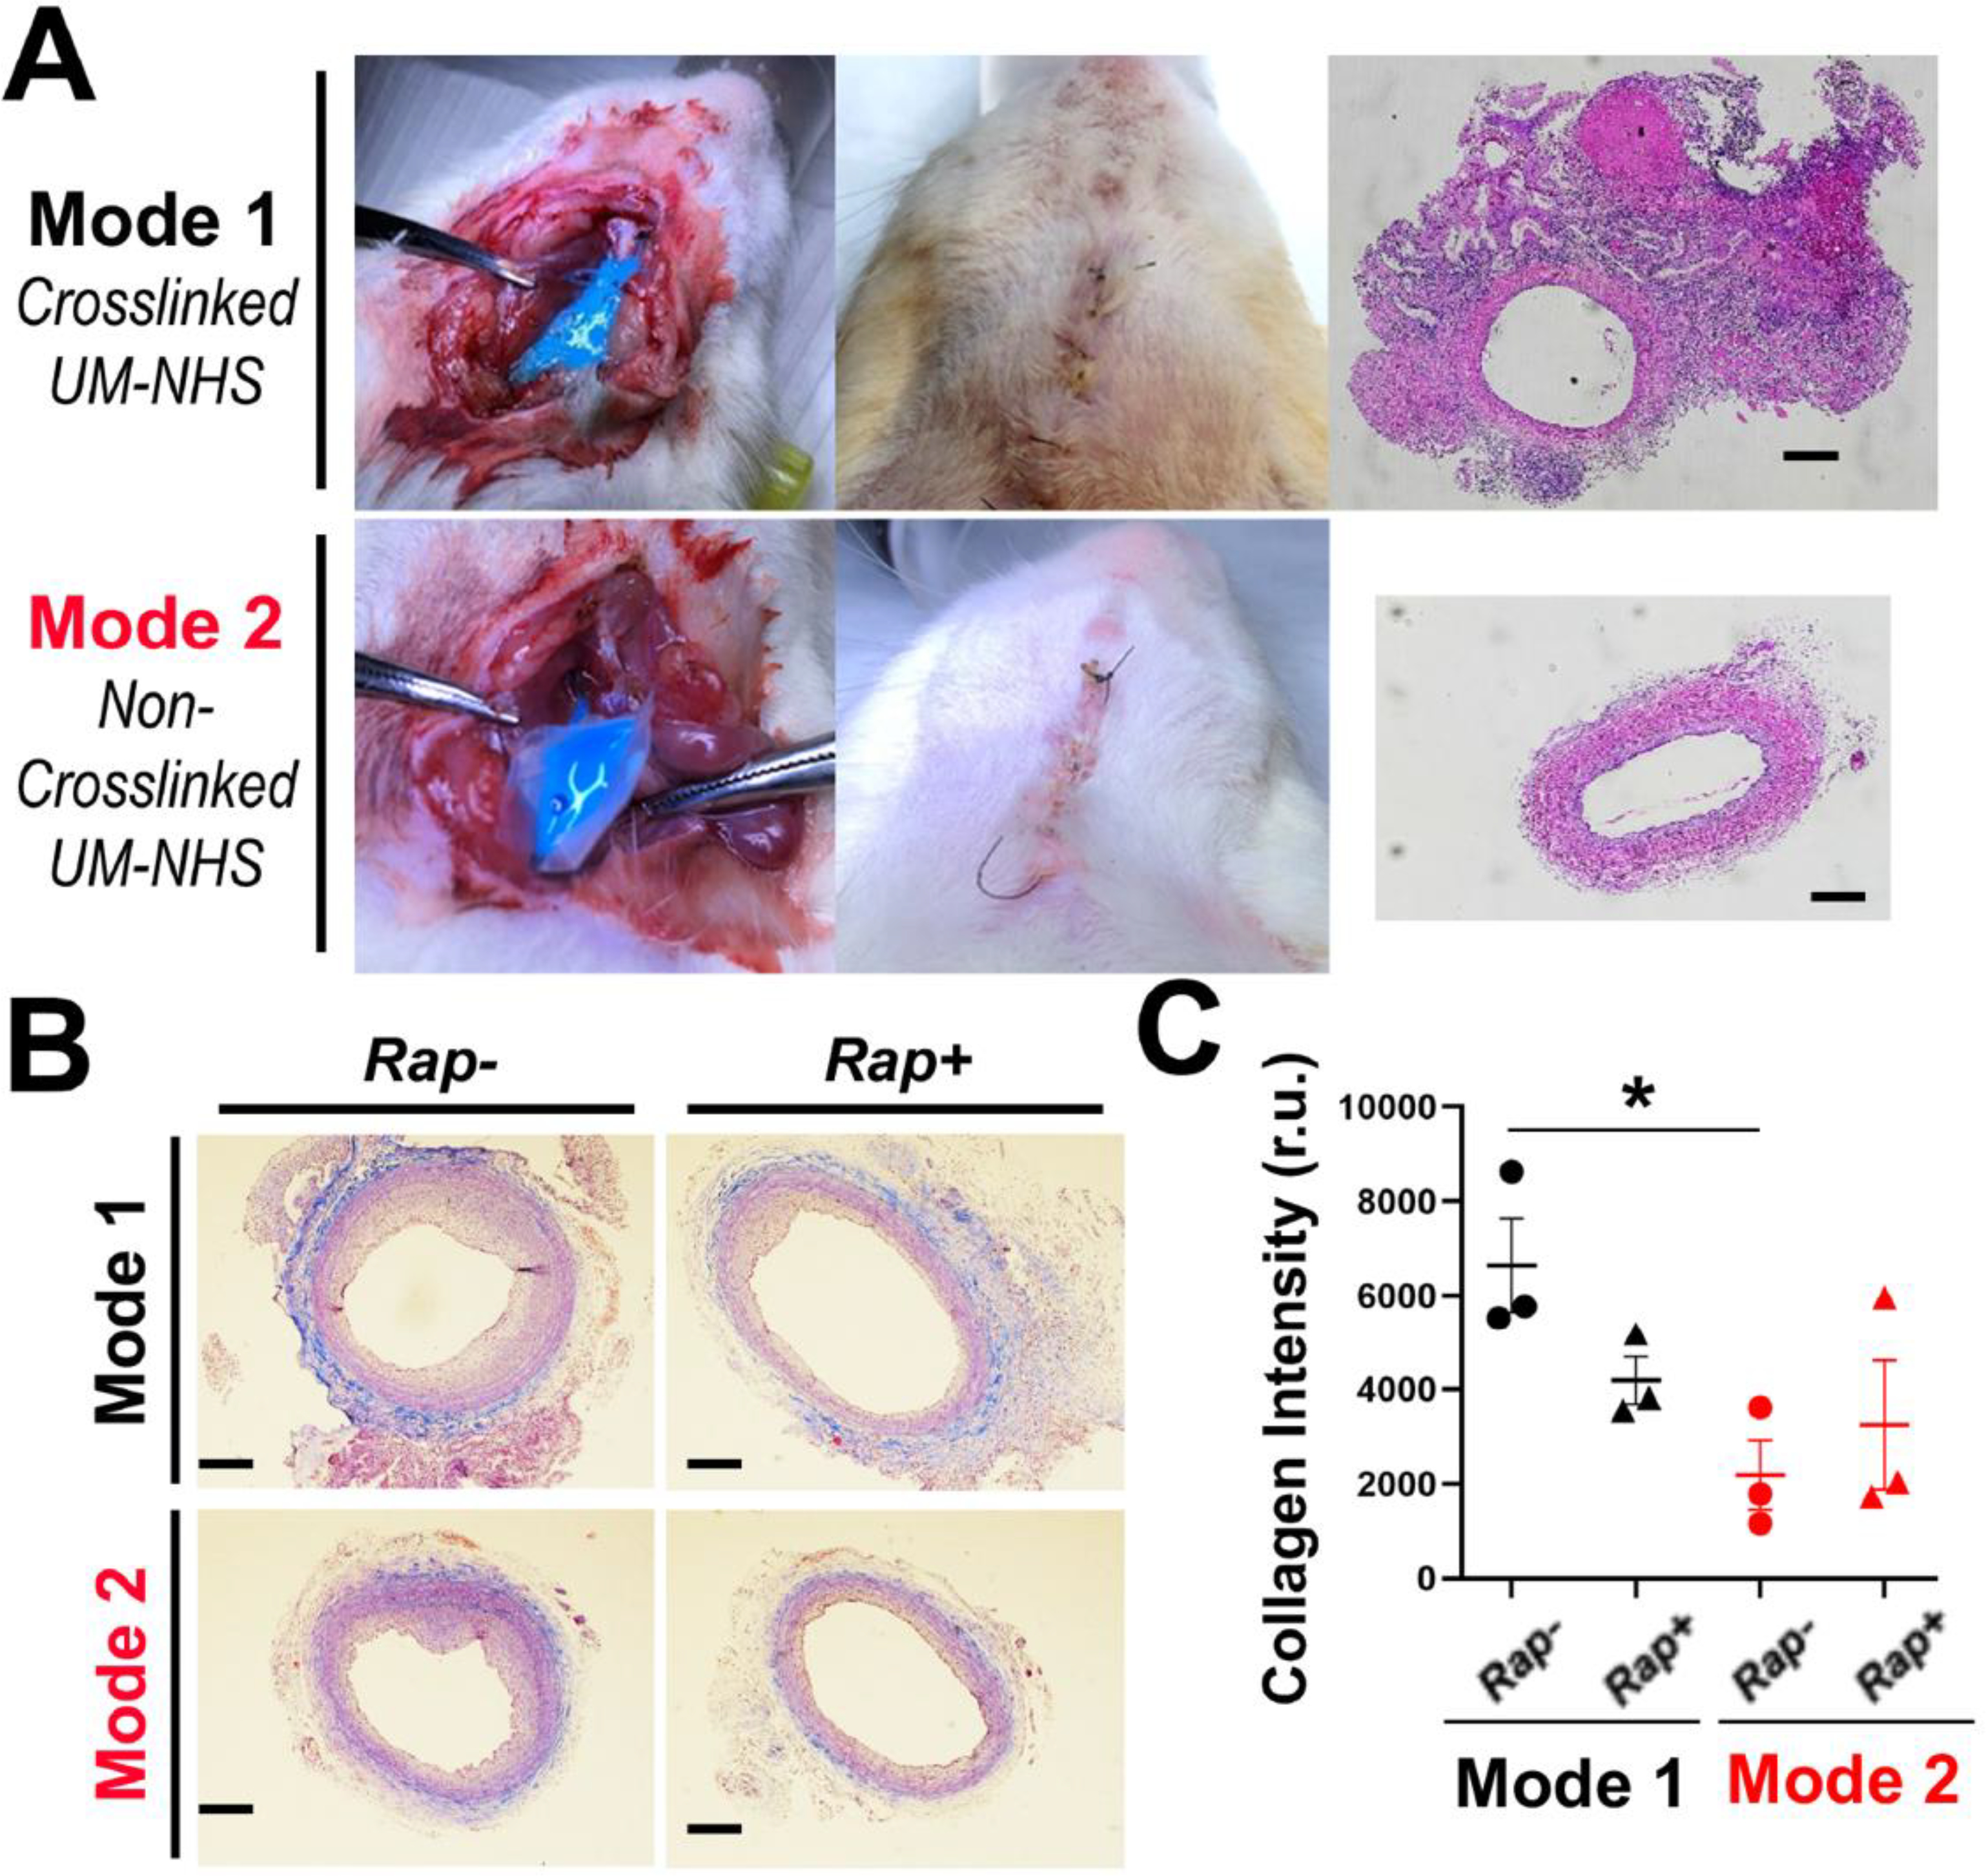
Figure 4. Pro-fibrotic effect of the Mode-1 (vs Mode-2) application on the artery.

(A) Photographic illustration of periadventitial application of UM. The photos show post-application (14 days) neck bulging in Mode-1 and lack of thereof in Mode-2. Note that the Cy5 fluorophore appeared blue at higher concentrations but not at lower concentrations (refer to Figure 6A). Shown on the right are representative H&E-stained cross-sections including undissectible surrounding tissues in Model-1. Scale bar: 200 μm. (B) Representative images of Masson’s trichrome staining of artery cross-sections. Scale bar: 200 μm. (C) Quantification: mean ± SEM, n = 3 rats. Statistics: ANOVA and Bonferroni test: *P <0.05. r.u., relative unit.
