Fig. 7.
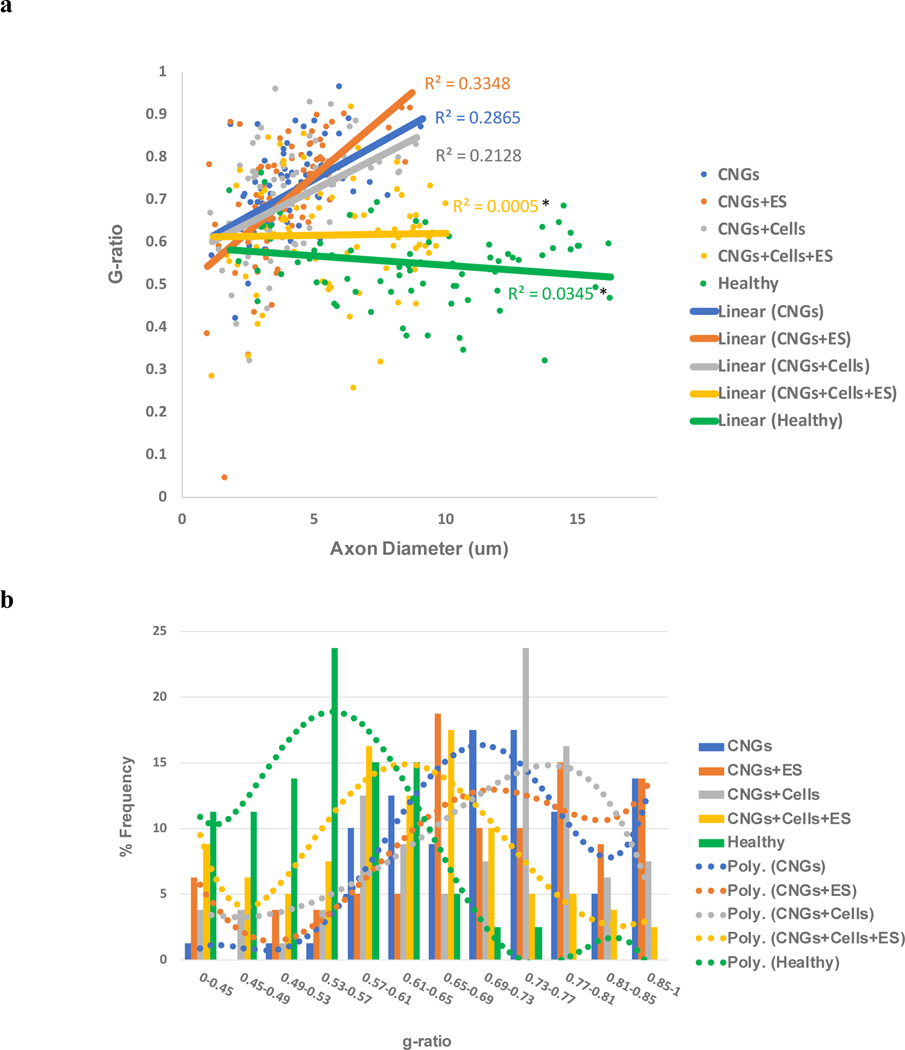
Electrically-stimulated hNPC-containing CNGs show improved g-ratio for sizeable nerves. (a) This diagram examines the relationship between axon diameter and g-ratio. The scatter plot displayed the g-ratio of individual myelinated axons (80 randomly chosen nerve fibers per group for n=4) as a function respective to the axon size. The linear regression of g-ratio measurement for unstimulated (CNGs) and stimulated CNGs (CNGs+ES), unstimulated (CNGs+Cells) and stimulated hNPC-containing CNGs (CNGs+Cells+ES), and healthy group (Healthy) was drawn. Stimulated hNPC-containing CNGs (CNGs+Cells+ES) presented a g-ratio of ~0.6 and minimal variability (R2=0.005) even for larger axons, followed by unstimulated hNPC-containing CNGs (CNGs+Cells), unstimulated CNGs (CNGs), and stimulated CNGs (CNGs+ES). The R2 values of stimulated hNPC-containing CNGs (CNGs+Cells+ES) and healthy group (Healthy) were significantly different from the stimulated CNGs (CNGs+ES) (n=4, *p<0.05) (b) Based on the frequency histogram (80 randomly chosen nerve fibers per group for n=4), stimulated hNPC-containing CNGs (CNGs+Cells+ES) had most nerve fibers within a g-ratio range of ~0.61–0.65, which was closer to the frequency bin of ~0.53–0.57 in the healthy group (Healthy). The unstimulated hNPC-containing CNGs (CNGs+Cells) were within ~0.73–0.77, unstimulated CNGs (CNGs) were ~0.69–0.73, and stimulated CNGs (CNGs+ES) were ~0.65–0.69. Polynomial curves were fit with the frequency response bins. Data were analyzed by one-way ANOVA followed by Tukey’s test.

