Abstract
Tea, coffee, and cocoa are the three most popular nonalcoholic beverages in the world and have extremely high economic and cultural value. The genomes of four tea plant varieties have recently been sequenced, but there is some debate regarding the characterization of a whole-genome duplication (WGD) event in tea plants. Whether the WGD in the tea plant is shared with other plants in order Ericales and how it contributed to tea plant evolution remained unanswered. Here we re-analyzed the tea plant genome and provided evidence that tea experienced only WGD event after the core-eudicot whole-genome triplication (WGT) event. This WGD was shared by the Polemonioids-Primuloids-Core Ericales (PPC) sections, encompassing at least 17 families in the order Ericales. In addition, our study identified eight pairs of duplicated genes in the catechins biosynthesis pathway, four pairs of duplicated genes in the theanine biosynthesis pathway, and one pair of genes in the caffeine biosynthesis pathway, which were expanded and retained following this WGD. Nearly all these gene pairs were expressed in tea plants, implying the contribution of the WGD. This study shows that in addition to the role of the recent tandem gene duplication in the accumulation of tea flavor-related genes, the WGD may have been another main factor driving the evolution of tea flavor.
Subject terms: Population genetics, Evolution
Introduction
Tea beverages made from tea plants (Camellia sinensis) are known as the world’s oldest (~3000 BC) and most popular nonalcoholic caffeinated beverages. Consumed by more than 3 billion people in more than 160 countries1, tea beverages have high economic and cultural value. With the rapid development of genome sequencing technologies2,3, a number of genomes of C. sinensis have been obtained, including those of C. sinensis var. sinensis (CSS) cv. “Shuchazao,”4–6 cv. ‘“Biyun,”7 cv. “Longjin43,”8 and the wild variety “DASZ”9 and C. sinensis var. assamica (CSA) cv. “Yunkang 10”10. These genomic data and results greatly accelerated research in tea plant science11.
The molecular mechanisms underlying tea flavor have been widely explored11,12. The metabolic pathways and accumulation mechanisms of catechins, caffeine, and theanine, the main secondary metabolites in tea, have been studied thoroughly11. The question of how tea plants evolved to accumulate specialized secondary metabolites has long attracted scientists. Tandem duplication has long been considered a key mechanism by which plants expand their accumulation of secondary metabolites. For example, the genes in the biosynthetic pathway of caffeine13 in tea plants and the biosynthetic pathway of morphine in poppy14 expanded in a similar way, through massive tandem gene duplication events. In addition, whole-genome duplication (WGD) is also considered an important factor leading to the development of stress resistance in plants15,16 and studies have also indicated that WGD contributed to the biosynthesis of secondary metabolites17. Due to recursive genome duplications and the loss of a large number of genes, large-scale gene relocations, the rearrangement of chromosome fragments, and fusion following genome duplication18–22, it is difficult to explore the evolutionary processes of plant genome duplication events and many researchers have developed tools to address this problem23. Therefore, how many rounds of WGD events tea plants experienced and what are their contributions to the evolution of secondary metabolites in tea plants were new questions that remain unanswered.
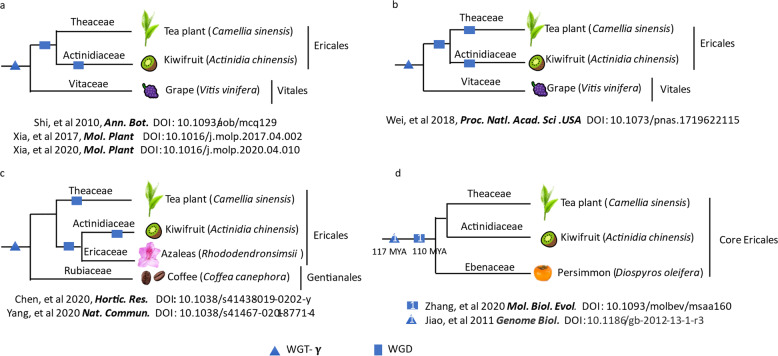
At present, the tea plant research community has obtained several genomes, but no unified conclusion regarding a WGD event in tea plants has been reached (Fig. 1). In 2010, Shi et al.24 suggested that tea and kiwifruit shared a WGD. Later studies of the CSA cv. “Yunkang 10”10 and CSS cv. “Shuchazao”6, as well as a study of widely cultivated azaleas (Rhododendron simsii)25 confirmed that tea plants experienced only one WGD event, which was shared with kiwifruit or rhododendron, after core-eudicot whole-genome triplication-γ (WGT-γ) (Fig. 1a). However, a genomic study of CSS cv. “Shuchazao”4 showed that the tea plant experienced two WGD events (Fig. 1b) after the WGT-γ: one was shared with kiwifruit (WGD-β, ~90–100 MYA) and one occurred in tea plants (WGD-α, 30–40 MYA). Chen et al.5 also studied cv. “Shuchazao” and found that tea plants experienced only one tea plant-specific WGD event following WGT-γ; this is the same as the conclusion of Yang et al.25 (Fig. 1c). In addition, the occurrence time of this WGD in order Ericales is still controversial; estimates include ~110 MYA by Zhang et al.26 (Fig. 1d)26,27 and ~50–57 MYA by Wang et al.17.
Fig. 1. Current debates regarding whole-genome duplication in tea plants.
a The tea plant experienced only one WGD after the WGT-γ. b The tea plant experienced two WGD events after the WGT-γ, one shared with kiwifruit (WGD-β, ~90–100 MYA), and one specific to tea plants (WGD-α, ~30–40 MYA). c The tea plant experienced only one WGD event after the WGT-γ and the WGD was tea plant specific. d Zhang et al. reported that the WGD occurred at ~100 MYA. The WGT-γ was reported to occur ~117 MYA
To this end, we re-analyzed the tea plant genomes and the genomes of related representative species. WGDs in rhododendron (R. simsii), kiwifruit (Actinidia chinensis) and persimmon (Diospyros lotus) (all belonging to order Ericales) have been reported24,25,28–30. In addition, the grape (Vitis vinifera) genome is relatively simple, experiencing only the core eudicot-specific WGT31. The genomes of rhododendron, kiwifruit, persimmon, and grape were used as references to reveal the WGD event in tea and to further explore the contribution of the WGD to the important secondary metabolites accumulated in tea plants.
Results
Evidence of an ancient WGD in the tea plant genome
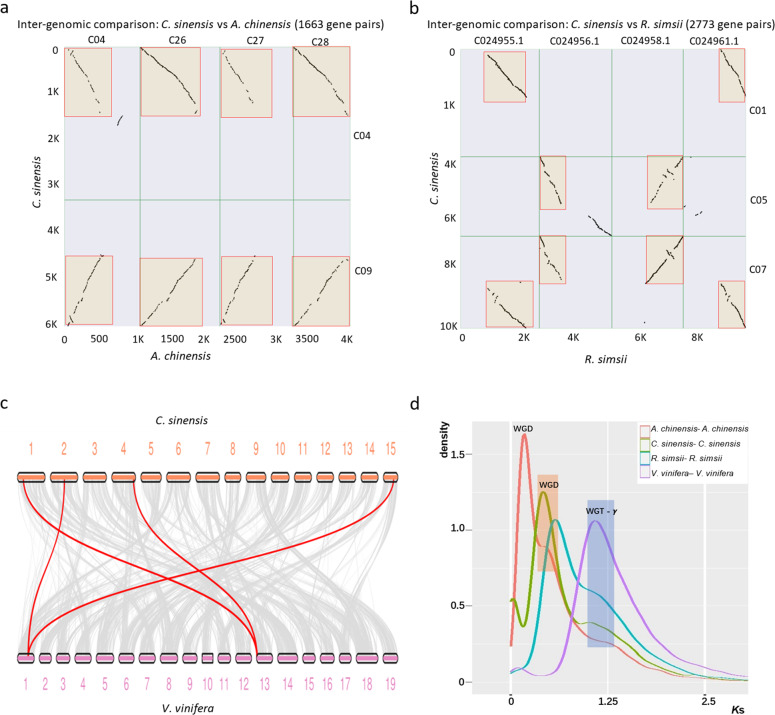
We first studied the genomic syntenic relationships among the five species, i.e., tea plant, kiwifruit, grape, persimmon, and rhododendron (Supplementary Fig. S1). With a total of 1342 syntenic blocks covering 21,873 gene anchor pairs (Supplementary Fig. S1e), the syntenic blocks between tea plant and kiwifruit showed a 2 : 4 syntenic relationship. For example, CsChr04 and CsChr09 in tea plant matched AcChr04, AcChr26, AcChr27, and AcChr28 in kiwifruit (Fig. 2a). In addition, a total of 849 syntenic blocks covering 16,827 homologous gene anchor pairs were detected between tea plant and rhododendron, showing a significant 2 : 2 syntenic relationship (Supplementary Fig. S1d). For example, CsChr01, CsChr05, and CsChr07 in tea plant matched C024955.1, C024956.1, C024958.1, and C024961.1 in rhododendron (Fig. 2b). Tea plants and grapes showed 2 : 1 syntenic relationships (Fig. 2c), and the same relationship was found in the analysis of wild tea plants DASZ and grapes (Supplementary Fig. S1g, h). These results indicated that tea plants experienced WGD after the WGT.
Fig. 2. Syntenic relationships and the Ks distribution suggested an ancient WGD event in the tea plant genome.
a Homologous dot plot between certain tea plant (C. sinensis) and kiwifruit (A. chinensis) chromosomes. b Homologous dot plot between certain tea plant and rhododendron (R. simsii) chromosomes. c Syntenic relationships of tea plant and grape chromosomes. The blocks with syntenic relationships are connected by gray lines and red lines represent two examples in which a block of grape (V. vinifera) has syntenic relationships with two blocks of tea plant. d The distribution of Ks for WGD gene pairs from kiwifruit, tea plant, rhododendron, and grape. The horizontal coordinates are Ks and the ordinates indicate the density of the gene pairs corresponding to Ks
The distribution of the Ks of the syntenic paralogs of tea plant, kiwifruit, grape, and rhododendron also revealed a similar result (Fig. 2d). We constructed the Ks distributions for the tea plant, rhododendron, persimmon, kiwifruit, and grape (Fig. 2d and Supplementary Fig. S4). The distribution of Ks showed that tea plant had a Ks peak at 0.425, which is on the left side of the grape peak at 1.088, suggesting that tea experienced an additional WGD after the WGT-γ. Rhododendron had a Ks peak similar to that in tea plants. Only kiwifruit showed two peaks, indicating that kiwifruit experienced additional WGDs that were not experienced by tea plant or rhododendron.
Molecular dating of this ancient WGD
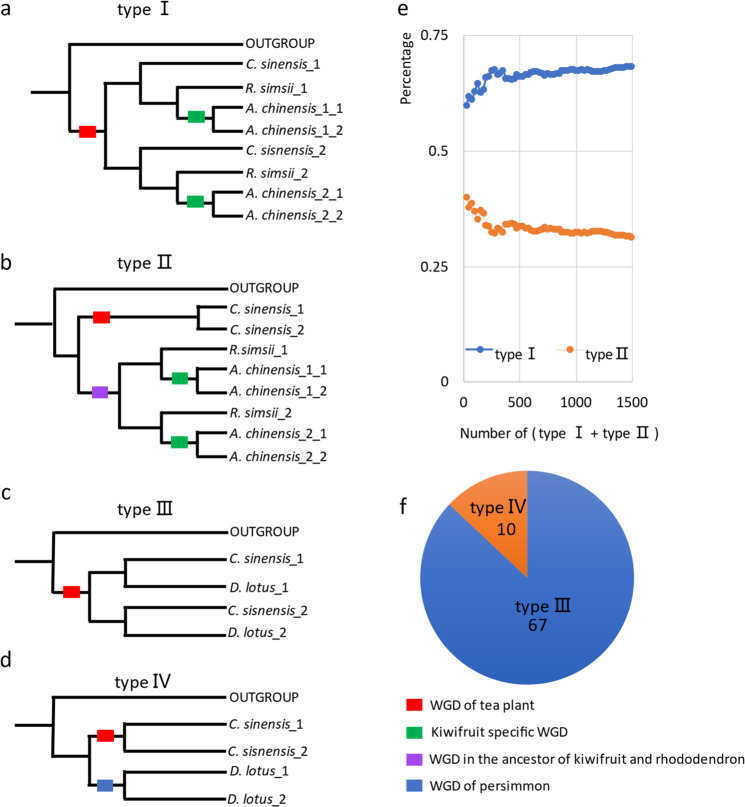
We have shown that tea plants experienced only one WGD after the WGT-γ. However, was this WGD tea plant specific or shared with kiwifruit, or even more species? It cannot be clearly determined through only the Ks distribution shown in Fig. 2d. Therefore, we constructed phylogenetic trees to determine whether this WGD is tea plant specific. We finally constructed 2798 single-copy nuclear gene-based phylogenetic trees covering tea plant (order Ericales, family Theaceae), rhododendron (order Ericales, family Ericaceae), kiwifruit (order Ericales, family Actinidiaceae), and outgroups (grape or coffee) (see “Methods” and Supplementary Table S2). Among them, type I (supporting tea plant, rhododendron, and kiwifruit sharing the WGD) (Fig. 3a) had 1021 trees, accounting for 36.5% of all phylogenetic trees. Type II (supporting tea plant experiencing the WGD independently) (Fig. 3b) had 471 trees, accounting for 16.8% of all trees. The rest of the trees were types other than type I or type II. We determined the proportions of the two types (Fig. 3e). The value of type I/(type I + type II) was 68.5%, whereas type II/(type I + type II) was 31.8%; the proportion of type I trees was more than twice that of type II trees. Another question was whether the close relative persimmon (D. lotus, order Ericales, family Ebenaceae) shared this WGD or not. A total of 168 single-copy nuclear gene-based phylogenetic trees covering tea plant, persimmon, and outgroups (grape or coffee) were constructed (Supplementary Table S2). Among them, 67 (40%) phylogenetic trees (type III) (Fig. 3c) clearly supported that tea plants and persimmons shared the WGD. Only ten (6%) phylogenetic trees (type IV) (Fig. 3d) supported that the two species did not share the WGD (Fig. 3f). Therefore, this evidence showed that the tea plant shared this WGD with rhododendron (family Ericaceae), kiwifruit (family Actinidiaceae), and persimmon (family Ebenaceae). According to the phylogenetic taxonomy of the order Ericales26, this WGD was shared by at least 17 families in three sections: Polemonioids, Primuloids, and core Ericales (PPC). Hence, this WGD was termed PPC-WGD in this study (Fig. 4b).
Fig. 3. Phylogenetic trees of syntenic genes showing that the WGD was shared by tea plant, kiwifruit, rhododendron, and persimmon.
a Phylogenetic tree indicating that the tea plant (C. sinensis) shared the WGD with kiwifruit (A. chinensis) and rhododendron (R. simsii) (type I). b Phylogenetic tree indicating that the tea plant (C. sinensis) experienced the WGD independently (type II). c Phylogenetic tree indicating that persimmon (D. lotus) shared the WGD with tea plant (C. sinensis) (type III). d Phylogenetic tree indicating that persimmon (D. lotus) did not share the WGD with tea plant (C. sinensis) (type IV). e Statistics on the proportions of two types of phylogenetic trees (type I and type II). f Statistics on the proportions of two types of phylogenetic trees (type III and type IV)
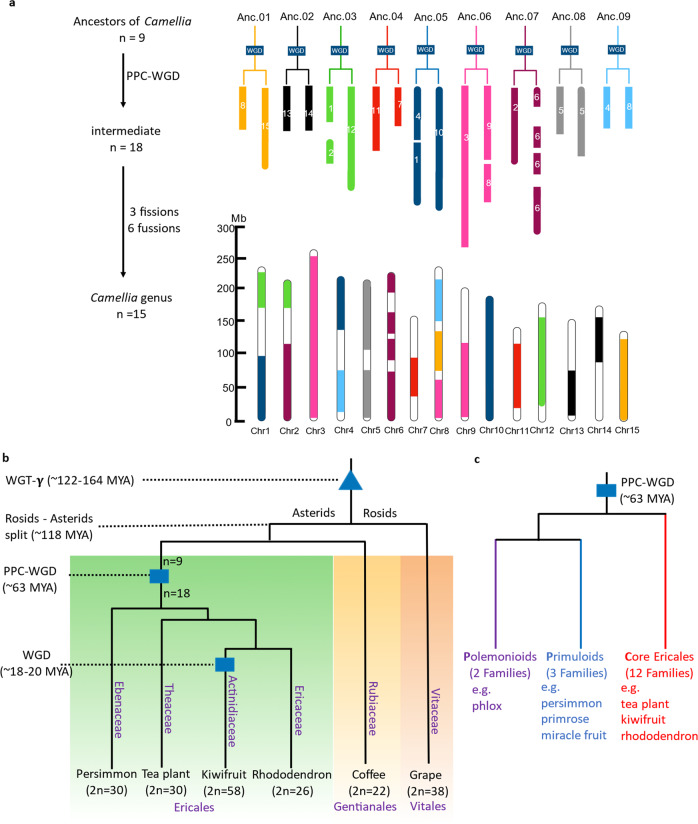
Fig. 4. The PPC-WGD shared by four families within the order Ericales and the evolution of tea plant chromosomes.
a Evolutionary patterns of tea plant chromosomes after WGD. b The species tree of tea plant and related species. The WGT and WGD are labeled triangles and rectangles, respectively. c Polemonioids, Primuloids, and core Ericales shared the PPC-WGD
In addition, we inferred chromosome evolution in tea plants. The chromosomes were plotted before and after PPC-WGD based on the syntenic gene blocks within the tea plant genome (Supplementary Fig. S8). Prior to PPC-WGD, nine ancestral chromosomes (2n = 18) were reconstructed. PPC-WGD then produced 18 ancestral chromosome intermediates (2n = 36). After three fissions and six fusions, the number of tea plant chromosomes reached the current number, 15 (2n = 30) (Fig. 4a). The evolution of tea plant chromosomes from 7 chromosomes (prior to WGT-γ) to 9 chromosomes showed that almost all chromosomes were formed by a series of fusions, interchanges, and insertions (Supplementary Fig. S6).
To infer the occurrence time of the PPC-WGD, the Ks = t/2r method, which has been widely applied to calculate the occurrence time of WGDs in many articles25,28,32, was used. The results showed that the time of the PPC-WGD was ~63 MYA (Fig. 4b), which is very close to the mass extinction at ~66 MYA at the Cretaceous-Paleogene (K-Pg) boundary33.
Contributions of PPC-WGD to characteristic secondary metabolites in tea
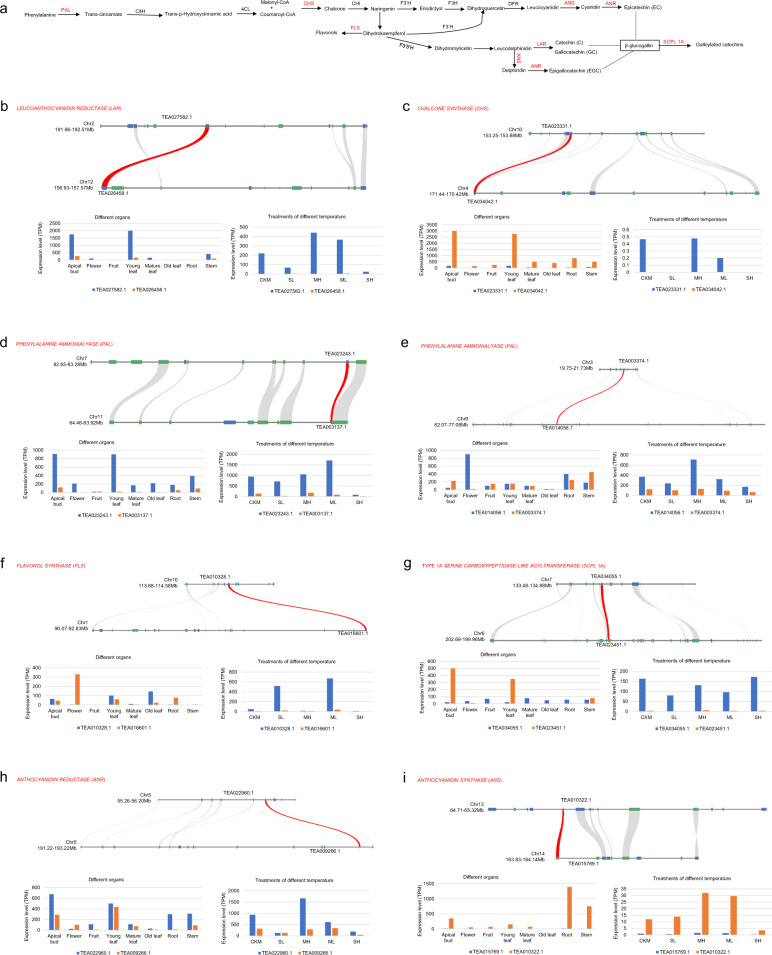
Caffeine, theanine, and catechins are the three most characteristic secondary metabolites in tea, playing important roles in creating tea flavor. At present, a series of studies have revealed that tandem duplication is the main reason for the accumulation of these special secondary metabolites, such as caffeine10 and catechins4, in tea plants. However, whether the PPC-WGD contributed to the amplification of genes related to these special secondary metabolites in tea plants is unclear. The biosynthesis of catechins involves regulation by many key enzymes, including phenylalanine ammonia lyase (PAL), leucoanthocyanidin reductase (LAR), anthocyanidin reductase (ANR), and many other key enzymes34 (Fig. 5a). Our analyses showed that a pair of LAR genes (Fig. 5b), a pair of CHALCONE SYNTHASE genes (Fig. 5c), two pairs of PAL genes (Fig. 5d, e), a pair of FLAVONOL SYNTHASE (FLS) genes (Fig. 5f), a pair of type 1A SERINE CARBOXYPEPIDA-LIKELTRANSFERASE (SCPL 1A) genes (Fig. 5g), a pair of ANR genes (Fig. 5h), and a pair of ANTHOCYANIDIN SYNTHASE (ANS) genes (Fig. 5i) were gene pairs with strong syntenic relationships produced by the PPC-WGD. The expression profile of the duplicated genes showed that most of these genes had at least one copy and sometimes both copies had high expression in the apical bud and leaf organ. In addition, only one copy of LAR (TEA026458.1), PAL (TEA003137.1), and ANS (TEA015769.1) had low expression in plant organs; under the different temperature treatments, both copies of most genes showed high expression in plant organs or under the temperature treatments. For example, two copies of ANR were highly expressed in apical buds and young leaves (Fig. 5h). The FLS copy TEA016601.1 had high expression in flowers, whereas TEA0010328.1 had high expression in the third mature leaf at severe low temperature and moderate low temperature (Fig. 5f). Although the two copies of most PPC-WGD gene pairs did not have high expression in the same organs or the same temperature treatments, the two copies were expressed at higher levels in different organs or under different treatments, showing that the two PPC-WGD copies contribute to the biosynthesis of catechins in different organs and under different temperatures in tea plants.
Fig. 5. PPC-WGD contributed to the expansion of genes involved in the biosynthesis of catechins in tea plants.
a The main biosynthesis pathways of catechins in tea plants. b–i Microsynteny visualization and expression chart of LAR, PAL, CHS, FLS, SCPL, ANR, and ANS genes in the biosynthesis pathway of catechins. CKM, SL, MH, ML, and SH represent CK, severe low temperature, moderate heat, moderate low temperature, and severe heat, respectively
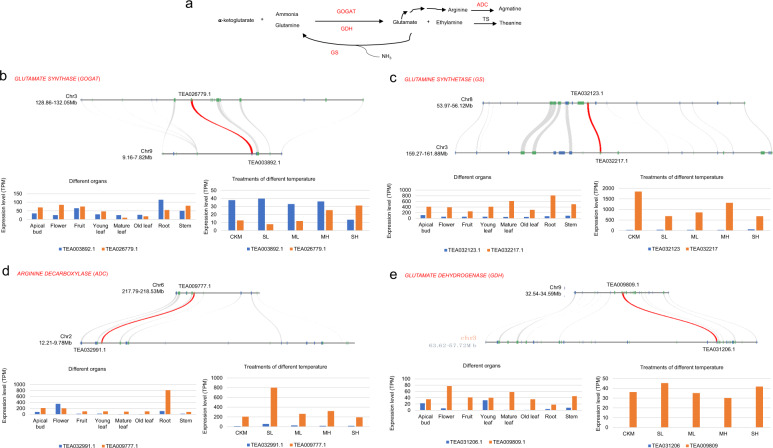
Theanine, a nonprotein amino acid found in Camellia plants that accounts for ~70% of the total free amino acids in the new shoots of tea plants, is closely correlated with tea quality35. The main route for theanine biosynthesis progresses from glutamine to theanine36, including catalytic enzymes such as glutamate synthase (GOGAT), glutamine synthetase (GS), arginine decarboxylase (ADC), glutamate dehydrogenase (GDH), and theanine synthase (Fig. 6a). Our analysis showed that a pair of GOGAT genes, a pair of GS genes, a pair of ADC genes, and a pair of GDH genes in tea plant are anchor pairs duplicated by the PPC-WGD (Fig. 6). Expressional analyses showed that the two copies of GOGAT had high expression, both in different organs and under different temperature treatments. Other duplicates had high expression in tea plant organs or under different temperature treatments (Fig. 6). Together, these results suggested that PPC-WGD probably contributed greatly to the development of theanine biosynthesis.
Fig. 6. PPC-WGD contributed to the expansion of genes involved in the biosynthesis of theanine in tea plants.
a The main biosynthesis pathways of theanine in tea plants. b Microsynteny visualization and expression chart of GOGAT genes in the biosynthesis pathway of theanine. c Microsynteny visualization and expression chart of GS genes in the biosynthesis pathway of theanine. d Microsynteny visualization and expression chart of ADC genes in the biosynthesis pathway of theanine. e Microsynteny visualization and expression chart of GDH genes in the biosynthesis pathway of theanine
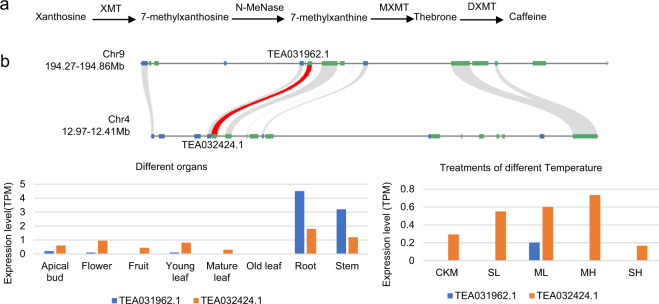
Caffeine (1,3,7-trimethylxanthine), a common ingredient found in tea, coffee, and cocoa, is an important flavor substance in tea that has many benefits for human health37. The main steps of caffeine biosynthesis involve three methylation steps from xanthosine to caffeine38,39. The tea plant pathway from xanthosine nucleosides to caffeine mainly depends on a continuum of three N-methyltransferases (NMTs), including xanthosine methyltransferase, 7-methylxanthine methyltransferase, and 3,7-dimethylxanthine methyltransferase (Fig. 7a). Our analyses showed that a pair of NMT genes in the tea plant was duplicated through the PPC-WGD (Fig. 7b). The expression profiles of the two duplicates showed relatively low expression in all tea plant organs, but this could be due to the specific spatial and temporal expression patterns or the induced expression of NMT genes under specific circumstances (Fig. 7b).
Fig. 7. PPC-WGD contributed to the expansion of genes involved in the biosynthesis of caffeine in tea plants.
a The main biosynthesis pathways of caffeine in tea plants. b Microsynteny visualization and expression of NMT genes in the biosynthesis pathway of caffeine
We then compared the gene numbers from those pathways, i.e., the catechins, theanine, and caffeine biosynthesis pathways, Supplementary Table S1) in persimmon and rhododendron. Only a few or even no homologous genes were found in rhododendron and persimmon, Supplementary Table S3), showing that although rhododendron and persimmon shared this PPC-WGD with tea plant, the tea plant was better able to the genes that participate in these pathways.
Discussion
Why PPC-WGD identification in tea plants has consistently been controversial
Explorations of the PPC-WGD in tea plants in different studies have reached inconsistent conclusions, probably for the following reasons. First, the PPC-WGD is relatively old (occurring more than 60 MYA) and lateral genome shuffling makes it even more difficult to identify. Second, the split between tea and other species in the Ericales almost followed the occurrence of the PPC-WGD, thus making it difficult to determine whether the PPC-WGD occurred before or within the tea plant split. Third, the highly random error rate of third-generation sequencing platforms will lead to bias in Ks distributions. Fourth, the rates of gene retention and gene loss can be very different among different species; this may also be one of the reasons why it is difficult to identify whether species experienced the PPC-WGD together. Therefore, our combined method relying on a syntenic approach, a phylogenetic approach, and the Ks distribution of anchor pairs allows us to comprehensively and accurately identify the PPC-WGD.
The timing of the PPC-WGD
If this PPC-WGD is shared by tea plant, kiwifruit, persimmon, and rhododendron, as proposed by the phylogenetic relationship reported by Zhang et al.26, it is shared by at least 17 families in the order Ericales (Ericaceae, Cyrillaceae, Clethraceae, Actinidiaceae, Roridulaceae, Sarraceniaceae, Styracaceae, Diapensiaceae, Symplocaceae, Theaceae, Sladeniaceae, Pentaphylaceae, Ebenaceae, Primulaceae, Sapotaceae, Polemoniaceae, and Fouquieriaceae). However, to determine whether other families in the order Ericales also shared this PPC-WGD, more genomic data will be needed in the future.
In the results, we found that the PPC-WGD of tea plants occurred ~63 MYA, almost coinciding with the mass extinction at the K-Pg boundary. The K-Pg mass extinction is an significant event in the history of the earth40,41. A series of monocots and eudicots experienced WGDs at the K-Pg boundary and retained stress-related genes15. Many PPC-WGD genes related to stress resistance were also retained in tea plants (Supplementary Fig. S7).
PPC-WGD and subsequent shuffling in the evolution of tea plant chromosomes
How did the chromosomes of tea plant (2n = 30) evolve? Previous genomic reports on tea plants4–8 and plants in the order Ericales17,24,25,28–30,42,43 did not provide any information on this question. To fill this gap, our study provides multiple lines of evidence to reveal the evolutionary history of tea plant chromosomes. Relying on genome synteny and comparative genomics, we showed that the tea plant has an ancestral chromosome base of 9 chromosomes (2n = 18). Then, the PPC-WGD produced 18 chromosomes, followed by 3 fissions and 6 fusions, and the extant 15 chromosomes (2n = 30) of most Camellia species were formed. In addition, we provide strong evidence that at least four families (Theaceae, Ericaceae, Actinidiaceae, and Ebenaceae) shared this PPC-WGD. Considering that there are 17 families in the PPC section in order Ericales, we believe that the number of ancestral chromosomal bases of the PPC section species is 9. Therefore, this study provides details about the chromosomal evolution of many important species, including tea plant, kiwifruit, rhododendron, and persimmon.
PPC-WGD contributes to tea flavor
Caffeine, catechins, and theanine are responsible for the unique flavor of tea. Most previous studies have confirmed that the genes in the biosynthetic pathways of these secondary metabolites were expanded by tandem duplications. For example, in coffee, scientists revealed that NMT genes expanded through sequential tandem duplications13. Subsequent studies in tea plant also identified the NMT genes responsible for caffeine biosynthesis and the SCPL genes responsible for catechins biosynthesis, which were expanded by tandem duplications in the tea plant genome4,10.
Coffee, tea plant, and cocoa all belong to the core eudicots that experienced a γ-WGT at ~100 MYA. Coffee and tea plant are asterids, whereas cocoa is a rosid. Cocoa and coffee did not experience the lateral WGD, but the tea plant experienced the PPC-WGD, as we have shown with multiple lines of evidence. Coffee and cocoa did not experience the lateral WGD; thus, the accumulation of the three main secondary metabolites (caffeine, catechins, and theanine) could only occur due to segmental gene duplication or tandem gene duplications. In the tea plant, we found that multiple key genes expanded and were retained after the PPC-WGD, including eight pairs of genes associated with catechins, four pairs of key genes related to the biosynthesis of theanine, and a pair of NMT genes associated with the biosynthesis of caffeine. Compared to coffee and cocoa, tea generally had more paralogs of these genes (Supplementary Fig. S5). In addition, we showed that these genes were expressed in different organs, suggesting that the gene dosage contributed to the accumulation of secondary metabolites in the tea plant.
However, why did other species that experienced the PPC-WGD with tea plants, such as rhododendron, kiwifruit, and persimmon, not begin to accumulate these characteristic secondary metabolites? First, although tea plants shared the PPC-WGD with other plants in the order Ericales, tea plants better retained the relevant genes after the PPC-WGD. The retained PPC-WGD genes related to these pathways for characteristic secondary metabolites are far more abundant in tea than in rhododendron and persimmon (Supplementary Table S3), which indicates that tea better retained the genes that participate in these pathways. Second, due to the long-term differentiation and independent evolution of these species, there is no caffeine or theanine in rhododendron, kiwifruit, or persimmon35,37, indicating that there is no biosynthetic pathway responsible for caffeine or theanine in these species. Therefore, the retained PPC-WGD genes in these plants are very likely to perform different functions than those in tea plants.
Experimental procedures
Data sources
The coding sequence (cds) and generic feature format (gff) files, and the genomic data for the tea plant (CSS) were downloaded from GitHub (the analyses of the evolution of tea plant chromosomes and the contribution of PPC-WGD to tea flavor were based on this genome): https://github.com/JiedanChen/TeaGenomeData, TPIA44 (except for special annotations, other analyses were based on this genome): http://tpia.teaplant.org/index.html, and figshare45 (genome of wild tea plants DASZ): https://figshare.com. The cds and gff files and the genome data for grape (V. vinifera) were downloaded from Phytozome46: https://phytozome.jgi.doe.gov/pz/portal.html. The cds and gff files and the genome data for kiwifruit (A. chinensis) were downloaded from the Kiwifruit Genome Database43: http://kiwifruitgenome.org/organism/5. The cds and gff files and the genome data for rhododendron (R. simsii) were downloaded from NCBI: https://www.ncbi.nlm.nih.gov/. The cds and gff files, and the genome data for coffee (Coffea canephora) were downloaded from the Coffee Genome Hub47: http://www.coffee-genome.org/. The cds and gff files, and the genome data for persimmon (D. lotus) were downloaded from Persimmon DB: http://persimmon.kazusa.or.jp/. The relevant genes identified in the tea plant pathways for catechins, caffeine, and theanine biosynthesis were derived from previously reported results4, and the relevant gene expression data for the different organs were derived from TPIA44: http://tpia.teaplant.org. We cultivated tea seedlings at different temperatures to obtain transcriptome data at different temperatures.
Methods
To identify the homologous gene pairs and syntenic relationships between tea and other species, we used MCscan48 (https://github.com/tanghaibao/jcvi/wiki/MCscan-(Python-version)) to perform interspecies syntenic analysis, to obtain homologous gene blocks and gene pairs between species, as well as syntenic plots of homologous gene pairs. To characterize the synonymous substitution rates (Ks) for homologous genes within species, we used DupGen_finder49 to identify the WGD gene pairs within species and then used KaKs_Calculator (2.0)50 to calculate the Ks values of those gene pairs within species and homologous gene pairs between species obtained by MCscan based on the NG model. We made a preliminary Ks density map for each species (Supplementary Fig. S2). In theory, the divergence time of the three species (tea plant, rhododendron, and kiwifruit) and grape should be consistent, so the divergence peak of Ks (Supplementary Fig. S4) of the three species and grape should also be consistent. Therefore, we calculated the correction coefficient of kiwifruit (Cac) and rhododendron (Crs) using the Ks peak of tea and grape (Kscss-vv) as a reference: Kscss-vv = Ksac-vv * Cac = Ksrs-vv * Crs. The original Ks (Supplementary Fig. S3) of kiwifruit and rhododendron were then corrected with Cac and Crs, respectively. Finally, we used R to plot the bar chart or curve chart of the Ks values based on the same parameters, such as bins.
To determine whether the WGD event in tea was shared with species such as rhododendron and kiwifruit, we first used DupGen_finder49 to determine the WGD gene pairs for tea plant, kiwifruit, and rhododendron. We then selected the syntenic genes of coffee or grape as outgroups and identified the syntenic genes of kiwifruit and rhododendron. After the selection of the appropriate genes, we used Mafft51 for multisequence comparison with the -auto parameter option. Then, the comparison sequences were compared with FastTree52 to construct phylogenetic trees with default parameters. Finally, MEGAX53 was used to view and adjust the tree files. Then, we constructed phylogenetic trees for the persimmon and tea plant sequences in type I (Fig. 3a).
We used the Ks = t/2r method, which has been widely used in molecular dating25,28,32, to calculate the WGD occurrence time. We calculated the r-value based on the divergence time of tea plant and grape (the rosid-asterid split) at ~118 MYA32 and the Ks value (0.781) corresponding to the split peak of the tea plant and grape (Supplementary Fig. S4). Then, we calculated the time of the WGD based on the r-value and the Ks value (0.425) corresponding to the tea plant Ks peak (Supplementary Fig. S3).
We inferred the number of tea plant chromosomes before the WGD and their evolution after the WGD based on the homologous gene blocks within the tea plant genome (Supplementary Fig. S8). Large fragments of syntenic blocks are thought to have been doubled by the same chromosome fragment, which suggested the evolution of the tea plant chromosomes.
To explore whether the WGD contributed to the development of important secondary metabolites in tea plant, we first looked for the genes responsible for the biosynthesis pathways of important secondary metabolites in tea plant. Then, we searched these genes as anchor pairs by checking the MCscan-generated syntenic genes (Supplementary Table S1). The gene expression data for different organs were obtained from the TPIA44 database. We used fastp54 to preprocess the raw fastq data, STAR55 for sequence matching, and RSEM56 to calculate the amount of expression, to obtain expression data for the tea plants at different temperatures.
AgriGO v2.057 was used to conduct Gene Ontology analyses. We conducted a protein BLAST search to identify the homologous genes for the genes mentioned in those pathways, i.e., the catechins, theanine, and caffeine pathways (Supplementary Table S1), in persimmon and rhododendron, which were retained in the WGD. We performed a BLAST search with the pep sequence of the retained WGD genes of tea plant, persimmon, and rhododendron, and the pep sequences of the genes in Supplementary Table S1 were used as the query.
Supplementary information
Acknowledgements
This research was supported by the national Natural Science Foundation of China (31972460 and 31801898). This research was supported by the earmarked fund for the China Agriculture Research System (CARS-19) and the key Research and Development Program of Jiangsu Province (BE2019379). This work was supported by the high-performance computing platform of the Bioinformatics Center, Nanjing Agricultural University. F.C. is supported by a start-up fund (804012) from Nanjing Agricultural University and by the Fundamental Research Funds for the Central Universities (KYXJ202004).
Author contributions
W.F. and F.C. planned and designed the research. Y.W. and F.C. analyzed the data and wrote the manuscript. F.C. and W.F. approved the final version of the manuscript. Y.M., T.Z., P.S., M.L., and F.L. participated in analyzing the data.
Conflict of interest
The authors declare no competing interests.
Footnotes
These authors contributed equally: Ya Wang, Fei Chen
Contributor Information
Fei Chen, Email: feichen@njau.edu.cn.
Wanping Fang, Email: fangwp@njau.edu.cn.
Supplementary information
The online version contains supplementary material available at 10.1038/s41438-021-00613-z.
References
- 1.Mondal TK, Bhattacharya A, Laxmikumaran M, Ahuja PS. Recent advances of tea (Camellia sinensis) biotechnology. Plant Cell Tissue Organ Cult. 2004;76:195–254. doi: 10.1023/B:TICU.0000009254.87882.71. [DOI] [Google Scholar]
- 2.Chen F, et al. Genome sequences of horticultural plants: past, present, and future. Hortic. Res. 2019;6:112. doi: 10.1038/s41438-019-0195-6. [DOI] [PMC free article] [PubMed] [Google Scholar]
- 3.Chen F, et al. The sequenced angiosperm genomes and genome databases. Front. Plant Sci. 2018;9:418. doi: 10.3389/fpls.2018.00418. [DOI] [PMC free article] [PubMed] [Google Scholar]
- 4.Wei C, et al. Draft genome sequence of Camellia sinensis var. sinensis provides insights into the evolution of the tea genome and tea quality. Proc. Natl Acad. Sci. USA. 2018;115:E4151–E4158. doi: 10.1073/pnas.1719622115. [DOI] [PMC free article] [PubMed] [Google Scholar]
- 5.Chen J-D, et al. The chromosome-scale genome reveals the evolution and diversification after the recent tetraploidization event in tea plant. Hortic. Res. 2020;7:63. doi: 10.1038/s41438-020-0288-2. [DOI] [PMC free article] [PubMed] [Google Scholar]
- 6.Xia E, et al. The reference genome of tea plant and resequencing of 81 diverse accessions provide insights into its genome evolution and adaptation. Mol. Plant. 2020;13:1013–1026. doi: 10.1016/j.molp.2020.04.010. [DOI] [PubMed] [Google Scholar]
- 7.Zhang Q-J, et al. The chromosome-level reference genome of tea tree unveils recent bursts of non-autonomous LTR retrotransposons in driving genome size evolution. Mol. Plant. 2020;13:935–938. doi: 10.1016/j.molp.2020.04.009. [DOI] [PubMed] [Google Scholar]
- 8.Wang X, et al. Population sequencing enhances understanding of tea plant evolution. Nat. Commun. 2020;11:4447. doi: 10.1038/s41467-020-18228-8. [DOI] [PMC free article] [PubMed] [Google Scholar]
- 9.Zhang W, et al. Genome assembly of wild tea tree DASZ reveals pedigree and selection history of tea varieties. Nat. Commun. 2020;11:3719. doi: 10.1038/s41467-020-17498-6. [DOI] [PMC free article] [PubMed] [Google Scholar]
- 10.Xia EH, et al. The tea tree genome provides insights into tea flavor and independent evolution of caffeine biosynthesis. Mol. Plant. 2017;10:866–877. doi: 10.1016/j.molp.2017.04.002. [DOI] [PubMed] [Google Scholar]
- 11.Xia E-H, et al. Tea plant genomics: achievements, challenges and perspectives. Hortic. Res. 2020;7:7. doi: 10.1038/s41438-019-0225-4. [DOI] [PMC free article] [PubMed] [Google Scholar]
- 12.Jiang C-K, et al. Identification and distribution of a single nucleotide polymorphism responsible for the catechin content in tea plants. Hortic. Res. 2020;7:24. doi: 10.1038/s41438-020-0247-y. [DOI] [PMC free article] [PubMed] [Google Scholar]
- 13.Denoeud F, et al. The coffee genome provides insight into the convergent evolution of caffeine biosynthesis. Science. 2014;345:1181. doi: 10.1126/science.1255274. [DOI] [PubMed] [Google Scholar]
- 14.Guo L, et al. The opium poppy genome and morphinan production. Science. 2018;362:343–347. doi: 10.1126/science.aat4096. [DOI] [PubMed] [Google Scholar]
- 15.Van de Peer Y, Mizrachi E, Marchal K. The evolutionary significance of polyploidy. Nat. Rev. Genet. 2017;18:411–424. doi: 10.1038/nrg.2017.26. [DOI] [PubMed] [Google Scholar]
- 16.Zhang L, et al. The ancient wave of polyploidization events in flowering plants and their facilitated adaptation to environmental stress. Plant Cell Environ. 2020;43:2847–2856. doi: 10.1111/pce.13898. [DOI] [PubMed] [Google Scholar]
- 17.Wang JP, et al. Two likely auto-tetraploidization events shaped kiwifruit genome and contributed to establishment of the Actinidiaceae family. iScience. 2018;7:230–240. doi: 10.1016/j.isci.2018.08.003. [DOI] [PMC free article] [PubMed] [Google Scholar]
- 18.Bowers JE, Chapman BA, Rong J, Paterson AH. Unravelling angiosperm genome evolution by phylogenetic analysis of chromosomal duplication events. Nature. 2003;422:433–438. doi: 10.1038/nature01521. [DOI] [PubMed] [Google Scholar]
- 19.Wang X, Shi X, Hao B, Ge S, Luo J. Duplication and DNA segmental loss in the rice genome: implications for diploidization. N. Phytol. 2005;165:937–946. doi: 10.1111/j.1469-8137.2004.01293.x. [DOI] [PubMed] [Google Scholar]
- 20.Sankoff D, Zheng C, Zhu Q. The collapse of gene complement following whole genome duplication. BMC Genomics. 2010;11:313. doi: 10.1186/1471-2164-11-313. [DOI] [PMC free article] [PubMed] [Google Scholar]
- 21.Tiley GP, Ané C, Burleigh JG. Evaluating and characterizing ancient whole-genome duplications in plants with gene count data. Genome Biol. Evol. 2016;8:1023–1037. doi: 10.1093/gbe/evw058. [DOI] [PMC free article] [PubMed] [Google Scholar]
- 22.Zwaenepoel A, Van de Peer Y. Inference of ancient whole-genome duplications and the evolution of gene duplication and loss rates. Mol. Biol. Evol. 2019;36:1384–1404. doi: 10.1093/molbev/msz088. [DOI] [PubMed] [Google Scholar]
- 23.Sun, P. et al. WGDI: a user-friendly toolkit for evolutionary analyses of whole-genome duplications and ancestral karyotypes. Preprint at bioRxiv10.1101/2021.04.29.441969 (2021). [DOI] [PubMed]
- 24.Shi T, Huang H, Barker MS. Ancient genome duplications during the evolution of kiwifruit (Actinidia) and related Ericales. Ann. Bot. 2010;106:497–504. doi: 10.1093/aob/mcq129. [DOI] [PMC free article] [PubMed] [Google Scholar]
- 25.Yang FS, et al. Chromosome-level genome assembly of a parent species of widely cultivated azaleas. Nat. Commun. 2020;11:5269. doi: 10.1038/s41467-020-18771-4. [DOI] [PMC free article] [PubMed] [Google Scholar]
- 26.Zhang C, et al. Asterid phylogenomics/phylotranscriptomics uncover morphological evolutionary histories and support phylogenetic placement for numerous whole genome duplications. Mol. Biol. Evol. 2020;37:3188–3210. doi: 10.1093/molbev/msaa160. [DOI] [PubMed] [Google Scholar]
- 27.Jiao Y, et al. A genome triplication associated with early diversification of the core eudicots. Genome Biol. 2012;13:R3. doi: 10.1186/gb-2012-13-1-r3. [DOI] [PMC free article] [PubMed] [Google Scholar]
- 28.Wu H, et al. A high-quality Actinidia chinensis (kiwifruit) genome. Hortic. Res. 2019;6:117. doi: 10.1038/s41438-019-0202-y. [DOI] [PMC free article] [PubMed] [Google Scholar]
- 29.Zhang L, et al. The draft genome assembly of Rhododendron delavayi Franch. var. delavayi. Gigascience. 2017;6:1–11. doi: 10.1093/gigascience/gix076. [DOI] [PMC free article] [PubMed] [Google Scholar]
- 30.Soza VL, et al. The Rhododendron genome and chromosomal organization provide insight into shared whole-genome duplications across the heath family (Ericaceae) Genome Biol. Evol. 2019;11:3353–3371. doi: 10.1093/gbe/evz245. [DOI] [PMC free article] [PubMed] [Google Scholar]
- 31.Jaillon O, et al. The grapevine genome sequence suggests ancestral hexaploidization in major angiosperm phyla. Nature. 2007;449:463–467. doi: 10.1038/nature06148. [DOI] [PubMed] [Google Scholar]
- 32.Badouin H, et al. The sunflower genome provides insights into oil metabolism, flowering and Asterid evolution. Nature. 2017;546:148–152. doi: 10.1038/nature22380. [DOI] [PubMed] [Google Scholar]
- 33.Vanneste K, Maere S, Van de Peer Y. Tangled up in two: a burst of genome duplications at the end of the Cretaceous and the consequences for plant evolution. Phil. Trans. R. Soc. Lond. B Biol. Sci. 2014;369:20130353. doi: 10.1098/rstb.2013.0353. [DOI] [PMC free article] [PubMed] [Google Scholar]
- 34.Wan, X. & Xia, T. Secondary Metabolism of Tea Plant (Science, 2015).
- 35.Juneja LR, Chu DC, Okubo T, Nagato Y, Yokogoshi H. L-theanine - a unique amino acid of green tea and its relaxation effect in humans (vol 10, pg 199, 1999) Trends Food Sci. Technol. 1999;10:425–425. doi: 10.1016/S0924-2244(00)00031-5. [DOI] [Google Scholar]
- 36.Fang K, Jiang X, Wu H. Research progress on theanine metabolism and its content breeding in tea. Hortic. Plant J. 2016;43:1791–1802. [Google Scholar]
- 37.Fan F, Liang Y, Zheng X, Lu J. The physiological functions of caffeine and their related mechanisms. J. Tea Sci. 2009;30:235–242. [Google Scholar]
- 38.Perrois C, et al. Differential regulation of caffeine metabolism in Coffea arabica (Arabica) and Coffea canephora (Robusta) Planta. 2015;241:179–191. doi: 10.1007/s00425-014-2170-7. [DOI] [PMC free article] [PubMed] [Google Scholar]
- 39.Wang W, et al. Enantiomeric trimethylallantoin monomers, dimers, and trimethyltriuret: evidence for an alternative catabolic pathway of caffeine in tea plant. Org. Lett. 2019;21:5147–5151. doi: 10.1021/acs.orglett.9b01750. [DOI] [PubMed] [Google Scholar]
- 40.Macleod N, et al. The Cretaceous-Tertiary biotic transition. J. Geol. Soc. 1997;154:265. doi: 10.1144/gsjgs.154.2.0265. [DOI] [Google Scholar]
- 41.Fastovsky, D. E. & Sheehan, P. The extinction of the dinosaurs in North America. Gsa Today15, (2005).
- 42.Akagi T, et al. The persimmon genome reveals clues to the evolution of a lineage-specific sex determination system in plants. PLoS Genet. 2020;16:e1008566. doi: 10.1371/journal.pgen.1008566. [DOI] [PMC free article] [PubMed] [Google Scholar]
- 43.Yue J, et al. Kiwifruit Genome Database (KGD): a comprehensive resource for kiwifruit genomics. Hortic. Res. 2020;7:117. doi: 10.1038/s41438-020-0338-9. [DOI] [PMC free article] [PubMed] [Google Scholar]
- 44.Xia E-H, et al. Tea Plant Information Archive: a comprehensive genomics and bioinformatics platform for tea plant. Plant Biotechnol. J. 2019;17:1938–1953. doi: 10.1111/pbi.13111. [DOI] [PMC free article] [PubMed] [Google Scholar]
- 45.Singh J. FigShare. J. Pharm. Pharmacother. 2011;2:138–139. doi: 10.4103/0976-500X.81919. [DOI] [PMC free article] [PubMed] [Google Scholar]
- 46.Goodstein DM, et al. Phytozome: a comparative platform for green plant genomics. Nucleic Acids Res. 2012;40:D1178–D1186. doi: 10.1093/nar/gkr944. [DOI] [PMC free article] [PubMed] [Google Scholar]
- 47.Dereeper A, et al. The coffee genome hub: a resource for coffee genomes. Nucleic Acids Res. 2015;43:D1028–D1035. doi: 10.1093/nar/gku1108. [DOI] [PMC free article] [PubMed] [Google Scholar]
- 48.Wang Y, et al. MCScanX: a toolkit for detection and evolutionary analysis of gene synteny and collinearity. Nucleic Acids Res. 2012;40:e49–e49. doi: 10.1093/nar/gkr1293. [DOI] [PMC free article] [PubMed] [Google Scholar]
- 49.Qiao X, et al. Gene duplication and evolution in recurring polyploidization-diploidization cycles in plants. Genome Biol. 2019;20:38. doi: 10.1186/s13059-019-1650-2. [DOI] [PMC free article] [PubMed] [Google Scholar]
- 50.Zhang Z, et al. KaKs_Calculator: calculating Ka and Ks through model selection and model averaging. Genomics Proteomics Bioinformatics. 2006;4:259–263. doi: 10.1016/S1672-0229(07)60007-2. [DOI] [PMC free article] [PubMed] [Google Scholar]
- 51.Katoh K, Standley DM. MAFFT multiple sequence alignment software version 7: improvements in performance and usability. Mol. Biol. Evol. 2013;30:772–780. doi: 10.1093/molbev/mst010. [DOI] [PMC free article] [PubMed] [Google Scholar]
- 52.Price MN, Dehal PS, Arkin AP. FastTree: computing large minimum evolution trees with profiles instead of a distance matrix. Mol. Biol. Evol. 2009;26:1641–1650. doi: 10.1093/molbev/msp077. [DOI] [PMC free article] [PubMed] [Google Scholar]
- 53.Stecher G, Tamura K, Kumar S. Molecular Evolutionary Genetics Analysis (MEGA) for macOS. Mol. Biol. Evol. 2020;37:1237–1239. doi: 10.1093/molbev/msz312. [DOI] [PMC free article] [PubMed] [Google Scholar]
- 54.Chen S, Zhou Y, Chen Y, Gu J. fastp: an ultra-fast all-in-one FASTQ preprocessor. Bioinformatics. 2018;34:i884–i890. doi: 10.1093/bioinformatics/bty560. [DOI] [PMC free article] [PubMed] [Google Scholar]
- 55.Dobin A, et al. STAR: ultrafast universal RNA-seq aligner. Bioinformatics. 2013;29:15–21. doi: 10.1093/bioinformatics/bts635. [DOI] [PMC free article] [PubMed] [Google Scholar]
- 56.Li B, Dewey CN. RSEM: accurate transcript quantification from RNA-Seq data with or without a reference genome. BMC Bioinformatics. 2011;12:323. doi: 10.1186/1471-2105-12-323. [DOI] [PMC free article] [PubMed] [Google Scholar]
- 57.Tian T, et al. agriGO v2.0: a GO analysis toolkit for the agricultural community, 2017 update. Nucleic Acids Res. 2017;45:W122–W129. doi: 10.1093/nar/gkx382. [DOI] [PMC free article] [PubMed] [Google Scholar]
Associated Data
This section collects any data citations, data availability statements, or supplementary materials included in this article.


