Abstract
We have recently demonstrated the role of the Fyn-PKCδ signaling pathway in status epilepticus (SE)-induced neuroinflammation and epileptogenesis in experimental models of temporal lobe epilepsy (TLE). In this study, we show a significant disease-modifying effect and the mechanisms of a Fyn/Src tyrosine kinase inhibitor, saracatinib (SAR, also known as AZD0530), in the rat kainate (KA) model of TLE. SAR treatment for a week, starting the first dose (25 mg/kg, oral) 4 h after the onset of SE, significantly reduced spontaneously recurring seizures and epileptiform spikes during the four months of continuous video-EEG monitoring. Immunohistochemistry of brain sections and Western blot analyses of hippocampal lysates at 8-day (8d) and 4-month post-SE revealed a significant reduction of SE-induced astrogliosis, microgliosis, neurodegeneration, phosphorylated Fyn/Src-419 and PKCδ-tyr311, in SAR-treated group when compared with the vehicle control. We also found the suppression of nitroxidative stress markers such as iNOS, 3-NT, 4-HNE, and gp91phox in the hippocampus, and nitrite and ROS levels in the serum of the SAR-treated group at 8d post-SE. The qRT-PCR (hippocampus) and ELISA (serum) revealed a significant reduction of key proinflammatory cytokines TNFα and IL-1β mRNA in the hippocampus and their protein levels in serum, in addition to IL-6 and IL-12, in the SAR-treated group at 8d in contrast to the vehicle-treated group. These findings suggest that SAR targets some of the key biomarkers of epileptogenesis and modulates neuroinflammatory and nitroxidative pathways that mediate the development of epilepsy. Therefore, SAR can be developed as a potential disease-modifying agent to prevent the development and progression of TLE.
Keywords: Fyn/Src tyrosine kinase, Epileptogenesis, Nitroxidative stress, Neuroinflammation, Proinflammatory cytokines, Spontaneous seizures, Protein kinase C delta, NADPH oxidase 2
1. Introduction
The role of a non-receptor Src/Fyn tyrosine kinase in neuroinflammation and neuronal hyperexcitability is emerging as a new mechanistic target for the development of drugs for epilepsy and Alzheimer’s disease (Nygaard et al., 2014; Sharma et al., 2018a; Smith et al., 2017). We have recently shown that Fyn, protein kinase C delta (PKCδ), NADPH oxidase 2 (NOX2), and inducible nitric oxide synthase (iNOS) were upregulated during epileptogenesis (Putra et al., 2019; Putra et al., 2020b; Sharma et al., 2018a), and in a Parkinson’s disease model (Gordon et al., 2016; Panicker et al., 2015). The Fyn-PKCδ-NOX2-iNOS signaling is a novel pathway in epilepsy. We observed a significant upregulation of Fyn, PKCδ, and gp91phox (a NOX2 subunit) in microglia in both early and late stages of epileptogenesis (Sharma et al., 2018a). The activated Fyn phosphorylates PKCδ, which in turn phosphorylates cytosolic p47phox to form a functional NOX2 complex with gp91phox. This drives the production of reactive oxygen/nitrogen species (ROS/RNS), activates NFkB, and facilitates the transcription of proinflammatory cytokines/chemokines to cause neuronal hyperexcitability (Anrather et al., 2006; Bey et al., 2004; Langley et al., 2017). Interestingly, NFkB also transcriptionally regulates PKCδ and gp91phox (Anrather et al., 2006; Gordon et al., 2016) implying that it can be a self-perpetuating neuroinflammatory signaling pathway, which could potentially exacerbate seizures (Gage and Thippeswamy, 2021; Vezzani et al., 2011). Recently, we demonstrated increased hyperphosphorylated Tau and phosphorylated Src/Fyn and Fyn-tau interaction, using the Proximity Ligation Assay, in neurons at 24 h post-seizure in a mouse model (Putra et al., 2020b).
The activated Fyn-PKCδ signaling drives the production of ROS/RNS and facilitates NFkB activation in microglia, astrocytes, and neurons (Cai et al., 2017; Higai et al., 2008; Langley et al., 2017; Panicker et al., 2015) and in human monocytes (Bey et al., 2004). Reactive glia and brain-infiltrated monocytes/macrophages produce proinflammatory cytokines and iNOS, which also occur in response to seizures (Pearson et al., 2015; Putra et al., 2019; Vezzani et al., 2011). In our studies from the mouse and rat models of TLE, we observed a significant increase in ROS and RNS, and a concomitant increase in neuroinflammation (reactive gliosis) and neurodegeneration in the hippocampus, hyperexcitability of neurons (evident from increased epileptiform spikes), and SRS (Cosgrave et al., 2008; Putra et al., 2020a; Puttachary et al., 2016a; Sharma et al., 2018a). We, therefore, hypothesized that the activated Fyn/Src signaling in glia and neurons drive neuroinflammation and neurodegeneration to promote epileptogenesis, and disabling the Fyn/Src function soon after SE will modify/prevent the onset of epilepsy. We tested the hypothesis in a rat kainate (KA) model of TLE using a selective and potent Fyn/Src tyrosine kinase inhibitor, saracatinib (SAR; also known as AZD0530). SAR clinical tolerability and oral bioavailability have been demonstrated in phase IIa clinical trials for Alzheimer’s disease (AD), breast cancer, and bone cancer patients (Gucalp et al., 2011; Hochhaus et al., 2014). We have also demonstrated its anti-seizure effect in a mouse model (Sharma et al., 2018a).
The key biomarkers of epileptogenesis such as gliosis, neurodegeneration, nitroxidative stressors (ROS/RNS), and proinflammatory cytokines are well-characterized parameters in experimental models of TLE. Of the several models of TLE, KA and pilocarpine rat models are most commonly used for both mechanistic and translational studies due to their reliability in the onset of progressive epilepsy and reproducible epileptogenic biomarkers. Continuous, integrated, remote video-EEG monitoring of epileptogenesis is an unbiased technological approach to determine the time-dependent onset of epilepsy, its progression, and useful to investigate the efficacy of interventional drugs in epilepsy. In this study, we used long-term telemetry and measured the epileptogenic biomarkers to investigate the disease-modifying effects of SAR in the rat KA model of TLE.
2. Methods
2.1. Animal source and ethics statement
We used adult male Sprague Dawley rats (8 weeks old) from Charles River Laboratory (MA, USA) in this study. Animals were maintained at the Laboratory of Animal Resources, Iowa State University under controlled environmental conditions (19 °C–23 °C, 12 h light: 12 h dark), with ad libitum access to food and water. All experiments were carried out as per protocol approved by the Institutional Animal Care and Use Committee, Iowa State University (IACUC 18–059/060). For telemetry animals, surgery was performed in an aseptic condition under general anesthesia. All efforts were made to minimize pain and discomfort to animals throughout the experiment. At the end of the study, all animals were euthanized with pentobarbital sodium (100 mg/kg, i.p.).
2.2. Chemicals and reagents
Kainate (KA) was purchased from Tocris Bioscience (USA). Saracatinib (SAR) was kindly supplied by AstraZeneca (USA/UK) under Open Innovation program and also purchased from Selleck Chemicals (USA). KA was prepared fresh in sterile water at 2 mg/mL. SAR was prepared in a sterile vehicle containing 0.5% hydroxypropyl methylcellulose in 0.1% Tween80 (HPMC) at 5–10 mg/mL. Antibodies were purchased from different sources: glial fibrillary acidic protein (GFAP, a marker for astrocytes, mouse and rabbit mono/polyclonal, 1:400) from Sigma and Novus Biologicals, USA; ionized calcium-binding adaptor molecule 1 (IBA1, a marker for microglia, goat polyclonal, 1:400), 3-nitrotyrosine (3-NT, mouse monoclonal, 1:1400), 4-hydroxynonenal (4-HNE), and glycosylated glycoprotein (gp91phox, rabbit polyclonal, 1:1000) from Abcam, USA; Fyn (mouse monoclonal, 1:200 for IHC and 1:800 for WB), protein kinase C delta (PKCδ, rabbit polyclonal, 1:300 for IHC and 1:1000 for WB), phosphorylated PKCδ (pPKCδ-Ty311, goat polyclonal, 1:1000) were all from Santa Cruz Biotechnology, USA; neuronal nuclei marker (NeuN, rabbit polyclonal, 1:500) and phosphorylated Src/Fyn specific antibody (pSrc-416, rabbit monoclonal, 1:1000) were from Millipore and Cell Signaling, USA; Fluoro-Jade B was purchased from Histochem Inc., USA. All secondary antibodies for IHC (CY3 conjugated 1:200, FITC conjugated 1:80, biotinylated 1:500) and WB (IRDye 680LT and 800CW) were purchased from Jackson ImmunoResearch and LI-COR Biosciences, USA. All neutralizing antibodies were purchased from the same companies as the primary antibodies. The antibody dilution and sample preparation for IHC, WB, and qRT-PCR were done as described in our previous publication (Sharma et al., 2018a). We used an ELISA kit (ThermoFisher Scientific, USA) to determine IL-1β, IL-6, IL-12, and TNFα levels in serum as instructed in the manufacturer’s manual. Griess assay kit for nitrite (03553) was purchased from Sigma-Aldrich, and ROS/RNS (STA-347) assay kits were from Cell Biolabs, USA.
2.3. Experimental groups, sample size, and drug treatment
We used a total of 92 rats in this study, which included three experimental groups- naïve control, KA+ vehicle, and KA+ SAR, and two time points- 8 day (8d post-SE/KA) and 4-month (4 m post-SE/KA). Twenty age-matched rats were used as naïve controls (n = 10/time point; 5 each for IHC and WB). We used 40 rats for Western blotting and other assays (n = 10 each for vehicle and SAR/time-point) and 16 rats for IHC in 8d groups (n = 8). The remainder of 16 rats were implanted with a telemetry device to acquire video-EEG for 4 months, and the brains from the same rats were used for IHC (n = 8 each for vehicle and SAR). The animals were randomized and coded to blind the experimental groups. Telemetry groups were used for the KA challenge 10 days post-surgery. Repeated low dose KA (5 mg/kg, i.p. at 30 min intervals) protocol was followed to induce fairly reliable and consistent severity of status epilepticus (SE) in all animals as described previously (Puttachary et al., 2016b). KA dosing was stopped after animals showed the first convulsive seizure (CS). Two hours after the onset of first CS, diazepam (5 mg/kg, i.m) was administered. During the 2 h of SE, animals had both convulsive and non-convulsive seizures (NCS), which were scored based on the modified Racine scale as described previously (Sharma et al., 2018a; Puttachary et al., 2015; Puttachary et al., 2016b). The duration of all CS during the 2 h SE was considered to determine the initial severity of SE. All animals received 1 mL of Ringer’s lactate solution (s.c.) twice daily for the first three days post-SE to minimize weight loss. At 2 h post-diazepam, one group received SAR (25 mg/kg, oral), and the other placebo control group received equal volume and doses of HPMC (hereafter referred to as vehicle) twice a day for the first three days followed by a single dose/day for the next four days. The dose of SAR chosen in this study was based on our previous study in the mouse and rat models and the in vivo studies from other laboratories (Hennequin et al., 2006; Green et al., 2009; Sharma et al., 2018a, 2018b). The rat equivalent dose of SAR (25 mg/kg) was estimated based on the range of doses tested in adult human clinical trials. The drug was well tolerated in human adults when administered in single doses up to 500 mg and in multiple once-daily doses up to 250 mg (Lockton et al., 2005). The length of SAR treatment was determined based on the average days of latent period for the onset of the first SRS, which is typically 5–7 days in the majority of the rats in our laboratory- based on continuous video-EEG study in the KA model (Puttachary et al., 2016a).
2.4. SE quantification to determine initial SE severity
All animals that received KA showed >40 min of CS. All the seizures, whether convulsive (stage ≥3) or non-convulsive (stage ≤2), were scored manually and verified the video recordings by two experimenters who were blinded to the experimental groups. Seizure staging/scoring was based on the modified Racine scale as described previously (Puttachary et al., 2015; Racine, 1972; Sharma et al., 2018a). Animals with NCS did not show significant locomotor behavior, but rather showed mild behavioral symptoms such as freezing or absence of mobility or staring (stage 1); hunched back posture with facial manual automatisms, and/or head nodding (stage 2). Animals with CS had significant locomotor behavioral phenotype such as rearing with continuous forelimb clonus (stage 3); repeated rearing and falling with continuous forelimb clonus (stage 4); and generalized tonic-clonic convulsions with lateral recumbence, jumping, and/or wild running (stage 5). Seizure severity i. e., initial SE severity, latency, and duration of CS were quantified for each animal as described previously (Puttachary et al., 2015; Tse et al., 2014; Sharma et al., 2018a). Animals were grouped for the vehicle or SAR treatment based on their initial SE severity such that both groups had animals with similar duration of CS during the 2 h period from the first CS and diazepam administration.
2.5. Electrodes and telemetry device implantation, and integrated video-EEG acquisition
The procedure for telemetry device implantation (CTA-F40, Data Science International) and EEG monitoring have been described in our previous publications (Putra et al., 2019; Putra et al., 2020a; Puttachary et al., 2016a; Sharma et al., 2018a). The telemetry device has two channels (bipolar) consisting of two twisted wires (coiled bifilar) in each lead. Each of the two electrode leads is a high-performance nickel cobalt alloy as in medical implants. The two leads are independent from each other and not twisted. The advantages of wireless telemetry are; minimal signal-to-noise ratio, allows continuous (24 h and 7 days a week) recording for up to 6 months (battery life) without need for handling animals for connecting the electrodes each time for recording as in traditional tethered systems, minimal discomfort to animals since the device is implanted subcutaneously, and the closed wounds without external wires sticking out. Briefly, rats were anesthetized with gaseous isoflurane (4% induction and maintained at 1.5–2.0%) at the flow rate of 1 L/min O2. Eye ointment was applied to prevent dryness and analgesic Buprenex (0.3 mg/kg, s.c.) was administered before surgery. A middorsal incision was made on the head to expose the skull. The connective tissue was removed and the frontalis muscle was scrapped off the bone and holes were made in the skull (2.5 mm caudal to bregma and 2 mm lateral to the midline). A subcutaneous pocket was created along the spine and flank regions to place the transmitter device and insulated wires. The electrode terminals were inserted through the holes above the dura mater on both hemispheres. The wires were secured using acrylic dental cement, and the incision site was closed with sterile surgical clips. Post-surgical care includes administration of dextrose normal saline, and application of triple antibiotic ointment on the wound, and an antibiotic Baytril (5 mg/kg, s.c.). After surgery, animals were individually housed and cages were placed on the PhysioTel receiver pads connected to the data matrix to acquire integrated video-EEG, body temperature, and activity counts (Dataquest A.R.T. system, Data Science International, USA).
2.6. Quantification of epileptiform spikes and spontaneously recurring seizures (SRS)
All the epileptiform spikes, including spike clusters and interictal spikes, CS, and NCS were quantified based on the spike characteristics and spike frequency using the NeuroScore 3.2.0 as described in our previous publications (Puttachary et al., 2015 and Puttachary et al., 2016b; Sharma et al., 2018a; Tse et al., 2014). Briefly, all high amplitude spikes post-KA were normalized against the baseline EEG that was recorded for 10 days before SE induction. All the spikes that had amplitude twice the baseline spikes were considered epileptiform spikes. Electric and behavior artifacts were detected and excluded from the analysis (Puttachary et al., 2015; Puttachary et al., 2016b). After filtering the artifacts, the raw EEG signal was divided into 10-s epochs and subjected to Fast-Fourier Transformation (FFT) to generate powerbands. The powerbands include 0–80 Hz corresponding to delta (0–4 Hz, δ), theta (4–8 Hz, θ), alpha (8–12 Hz, α), sigma (12–16 Hz, Σ), beta (16–24 Hz, β) and gamma (24–80 Hz, γ). The power spectrum varies with the types of spikes and seizures- the transition from interictal spiking to clusters, and to NCS to CS. Spike clusters with a duration of <8 s had spikes of varying amplitudes, whereas, CS and NCS had a longer duration (>10 s). Spike clusters, interictal spikes, spikes in CS and NCS were all quantified and represented as ‘spikes/min’ in the analysis. All CS identified on EEG were cross-verified with the synchronized video for the corresponding behavioral phenotype, changes in the power spectrum, and the locomotor activity counts (Puttachary et al., 2015b, Puttachary et al., 2016b; Tse et al., 2014). All the values were expressed as standard error means (SEM).
2.7. Immunohistochemistry, imaging, and cell quantification
All animals, including naïve controls, were euthanized at 8d and 4 months post-SE. For immunohistochemistry (IHC), the animals were transcardially perfuse-fixed with 4% paraformaldehyde (PFA) and from the rest of the animals, fresh brain samples were snap-frozen in liquid nitrogen for Western blot and qRT-PCR analyses. Blood was collected from all animals, isolated the serum, aliquoted, and stored at −80 °C for later use for cytokine and biochemical assays. For IHC, the brains were post-fixed in 4% PFA in 0.1 M PBS overnight. The following day, the samples were transferred to 30% sucrose and stored in the fridge until they sank to the bottom of the vial. For cryosectioning, brains were embedded in gelatin (type A) and the blocks were cryosectioned using CryoStar NX70 cryostat at 16 μm thickness for immunostaining. The brain section sampling, immunostaining, imaging, and cell quantification protocols are described in our previous publications (Putra et al., 2019; Putra et al., 2020a; Puttachary et al., 2016a; Puttachary et al., 2016b; Sharma et al., 2018a). Four sections per slide were collected on chrome-alum gelatin-coated slides in such a way that each section on a slide represents rostral, middle, and posterior hippocampal regions at about 480 μm between sections (Puttachary et al., 2016b). Slides were washed with 0.1 M PBS and incubated with 10% donkey serum for blocking non-specific binding. Sections were immunostained with specific primary antibodies of interest (for double/triple staining) and stored at 4 °C for 16–24 h. The following day, after washing with 0.1 M PBS, sections were incubated with appropriate secondary antibodies (biotinylated/fluorochrome-conjugated) followed by streptavidin CY3/FITC after several washes between steps. All sections were counterstained with DAPI to detect nuclei. To investigate the degree of neuronal damage in the hippocampus, sections were stained with FJB (Putra et al., 2019 and Putra et al., 2020a; Puttachary et al., 2016a and Puttachary et al., 2016b; Sharma et al., 2018a). Immunostained sections were imaged using Axiovert 200 M Zeiss fluorescence microscope equipped with Hamamatsu digital camera and analyzed using ImageJ from a known area (in square microns). The imaging and detailed cell quantification have been described in our previous publications (Putra et al., 2019; Sharma et al., 2018a).
2.8. Western blotting
Snap frozen hippocampi were lysed and protein concentration was estimated. For some experiments (Fyn and PKCδ), one-half of the hippocampus was used to separate nuclear and cytoplasmic fractions as per the manufacturer’s instructions (Thermo Fischer, catalog number 78833). The other half was used for whole tissue lysate to determine pSrc-416, pPKCδ-Tyr311, and nitroxidative stress markers. We used the standard protocol for protein separation on SDS-PAGE, membrane blotting, staining, and imaging as described in our recent publication (Sharma et al., 2018a; Putra et al., 2019) to identify the differential up-or down-regulation of various proteins in response to SE and mitigation by SAR. Briefly, hippocampal tissues were homogenized in RIPA buffer containing a 1% cocktail of phosphatase and protease inhibitors. The protein concentration in each sample was estimated using a Bradford assay kit (Biorad, USA; Cat# 5000006). For loading on the gel, equal amounts of protein (30 μg) were used from each sample, separated on 8–15% SDS-PAGE (depending on the molecular weight of the protein of interest), and ran at 100 V for 1–2 h at room temperature (RT). The proteins were transferred to a nitrocellulose membrane using a mini transfer blot unit at 4 °C overnight at 25 V. After washing with PBS-T, and blocking with fluorescent Western blot blocking buffer for an hour at RT, the membranes were probed with primary antibodies of interest overnight at 4 °C or at RT for 4 h. The following day, after couple of washes with PBS-T, membranes were incubated with IR-680 or IR-800 dyes (1:5000–1:10,000, Li-Cor), and analyzed using Odyssey IR imaging system and quantified using ImageJ software. The proteins identified in the whole-cell lysate were normalized against β-actin and the nuclear fractions against lamin-B.
2.9. Quantitative real-time PCR
For reverse transcription, RNA was extracted using the TRIzol chloroform method (ThermoFisher Scientific) as described previously (Sharma et al., 2018a). NanoDrop spectrophotometer was used to quantify RNA, and 1 μg of RNA was reversed transcribed to cDNA using High Capacity cDNA Reverse Transcription Kit (catalog # 4368814, Applied Biosystems, CA, USA). SYBR Green Mastermix with pre-validated qPCR primers was used to perform qRT-PCR for IL-1β, iNOS, and TNFα. The primers used were: iNOS (QT00122458), IL-1β (QT01048355), TNFα (QT00104006) and 18S (QT02448075). All reactions were performed in triplicate. The primers were purchased from QuantiTect Primer Assay (Qiagen) and the Mastermix from Agilent Technologies, USA. 18S rRNA was used as a housekeeping gene for all qRT-PCR experiments for normalization. The fold change in gene expression was determined by ΔΔCt (Ct is threshold value).
2.10. Elisa
Cytokine levels were estimated in the serum samples using rat ELISA kits from Thermo Fischer Scientific/Invitrogen/Life Technologies, USA. The kits used were IL-1β (Invitrogen BMS630), TNFα (Life Technologies IVGN ERA56RB), IL-6 (Life Technologies IVGN ERA31RB), and IL-12p70 (Invitrogen KRC0121). Briefly, 100 uL of 1× coating buffer and antibodies of interest were added to Nunc MaxiSorp 96 well plates and incubated for 16 h at 4 °C. The following day, contents were discarded and washed three times with 1× PBS in 0.1% tween 20 (PBS-T). 200 uL of 1× blocking buffer was added to the wells and the plates were incubated at RT for an hour. Recombinant standards and samples were then added in duplicates in serial dilutions (only for standards) as described in the manufacturer’s protocol. Standards and samples were incubated for 2 h at RT. After 3 washes with PBS-T, detection antibody was added and incubated for 1 h at RT followed by 3 washes. HRP-avidin was added and left in the dark for 30 min at RT. After 5 washes, 100 uL of 1× TMB was added to all the wells. After 15 min, 50 uL of 2 N H2SO4 was added to each well. Plates were immediately read at 450 nm using SpectraMax M2 Gemini Molecular Device Microplate Reader and the values were processed for statistical analysis.
2.11. Griess assay
Griess assay was used to detect nitrite levels in the serum. Briefly, 6 serial dilutions of 0.1 M sodium nitrite standard solution were made in triplicates to generate a standard curve. 50 uL of serum was added in triplicates followed by equal amounts of sulfanilamide solution to all the wells. The plates were incubated for 10 min in the dark at RT. Next, 50 uL of NED solution was added to the mixture and incubated for 10 min at RT in the dark. Plates were read at 540 nm using Synergy 2 Multi-mode Microplate Reader (BioTek Instruments, USA) and the averages were compared between the groups using ANOVA.
2.12. ROS assay
Reactive oxygen species (ROS) assay determines the presence of total free radicals in the sample. These include hydrogen peroxide, peroxyl radicals, nitric oxide, peroxynitrite anion, and other redox molecules. Dichlorodihydrofluorescein (DCFH)-DiOxy-Q is a ROS/RNS specific probe that undergoes quench priming in a priming reaction mix to form a non-fluorescent DCFH-DiOxy. This molecule is then stabilized to form a highly reactive DCFH. When samples are added to this solution, the ROS/RNS in samples oxidize the DCFH to give a fluorescent DCF which is measured in the assay. Briefly, standards, solutions, and samples were prepared fresh before the experiment. Serial dilutions of DCF and H2O2 standards were prepared as described in the manufacturer’s protocol. 50 uL of sample and H202 standard were added to the wells. Next, 50 uL of the 1× catalyst was added to each well and incubated for 5 min at RT. 100 uL of DCFH solution was prepared by mixing DCF-DiOxyQ stock with priming reagent and then diluting the mixture with a 1× stabilization solution. The stabilized DCFH solution was then added to the wells and incubated in the dark for 40 min. Plates were read at 480 nm excitation/530 nm emission using SpectraMax M2 Gemini Molecular Device Microplate Reader.
2.13. Statistical analyses
For statistical analyses, the Gaussian distribution of data was tested with the Shapiro-Wilk and Kolmogorov-Smirnov tests. Unpaired t-tests were used for parametric comparisons, and the Mann-Whitney U (MWU) test was used for unpaired non-parametric data. One-way repeated analysis of variance (ANOVA) was used for multiple comparisons of parametric data with Tukey’s post-hoc analysis. To analyze gliosis and neurodegeneration in different brain regions of the same animal, we used repeated measures (RM) two-way ANOVA (Figs. 5B–D, 7B–D, and 11B) with Tukey’s post-hoc test. For seizure severity and spike analysis, two-way ANOVA (or mixed-effects model) with the Geisser-Greenhouse correction was used for multiple comparisons with Sidak post-hoc test, which gives multiplicity adjusted p-value for each comparison. Each cell mean was compared with the other cell mean in that row representing a different time-point. Statistical significance was set to p < 0.05. Prism 8 (GraphPad Software, LLC) was used for data analysis.
Fig. 5.
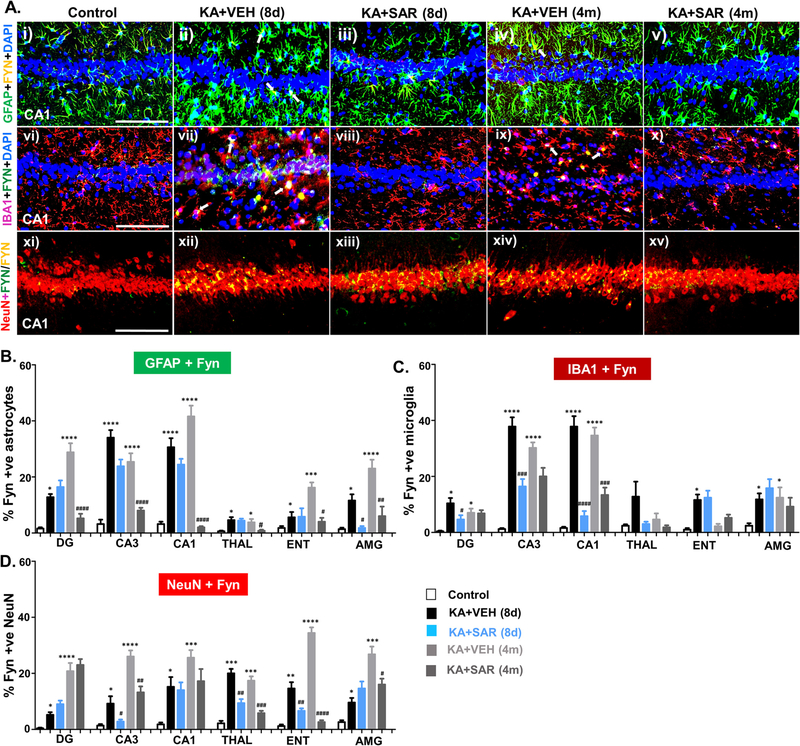
Fyn immunostaining in astrocytes, microglia, and neurons in different brain regions. IHC images of the hippocampus (CA1) is presented. Panels (i-v), Fyn (yellow) expression in GFAP positive astrocytes (green); panels (vi-x), Fyn in IBA1 positive microglia (red); and, panels (xi-xv) Fyn in NeuN positive neurons (red). A few examples of Fyn expression in reactive astrocytes (ii, iv) and reactive microglia (vii, ix) are shown with white arrows. (B-D) Quantification of Fyn positive reactive astrocytes (B), reactive microglia (C), and neurons (D) from the dentate gyrus (DG), CA3, CA1, thalamus (THAL), entorhinal cortex (ENT), and amygdala (AMY) at 8d and 4 m post-SE. *#p < 0.05, **##p < 0.01, ***###p < 0.001, ****p < 0.0001 repeated measures with two way ANOVA with Tukey post-hoc test; n = 5–7; scale, all 100 μm.
Fig. 7.
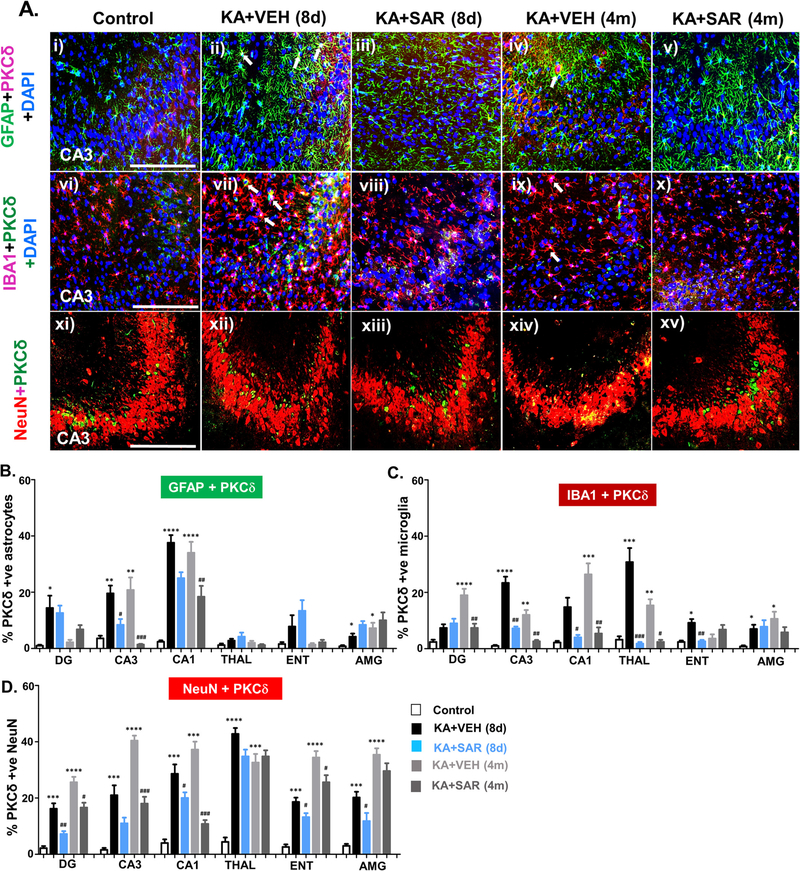
IHC images of the hippocampus (CA3) showing PKCδ expression in different cell types (A). PKCδ (i-xv) in GFAP positive astrocytes (green) in panels (i-v), in IBA1 positive microglia (red) in panels (vi-x), and in NeuN positive neurons (red) in panels (xi-xv) are shown. A few examples of PKCδ expression in reactive astrocytes (ii, iv) and reactive microglia (vii, ix) are shown with white arrows. (B-D) Cell quantification and comparison of PKCδ expression in reactive astrocytes (B), reactive microglia (C), and neurons (D) from the dentate gyrus (DG), CA3, CA1, thalamus (THAL), entorhinal cortex (ENT), and amygdala (AMY) at 8d and 4 m post-SE. n = 5–7 *#p < 0.05, **##p < 0.01, ***###p < 0.001, ****p < 0.0001, repeated measures with two-way ANOVA with Tukey’s post-hoc test; scale, all 100 μm.
Fig. 11.
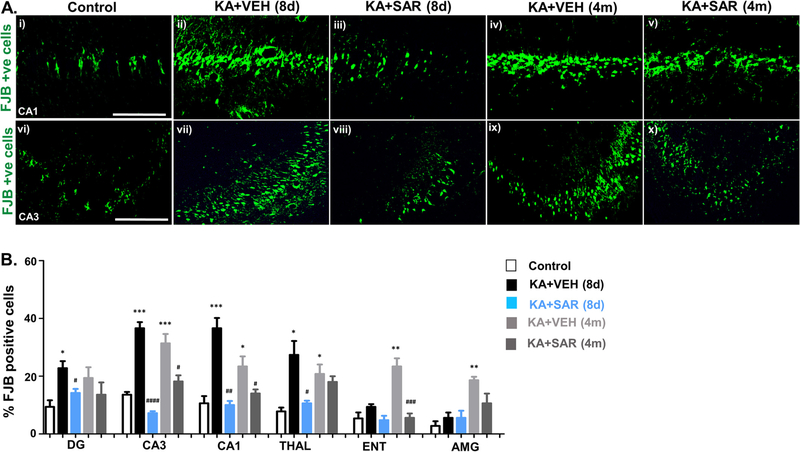
Neurodegeneration and rescue by SAR. (A) Representative brain sections stained for FJB (the hippocampus- CA1 and CA3 regions are shown). (B) FJB positive cell quantification from different brain regions are presented. DG, dentate gyrus; CA3 and CA1 are hippocampal regions; THAL, thalamus; ENT, entorhinal cortex; AMG, amygdala. n = 5–6. Repeated measures two way ANOVA with Tukey’s post-hoc test, *#p < 0.05, **##p < 0.01, ***###p < 0.001, ****####p < 0.0001; Scale, all 100 μm.
2.14. Experimental design and rigor
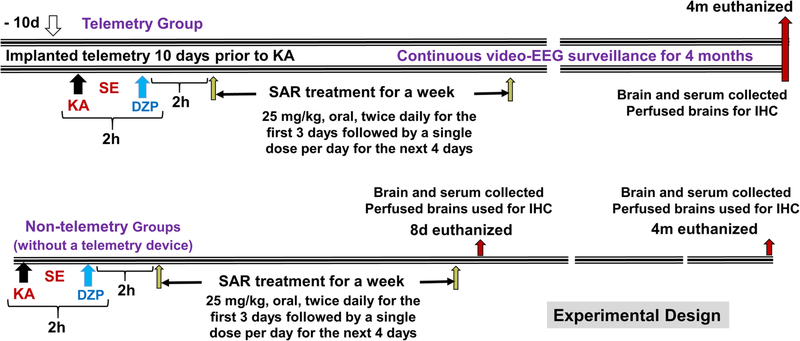
The experimental design is illustrated in Fig. 1. Animals were randomized and all experiments were blinded until the end of the analysis to minimize potential bias as per the NIH/NINDS guidelines. Animals that died or were euthanized before the endpoint of an experiment were excluded from the study as per pre-determined exclusion criteria. The total number of animals (92) reported in the study does not include the rats that were removed from the study. The group size was determined by a priori based power analyses, effect size, and variance from our previous rat KA model of TLE (Puttachary et al., 2016a; Sharma et al., 2018a). We took measures to minimize other variables and biases e.g., i) direct observation of SE and secondary video analysis by a different person who was blind to the protocol to determine the initial SE severity, and ii) all SRS were validated against the synchronized video, power spectrum, and activity counts as described previously (Puttachary et al., 2015). The animals were grouped based on similar SE severity, before the vehicle or drug treatment was initiated, to investigate the real effects of SAR on biomarkers of epileptogenesis.
Fig. 1.
Experimental design illustrating the telemetry and non-telemetry (without a telemetry device implants) groups, treatment regimen, and endpoints.
3. Results
3.1. Initial SE severity quantification and group comparison prior to the vehicle or SAR treatment
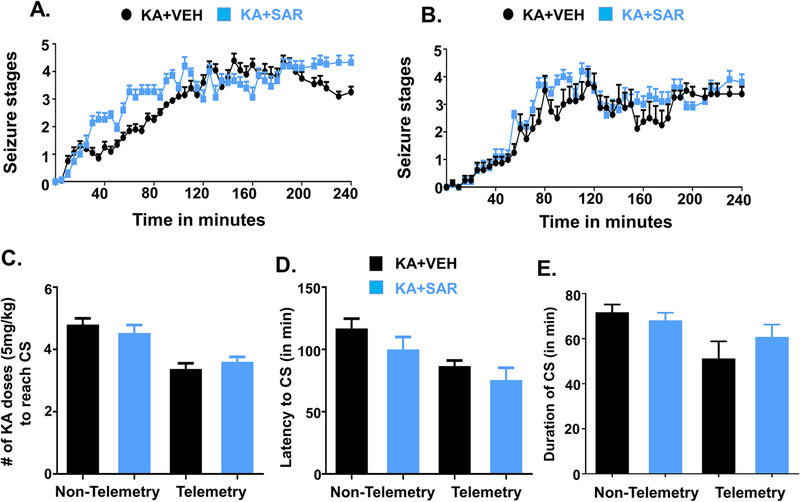
There were no significant differences in the initial SE severity between the animals used for the vehicle or drug treatment (Fig. 2A, B–E). To distinguish the animal groups in KA challenge experiments, hereafter, non-telemetry refers to those animals that were not implanted with a telemetry device. Non-telemetry rats required >20 mg/kg of KA (>4 doses, 5 mg/kg at 30 min intervals) to reach stage ≥3 seizures (convulsive seizures), while the telemetry implanted rats required <20 mg/kg of KA (Fig. 2C). However, there were no significant differences in latency to the onset of the first convulsive seizure (CS) or the duration of CS in the animals used for the vehicle or SAR treatment in the non-telemetry and telemetry groups (Fig. 2D, E). The repeated low-dose method of SE induction by KA reduced mortality rate (<8%) and increased the percent of rats (>90%) reaching SE for >50 min in all groups (Fig. 2E).
Fig. 2.
Initial SE severity group comparison (before the start of the treatment) between the vehicle and SAR treated groups in non-telemetry (A, n = 15–20) and telemetry (B, n = 8–10) groups. There were no significant differences in the initial SE severity, the amount of KA received to achieve CS (C), latency to CS (D), and the duration of CS between the groups (E). KA, kainate; CS, convulsive seizures. Note: Non-telemetry refers to those animals that were not implanted with a telemetry device- did not undergo surgery for electrode implantation.
3.2. SAR treatment significantly reduced SRS and epileptiform spikes
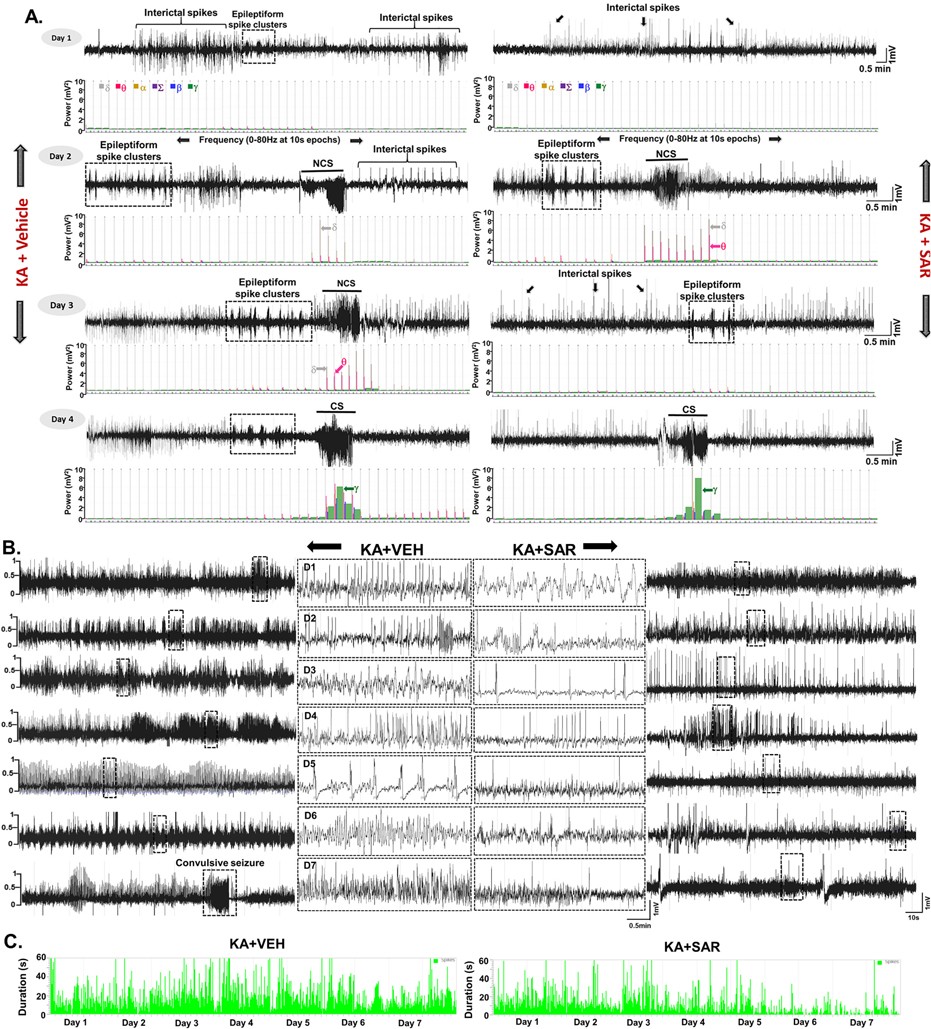
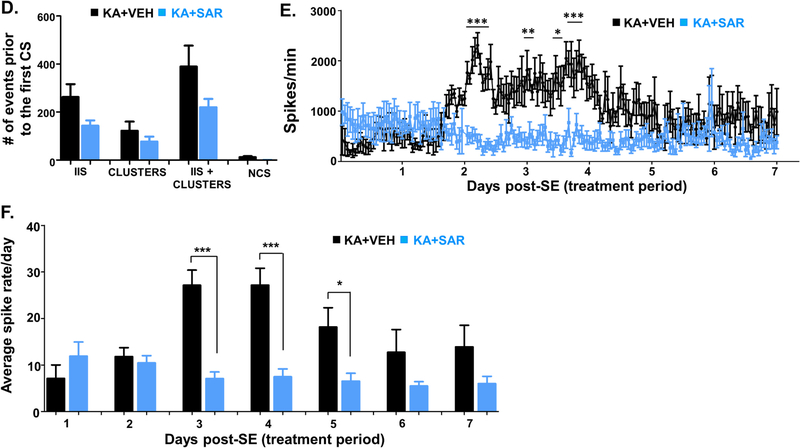
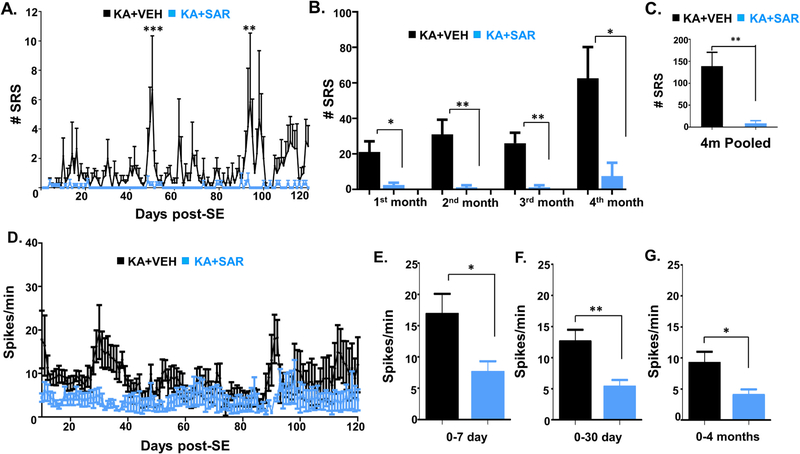
Continuous video-EEG recording from the rats treated with the vehicle or SAR for four months were analyzed for spontaneously recurring convulsive seizures (SRS) and epileptiform spike rate. All seizure episodes were manually verified against integrated/synchronized videos associated with the EEG traces. We also used power spectral patterns to confirm spike identity. Representative EEG traces from both vehicle and SAR-treated rats are illustrated in Fig. 3A and B. Several hours after SE, epileptiform events such as interictal discharges, spike clusters, and NCS were observed on EEG in both the vehicle and SAR-treated groups before the first CS episode (Fig. 3A). SAR significantly reduced the spike rate between 3 and 5 days (Fig. 3B–C, E–F), but it had no significant effect on the interictal spikes (IIS), spike cluster frequency, and non-convulsive seizures during the SAR treatment period (Fig. 3D–F). The frequency of CS in the vehicle group increased over time, and SAR treatment significantly suppressed the number and frequency of SRS over the 4 months (Fig. 4A–C). Further, high frequency epileptiform spikes were observed intermittently throughout the 4 months of recording in the vehicle group. In contrast, SAR treatment significantly suppressed epileptiform spikes (Fig. 4D–G) and prevented the onset of epilepsy in 4 out of 8 rats. All vehicle-treated rats developed epilepsy and had 142 ± 28 SRS.
Fig. 3.
Epileptiform spiking (interictal spikes-IIS), spike clusters, and non-convulsive seizure (NCS) pattern before the onset of the first convulsive seizure (CS) during the first week of drug treatment post-SE. Representative EEG traces from vehicle and SAR treated groups during the first week of the treatment are illustrated in panels A and B. Cumulative spikes and clusters pattern are represented in panel C. Quantitative IIS and NCS that occurred before the first CS are presented in panel D. Overall epileptiform spikes occurred during the first seven days of post-SE (period of SAR/vehicle treatment) were compared between the vehicle and SAR treated groups, and illustrated in panels E and F. n = 8, *p < 0.05, **p < 0.01, ***p < 0.001, RM two-way ANOVA with Sidak post-hoc test (Fig. E), and unpaired t-test (Fig. F).
Fig. 4.
SAR reduced the number of spontaneous recurrent seizures (SRS) and spike frequency during the 4 months. A-G) Results from the 4 months of continuous video-EEG studies showing spontaneous CS (A-C) and spike frequency (D-G) in the vehicle and SAR groups. Individual group and pooled data showed that SAR treatment significantly reduced the spike frequency (D-G) and the number of spontaneous CS (A-C). n = 8. A, *p < 0.05, **p < 0.01, ***p < 0.001. RM two-way ANOVA with Sidak post-hoc test (Fig. A, D), Mann-Whitney (Fig. B-C), and unpaired t-test (Fig. E-G).
3.3. SE-induced upregulation of Fyn/pSrc was mitigated by SAR
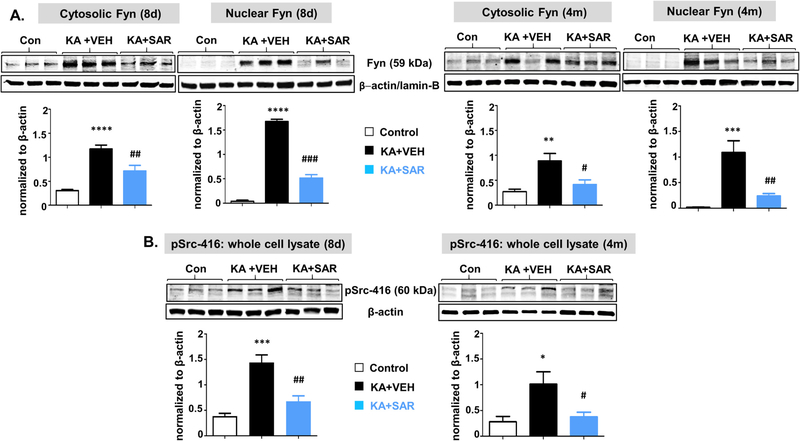
Both IHC and Western blots of the hippocampus from the SE-induced and vehicle-treated groups revealed a significant increase in Fyn (Figs. 5, 6A) and phosphorylated Src (a marker for phosphorylated Fyn) (Fig. 6B). A detailed IHC analysis of different brain regions using cell-specific markers for astrocytes, microglia, and neurons revealed an overall increase of Fyn in all three cell types at both 8d and 4 m post-SE (Fig. 5B; CA1 region is shown in Fig. 5A). We focused on the most affected brain regions in epilepsy such as the dentate gyrus, CA1, and CA3 hippocampus, the thalamus, the entorhinal cortex, and the amygdala. The quantification of differential expression of Fyn in microglia, astrocytes, and neurons at 8d and 4 m post-SE in different brain regions, in contrast to controls, and the impact of SAR treatment are presented in Fig. 5B–D.
Fig. 6.
The Western blot analysis of cytosolic and nuclear Fyn (A), and pSrc-416 from whole-cell extract (B) from the hippocampus at 8 days and 4 months post-SE from the vehicle and SAR treated groups. Higher levels of Fyn and pSrc were observed at both 8d and 4 m, and SAR treatment significantly reduced their levels. n = 5–7. *#p < 0.05, **##p < 0.01, ***###p < 0.001, ****p < 0.0001; One-way ANOVA with Tukey’s post-hoc test.
At 8-day post-SE, in the vehicle-treated group, Fyn was upregulated in astrocytes, microglia, and neurons in all brain regions investigated (Fig. 5A–D). SAR treatment significantly decreased microglial Fyn in the hippocampus (CA1 and CA3) and the dentate gyrus, astroglial Fyn in the amygdala, and neuronal Fyn in CA3, thalamus, and entorhinal cortex (Fig. 5B–D). In the vehicle, in contrast to SAR, Fyn staining in the nucleus was frequently observed in astrocytes and microglia, but not in neurons, suggesting that Fyn could translocate to the nucleus in response to SE-induced brain injury. Since quantification of nuclear staining is tedious, we did Western blotting for both nuclear and cytoplasmic extracts of the hippocampus, the most affected region in TLE. We observed a significant increase of both cytosolic and nuclear Fyn (Fig. 6A). The pSrc-416 was also upregulated in the whole-cell extract (Fig. 6B). We did not get enough signal for pSrc-416 when cytosolic and nuclear extracts were probed separately. SAR treatment significantly reduced both Fyn and pSrc-416 suggesting that the Fyn/Src inhibitor also regulates the Fyn transcription/translation and its phosphorylation.
At 4-month post-SE, the upregulated Fyn persisted in astrocytes in the vehicle group and significantly decreased in SAR group in all brain regions investigated (Fig. 5B). In IBA1 positive microglia, the Fyn upregulation also persisted in the dentate gyrus, CA1, CA3, and amygdala and SAR mitigated its upregulation in CA1 and CA3 only (Fig. 5C). The upregulated Fyn also persisted in neurons in all the brain regions investigated. SAR suppressed Fyn in neurons of CA3, thalamus, entorhinal cortex, and amygdala regions (Fig. 5D). The nuclear Fyn staining was also persisted in glial cells in the vehicle group, in contrast to SAR group. The Western blotting of both nuclear and cytoplasmic extracts from the hippocampus showed a significant increase of both cytosolic and nuclear Fyn (Fig. 6A). The pSrc-416 was also upregulated in whole cell extract (Fig. 6B). Both cytosolic and nuclear Fyn, and pSrc-416 were significantly reduced in the SAR-treated group (Fig. 6A, B).
3.4. SAR reduced SE-induced upregulation of PKCδ/pPKCδ-tyr311
Activated Fyn and ROS/RNS can increase the production and activation of PKCδ (Panicker et al., 2015). IHC of brain sections for PKCδ co-labeled with GFAP, IBA1, and NeuN revealed a significant upregulation in some brain regions at both 8d and 4 m post-SE (Fig. 7A, B).
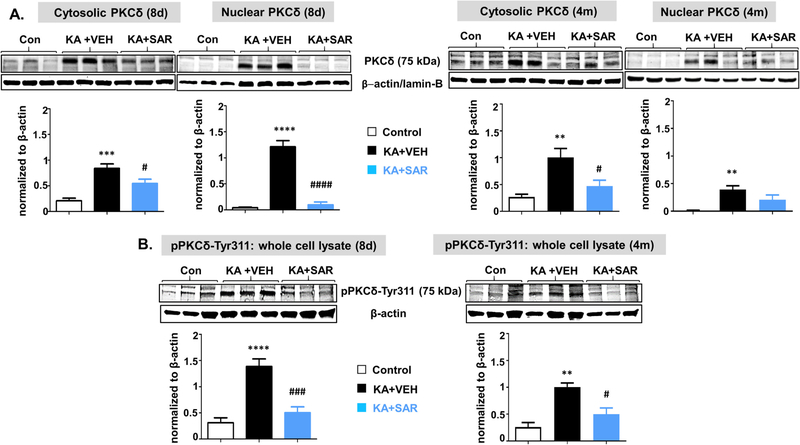
At 8-day post-SE, PKCδ was upregulated in microglia and neurons in all regions (Fig. 7C, D) while in astrocytes it did not change in the thalamus and entorhinal cortex (Fig. 7B). SAR treatment significantly reduced PKCδ in all three cell types in the hippocampus. However, in the dentate gyrus, SAR did not reduce astrocytic and microglial PKCδ (Fig. 7B, C). In both thalamus and entorhinal cortex, the increased microglial PKCδ was mitigated by SAR, while neuronal PKCδ was reduced in the entorhinal cortex but not thalamus (Fig. 7C). In the amygdala, SAR reduced neuronal but not glial PKCδ (Fig. 7B, C). Like Fyn, PKCδ staining was also observed in the nucleus of both astrocytes and microglia. The Western blot analysis of the hippocampus for PKCδ and pPKCδ-ty311 revealed a significant increase of both the markers, and SAR mitigated the effect (Fig. 8A, B). Both cytosolic and nuclear PKCδ and pPKCδ-ty311 were also significantly suppressed by SAR (Fig. 8B).
Fig. 8.
The Western blot analysis of cytosolic and nuclear PKCδ and phosphorylated PKCδ (whole cell) from the hippocampal tissues at 8 days and 4 months from the vehicle and SAR treated groups. The PKCδ was significantly upregulated in both cytosolic and nuclear fractions in the vehicle-treated groups at 8d at 4 months post-SE, and SAR treatment reduced both cytosolic and nuclear PKCδ levels at 8d but not at 4 m (A). Phosphorylated PKCδ levels in whole-cell lysates were significantly reduced in SAR treated groups at both 8d and 4 m (B). n = 5–6. #p < 0.05, **##p < 0.01, ***###p < 0.001, ****p < 0.0001, One-way ANOVA with Tukey’s post hoc test.
At 4-month post-SE, the upregulated astrocytic and microglial PKCδ persisted in CA1 and CA3 in the vehicle group and SAR mitigated the effect (Fig. 7B, C). In the dentate gyrus, the PKCδ upregulation observed at 8d in astrocytes did not persist at 4m post-SE. In contrast, there was significant increase of both microglial and neuronal PKCδ, and SAR treatment significantly mitigated the effect (Fig. 7B, C). In the thalamus and entorhinal cortex, astroglial PKCδ was not significantly altered (Fig. 7B). However, microglial PKCδ was unchanged in the entorhinal cortex but increased in the thalamus and SAR significantly reduced its expression (Fig. 7C). In amygdala, PKCδ was upregulated in both astrocytes and microglia but SAR had no effect (Fig. 7B, C). SE-induced neuronal PKCδ upregulation persisted in all brain regions, and SAR reduced the expression, except in the thalamus and amygdala (Fig. 7D). The nuclear PKCδ staining persisted in the nucleus of both astrocytes and microglia at 4 m post-SE. The Western blot analysis of the hippocampus revealed a persistent increase of both PKCδ and pPKCδ-ty311, and SAR mitigated their upregulation (Fig. 8A, B). The nuclear PKCδ though reduced in the SAR group at 4m the difference was not significant (Fig. 8A).
3.5. SAR treatment significantly reduced nitroxidative stress in the hippocampus and serum
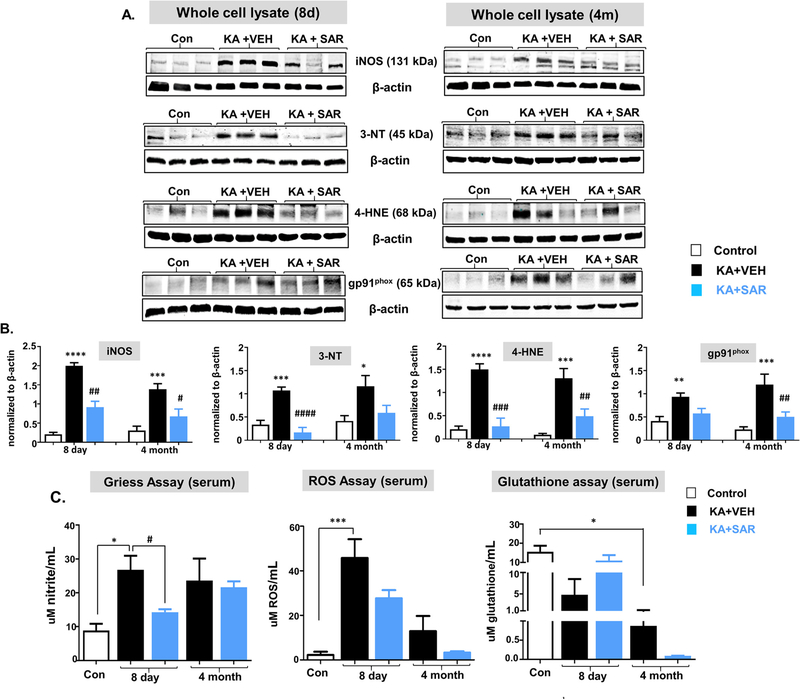
We used hippocampal lysates for the Western blot for the identification of nitroxidative stress markers such as iNOS, 3-NT, 4-HNE, and gp91phox, and the serum for nitrite and ROS assays. At both 8d and 4 m post-SE, all four nitroxidative biomarkers were significantly upregulated, in contrast to their respective controls, and SAR mitigated the increase (Fig. 9A, B). However, the reduction of 3-NT and gp91phox by SAR were not statistically significant (Fig. 9B). Serum nitrite and ROS levels were upregulated in the vehicle group at 8d and SAR significantly reduced the nitrite but the reduction of ROS was not significant (Fig. 9C). The increased nitrite levels persisted at 4 m in the vehicle group but SAR had no effect in the long-term. ROS levels were decreased in the long-term in both vehicle and SAR-treated groups (Fig. 9C). Glutathione levels in the serum were significantly reduced at 4 m but not at 8d post-SE in the vehicle group, and SAR treatment had no significant effect (Fig. 9C).
Fig. 9.
SAR suppressed SE-induced upregulation of hippocampal iNOS, 3-NT (except at 4 m), 4HNE, and gp91phox (A-B). SE-induced serum nitrite and ROS (C) upregulation were suppressed by SAR at 8d but there were no significant differences at 4 m post-SE. Glutathione levels in the serum were significantly suppressed at 4 m but not at 8d post-SE. SAR treatment did not reverse the trend at 4 m but at 8d, the glutathione levels were almost the same levels as the naïve control (C). n = 5–8; *#p < 0.05, **##p < 0.01, ***###p < 0.001, ****####p < 0.0001; One-way ANOVA with Tukey’s post hoc test.
3.6. SAR treatment significantly modulated proinflammatory cytokines in the hippocampus and serum
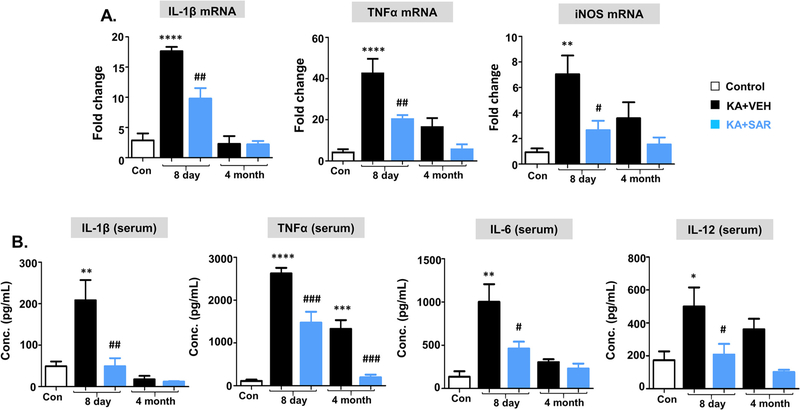
We used qRT-PCR for IL-1β, TNFα, and iNOS mRNA estimation in the hippocampus and ELISA for serum cytokine assay. At 8d post-SE, IL-1β, TNFα, and iNOS mRNA were upregulated in the hippocampus in the vehicle group and their expressions were significantly decreased in the SAR-treated group (Fig. 10A). At 4 m post-SE, there were no significant changes in IL-1β mRNA levels. Although TNFα and iNOS mRNA expression in the hippocampus were increased in the vehicle but reduced in SAR group, the differences were not statistically significant (Fig. 10A).
Fig. 10.
Proinflammatory cytokine profiles from the hippocampus (A, qRT-PCR) and serum (B, ELISA). At 8d post-SE, TNFα, IL-1β, and iNOS mRNAs were upregulated in the vehicle group, and SAR suppressed their levels. However, no significant differences were observed in their mRNA levels at 4 m post-SE. In serum, at 8d post-SE, TNFα, IL-1β, IL-6, and IL-12 were upregulated in the vehicle group, and SAR suppressed their levels. However, at 4 m, IL-1β and IL-6 levels were not altered in any groups but the increased TNFα and IL-12 levels were detected in the vehicle group with a significant reduction in the SAR group (B). n = 5–7; *#p < 0.05, **##p < 0.01, ***###p < 0.001, ****P < 0.0001; One-way ANOVA with Tukey’s post hoc test.
In the serum, at 8d post-SE, both IL-1β and TNFα levels were significantly altered in the vehicle and SAR groups (Fig. 10B). At 4 m post-SE, no changes were observed in the IL-1β but TNFα levels were significantly increased in the vehicle group and SAR mitigated (Fig. 10B). In addition to IL-1β and TNFα, we also measured IL-6 and IL-12 (or IL-12p70), the commonly detected cytokines in the serum of human epileptic patients. We found a significant increase in IL-6 and IL-12 at 8d post-SE, which was suppressed in the SAR group. However, at 4 m post-SE, no changes were observed in these cytokine levels (Fig. 10B).
3.7. SAR treatment significantly reduced SE-induced neurodegeneration
SE-induced Fyn/pSrc and PKCδ/pPKCδ-tyr311 upregulation and a concurrent increase in nitroxidative stress and proinflammatory cytokines can cause neurodegeneration. We used FJB staining to detect neurodegeneration in the brain. Representative images of FJB positive cells from CA1 and CA3 are presented in Fig. 11A. There was a significant increase of FJB positive cells in the dentate gyrus, CA1, CA3, and thalamus at both 8d and 4 m in the vehicle group compared to the control. FJB positive cells were significantly reduced in the SAR-treated group at 8d in all these regions, however, at 4 m, the reduction was not significant in the dentate gyrus and the thalamus (Fig. 11B). In the entorhinal cortex and amygdala, increased FJB positive cells were observed at 4 m and they were significantly reduced in the entorhinal cortex but not in the amygdala (Fig. 11B).
4. Discussion
In our previous studies in fyn gene knockout (KO) mice and the mice pre-treated with SAR, we demonstrated the role of Fyn in seizures in KA and PTZ models (Sharma et al., 2018a; Putra et al., 2020). In this study, we demonstrate the mechanisms of the disease-modifying effect of SAR in the rat KA model of chronic epilepsy when SAR was administered after the onset of SE.
SAR is a potent inhibitor of the Src family of tyrosine kinases (IC50 of 2.7–11 nM for Src and Fyn) with high selectivity over the other protein kinases involved in signal transduction (Green et al., 2009; Heusschen et al., 2016). SAR effectively inhibited Fyn/Src at submicromolar concentration in a variety of cellular assays of human tumor cell proliferation, and inhibited tumor growth in murine and rat allografts and xenografts at ~2 x IC50 in plasma when dosed orally (Green et al., 2009). We have tested the brain availability of the SAR in both mice and rats. The ion chromatogram showed the relative abundance of the SAR in the mouse hippocampus. The LC-MS analysis of the brain samples confirmed that the SAR was BBB permeable and it persisted in the hippocampus at higher levels at eight hours post-SE (Sharma et al., 2018a). In rats, the brain concentrations of SAR with or without seizure reached peak in 1 h (1.2 ± 0.034 ng/mg tissue) and persisted at 106 ± 23 pg/mg tissue even at 5 h of post-administration. The dose of SAR chosen in this study was based on our previous study in the mouse and rat models, which was estimated based on clinical trials in adult humans (Lockton et al., 2005; Sharma et al., 2018a). A recent study in the mouse model also used 25 mg/kg twice daily for the first three days but they extended the single dose/day regimen for 11 days in contrast to 4 days in our current study (Luo et al., 2021). However, systematic pharmacokinetics and toxicity studies are further needed in these models to determine the efficacy and off-target effects. Also, the advantages and disadvantages of the other Src kinase inhibitors should be considered while selecting a drug for in vivo studies (Gage and Thippeswamy, 2021). These studies suggest that SAR can be a potential CNS drug target for neurological diseases in which Fyn/Src tyrosine kinases are involved.
SAR has been tested in multiple clinical trials for safety and pharmacokinetics. Its clinical tolerability and oral bioavailability have been demonstrated in phase II clinical trials for AD, lymphangioleiomyomatosis (LAM), and other types of cancers (Baselga et al., 2010; deVries et al., 2009; Fujisaka et al., 2013; Nygaard et al., 2015). LAM is a tuberous sclerosis complex (TSC)-mTORopathy disorder characterized by seizures (Curatolo, 2014; Tyryshkin et al., 2014). We demonstrated that seizures increase Fyn/Src and phosphorylated Src (pSrc-416) levels in the mouse KA model (Sharma et al., 2018a), and in the present study in the rat hippocampus during epileptogenesis (8d post-SE) and in established epilepsy (4 m post-SE) (Fig. 6). To investigate the role of Fyn/Src kinase in ictogenesis (seizure onset), in our previous study, the mice were pre-treated with a single dose of SAR (25 mg/kg) at 4 h before the induction of seizure, which significantly suppressed the severity of SE when compared with the vehicle-treated mice (Sharma et al., 2018a). We also demonstrated the role of Fyn in ictogenesis using the fyn KO mouse model as an additional control to investigate the effect of Fyn inhibition on ictogenesis (Sharma et al., 2018a).
SAR pre-treatment and fyn KO approaches are not translational, but provided evidence for in vivo efficacy of SAR as an anti-seizure drug and confirmed the role of Fyn in ictogenesis. The experimental approaches that involve pre-treatment with a drug that has an anti-seizure property or knocking out of a gene that has a role in seizure onset can compromise the initial SE severity in response to chemoconvulsants and confound epileptogenesis (Sharma et al., 2018a). Therefore, we could not extrapolate the role of Fyn/Src in long-term brain pathogenesis in our previous mouse models (Sharma et al., 2018a). To address this important translational issue, we tested SAR in a well-characterized rat KA model of chronic epilepsy- four months continuous video-EEG study. We used the repeated low dose of KA method to achieve relative consistency in the initial SE severity and limit mortality (Puttachary et al. 2016; Sharma et al., 2018a; Tse et al., 2014). This approach also revealed that telemetry implanted animals require less amount of KA than the animals without telemetry (Sharma et al., 2018b). We also observed similar findings in the present study. In this study, SAR prevented epilepsy in some rats and significantly reduced epileptiform spiking and SRS in the others, confirming its anti-epileptogenic and disease-modifying effects. The Western blot analysis of the hippocampus at 8d and 4 m post-SE confirmed the suppression of Fyn/Src activation by SAR and its long-term washout effects (Fig. 6B). There are several advantages of SAR over the other FDA-approved Src kinase inhibitors for neurological diseases. Dasatinib (Sprycel) and imatinib (Gleevec) are FDA-approved ATP-competitive Src tyrosine kinase inhibitors for the treatment of certain cancers (Bettiol et al., 2018; Shah et al., 2015; Waller, 2018). However, these drugs failed in clinical trials for glioma due to poor BBB permeability. The ATP-binding cassette (ABC) efflux transporters, ABCG2 and ABCB1, at the BBB restrict brain penetration (Kast and Focosi, 2010; Mittapalli et al., 2016; Tyryshkin et al., 2014). Moreover, both drugs have wide off-targets, predominantly the cytosolic c-Abl, ephrin receptor kinases, PDGF receptors, and many others (Bettiol et al., 2018; Shah et al., 2015; Waller, 2018). In contrast, SAR has a > 10-fold preference for Fyn/Src over c-Abl (Lindauer and Hochhaus, 2014). SAR inhibits the ABCB1 transporter function (Liu et al., 2013), thus prevents the efflux of SAR and facilitates significant brain penetration. We detected 106 ± 23 pg of SAR/mg of the hippocampus at 5 h post-administration (25 mg/kg) in rats and 223.8 ± 22.01 fg at 8 h in mice. Neurons and glial cells express Fyn/Src and c-Abl kinases. However, unlike Fyn/Src, c-Abl does not effectively phosphorylate post-synaptic receptors (e.g., NR2B) to mediate hyperexcitability/neurotoxicity or modulate synaptic plasticity in vivo (Ba et al., 2014). Likewise, unlike the Fyn/Src, we did not find c-Abl activation in microglia in the seizure model (Sharma et al., 2018a). Furthermore, primary neuronal cultures co-treated with KA and SAR or dasatinib revealed that SAR prevented neurodegeneration and preserved neurites’ morphology better than dasatinib, suggesting that SAR is a better drug to promote synaptic plasticity, which is affected in many neurological diseases. In a recent study in the mouse pilocarpine epilepsy model, SAR treatment for two weeks rescued memory loss (Luo et al., 2021).
The majority of the current AEDs that are ineffective or do not cure drug-resistant acquired epilepsy are neurocentric ion-channel targeted drugs (Temkin, 2011; Varvel et al., 2015), suggesting the need for the development of novel drugs to target alternative pathways to cure/modify epilepsy. This is a significant gap in the treatment of epilepsy due to the poor understanding of the mechanisms of epileptogenesis. Considering the disease-modifying effects of SAR in this study, we further tested its mechanism of action, focusing on the Fyn-PKCδ signaling pathway and the effects of SAR on the hallmarks of epileptogenesis such as neuroinflammation (gliosis and proinflammatory cytokines), nitroxidative stress, and neurodegeneration at both early and late stages of the disease.
Neuroinflammation and neurodegeneration are emerging as new mechanistic targets for drug development for neurological disorders (Ba et al., 2014; French, 2016). SE-induced changes in the brain result in the proliferation and migration of glia (gliosis) and neurons (neurogenesis) to compensate for the neuronal loss (Beamer et al., 2012; Puttachary et al., 2016a, 2016b). Interestingly, both Src/Fyn and iNOS play significant roles in cell proliferation and migration via mTOR/TSC2 pathway (Hsieh et al., 2014; Lopez-Rivera et al., 2014; Maa et al., 2011; Tryshkin et al., 2010). Therefore, both are potential therapeutic targets in cancer and neurodegenerative disorders. Src/Fyn kinase phosphorylates iNOS (Ty1055), stabilizes its half-life, and facilitates inflammation and disease progression (Tryshkin et al., 2010). We observed a significant increase of both Fyn/pSrc and iNOS in response to seizures (Putra et al., 2019; Sharma et al., 2018a). The Src/Fyn-iNOS pathway mediates the migration of monocytes/macrophage and the production of proinflammatory cytokines (Hsieh et al., 2014; Maa et al., 2011), which are significant events that occur post-SE (Putra et al., 2019; Puttachary et al., 2016a; Varvel et al., 2015). Therefore, targeting Src/Fyn and iNOS at an early stage of the disease onset can provide substantial therapeutic advantage. Indeed, we demonstrated significant disease-modifying effects of an iNOS inhibitor, 1400W in the rat model of chronic epilepsy when it was administered 2 h post-diazepam as in this study with SAR (Puttachary et al., 2016a). Herein, we observed a significant suppression of Fyn, pSrc, pPKCδ, gp91phox, 4-HNE, iNOS, and 3-NT levels in the hippocampus in response to SAR treatment in the rat SE model induced by KA (Figs. 5–9) portentous the Fyn-PKCδ-iNOS-NOX2 interaction (illustrated in Fig. 12). The proinflammatory cytokines IL-1β, TNF-α, IL-6, and IL-12 are known to reduce seizure threshold by decreasing GABAA currents, the pathognomonic feature of epileptogenesis characterized by spontaneous recurrent seizures (SRS) (Roseti et al., 2015; Vezzani et al., 2011). In this study, these cytokines were modulated by SAR in both hippocampus and serum. Besides increased inflammation, the presence of interictal spikes on EEG, post-insult, has been considered a diagnostic biomarker for the onset of SRS and the development of epilepsy (Staley and Dudek, 2006; Staley et al., 2011). The loss of inhibitory neurons following an insult such as SE generate interictal spikes. Indeed, we have recently demonstrated a significant loss of parvalbumin positive neurons at 24 h post-seizures in a PTZ mouse model (Putra et al., 2020), and other studies have also shown a significant loss of interneurons post-SE and its consequences (Buckmaster and Schwartzkroin, 1995; Sloviter et al., 2006). It makes sense why we observed increased spikes prior to the onset of SRS in this study. In addition to spike counts, we also quantified spike trains with or without clusters, which may also contribute to epileptogenesis. However, we did not investigate the loss of interneuron populations or their rescue by SAR in this study.
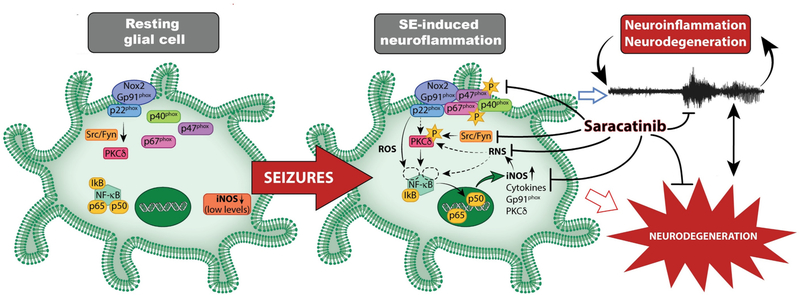
Fig. 12.
Summary of Fyn/Src-mediated epileptogenesis and mitigation by SAR. Seizures increase Fyn in glial cells and activate Src (pSrc) and PKCδ (pPKCδ), and increase ROS/RNS biomarkers (iNOS, gp91phox). Increased nitroxidative stress, pPKCδ, and NFkB activation increase pro-inflammatory cytokines and RNS/ROS-related gene expression. These processes can promote persistent and progressive neuroinflammation, neurodegeneration, and epileptogenesis. Our findings suggest that saracatinib treatment mitigates seizure-induced changes and modifies epileptogenesis. [Note: p40, p67, and p22 are NOX2 subunits. Starred ‘p’ represents phosphorylation. The role of neuronal Fyn/Src in epilepsy can be found in our recent review article (Gage and Thippeswamy, 2021)].
We had previously shown a concomitant increase of Fyn, pSrc-416, pPKCδ, iNOS, and gp91phox in the hippocampus (microglia) as early as 24 h post-SE in the mouse KA model (Sharma et al., 2018a). In the current study, we demonstrated the upregulation of aforementioned biomarkers of epileptogenesis at 8d post-SE and during established epilepsy at 4 months (Figs. 5–9). The activated Fyn/Src phosphorylates PKCδ, which enables the cytosolic p47phox to form a functional NOX2 complex with the membrane-associated gp91phox. Src also phosphorylates iNOS and stabilizes its half-life and drives the production of reactive ROS/RNS, activates NFkB, and facilitates the transcription of proinflammatory cytokines (Anrather et al., 2006; Tryshkin et al., 2010). As expected, we also observed a significant increase in ROS/RNS biomarkers and proinflammatory cytokines, reactive gliosis, and neurodegeneration in the vehicle-treated group but mitigated in the SAR treated groups (Figs. 6–11).
The regional variation in glial and neuronal responses to SE or SAR mitigation, in both short- and long-term, needs further investigation. For instance, in the thalamus, Fyn upregulation in astrocytes and microglia was not significant compared to other brain regions at both 8d and 4 m post-insult. In contrast, PKCδ immunopositive microglia, but not astrocytes, were significantly altered in the thalamus, and SAR treatment mitigated microglial PKCδ levels, without affecting astrocytic PKCδ. Interestingly, PKCδ in neurons and neurodegeneration were significantly increased in the thalamus. SAR did not reduce PKCδ upregulation in neurons, however it significantly prevented neurodegeneration at early time-point, but not at 4 months. These findings suggest that Fyn-independent PKCδ pathways, such as cyclin-dependent kinase 5 (CDK5), may mediate degenerative changes in neurons in the long-term in thalamus (perhaps in the other brain regions). CDK5 has been known to increase oxidative stress in neurons by inactivating an anti-oxidant enzyme, peroxiredoxin I and II (Sun et al., 2008). Recent findings from a rat KA model revealed the role of CDK5-p47phox (a cytosolic NOX2 subunit) pathway in neurodegeneration after SE induction (Kim and Kang, 2017). However, it is yet unknown whether such pathways are region-specific and persist for long term in response to SE. The other limitation of this study is that we did not investigate the subtle changes at “nuclei” levels within the thalamus or amygdala, and the impact of such changes on behavioral outcome in relation to TLE. For example, thalamic reticular nucleus (TRN)- having role in sensory gating and attention (exploratory behavior)- or motor/limbic nuclei- receives excitatory input from the hippocampus- therefore the changes in hippocampus could impact the GABAergic neurons in the TRN or the different cell types in the motor or limbic nuclei of the thalamus.
In conclusion, the findings from this study demonstrate the efficacy of SAR in mitigating or modifying epileptogenesis in the rat model of TLE when the drug was administered soon after controlling the severity of SE with a conventional AED. Mechanistically, SAR targets the hallmarks of epileptogenesis such as interictal spikes, reactive gliosis (neuroinflammation), ROS/RNS, key proinflammatory cytokines, and neurodegeneration to modify the development of epilepsy. A summary of the key molecular pathway of Fyn-mediated epileptogenesis and its mitigation by SAR is illustrated in Fig. 12 (Graphical abstract).
Supplementary Material
Acknowledgments
AstraZeneca supplied saracatinib (AZD0530) through the Open Innovation program. The schematic diagram (Fig. 12/Graphical abstract) was created by Mica Post and edited by Irah Dhaseleer, Medical Illustrator, Biomedical Sciences, College of Veterinary Medicine, Iowa State University. Ames, Iowa, USA 50011.
Funding source
This study is supported by the National Institute of Health/NINDS grant R21NS112779-01A1.
Footnotes
Conflict of interest statement
All authors have nothing to disclose and declare that there is no conflict of interest in this study.
Appendix A. Supplementary data
Supplementary data to this article can be found online at https://doi.org/10.1016/j.nbd.2021.105410.
References
- Anrather J, Racchumi G, Ladecola C, 2006. NF-kappaB regulates phagocytic NADPH oxidase by inducing the expression of gp91phox. Biol. Chem. 281, 5657–5667. 10.1074/jbc.M506172200. [DOI] [PubMed] [Google Scholar]
- Ba M, Kong M, Ma G, 2014. Postsynaptic density protein 95-regulated NR2B tyrosine phosphorylation and interactions of Fyn with NR2B in levodopa-induced dyskinesia rat models. Drug Des. Devel. Ther. 19, 199–206. 10.2147/DDDT.S75495. [DOI] [PMC free article] [PubMed] [Google Scholar]
- Baselga J, Cervantes A, Martinelli E, Chirivella I, Hoekman K, Hurwitz HI, Jodrell DI, Hamberg P, Casado E, Elvin P, Swaisland A, Iacona R, Tabernero J, 2010. Phase I safety, pharmacokinetics, and inhibition of SRC activity study of saracatinib in patients with solid tumors. Clin. Cancer Res. 16, 4876–4883. 10.1158/1078-0432.CCR-10-0748. [DOI] [PubMed] [Google Scholar]
- Beamer E, Otahal J, Sills GJ, Thippeswamy T, 2012. N (w) -propyl-L-arginine (L-NPA) reduces status epilepticus and early epileptogenic events in a mouse model of epilepsy: behavioural, EEG and immunohistochemical analyses. Eur. J. Neurosci. 36, 3194–3203. 10.1111/j.1460-9568.2012.08234.x. [DOI] [PubMed] [Google Scholar]
- Bettiol A, Marconi E, Lombardi N, Crescioli G, Gherlinzoni F, Walley T, Vannacci A, Chinellato A, Giusti P, 2018. Pattern of use and long-term safety of tyrosine kinase inhibitors: a decade of real-world management of chronic Myeloid Leukemia. Clin. Drug Investig. 38, 837–844. 10.1007/s40261-018-0676-7. [DOI] [PubMed] [Google Scholar]
- Bey EA, Xu B, Bhattacharjee A, Oldfield CM, Zhao X, Li Q, Subbulakshmi V, Feldman GM, Wientjes FB, Cathcart MK, 2004. Protein kinase C delta is required for p47phox phosphorylation and translocation in activated human monocytes. J. Immunol. 73, 5730–5738. 10.4049/jimmunol.173.9.5730. [DOI] [PubMed] [Google Scholar]
- Buckmaster PS, Schwartzkroin PA, 1995. Physiological and morphological heterogeneity of dentate gyrus-hilus interneurons in the gerbil hippocampus in vivo. Eur. J. Neurosci. 7, 1392–1402 (doi: 10.111/j.1460-9568.1995.tb01131). [DOI] [PubMed] [Google Scholar]
- Cai L, Stevenson J, Geng X, Peng C, Ji X, Xin R, Rastogi R, Sy C, Rafols JA, Ding Y, 2017. Combining normobaric oxygen with ethanol or hypothermia prevents brain damage from thromboembolic stroke via PKC-Akt-NOX modulation. Mol. Neurobiol. 54, 1263–1277. 10.1007/s12035-016-9695-7. [DOI] [PubMed] [Google Scholar]
- Cosgrave AS, McKay JS, Bubb V, Morris R, Quinn JP, Thippeswamy T, 2008. Regulation of activity-dependent neuroprotective protein (ADNP) by the NO-cGMP pathway in the hippocampus during kainic acid-induced seizure. Neurobiol. Dis. 30, 281–292. 10.1016/j.nbd.2008.02.005. [DOI] [PubMed] [Google Scholar]
- Curatolo P, 2014. Mechanistic target of rapamycin (mTOR) in tuberous sclerosis complex-associated epilepsy. Pediatr. Neurol. 52, 281–289. 10.1016/j.pediatrneurol.2014.10.028. [DOI] [PubMed] [Google Scholar]
- deVries TJ, Mullender MG, van Duin MA, Semeins CM, James N, Green TP, Everts V, Klein-Nuland J, 2009. The Src inhibitor AZD0530 reversibly inhibits the formation and activity of human osteoclasts. Mol. Cancer Res. 7, 476–488. 10.1158/1541-7786.MCR-08-0219. [DOI] [PubMed] [Google Scholar]
- French JA, 2016. Imaging brain inflammation: if we can see it, maybe we can treat it. Epilepsy Curr. 16, 24–26. 10.5698/1535-7597-16.1.24. [DOI] [PMC free article] [PubMed] [Google Scholar]
- Fujisaka Y, Onozawa Y, Kurata T, Yasui H, Goto I, Yamazaki K, Machida N, Watanabe J, Shimada H, Shi X, Boku N, 2013. First report of the safety, tolerability, and pharmacokinetics of the Src kinase inhibitor saracatinib (AZD0530) in Japanese patients with advanced solid tumours. Investig. New Drugs 31, 108–114. 10.1007/s10637-012-9809-7. [DOI] [PubMed] [Google Scholar]
- Gage M, Thippeswamy T, 2021. Inhibitors of Src family kinases, inducible nitric oxide synthase, and NADPH oxidase as potential CNS drug targets for neurological diseases. CNS Drugs. 35, 1–20. 10.1007/s40263-020-00787-5. [DOI] [PMC free article] [PubMed] [Google Scholar]
- Gordon R, Singh N, Lawana V, Ghosh A, Harischandra DS, Jin H, Hogan C, Sarkar S, Rokad D, Panicker N, Anantharam V, Kanthasamy AG, Kanthasamy A, 2016. Protein kinase Cδ upregulation in microglia drives neuroinflammatory responses and dopaminergic neurodegeneration in experimental models of Parkinson’s disease. Neurobiol. Dis. 93, 96–114. 10.1016/j.nbd.2016.04.008. [DOI] [PMC free article] [PubMed] [Google Scholar]
- Green TP, Fennell M, Whittaker R, Curwen J, Jacobs V, Allen J, Logie A, Hargreaves J, Hickinson DM, Wilkinson RW, Elvin P, Boyer B, Carragher N, Plé PA., Bermingham A., Holdgate GA., Ward WH., Hennequin LF., Davies BR., Costello GF., 2009. Preclinical anticancer activity of the potent, oral Src inhibitor AZD0530. Mol. Oncol. 3, 248–261. 10.1016/j.molonc.2009.01.002. [DOI] [PMC free article] [PubMed] [Google Scholar]
- Gucalp A, Sparano JA, Caravelli J, Santamauro J, Patil S, Abbruzzi A, Pellegrino C, Bromberg J, Dang C, Theodoulou M, Massague J, Norton L, Hudis C, Traina TA, 2011. Phase II trial of saracatinib (AZD0530), an oral SRC-inhibitor for the treatment of patients with hormone receptor-negative metastatic breast cancer. Clin. Breast Cancer. 11, 306–311. 10.1016/j.clbc.2011.03.021. [DOI] [PMC free article] [PubMed] [Google Scholar]
- Hennequin LF, et al. , 2006. N-(5-chloro-1,3-benzodioxol-4-yl)-7-[2-(4-methypiperazin 1-yl)ethoxy]-5-(tetrahydro-2H-pyran-4-yloxy)quinazolin-4-amine, a novel, highlyselective, orally available, dual-specific c-Src/Abl kinase inhibitor. J. Med. Chem. 49, 6465–6488. 10.1021/jm060434q. [DOI] [PubMed] [Google Scholar]
- Heusschen R, Muller J, Binsfeld M, Marty C, Plougonven E, Dubois S, Mahli N, Moermans K, Carmeliet G, Léonard A, Baron F, Beguin Y, Menu E, Cohen-Solal M, Caers J, 2016. May 24. SRC kinase inhibition with saracatinib limits the development of osteolytic bone disease in multiple myeloma. Oncotarget 7 (21), 30712–30729. 10.18632/oncotarget.8750. [DOI] [PMC free article] [PubMed] [Google Scholar]
- Higai K, Satake M, Nishioka H, Azuma Y, Matsumoto K, 2008. Glycated human serum albumin enhances macrophage inflammatory protein-1beta mRNA expression through protein kinase C-delta and NADPH oxidase in macrophage-like differentiated U937 cells. Biochim. Biophys. Acta 1780, 307–314. 10.1016/j.bbagen.2007.11.010. [DOI] [PubMed] [Google Scholar]
- Hsieh MY, Chang MY, Chen YJ, Li YK, Chuang TH, Yu GY, Cheung CH, Chen HC, Maa MC, Leu TH, 2014. The inducible nitric oxide synthase (iNOS)/Src axis mediates toll-like receptor 3 tyrosine 759 phosphorylation and enhances its signal transduction, leading to interferon-β synthesis in macrophages. J. Biol. Chem. 289, 9208–9220. 10.1074/jbc.M113.508663. [DOI] [PMC free article] [PubMed] [Google Scholar]
- Kast RE, Focosi D, 2010. Three paths to better tyrosine kinase inhibition behind the blood-brain barrier in treating chronic myelogenous leukemia and glioblastoma with imatinib. Transl. Oncol. 3, 13–15. 10.1593/tlo.09280. [DOI] [PMC free article] [PubMed] [Google Scholar]
- Kim JE, Kang TC, 2017. p47Phox/CDK5/DRP1-mediated mitochondrial fission evokes PV cell degeneration in the rat dentate gyrus following status epilepticus. Front. Cell. Neurosci. 11, 267. 10.3389/fncel.2017.00267. [DOI] [PMC free article] [PubMed] [Google Scholar]
- Langley M, Ghosh A, Charli A, Sarkar S, Ay M, Luo J, Zielonka J, Brenza T, Bennett B, Jin H, Ghaisas S, Schlichtmann B, Kim D, Anantharam V, Kanthasamy A, Narasimhan B, Kalyanaraman B, Kanthasamy AG, 2017. Mito-Apocynin prevents mitochondrial dysfunction, microglial activation, oxidative damage, and progressive neurodegeneration in MitoPark transgenic mice. Antioxid. Redox Signal. 27, 1048–1066. 10.1089/ars.2016.6905. [DOI] [PMC free article] [PubMed] [Google Scholar]
- Lindauer M, Hochhaus A, 2014. Dasatinib. Recent Results Cancer Res. 201, 27–65. 10.1007/978-3-642-54490-3_2. [DOI] [PubMed] [Google Scholar]
- Liu KJ, He JH, Su XD, Sim HM, Xie JD, Chen XG, Wang F, Liang YJ, Singh S, Sodani K, Talele TT, Ambudkar SV, Chen ZS, Wu HY, Fu LW, 2013. Saracatinib (AZD0530) is a potent modulator of ABCB1-mediated multidrug resistance in vitro and in vivo. Int. J. Cancer 132, 224–235. 10.1002/ijc.27649. [DOI] [PMC free article] [PubMed] [Google Scholar]
- Lockton JA, Smethurst D, Macpherson M, Tootell R, Marshall AL, Clack G, Gallagher NJ, 2005. Phase I ascending single and multiple dose studies to assess the safety, tolerability and pharmacokinetics of AZD0530, a highly selective, dual-specific Src-Abl inhibitor. J. Clin. Oncol. 23 10.1200/jco.2005.23.16_suppl.3125, 3125–3125.15860872 [DOI] [Google Scholar]
- Lopez-Rivera E, Jayaraman P, Parikh F, Davies MA, Ekmekcioglu S, Izadmehr S, Milton DR, Chipuk JE, Grimm EA, Estrada Y, Aguirre-Ghiso J, Sikora AG, 2014. Inducible nitric oxide synthase drives mTOR pathway activation and proliferation of human melanoma by reversible nitrosylation of TSC2. Cancer Res. 74, 1067–1078. 10.1158/0008-5472.CAN-13-0588. [DOI] [PMC free article] [PubMed] [Google Scholar]
- Luo XM, Zhao J, Wu WY, Fu J, Li ZY, Zhang M, Lu J, 2021. Post-status epilepticus treatment with the Fyn inhibitor, saracatinib, improves cognitive function in mice. BMC Neurosci. 22 (1), 2. 10.1186/s12868-020-00606-z. [DOI] [PMC free article] [PubMed] [Google Scholar]
- Maa MC, Chang MY, Li J, Li YY, Hsieh MY, Yang CJ, Chen YJ, Li Y, Chen HC, Cheng WE, Hsieh CY, Cheng CW, Leu TH, 2011. The iNOS/Src/FAK axis is critical in toll-like receptor-mediated cell motility in macrophages. Biochim. Biophys. Acta 1813, 136–147. 10.1016/j.bbamcr.2010.09.004. [DOI] [PubMed] [Google Scholar]
- Mittapalli RK, Chung AH, Parrish KE, Crabtree D, Halvorson KG, Hu G, Elmquist WF, Becher OJ, 2016. ABCG2 and ABCB1 limit the efficacy of dasatinib in a PDGF-B-driven brainstem glioma model. Mol. Cancer Ther. 15, 819–829. 10.1158/1535-7163.MCT-15-0093. [DOI] [PMC free article] [PubMed] [Google Scholar]
- Nygaard HB, van Dyck CH, Strittmatter SM, 2014. Fyn kinase inhibition as a novel therapy for Alzheimer’s disease. Alzheimers Res. Ther. 6, 8. 10.1186/alzrt238. [DOI] [PMC free article] [PubMed] [Google Scholar]
- Nygaard HB, Wagner AF, Bowen GS, Good SP, MacAvoy MG, Strittmatter KA, Kaufman AC, Rosenberg BJ, Sekine-Konno T, Varma P, Chen K, Koleske AJ, Reiman EM, Strittmatter SM, van Dyck CH, 2015. A phase Ib multiple ascending dose study of the safety, tolerability, and central nervous system availability of AZD0530 (saracatinib) in Alzheimer’s disease. Alzheimers Res. Ther. 7, 35. 10.1186/s13195-015-0119-0. [DOI] [PMC free article] [PubMed] [Google Scholar]
- Panicker N, Saminathan H, Jin H, Neal M, Harischandra DS, Gordon R, Kanthasamy K, Lawana V, Sarkar S, Luo J, Anantharam V, Kanthasamy AG, Kanthasamy A, 2015. Fyn kinase regulates microglial Neuroinflammatory responses in cell culture and animal models of Parkinson’s disease. J. Neurosci. 35, 10058–10077. 10.1523/JNEUROSCI.0302-15.2015. [DOI] [PMC free article] [PubMed] [Google Scholar]
- Pearson JN, Rowley S, Liang LP, White AM, Day BJ, Patel M, 2015. Reactive oxygen species mediate cognitive deficits in experimental temporal lobe epilepsy. Neurobiol. Dis. 82, 289–297. 10.1016/j.nbd.2015.07.005. [DOI] [PMC free article] [PubMed] [Google Scholar]
- Putra M, Sharma S, Gage M, Hinojo A, Gregory-Flores A, Olson A, Gasser G, Puttachary S, Wang C, Anantharam V, Thippeswamy T, 2019. Inducible nitric oxide synthase inhibitor, 1400W, mitigates DFP-induced long-term neurotoxicity in the rat model. Neurobiol. Dis. 133, 104443. 10.1016/j.nbd.2019.03.031. [DOI] [PMC free article] [PubMed] [Google Scholar]
- Putra M, Gage M, Sharma S, Gardner C, Gasser G, Anantharam V, Thippeswamy T, 2020a. Diapocynin, an NADPH oxidase inhibitor, counteracts diisopropylfluorophosphate-induced long-term neurotoxicity in the rat model. Ann. N. Y. Acad. Sci. 1479, 75–93. 10.1111/nyas.14314. [DOI] [PMC free article] [PubMed] [Google Scholar]
- Putra M, Puttachary S, Liu G, Lee G, Thippeswamy T, 2020b. Fyn-tau ablation modifies PTZ-induced seizures and post-seizure hallmarks of early epileptogenesis. Front. Cell. Neurosci. 14, 592374. 10.3389/fncel.2020.592374. [DOI] [PMC free article] [PubMed] [Google Scholar]
- Puttachary S, Sharma S, Tes K, Beamer E, Sexton A, Crutison J, Thippeswamy T, 2015. Immediate epileptogenesis after kainate-induced status epilepticus in C57BL/6J mice: evidence from long-term continuous video-EEG telemetry. PLoS One 10 (7), e0131705. 10.1371/journal.pone.0131705. [DOI] [PMC free article] [PubMed] [Google Scholar]
- Puttachary S, Sharma S, Verma S, Yang Y, Putra M, Thippeswamy A, Luo D, Thippeswamy T, 2016a. 1400W, a highly selective inducible nitric oxide synthase inhibitor is a potential disease modifier in the rat kainate model of temporal lobe epilepsy. Neurobiol. Dis. 93, 184–200. 10.1016/j.nbd.2016.05.013. [DOI] [PubMed] [Google Scholar]
- Puttachary S, Sharma S, Thippeswamy A, Thippeswamy T, 2016b. Immediate epileptogenesis: impact on brain in C57BL/6J mouse kainate model. Front. Biosci. (Elite Ed). 8, 390–411. 10.2741/e775. [DOI] [PubMed] [Google Scholar]
- Racine RJ, 1972. Modification of seizure activity by electrical stimulation. II. Motor seizure. Electroencephalogr Clin Neurophysiol. 32, 281–294. [DOI] [PubMed] [Google Scholar]
- Roseti C, van Vliet EA, Cifelli P, Ruffolo G, Baayen JC, Di Castro MA, Bertollini C, Limatola C, Aronica E, Vezzani A, Palma E, 2015. GABAA currents are decreased by IL-1β in epileptogenic tissue of patients with temporal lobe epilepsy: implications for ictogenesis. Neurobiol. Dis. 82, 311–320. 10.1016/j.nbd.2015.07.003. [DOI] [PubMed] [Google Scholar]
- Shah NP, Wallis N, Farber HW, Mauro MJ, Wolf RA, Mattei D, Guha M, Rea D, Peacock A, 2015. Clinical features of pulmonary arterial hypertension in patients receiving dasatinib. Am. J. Hematol. 9, 1060–1064. 10.1002/ajh.24174. [DOI] [PubMed] [Google Scholar]
- Sharma S, Carlson S, Puttachary S, Sarkar S, Showman L, Putra M, Kanthasamy AG, Thippeswamy T, 2018a. Role of the Fyn-PKCδ signaling in SE-induced neuroinflammation and epileptogenesis in experimental models of temporal lobe epilepsy. Neurobiol. Dis. 110, 102–121. 10.1016/j.nbd.2017.11.008. [DOI] [PMC free article] [PubMed] [Google Scholar]
- Sharma S, Puttachary S, Thippeswamy A, Kanthasamy AG, Thippeswamy T, 2018b. Status epilepticus: behavioral and electroencephalography seizure correlates in kainate experimental models. Front. Neurol. 9, 7. 10.3389/fneur.2018.00007. [DOI] [PMC free article] [PubMed] [Google Scholar]
- Sloviter RS, Zappone CA, Harvey BD, Frotscher M, 2006. Kainic acid-induced recurrent mossy fiber innervation of dentate gyrus inhibitory interneurons: possible anatomical substrate of granule cell hyper-inhibition in chronically epileptic rats. J. Comp. Neurol. 494, 944–960. 10.1002/cne.20850. [DOI] [PMC free article] [PubMed] [Google Scholar]
- Smith LM, Zhu R, Strittmatter SM, 2017. Disease-modifying benefit of Fyn blockade persists after washout in mouse Alzheimer’s model. Neuropharmacology. 130, 54–61. 10.1016/j.neuropharm.2017.11.042. [DOI] [PMC free article] [PubMed] [Google Scholar]
- Staley KJ, Dudek FE, 2006. Interictal Spikes and Epileptogenesis, 6(6), pp. 199–202. 10.1111/j.1535-7511.2006.00145.x [DOI] [PMC free article] [PubMed] [Google Scholar]
- Staley KJ, White A, Dudek FE, 2011. Interictal spikes: harbingers or causes of epilepsy? Neurosci. Lett. 497, 247–250. 10.1016/j.neulet.2011.03.070. [DOI] [PMC free article] [PubMed] [Google Scholar]
- Sun KH, de Pablo Y, Vincent F, Shah K, 2008. Deregulated Cdk5 promotes oxidative stress and mitochondrial dysfunction. J. Neurochem. 107, 265–278. 10.1111/j.1471-4159.2008.05616.x. [DOI] [PubMed] [Google Scholar]
- Temkin NR, 2011. Antiepileptogenesis and seizure prevention trials with antiepileptic drugs: meta-analysis of controlled trials. Epilepsia. 42, 515–524. 10.1046/j.1528-1157.2001.28900x. [DOI] [PubMed] [Google Scholar]
- Tse K, Beamer E, Sills GJ, Thippeswamy T, 2014. Advantages of Repeated Low Dose against Single High Dose of Kainate in C57BL/6J Mouse Model of Status Epilepticus: Behavioral and Electroencephalographic Studies. PLoS One 9 (5), e96622. 10.1371/journal.pone.0096622. [DOI] [PMC free article] [PubMed] [Google Scholar]
- Tyryshkin A, Gorgun FM, Abdel Fattah E, Mazumdar T, Pandit L, Zeng S, Eissa NT, 2010. January 1. Src kinase-mediated phosphorylation stabilizes inducible nitric-oxide synthase in normal cells and cancer cells. J Biol Chem 285 (1), 784–792. 10.1074/jbc.M109.055038. [DOI] [PMC free article] [PubMed] [Google Scholar]
- Tyryshkin A, Bhattacharya A, Eissa NT, 2014. SRC kinase is a novel therapeutic target in lymphangioleiomyomatosis. Cancer Res. 74, 1996–2005. 10.1158/0008-5472.CAN-13-1256. [DOI] [PMC free article] [PubMed] [Google Scholar]
- Varvel NH, Jiang J, Dingledine R, 2015. Candidate drug targets for prevention or modification of epilepsy. Annu. Rev. Pharmacol. Toxicol. 55, 229–247. 10.1146/annurev-pharmtox-010814-124607. [DOI] [PMC free article] [PubMed] [Google Scholar]
- Varvel NH, Neher JJ, Bosch A, Wang W, Ransohoff RM, Miller RJ, Dingledine R, 2016. September 20. Infiltrating monocytes promote brain inflammation and exacerbate neuronal damage after status epilepticus. Proc Natl Acad Sci U S A 113 (38), E5665–E5674. 10.1073/pnas.1604263113. [DOI] [PMC free article] [PubMed] [Google Scholar]
- Vezzani A, Aronica E, Mazarati A, Pittman QJ, 2011. Epilepsy and brain inflammation. Exp. Neurol. 244, 11–21. 10.1016/j.expneurol.2011.09.033. [DOI] [PubMed] [Google Scholar]
- Waller CF, 2018. Imatinib mesylate. Recent Results Cancer Res. 212, 1–27. 10.1007/978-3-319-91439-8_1. [DOI] [PubMed] [Google Scholar]
Associated Data
This section collects any data citations, data availability statements, or supplementary materials included in this article.


