

Abstract
Purpose:
To compare ellipsoid zone (EZ) loss and functional loss in macular telangiectasia (MacTel) type 2 longitudinally.
Methods:
Prospective natural history study. Ellipsoid zone loss was measured in en-face images created from spectral domain optical coherence tomography. Functional loss was assessed by best-corrected visual acuity and microperimetry, counting the number of test points with impaired function.
Results:
A total of 56 eyes of 31 participants were followed for 4.5 ± 1.2 years. Ellipsoid zone loss was 18,600 ± 3,917.3 pixel at baseline (≈0.59 mm2) and increased 2,627.8 ± 427.9 pixel (≈0.08 mm2) per year. Best-corrected visual acuity decreased 2.2 ± 0.9 letters per year. Change in EZ loss correlated significantly with change in relative and absolute scotomas (r = 0.62; P-value < 0.0001 and r = 0.72; P-value < 0.0001), but not with loss of best-corrected visual acuity. Functional loss showed a similar frequency of progression as EZ loss, but a higher rate of “regression,” likely due to higher variability of the measurement, assuming a progressive neurodegenerative disease.
Conclusion:
The results of the authors support EZ loss as surrogate measure for visual function in MacTel type 2. Being objective, EZ loss might be considered more suitable than microperimetry as primary end point in future interventional trials.
Keywords: macular telangiectasia type 2, progression of functional loss, MacTel type 2, MP1 microperimetry, ellipsoid zone loss, inner segment/outer segment loss, aen-face imaging, EZ loss
Since 2005, the Macular Telangiectasia (MacTel) Natural History Observation Study (NHOS) has provided insights into the disease course of macular telangiectasia (MacTel) type 2. The current consensus defines MacTel as a bilateral, neurodegenerative disease. A recent comprehensive review summarizes the main features of the disease, including epidemiology, current staging, as well as clinical and morphologic findings.1 Structural change includes loss of the ellipsoid zone (EZ) seen on spectral domain optical coherence tomography (SD-OCT), and functional deterioration is characterized by the development of a focal scotoma which can be detected by microperimetry.2,3 The EZ loss typically starts temporal to the foveal center with subsequent progression. The accompanying progression of functional loss is better reflected by microperimetry than by best-corrected visual acuity (BCVA) alone, as the foveal center might be preserved despite large scotoma.3 Functional loss in microperimetry has been measured in different ways in MacTel. It has been quantified as aggregate sensitivity loss and as thresholding.3,4 Aggregate sensitivity loss is defined as difference between the average retinal sensitivity in the surround normal area and the retinal sensitivity specific to the area of the scotoma and thus reflects the depth or volume of a scotoma. Thresholding gives an estimate of the scotoma size and is defined as the number of test points with a certain sensitivity threshold loss. Aggregate sensitivity loss is a more complex and time-consuming analysis to conduct and can be more difficult to understand and interpret. Thresholding simply quantifies the functional loss in microperimetry counting the number of foci of retinal sensitivity below a certain threshold, making this a rather simple concept. It has been shown that microperimetry is valuable in evaluating retinal function in MacTel.3 However, the sensitivity to detect changes might be lower in microperimetry when compared with SD-OCT.5 Also, microperimetry might show a higher variability because of its subjective and psychophysical nature.6 Therefore, it appears not to be ideal for monitoring disease progression. Spectral domain optical coherence tomography is less variable and more objective than microperimetry, easier to perform, and more widely available. In a first analysis of the natural history data, Sallo et al4,7 have shown that the EZ loss correlates with aggregate sensitivity loss. Seeking further evidence that EZ loss correlates with visual function loss, corroborating it as outcome measure in clinical trials, we compared EZ loss progression with change of scotoma size.
We, herein, present a longitudinal analysis of the data obtained by the MacTel study, to compare progression of EZ loss on en-face SD-OCT images with progression of scotomas in microperimetry.
Methods
Imaging Procedure
In this retrospective analysis, participants were selected from the prospective MacTel NHOS. The study was described in detail previously.8 In short, patients underwent annual examination including BCVA testing, SD-OCT examinations, and some centers including microperimetry. Best-corrected visual acuity was measured using Early Treatment Diabetic Retinopathy Study (ETDRS) visual acuity charts with standard protocol. Fundus controlled perimetry was performed with direct visualization of the stimulation of the fundus using the MP1 microperimeter (Nidek, Gamagori, Japan) with a variety of protocols. We included only participants who received a testing pattern in which stimuli were not more than one degree apart, with a simultaneously acquired high-density SD-OCT volume scan that allowed for generation of en-face images. Therefore, the herein analyzed cohort is part of a previously published cohort.3
Participants who had both corresponding SD-OCT and microperimetry on the same study visits with a minimum follow-up of 2 years were included in the analysis. The detailed method of microperimetry has been described elsewhere.2 Spectral domain optical coherence tomography was performed with Spectralis HRA + OCT (Heidelberg Engineering, Heidelberg, Germany). Details of the standard operation procedure have been published previously.9 In brief, a high-density SD-OCT volume scan was recorded covering 15° horizontally and 10° vertically with 97 scans with a space of 30 μm in between.
Measurement of Scotoma Size
An absolute scotoma was defined as a retinal location on which the brightest test stimulus could not be seen. In the MP1, this is a functional loss of at least 20 dB (2 log units) as compared to the healthy retina. Functional impairment was defined as the location on which a stimulus of 12 dB or lower could not be seen. This equals a loss of 8 db (0.8 log units) or more (Figure 1). The rationale for this definition was based on the results of the test–retest measurements of Chen et al.10 Thus, the number of stimuli <0 dB or ≤12 dB reflected the size of an absolute scotoma or of an area of functional impairment. As previous overlay work of the microperimetry and en-face OCT EZ loss corresponded well, we also assume that the loss of retinal sensitivity again corresponds to the area of the EZ loss. With this methodology, it is not necessary to align the results, but we would simply count the number of points with any significant change of sensitivity. However, we restricted the stimuli count (thresholding) to an eccentricity of 5° from the foveal center, as it has been shown previously that beyond this area, no changes of retinal sensitivity would be expected because of MacTel.3
Fig. 1.
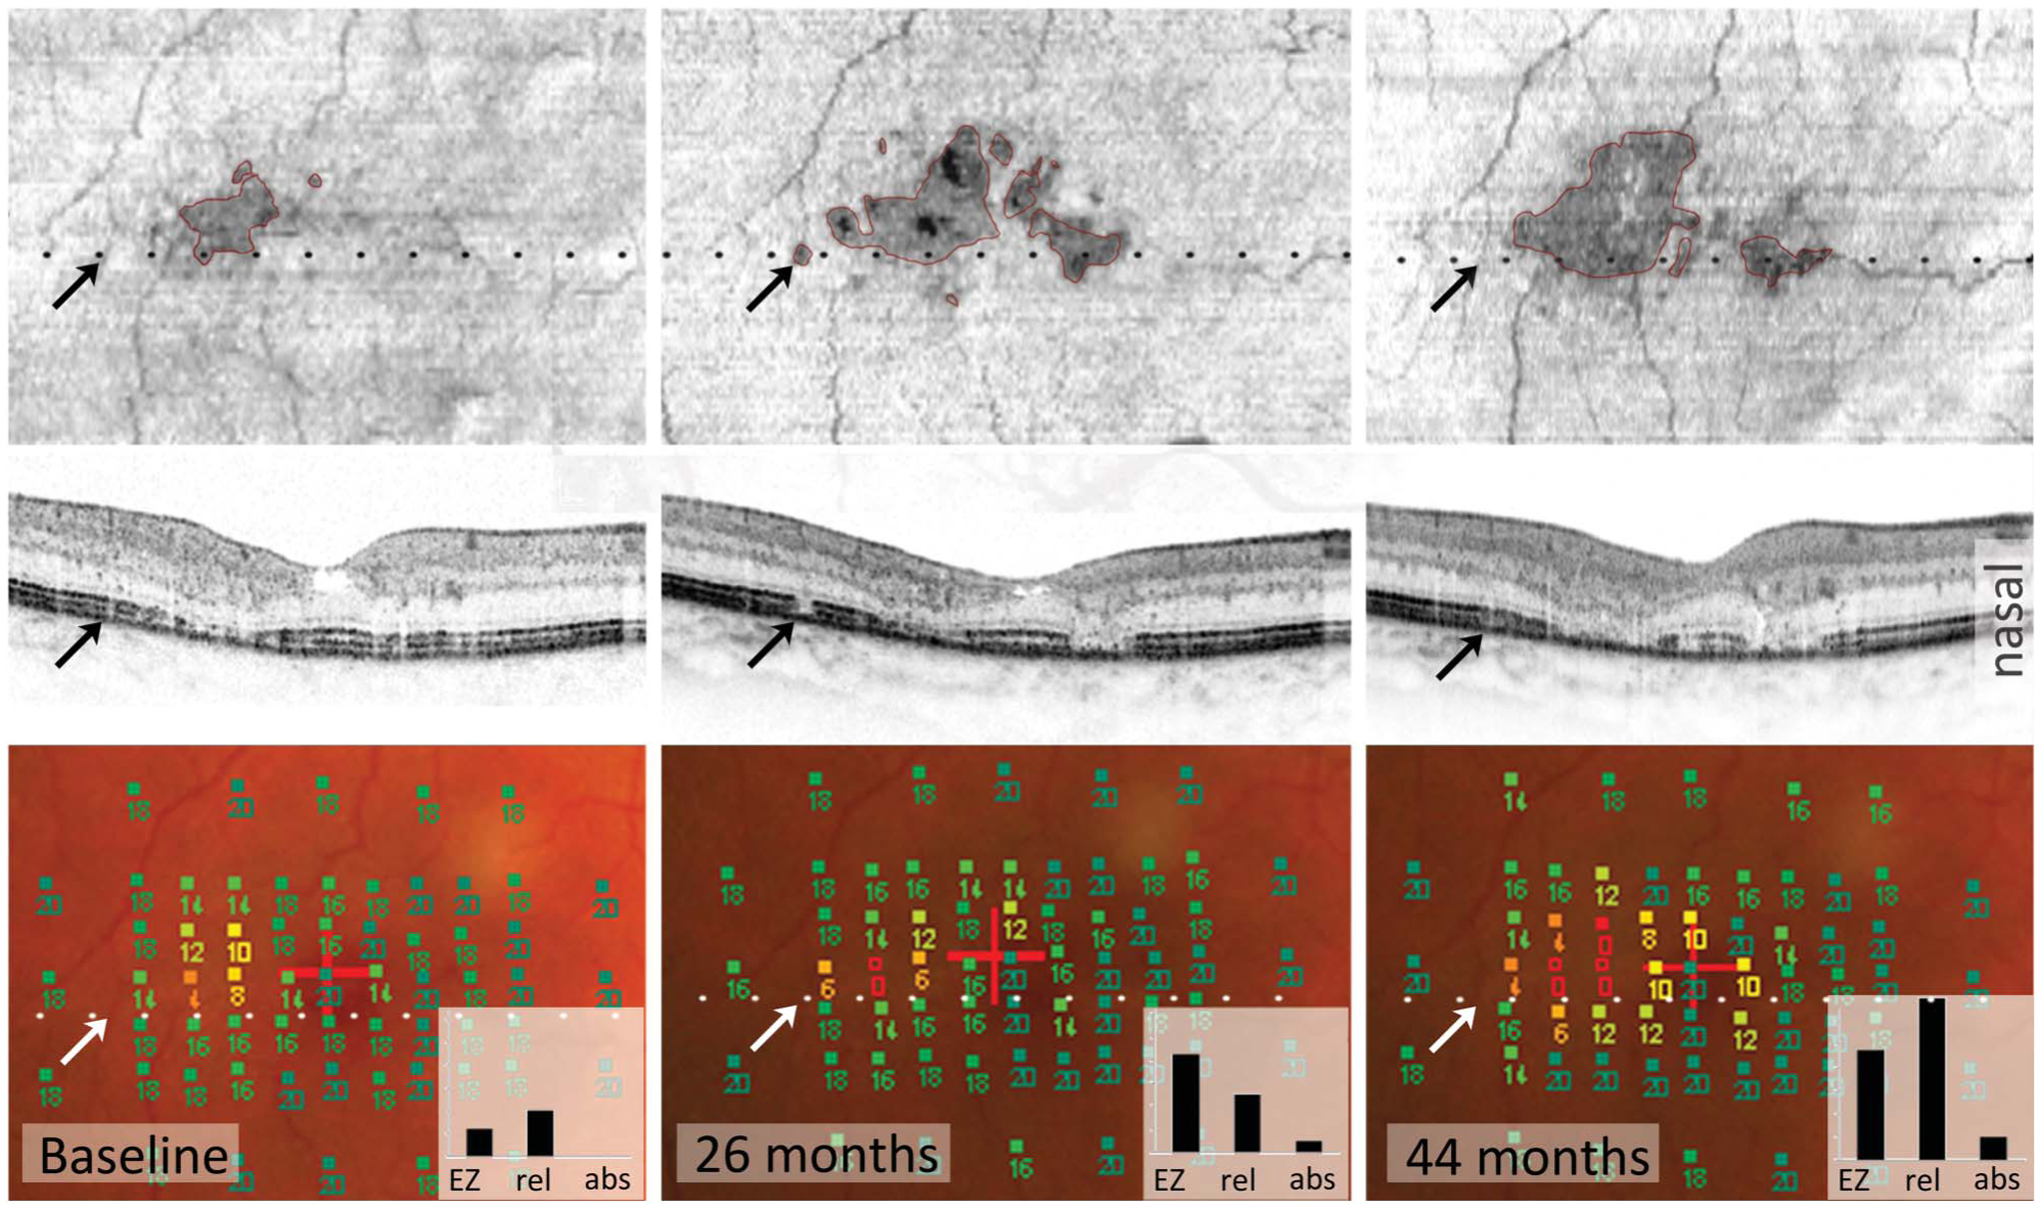
Disease progression of MacTel type 2 seen on SD-OCT (first and second rows) correlates with loss of function seen on microperimetry (MP, bottom row). Both SD-OCT and MP detect changes similarly, whereas EZ loss topographically correlates better with generally impaired function than absolute scotoma. First row: Areas of EZ loss appear dark in en-face images (outlined in pink, upper row) and increase over time. The dotted black and white lines show the position of the B-scan (middle row). Lower row: Each square in MP images represents one test point with the respective retinal sensitivity in dB (full squares: 14–20 dB = normal sensitivity and 0–12 dB = area of functional impairment. Empty squares: <0 dB = absolute scotoma). The graph inlets show the estimated affected retinal area in square degree, based on EZ loss (EZ), number of test points with impaired function (rel), or absolute (abs) scotoma: the area of impaired function increases and corresponds to the area of EZ loss. The number of absolute scotomas changes less. The BCVA remains stable at Snellen = 20/50. Regression of EZ loss. The black and white arrows point at the same retinal position in all images. A small area of EZ loss appears (second column, upper and middle image) and disappears again (third column). This regression of EZ loss might be due to a real improvement but also due to structural changes with influence on OCT reflectivity. B-scans of baseline and month 44 area show an irregularity in the EZ layer at this position and an overall thicker retina, maybe due to minor retinal edema, which favors the idea of a structural alteration rather than a real improvement, which could influence the strength of the EZ signal.
Measurement of Ellipsoid Zone Loss
These volume scans were used to generate en-face images, based on which the EZ loss was measured. The OCT volume scans were automatically segmented into “all layers” using the manufacturer’s software (Heidelberg Eye Explorer, version 6.0.13.0, Heidelberg Engineering) while manual correction was also feasible. The segmentation editor allowed for manual correction of segmentation. In particular, the photoreceptor 1 segment line was manually corrected. This line overlays the EZ (Figure 1). The option of transverse display within the 3D view panel allowed than for en-face visualization of the EZ layer. The photoreceptor 1 was set as reference for the en-face view and the distance to a second line was set to 0, resulting in a thickness of the layer of one pixel. The color table for the OCT image was set to “White on Black” which resulted in a darker area for EZ loss. The “draw region” tool was then used to draw an outlay around the darker area of suspected EZ loss within the en-face panel. In a next step, the position of the overlay was checked in each B-scan (where the overlay position was depicted). If the line of the overlay did not correspond with the border of EZ loss, the correct position of EZ loss was marked within the en-face image. In a last step, a new overlay was drawn following the markings within the image. This procedure was repeated until a satisfactory correspondence between the EZ loss border and the overlay was achieved. Usually, not more than two runs were necessary.
Statistical Analysis
The data provided comprised two time points for each eye. The first time point with both microperimetry and SD-OCT examination was considered the baseline for the eye, the last time point was considered the follow-up. To standardize for comparison, the change variables were standardized to change per year. All change measures were computed as follows: (second measurement – baseline measurement)/time between measurements in years. The association between structure and function was assessed in mixed effects models (accounting for correlation between eyes and along for covariate adjustment). The analyses were performed both adjusted and not adjusted for change in visual acuity at this time. The eye characteristic summaries are from a mixed-effects model taking into consideration the correlation for participants with both eyes in the analysis. An unstructured covariance matrix was used for the model.
Both progression of EZ loss and scotoma progression were expressed as positive values. Progression of absolute scotomas or areas of functional impairment are defined as increase in number of test points ≤12 dB or <0 dB in microperimetry, indicating a deterioration in the retinal function. Decrease in BCVA is expressed as numbers of letters loss.
Clinically Detectable Progression
This study aimed at obtaining parameters of progression that are useful in clinical trials. Therefore, we established the clinically detectable progression, which we defined as the smallest discernible unit in a set time frame. In microperimetry, this was defined as one new test point with either relative or absolute scotoma per year. Variability between two EZ loss measurements was approximately 1,000 pixel (data not shown). Therefore, clinically detectable EZ loss progression was defined as change of more than 2,000 pixel per year.
Results
A total of 56 eyes of 31 participants were analyzed. The mean follow-up was 4.5 ± 1.2 years (range 2.3–7.6 years). Table 1 summarizes the baseline characteristics and the annual change rate of both EZ loss and BCVA.
Table 1.
Baseline Characteristics and Change of EZ Loss, Scotomas, and BCVA
| Eye Characteristic | Mean (SE) |
|---|---|
| Baseline size of functional impairment (≤12 dB) | 8.8 (1.6) tp, range 0–55 |
| Annual increase of area of functional impairment | 1.5 (0.3) tp, range −3.7 to 10.2 |
| Baseline size of absolute scotoma (<0 dB) | 3.3 (0.9) tp, range 0–33 |
| Annual growth rate of absolute scotoma | 0.8 (0.2) tp, range −0.3 to 3.2 |
| Baseline BCVA | 68.3 (1.8) ETDRS letters |
| Annual change in BCVA | −2.2 (0.9) ETDRS letters |
| Baseline EZ loss area | 18,600 (3,917.3) pixel (px) ≈ 0.59 mm2 |
| Change in EZ loss | |
| Total annual change | 2,627.8 ± 427.9 px ≈ 0.08 mm2 |
| Per test point showing absolute scotoma | 2,147.0 ± 293.9 px ≈ 0.07 ± 0.01 mm2, P < 0.0001 |
| Per test point showing functional impairment | 1,022.4 ± 162.8 px ≈ 0.03 ± 0.005 mm2, P < 0.0001 |
| In eyes with clinically detectable growth of absolute scotoma* | 5,277.3 ± 576.4 px ≈ 0.17 ± 0.02 mm2 |
| In eyes with no growth of absolute scotoma | 1,360.8 ± 398.8 px ≈ 0.04 ± 0.013 mm2 |
| In eyes with clinically detectable growth of area of functional impairment* | 3,920.1 ± 570.7 px ≈ 0.12 ± 0.02 mm2 |
| In eyes with no growth of area of functional impairment | 1,472.8 ± 541.5 px ≈ 0.05 ± 0.017 mm2 |
Clinically detectable growth: at least one new test point per year.
Progression of Ellipsoid Zone Loss and Progression of Functional Loss
Progression of EZ loss correlated significantly with relative and absolute scotoma progression, but not with decrease of BCVA. (r = 0.62; P-value < 0.0001, < r = 0.72; P-value < 0.0001, r = 0.18; P-value = 0.18, respectively). However, we did not analyze if the position of EZ l1oss in relation to the fovea correlates with BCVA.
Neither relative nor absolute scotoma progression was associated with BCVA loss (r = 0.12; P-value = 0.37, r = 0.06; P-value = 0.66, respectively). Ellipsoid zone loss increased faster in eyes with progression of absolute scotomas than in eyes with progression of area of functional impairments. However, the size of EZ loss at baseline did not correlate with the rate of EZ loss (data not shown). Expressed as EZ loss progression (in pixel) per additional test point with functional impairment or absolute scotoma, EZ loss increased of 2,147.0 ± 293.9 pixel (≈0.07 ± 0.01 mm2) per additional absolute scotoma test point (P-value <0.0001) and of 1,022.4 ± 162.8 pixel (≈0.03 ± 0.005 mm2) per additional testpoint with functional impairment (P-value <0.0001). To evaluate whether our EZ loss rate actually represents annual rates, we examined when EZ loss occurred first in the four eyes with new EZ loss. Ellipsoid zone loss occurred within the first year of observation in three of these eyes. In only one eye, it remains uncertain, as the observation interval was 2 years.
Ellipsoid zone loss seems to topographically better correlate with functional impairment than with absolute scotomas (Figure 1). At baseline, EZ loss and functional impairment, but not EZ loss and absolute scotomas, were found with similar frequency: 32 eyes (57%) had no absolute scotoma, whereas 17 eyes (30%) had no functional impairment and 8 eyes (14%) had no EZ loss at baseline. In eyes with no EZ loss, none had an absolute scotoma, whereas two of them (25%) had mild functional impairment which might be due to assessment variability. Of these six eyes, three eyes (50%) developed a new EZ loss of which two eyes developed new functional impairment. Only one of these eyes developed a new absolute scotoma.
Likewise, progression was found with similar frequency when comparing EZ loss with progression of functional impairment, but not with progression of absolute scotoma (Figure 2). This was the case both with “clinical detectable” change and general change from baseline to follow-up. Clinical detectable change: EZ loss progressed in 50%, functional impairment in 45%, but absolute scotomas in only 30% (densely dotted part of columns in Figure 2). General change: EZ loss progressed in 75%, functional impairment in 77%, and absolute scotomas in 57% (Figure 2, dotted part of the columns).
Fig. 2.
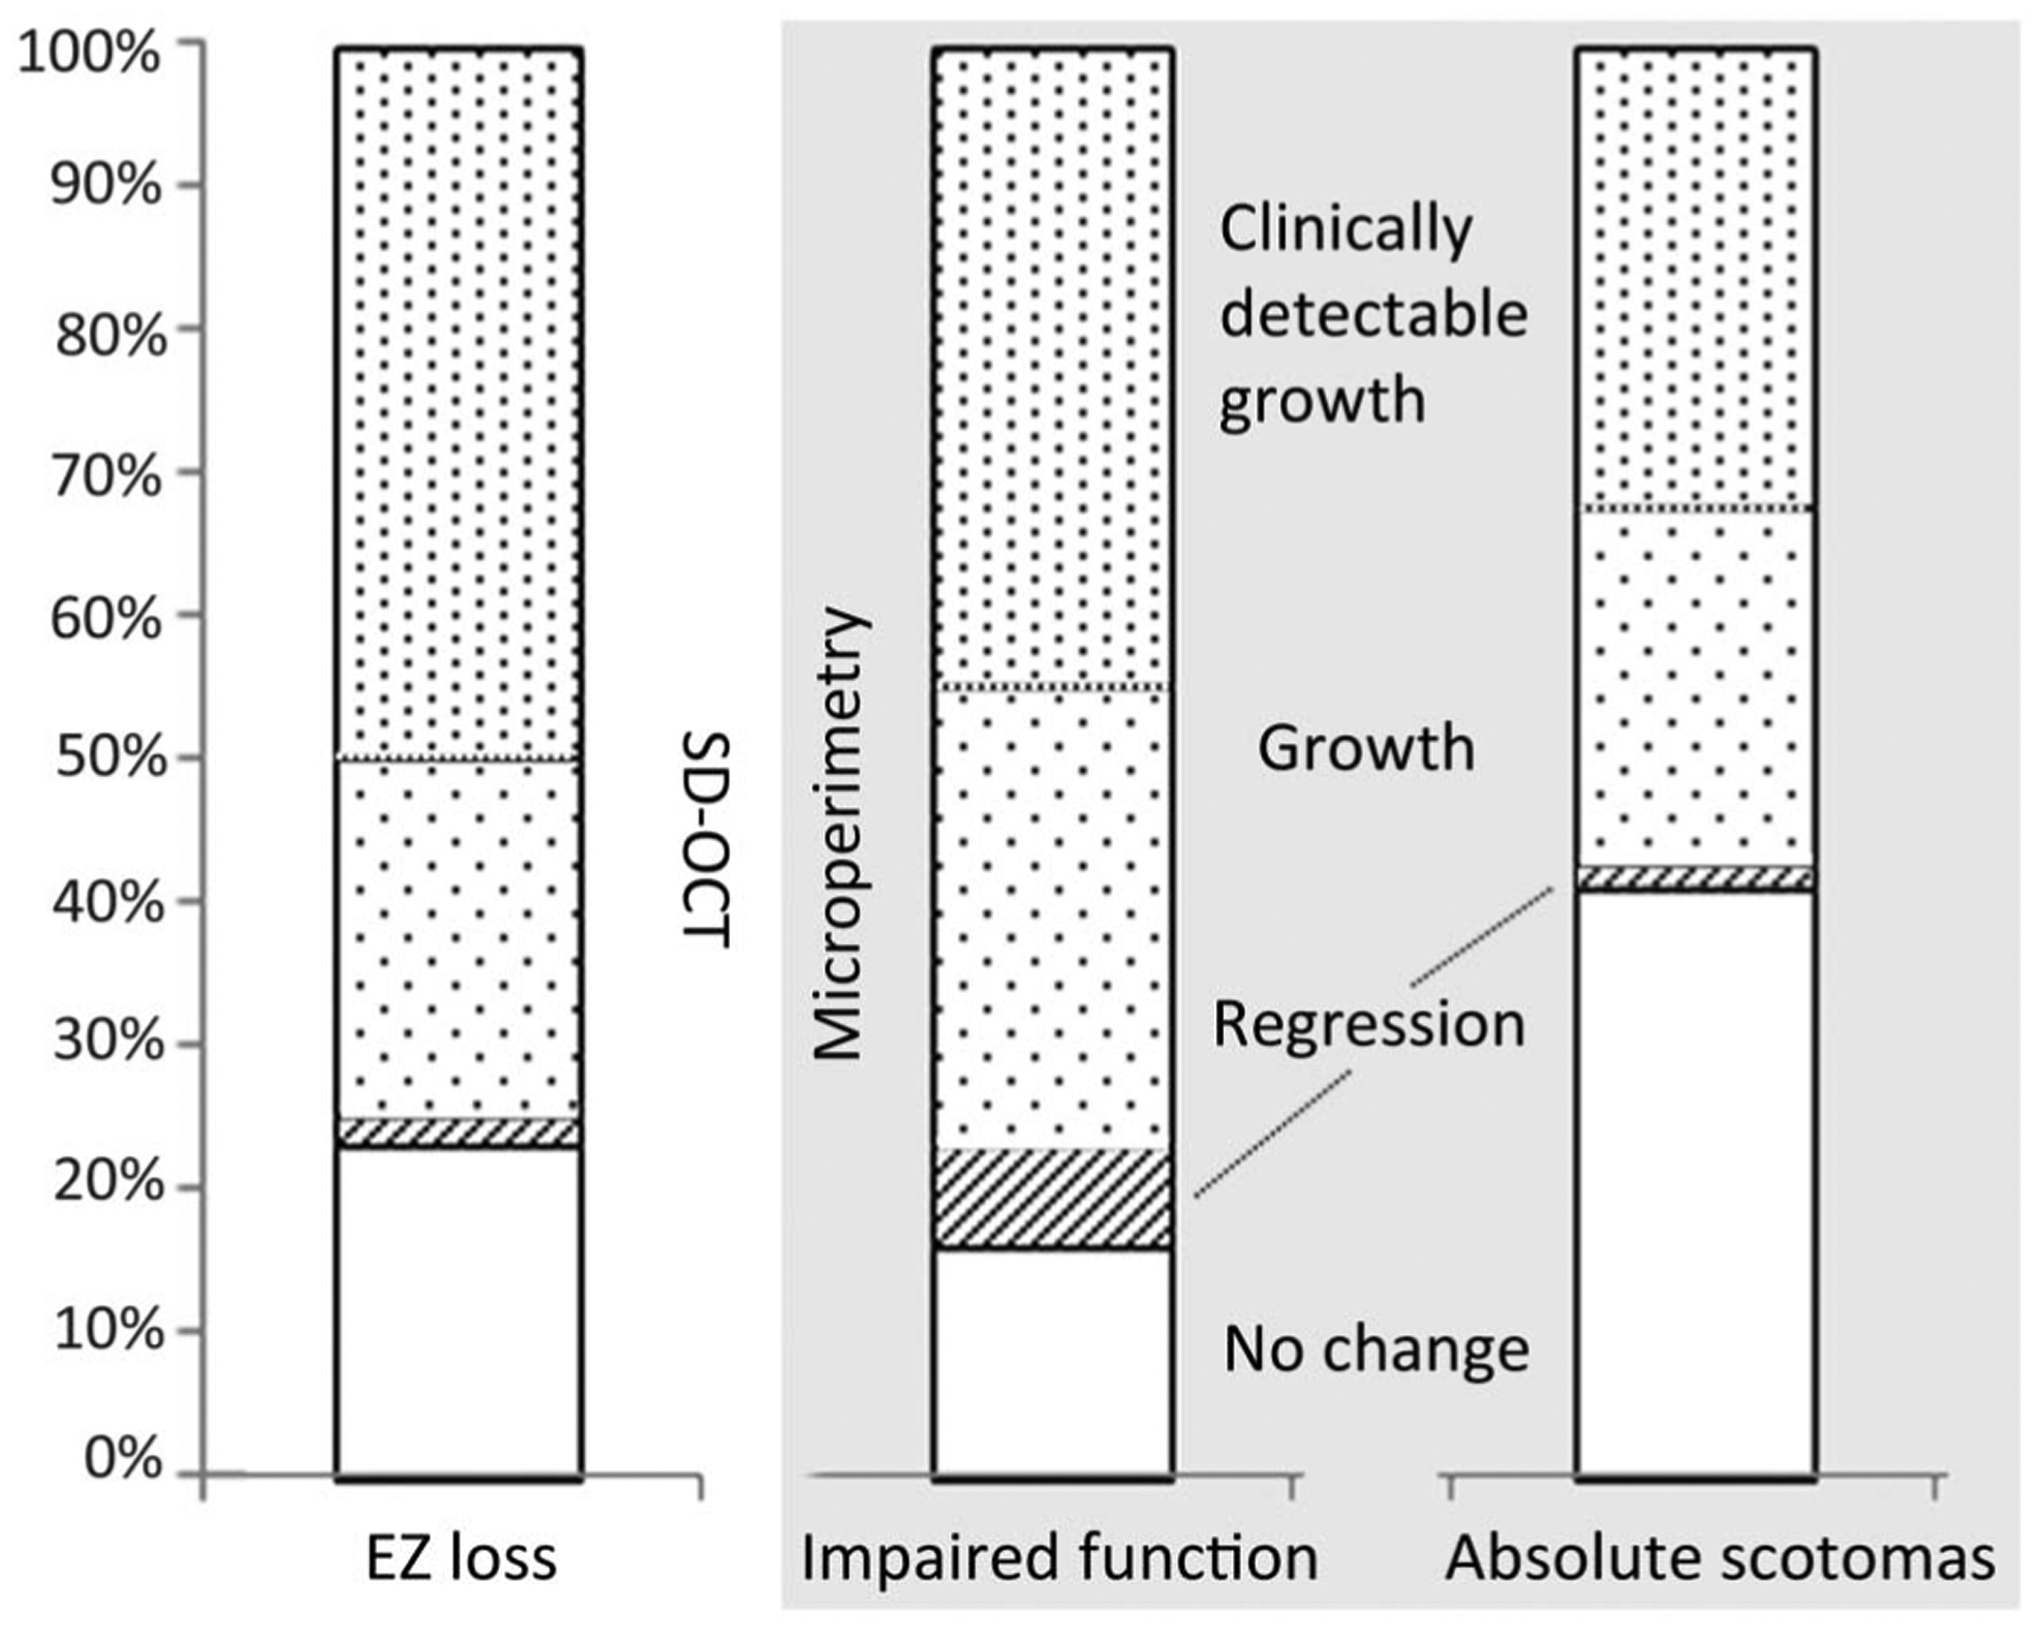
Frequency of change is similar between EZ loss (left) and functional impairment (middle), and less similar between EZ and absolute scotomas (right). No change means no measurable difference between baseline and follow-up. A regression is seen mostly in the area of functional impairments—a sign for higher noise of this measurement. The rate of clinically detectable change (explanation in text) is highest in EZ loss. N = 56 eyes.
The lowest rate of change was 0.2 new scotoma test points per year (both in relative and absolute scotomas) in microperimetry and 0.25 deg2 (625 pixel ≈0.02 mm2) in SD-OCT per year. A measurable regression of areas of functional impairment was found in four eyes. However, no eye showed regression of absolute scotomas. Only one of these eyes showed regression of EZ loss at the same time (Figure 2). One eye showed a clinical detectable decrease of EZ loss of 1,352 pixel ≈ 0.04 mm2 per year. This eye also showed a regression of area of functional impairment of one test point but not of absolute scotoma test points.
Discussion
Our results show that both EZ loss and scotoma growth are suitable parameters to monitor disease progression in MacTel type 2. Both microperimetry and SD-OCT show a slow progression in most eyes and show significant correlation one with the other. The results confirm previous findings2–4,7,9,11,12 and underscore the importance of functional examinations other than BCVA, which is not suitable for disease monitoring of MacTel due to the predilection of scotoma development outside the foveal center. Ellipsoid zone loss shows better correlation with functional impairment (defined herein as relative and absolute scotomas combined) than with absolute scotomas alone. The statistical correlation coefficient might be lower between EZ loss and functional impairment, as the variability of the microperimetry is greater in areas of functional impairments than in areas of absolute scotomas because of the increasing slope of psycho-metric function. It is unclear, however, if improved microperimetry devices such as MAIA might reduce such variability and thus provide reliable and relevant outcome measures. A natural history of OCT changes in MacTel has not been published yet, and it is not known whether or not EZ loss precedes the development of an absolute scotoma. A detailed prospective study of both the structural and functional changes would be required to fully answer the question.
Results of EZ loss can be more easily compared with those from other studies. Comparing microperimetry results with published reports is challenging because of the differences in the machinery, the types of testing grids, and the analytic methodologies. When compared with our previous findings,3 the overall scotoma growth rate in this cohort (which is only partly similar to our previous cohort) is very similar (approximately one new scotoma test point per year). Comparing results of EZ loss between studies seems to be problematic because of the difference in scaling and different types of OCT equipment used. We found an overall progression rate of EZ loss with approximately 0.08 mm2 that is smaller than the 0.14 mm2 found by Sallo et al.4 This difference may be due to a difference in converting pixels to area of mm2. Furthermore, Sallo et al included only eyes that showed already EZ loss at baseline, whereas we included all eyes regardless of the presence of EZ loss. However, our results indicate that progression rates are similar whether or not EZ loss was present at baseline and did not correlate with the size of the baseline lesion, unlike enlargement rates of geographic atrophy lesions associated with advanced age-related macular degeneration.13
Also, en face measurements show limitations. We used the measurement tool provided by the manufacturer. To date, the method has not been cross-validated with other more elaborate methods such as those used by Sallo et al.4,7 However, recently, a very similar approach has been used to quantify preserved EZ in retinitis pigmentosa.14 Hariri et al found a fair reproducibility with high intergrader and intragrader agreement. In our study analysis, we confirmed good intragrader reliability, but agreement between two graders was less good. The repeatability fluctuates around 1,000 pixel (approximately 0.03 mm2) regardless of the lesion size, meaning that the variability had less effect on the measurements in larger areas (data not shown). The precision of eye tracking and variability of the device itself add to the imprecision of the method. Future advances in imaging technology might reduce this variability.
Regression of EZ loss is an infrequent but important finding. One eye in our sample showed a clear reduction of EZ loss. Other eyes showed an overall increase of EZ loss, while smaller patches of EZ loss clearly disappeared (Figure 2).15,16 This might indicate that EZ loss does not fully reflect the integrity of the photoreceptors and therefore might be considered an “epiphenomenon.” In keeping with this idea, one might argue that visual function loss might occur even when EZ loss regression would take place. However, we are confident that our data confirm EZ loss as viable surrogate parameter for visual function. Despite using a different measure of visual function loss—change of scotoma size instead of scotoma depth, our results are in agreement with previous findings by Sallo et al, showing that EZ loss and visual function correlate well.
A disrupted EZ is therefore likely to represent changes or even defects in the photoreceptor layers. Reasons for a disrupted EZ might include loss of either rods or cones or a structural change within the photoreceptors altering the directionality of the light guidance which could change the optical OCT signal. However, recent studies showed that intact cone structures can be found in areas of EZ loss seen in SD-OCT.16–18 The interdigitation zone might indicate areas of photoreceptor disturbance more reliably.19 As we only tested cone function, it is unclear whether rod or cone function is more impaired in areas of EZ alteration. However, earlier studies showing more pronounced rod as compared to cone affection and a striking correlation of EZ loss with rod photoreceptor loss12,20 might hint toward more advanced rod loss in areas of impaired EZ. Rods have been imaged in vivo in only few studies, and to our knowledge, no rod imaging has been performed in patients with MacTel to date.21–25 Measuring rod density in the “MacTel” area could be informative if rods are still present. Nevertheless, an overall decrease of EZ loss occurs only in a relatively small minority of cases and the effect might be negligible. Moreover, even if SD-OCT imaging may not fully detect the presence or absence of photoreceptors (in particular rods), our results show that progression of the disease is found more reliable with SD-OCT than with microperimetry and thus appears to be the most accurate method to monitor disease progression to date.
The good correlation of EZ loss with functional loss in microperimetry suggests that EZ loss appears to be reliable and reproducible as an objective measure of disease progression. Our results indicate that EZ loss might even detect disease progression more precisely than microperimetry because smaller changes are identified. Ellipsoid zone loss may therefore be considered as potential outcome measure in investigational trials in the future.
Acknowledgments
Supported by the Lowy Medical Research Institute, Oxford NIHR Biomedical Research Centre. The funding organization had no role in the design or conduct of this research.
Footnotes
None of the authors has any conflicting interests to disclose.
References
- 1.Charbel Issa P, Gillies MC, Chew EY, et al. Macular telangiectasia type 2. Prog Retin Eye Res 2013;34:49–77. [DOI] [PMC free article] [PubMed] [Google Scholar]
- 2.Charbel Issa P, Helb HM, Rohrschneider K, et al. Microperimetric assessment of patients with type 2 idiopathic macular telangiectasia. Invest Ophthalmol Vis Sci 2007;48:3788–3795. [DOI] [PubMed] [Google Scholar]
- 3.Heeren TF, Clemons T, Scholl HP, et al. Progression of vision loss in macular telangiectasia type 2. Invest Ophthalmol Vis Sci 2015;56:3905–3912. [DOI] [PubMed] [Google Scholar]
- 4.Sallo FB, Peto T, Egan C, et al. The IS/OS junction layer in the natural history of type 2 idiopathic macular telangiectasia. Invest Ophthalmol Vis Sci 2012;53:7889–7895. [DOI] [PMC free article] [PubMed] [Google Scholar]
- 5.Sallo FB, Leung I, Clemons TE, et al. Correlation of structural and functional outcome measures in a phase one trial of CNTF in type 2 idiopathic macular telangiectasia. Retina, in press. [DOI] [PMC free article] [PubMed] [Google Scholar]
- 6.Rohrschneider K, Bultmann S, Springer C. Use of fundus perimetry (microperimetry) to quantify macular sensitivity. Prog Retin Eye Res 2008;27:536–548. [DOI] [PubMed] [Google Scholar]
- 7.Sallo FB, Peto T, Egan C, et al. “En face” OCT imaging of the IS/OS junction line in type 2 idiopathic macular telangiectasia. Invest Ophthalmol Vis Sci 2012;53:6145–6152. [DOI] [PMC free article] [PubMed] [Google Scholar]
- 8.Clemons TE, Gillies MC, Chew EY, et al. Medical characteristics of patients with macular telangiectasia type 2 (MacTel Type 2) MacTel project report no. 3. Ophthalmic Epidemiol 2013;20:109–113. [DOI] [PubMed] [Google Scholar]
- 9.Charbel Issa P, Troeger E, Finger R, et al. Structure-function correlation of the human central retina. PLoS One 2010;5:e12864. [DOI] [PMC free article] [PubMed] [Google Scholar]
- 10.Chen FK, Patel PJ, Xing W, et al. Test-retest variability of microperimetry using the Nidek MP1 in patients with macular disease. Invest Ophthalmol Vis Sci 2009;50:3464–3472. [DOI] [PubMed] [Google Scholar]
- 11.Finger RP, Charbel Issa P, Fimmers R, et al. Reading performance is reduced by parafoveal scotomas in patients with macular telangiectasia type 2. Invest Ophthalmol Vis Sci 2009;50: 1366–1370. [DOI] [PubMed] [Google Scholar]
- 12.Schmitz-Valckenberg S, Fan K, Nugent A, et al. Correlation of functional impairment and morphological alterations in patients with group 2A idiopathic juxtafoveal retinal telangiectasia. Arch Ophthalmol 2008;126:330–335. [DOI] [PubMed] [Google Scholar]
- 13.Holz FG, Bindewald-Wittich A, Fleckenstein M, et al. Progression of geographic atrophy and impact of fundus autofluorescence patterns in age-related macular degeneration. Am J Ophthalmol 2007;143:463–472. [DOI] [PubMed] [Google Scholar]
- 14.Hariri AH, Zhang HY, Ho A, et al. Quantification of ellipsoid zone changes in retinitis pigmentosa using en face spectral domain-optical coherence tomography. JAMA Ophthalmol 2016;134:628–635. [DOI] [PMC free article] [PubMed] [Google Scholar]
- 15.Kupitz EH, Heeren TF, Holz FG, Charbel Issa P. Poor long-term outcome of anti-vascular endothelial growth factor therapy in nonproliferative macular telangiectasia type 2. Retina 2015;35:2619–2626. [DOI] [PubMed] [Google Scholar]
- 16.Wang Q, Tuten WS, Lujan BJ, et al. Adaptive optics microperimetry and OCT images show preserved function and recovery of cone visibility in macular telangiectasia type 2 retinal lesions. Invest Ophthalmol Vis Sci 2015;56:778–786. [DOI] [PMC free article] [PubMed] [Google Scholar]
- 17.Scoles D, Sulai YN, Langlo CS, et al. In vivo imaging of human cone photoreceptor inner segments. Invest Ophthalmol Vis Sci 2014;55:4244–4251. [DOI] [PMC free article] [PubMed] [Google Scholar]
- 18.Scoles D, Flatter JA, Cooper RF, et al. Assessing photoreceptor structure associated with ellipsoid zone disruptions visualized with optical coherence tomography. Retina 2016;36:91–103. [DOI] [PMC free article] [PubMed] [Google Scholar]
- 19.Jacob J, Krivosic V, Paques M, et al. Cone density loss on adaptive optics in early macular telangiectasia type 2. Retina 2016;36:545–551. [DOI] [PubMed] [Google Scholar]
- 20.Powner MB, Gillies MC, Zhu M, et al. Loss of Muller’s cells and photoreceptors in macular telangiectasia type 2. Ophthalmology 2013;120:2344–2352. [DOI] [PubMed] [Google Scholar]
- 21.Merino D, Duncan JL, Tiruveedhula P, Roorda A. Observation of cone and rod photoreceptors in normal subjects and patients using a new generation adaptive optics scanning laser ophthalmoscope. Biomed Opt Express 2011;2:2189–2201. [DOI] [PMC free article] [PubMed] [Google Scholar]
- 22.Dubra A, Sulai Y, Norris JL, et al. Noninvasive imaging of the human rod photoreceptor mosaic using a confocal adaptive optics scanning ophthalmoscope. Biomed Opt Express 2011;2:1864–1876. [DOI] [PMC free article] [PubMed] [Google Scholar]
- 23.Doble N, Choi SS, Codona JL, et al. In vivo imaging of the human rod photoreceptor mosaic. Opt Lett 2011;36:31–33. [DOI] [PMC free article] [PubMed] [Google Scholar]
- 24.Cooper RF, Dubis AM, Pavaskar A, et al. Spatial and temporal variation of rod photoreceptor reflectance in the human retina. Biomed Opt Express 2011;2:2577–2589. [DOI] [PMC free article] [PubMed] [Google Scholar]
- 25.Carroll J, Choi SS, Williams DR. In vivo imaging of the photoreceptor mosaic of a rod monochromat. Vis Res 2008;48:2564–2568. [DOI] [PMC free article] [PubMed] [Google Scholar]