

Abstract
Purpose:
To evaluate progression of macular telangiectasia Type 2 lesions and their correlation with visual acuity.
Methods:
An international multicenter prospective study with annual examinations including best-corrected visual acuity (BCVA), fundus photography, fluorescein angiography, and optical coherence tomography images graded centrally. Mixed models were used to estimate progression rates, and a generalized linear model to compute the relative risk of BCVA loss, loss of ellipsoid zone (EZ) reflectivity, development of pigment plaques, or neovascularization.
Results:
One thousand and fourteen eyes of 507 participants were followed for 4.2 ± 1.6 years. Best-corrected visual acuity decreased 1.07 ± 0.05 letters (mean ± SE) per year. Of all eyes, 15% lost ≥15 letters after 5 years. Of the eyes without EZ loss, 76% developed a noncentral loss. Of the eyes with noncentral loss, 45% progressed to central EZ loss. The rate of BCVA loss in eyes with noncentral EZ loss at baseline was similar to eyes without EZ loss. The rate of BCVA loss was significantly higher in eyes with central EZ loss at baseline (−1.40 ± 0.14 letters, P < 0.001).
Conclusion:
Ellipsoid zone loss is frequently found in macular telangiectasia Type 2 and is an important structural component reflecting visual function. Its presence in the fovea significantly correlates with worse visual prognosis.
Keywords: retinal pigment epithelial (RPE) plaque, ellipsoid zone loss, international multicenter prospective cohort study, MacTel type 2, macular telangiectasia Type 2, natural history observation study, neovascularization, structural and clinical disease progression, visual acuity
Macular telangiectasia Type 2 (MacTel) has been considered historically a disease of the retinal vasculature in origin. The significance of other changes associated with MacTel, such as presence of crystalline deposits and retinal opacification, described by Gass and Oyakawa1 over 30 years ago, was not well understood. However, over the last decade, with markedly improved imaging technology, it has become evident that photoreceptor and Müller cell loss is integral to the disease. The vascular changes might be consequent on alterations in the neuroglia, as suggested by animal models of Müller cell ablation or reported cases of MacTel without vascular changes.2–10 In addition, prospective studies indicate that modulation of the vascular changes with anti–vascular endothelial growth factor agents does not prevent photoreceptor loss.11–14 A comprehensive and accurate evaluation of disease progression is essential, in the light of this paradigm shift regarding the underlying pathophysiology, for defining outcome measures for potential clinical trials. Longitudinal data of disease progression may also identify risk factors associated with progression and predict long-term prognosis to define study populations better to maximize the potential response to various treatment options. In a disease, especially with minimal changes in visual acuity (VA) over time,15 identifying surrogate measures of disease progression is essential in establishing reliable and valid outcome measurements for clinical trials. For example, diabetic retinopathy may lead to devastating visual loss but developing clinical trials based on VA changes which do not occur until the late stages of disease would require an enormous number of subjects. Studies of diabetic retinopathy have relied on surrogate measures established in the Early Treatment Diabetic Retinopathy Study Classification Scale16 with validated and reproducible outcome measures that have reduced the sample size markedly. For these reasons, we used the clinical and ocular imaging data from the MacTel Natural History Observation Study to assess for such markers of progression. The Natural History Observation Study is a multicenter longitudinal study that recruited a large number of participants and collaborated with numerous clinical and basic science laboratories across the world. Identification of a clear and valid pattern of progression of key findings on clinical assessment and various imaging modalities and correlation of this progression with clinically meaningful changes in visual functions, such as VA, are essential.
Methods
We included patients of the MacTel Natural History Study who were enrolled between November 2005 and December 2011 and had at least 1 year of follow-up. Participants underwent annual standardized examinations with dilated fundus examination, color fundus photography, fundus fluorescein angiography (FFA), and optical coherence tomography (OCT) imaging. Best-corrected VA testing was conducted with standardized protocol by certified examiners using the Early Treatment Diabetic Retinopathy Study VA chart.17,18 Lesions graded on stereoscopic color fundus images included retinal pigment epithelial plaques, crystalline deposits, and neovascularization. Using the Early Treatment Diabetic Retinopathy Study grid, data were analyzed on FFA imaging for the number of subfields affected with hyperfluorescence, i.e. leakage, in the late phase. For this analysis, a discontinuous variable was computed using the number of affected subfields (1–9). Each subfield was coded as one if any hyperfluorescence was present and 0 otherwise. The final variable is defined as the sum of all the values (maximum of nine). For grading of the spectral domain OCT images, the presence of a break of the ellipsoid zone ([EZ] formerly known as “inner segment/outer segment”-line) on spectral domain OCT in the central area and outside the central area was evaluated. The first OCT images were taken using Time Domain (TD)-OCT (Stratus; Zeiss, Jena, Germany). We therefore decided to use a categorical grading system rather than quantifying the EZ loss, this being less sensitive to differences in EZ detection between these systems. Inner retinal cavities were not assessed in the current analysis. Progression was defined as no EZ loss at baseline to a noncentral or central EZ loss present at follow-up or a noncentral EZ loss to a central EZ loss.
Statistical Analyses
Estimated progression rates of various MacTel Type 2 ocular characteristics were determined for continuous measures (e.g., VA) using mixed models to compute the mean progression rate per year and a generalized linear model with generalized estimating equation to compute the relative risk of progression. Both types were used to account for the clustering of eyes within subjects and follow-up over time. For each characteristic, we developed an unadjusted model to determine the progression of that characteristic. We then computed covariate adjusted models to determine whether baseline parameters were associated with progression of the characteristic.
Results
A total of 507 participants (1,014 eyes) were included in the analysis cohort. The baseline characteristics of the cohort are provided in Table 1. Over 60% of the participants were female. The mean (±SD) age was 60 ± 9 years. Participants had a mean follow-up of 4.2 ± 1.6 years (range: 1–6 years). The baseline ocular characteristics of MacTel Type 2 are provided in Table 2.
Table 1.
Baseline Characteristics of Participants With MacTel
| n (%) | |
|---|---|
| Total | 507 (100) |
| Sex | |
| Males | 191 (38) |
| Females | 316 (62) |
| Age (mean [SD]), years | 61 (9) |
| Age group, years | |
| <50 | 54 (11) |
| 51–60 | 166 (33) |
| 61–70 | 204 (40) |
| ≥70 | 83 (16) |
| Race | |
| White | 426 (84) |
| Other race | 81 (16) |
| Medical history | |
| Diabetes* | 152 (31) |
| Smoking status* | |
| Never | 248 (49) |
| Former | 200 (40) |
| Current | 56 (11) |
| Hypertension* | 267 (53) |
| Cardiovascular disease* | 73 (14) |
Three participants with missing baseline data.
Table 2.
Baseline MacTel Type 2 Ocular Characteristics
| n (%) | |
|---|---|
| Visual acuity (Snellen) | |
| 20/20 or better | 167 (16) |
| 20/25–20/40 | 474 (47) |
| 20/50–20/80 | 237 (23) |
| 20/100–20/160 | 71 (7) |
| 20/200 or worse | 65 (6) |
| Optical coherence tomography characteristics | |
| Ellipsoid zone break present at baseline (ungradable: 40 eyes) | |
| Present, center of fovea not involved | 230 (24) |
| Present, center of fovea involved | 372 (38) |
| Outer cavities (ungradable: 30 eyes) | |
| Present, center of fovea not involved | 164 (17) |
| Present, center of fovea involved | 79 (8) |
| Color fundus photograph characteristics | |
| Neovascularization present (ungradable: 20 eyes) | 91 (9) |
| Crystalline deposits present (ungradable: 22 eyes) | 304 (31) |
| Irregular retinal pigment epithelial (ungradable: 19 eyes) | |
| Present in 1–4 zones | 152 (15) |
| Present in 5 or more zones | 198 (20) |
| Right angle vein present in at least one zone (ungradable: 21 eyes) | 110 (11) |
| Blunted retinal vessels in at least one zone (ungradable: 21 eyes) | 320 (32) |
| Dilated retinal vessels | |
| Present in 1–4 zones | 310 (31) |
| Present in 5 or more zones | 5 (<1) |
| Visible telangiectatic vessels in at least one zone (ungradable: 21 eyes) | 372 (37) |
| Loss of retinal transparency | |
| Present in 1–4 zones | 670 (67) |
| Present in 5 or more zones | 4 (<1) |
| Fluorescein angiography characteristics (ungradable: 48 eyes) | |
| Retinal pigment epithelial leakage | |
| Present in 1–4 zones | 354 (37) |
| Present in 5 or more zones | 37 (4) |
| Outer capillary leakage on the level of the retinal pigment epithelial | |
| Present in 1–4 zones | 596 (62) |
| Present in 5 or more zones | 30 (3) |
Visual Acuity Progression
The mean ± SE VA at baseline was 69.9 ± 0.5 letters (Snellen equivalent of 20/40). A mean ± SE of 1.07 ± 0.05 letters were lost per year. The rate of change did not differ by age at study enrollment or sex. There was a difference in the rate when stratified by history of diabetes. The average letters lost per year for participants with a history of diabetes was 1.36 ± 0.10 compared with an average letter lost per year of 0.95 ± 0.12 for participants with no history of diabetes. This loss is not accounted for by progression of diabetic retinopathy. A total of 188 of 1,014 eyes (18%) lost 15 or more letters and 323 of 1,014 (32%) eyes lost 10 or more letters. At 5 years, the probability of a 15 or more letter loss was 15% in eyes with MacTel Type 2, whereas the 5-year probability of a 10 or more letter loss was 27% (Figure 1).
Fig. 1.
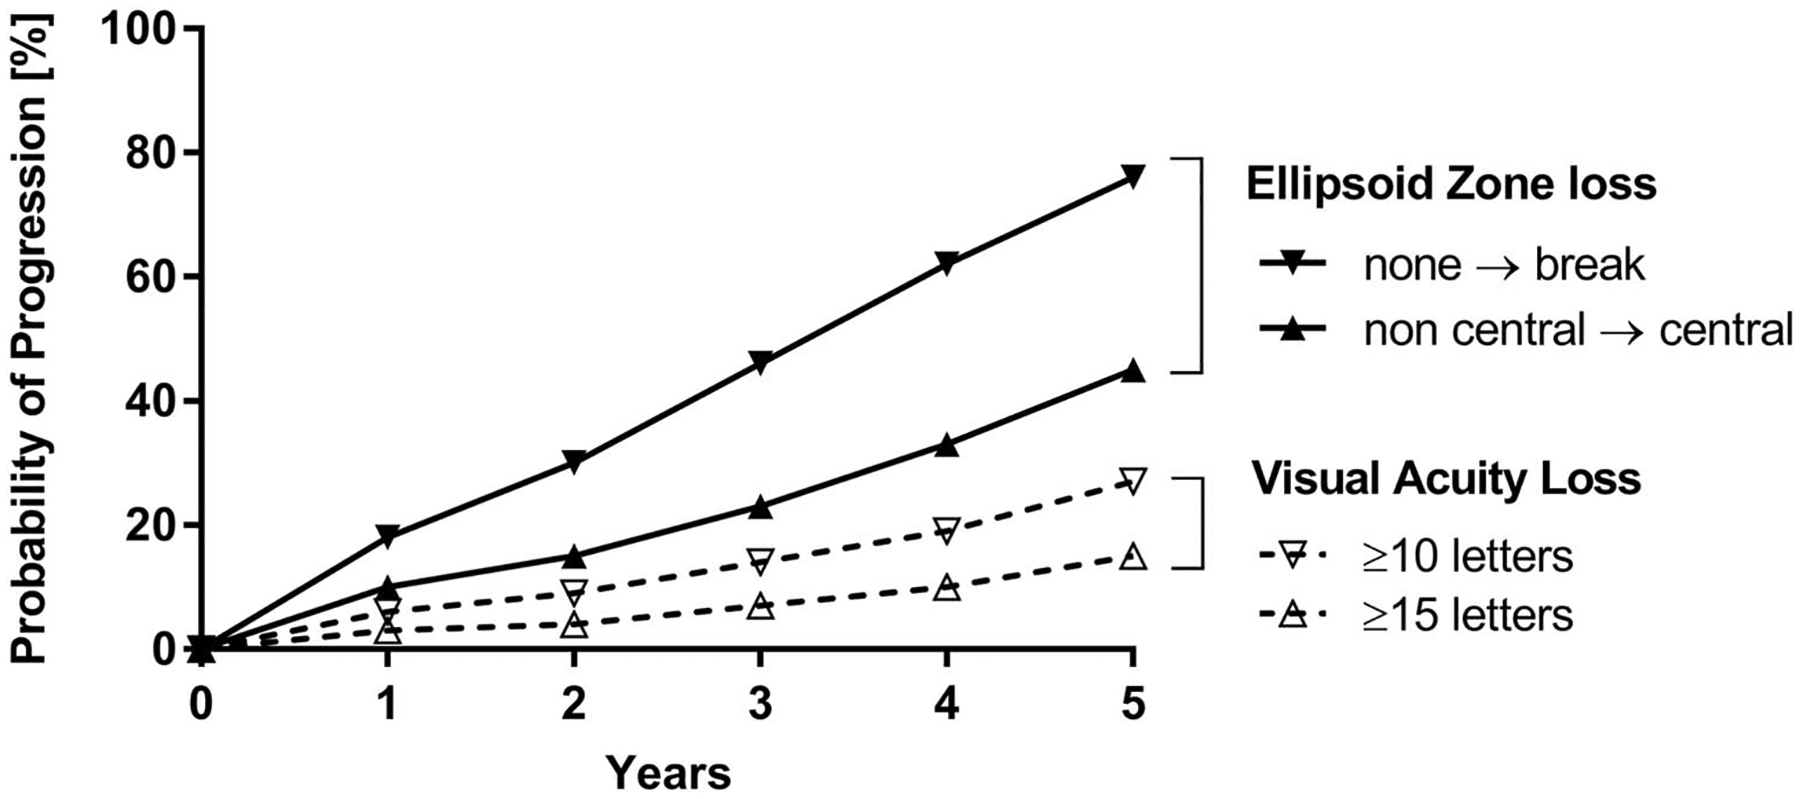
Probability of progression of VA loss versus EZ loss. The probability of EZ loss is much higher than the probability to lose more than 10 or 15 letters of VA. After 5 years, almost 80% of the patients develop an area of EZ loss, whereas only 27% or 15% of the patients lose more than 10 or 15 letters of VA, respectively.
Progression of Ellipsoid Zone Loss
At baseline, there were 974 eyes with OCT data available: 372 of 974 (38%) did not have an ellipsoid (EZ) loss at baseline, 230 (24%) had a loss that did not affect the center of fovea, and 372 (38%) had an EZ loss that affected the center of fovea. The probabilities of progression from no EZ loss to any loss (noncentral and/or central) or progression to a loss affecting the center of fovea by 5 years were 76% and 45%, respectively, Figure 1. There were no differences in the progression rates by various baseline characteristics of interest, such as age, sex, or diabetes.
The location of loss of EZ reflectivity correlated with loss of VA. The mean (SE) change in VA letters was −0.93 ± 0.08 letters per year for participants with no EZ loss at baseline compared with −1.09 ± 0.12 letters per year if the EZ loss was present but did not affect the center (P = 0.18 compared with no EZ loss present at baseline) and −1.40 ± 0.14 letters per year if the EZ loss affected the center (P < 0.001 compared with no EZ loss present at baseline).
Hyperfluorescence on Fluorescein Angiography
A total of 879 eyes had at least one year of FFA follow-up. The mean (±SE) number of subfields with hyperfluorescence at baseline was 2.2 ± 0.05. From a mixed linear model, participants on average progressed with 0.28 ± 0.01 additional fields of hyperfluorescence per year. There was a difference in average change per year by age category. Younger participants had a higher rate of increase hyperfluorescence on FFA compared with older participants (age < 50 years: 0.39 ± 0.04; age < 60 years: 0.34 ± 0.03; age < 70 years: 0.24 ± 0.03; and age ≥ 70 years: 0.16 ± 0.03; compared with older age group P=<0.001, <0.001; and 0.006, respectively). The average change per year also differed by sex (males: 0.26 ± 0.02 vs. females: 0.30 ± 0.01; P = 0.03). There was no difference by history of diabetes or presence of EZ loss at baseline.
Crystalline Deposits
A total of 304 (31%) of 992 eyes had crystalline deposits present at baseline. By 5 years, the probability of progression from no deposits to any crystalline deposits was 20%. Younger participants had a higher risk of progression to crystalline deposits compared with older participants (aged younger than 50 years, aged 51–60 years, and aged 61–70 years compared with ≥70 years of age Relative Risk (RR): 3.20; 95% confidence interval: 1.69–6.05; P < 0.001; 2.14; 95% confidence interval: 1.19–3.86; P = 0.01; and 1.86; 95% confidence interval: 1.03–3.36; P = 0.04, respectively). Crystals have been reported to disappear. This effect, however, might be caused by only slight tilt changes in the imaging pane (Sallo et al), wherefore we did not specifically analyze the probability of crystal regression.
Hyperpigmentation
A total of 350 (35%) of 995 eyes had hyperpigmentation present in at least one subfield at baseline. By 5 years, the probability of progression to presence of pigment was 33%. There were no differences in the progression rates by age, sex, or presence of diabetes at baseline.
Neovascularization
A total of 91 (9%) of 994 eyes had subretinal neovascularization at baseline. By 5 years, the probability of development of subretinal neovascularization was 7%. There were no differences in the progression rates by various baseline characteristics of interest.
Discussion
Longitudinal data of disease progression accrued in this study could potentially segregate patients into subgroups with respect to rate of progression and long-term prognosis. The data show slow but variable VA loss in participants with MacTel Type 2. The variation does not relate to any baseline phenotypic characteristics other than presence and particularly the central location of an EZ loss. In analysis by categorical variables, the calculated probability of a loss of 15 letters or more and of 10 letters or more of distance VA at 5 years of 17% and 32%, respectively, suggests that some degree of meaningful distance VA loss does occur eventually in a substantial proportion of patients. It is apparent that progression of parafoveal changes has no influence on VA until central involvement occurs.15 This accounts for the rapid loss of VA in a proportion of cases and little change in others, and the association of VA loss with progression of EZ loss to the center of the macula.3 Although statistically significant, the additional loss in mean VA in the presence of EZ loss is modest. However, the relative risk of a meaningful loss in distance VA (≥15 letters) is significant (RR = 1.70) in the presence of a central EZ loss. A reasonable conclusion would be that the presence of an EZ loss heralds the phase of structural degradation that finally leads to photoreceptor atrophy. Once the EZ loss progresses to the foveal center, clinically relevant distance visual loss is likely to occur. This is in accordance with findings of Heeren et al15 who show that VA remains stable while functional loss occurs as progression of a paracentral scotoma and that the proximity of these scotomas to the fovea correlates with the level of VA.
Retinal pigment plaques and crystalline deposits are recognized as characteristic changes in MacTel,1 although their relationship to loss of vision is highly variable. Hyperpigmentation seems to be preceded by demise of photoreceptors thus explaining the universal finding of absolute scotomata corresponding to pigment plaques.15 It is likely that pigment hyperplasia is a consequence of, rather than a cause of photoreceptor loss, in a way similar to that of retinitis pigmentosa.2 Increasing hyperpigmentation may not independently signal progression of visual loss, rather reflecting the underlying progression of photoreceptor loss that is integral to the disease process. Increasing hyperpigmentation at 5 years occurred in a third in our series irrespective of other clinical or demographic baseline parameters. The significance of crystals to visual loss is less clear. The nature of the crystals is unknown, and they may be seen in early disease.19 The probability of progression of crystals at 5 years was 40% in our series with a higher risk encountered in younger patients.
The development of a subretinal neovascularization originating from the retinal vasculature constitutes vision-threatening complication in MacTel Type 2 and can occur at any disease stage, although is more frequently associated with hyperpigmentation.2 In this report, the baseline incidence of such lesions was low (3%), as was the yearly risk of progression and the cumulative risk at 5 years (6.3%), rendering them an unlikely cause for the significant proportion of cases with loss of VA. Male patients had a slightly lower risk of development of subretinal neovascularization than female ones.
By contrast, visual function seems to be related to the integrity of the EZ,3,20,21 and, as shown in this study, to visual prognosis. Our analysis revealed a progression relationship between loss of VA and the appearance of an EZ loss and to its extension toward the center over a 5-year period. No baseline phenotypic findings, namely age, sex, or presence of diabetes, were shown to predispose for a higher rate of progression of structural changes in MacTel Type 2. Studies using adaptive optics have shown intact cone structures in areas of EZ loss and recurring EZ in longitudinal analysis.22 Our results did not show such improvements, which does not mean that this did not occur, as our rather categorical grading might not fully reflect small EZ loss changes.
Fluorescein angiography has been considered the gold standard for confirming the diagnosis of MacTel Type 2, although its importance has been superseded by other imaging modalities such as OCT and fundus autofluorescence that are more directly reflecting the structural changes consistent with our revised understanding of disease pathogenesis.2,23 In this study, the mean number of subfields exhibiting diffuse hyperfluorescence at baseline was 2.1 ± 1.6. In the study by Gass and Oyakawa,1 62% of cases presented paracentral hyperfluorescence involving 90° to 180° circumference around the fovea and virtually always encompassing the temporal sector. Progression of FFA findings as measured by the number of hyper-fluorescent subfields was shown to be slow, with a tendency for faster progression in younger participants, female participants and those without a history of diabetes. The lowest progression of hyperfluorescence (0.16 fields/year in patients more than 70 years) may be statistically lower than the highest progression (0.39 fields/year in patients younger than 50 years); however, the clinical significance of this finding is questionable.
The presence of EZ loss was only qualitatively evaluated and was not quantified. We have previously reported on the correlation of the “en face” measurement of the EZ loss with microperimetry.21 To date, other structural alterations that correlate with vision loss, such as loss of outer nuclear layer,15,20,24 have not been analyzed systematically. Therefore, EZ loss might be the best currently available parameter for MacTel disease progression. Other structural alterations that correlate with functional loss such as loss of outer nuclear layer have not yet been analyzed systematically, as there assessment is more difficult than that of EZ loss. As reported, results herein contribute significant new insight into the natural history of MacTel Type 2. Our findings seem to corroborate the slowly progressive course of VA loss in this disease previously implied in smaller case series, although indicating that distance VA loss over time is variable and incomplete as an index of progression. Other measures of visual function, such as microperimetry, reading speed, and near vision, have not been tested in all MacTel study centers and have therefore not been investigated in detail within this article. Except for the presence of an EZ loss, no other phenotypic or demographic findings analyzed had any significant relationship with distance VA or the rate of VA loss. As expected, the presence of a central EZ loss was associated with a higher rate of clinically relevant visual loss, rendering this finding a prognostic marker for higher functional impairment in MacTel Type 2, as we have described in our previous study of en face OCT and microperimetry.21 Ultimately, segregation of patients into groups of varying rates of progression to meaningful visual loss on the basis of baseline fundoscopic or demographic characteristics, such as age, sex, presence of diabetes, crystalline deposits, or hyperpigmentation did not appear possible. Progression patterns of clinical findings and structural changes emerging from this study, however, offer a better understanding of the rate of structural degradation in MacTel Type 2, suggesting photoreceptor loss heralding secondary clinical changes, such as hyperpigmentation. It is of high clinical importance to establish valid surrogate parameters for visual function, both for clinical and scientific purposes. EZ loss is the most promising surrogate parameter for visual function in MacTel to date. Further studies should aim at comparing the progression of EZ loss with functional loss seen for example in microperimetry.
Acknowledgments
Supported by Lowy Medical Research Institute. The funding organization had no role in the design or conduct of this research.
Footnotes
None of the authors has any conflicting interests to disclose.
References
- 1.Gass JD, Oyakawa RT. Idiopathic juxtafoveolar retinal telangiectasis. Arch Ophthalmol 1982;100:769–780. [DOI] [PubMed] [Google Scholar]
- 2.Charbel Issa P, Gillies MC, Chew EY, et al. Macular telangiectasia type 2. Prog Retin Eye Res 2013;34:49–77. [DOI] [PMC free article] [PubMed] [Google Scholar]
- 3.Sallo FB, Peto T, Egan C, et al. The IS/OS junction layer in the natural history of type 2 idiopathic macular telangiectasia. Invest Ophthalmol Vis Sci 2012;53:7889–7895. [DOI] [PMC free article] [PubMed] [Google Scholar]
- 4.Charbel Issa P, Heeren TF, Kupitz EH, et al. Very early disease manifestations of macular telangiectasia type 2. Retina 2016; 36:524–534. [DOI] [PubMed] [Google Scholar]
- 5.Powner MB, Gillies MC, Tretiach M, et al. Perifoveal muller cell depletion in a case of macular telangiectasia type 2. Ophthalmology 2010;117:2407–2416. [DOI] [PMC free article] [PubMed] [Google Scholar]
- 6.Powner MB, Gillies MC, Zhu M, et al. Loss of Muller’s cells and photoreceptors in macular telangiectasia type 2. Ophthalmology 2013;120:2344–2352. [DOI] [PubMed] [Google Scholar]
- 7.Gillies MC, Mehta H, Bird AC. Macular telangiectasia type 2 without clinically detectable vasculopathy. JAMA Ophthalmol 2015;133:951–954. [DOI] [PubMed] [Google Scholar]
- 8.Shen W, Fruttiger M, Zhu L, et al. Conditional Mullercell ablation causes independent neuronal and vascular pathologies in a novel transgenic model. J Neurosci 2012;32:15715–15727. [DOI] [PMC free article] [PubMed] [Google Scholar]
- 9.Barthelmes D, Gillies MC, Fleischhauer JC, Sutter FK. A case of idiopathic perifoveal Telangiectasia preceded by features of cone dystrophy. Eye (Lond) 2007;21:1534–1535. [DOI] [PubMed] [Google Scholar]
- 10.Charbel Issa P, Berendschot TT, Staurenghi G, et al. Confocal blue reflectance imaging in type 2 idiopathic macular telangiectasia. Invest Ophthalmol Vis Sci 2008;49:1172–1177. [DOI] [PubMed] [Google Scholar]
- 11.Charbel Issa P, Finger RP, Kruse K, et al. Monthly ranibizumab for nonproliferative macular telangiectasia type 2: a 12-month prospective study. Am J Ophthalmol 2011;151:876–886.e1. [DOI] [PubMed] [Google Scholar]
- 12.Kupitz EH, Heeren TF, Holz FG, Charbel Issa P. Poor long-term outcome of anti-vascular endothelial growth factor therapy in nonproliferative macular telangiectasia type 2. Retina 2015;35:2619–2626. [DOI] [PubMed] [Google Scholar]
- 13.Toy BC, Koo E, Cukras C, et al. Treatment of nonneovascular idiopathic macular telangiectasia type 2 with intravitreal ranibizumab: results of a phase II clinical trial. Retina 2012;32:996–1006. [DOI] [PMC free article] [PubMed] [Google Scholar]
- 14.Do DV, Bressler SB, Cassard SD, et al. Ranibizumab for macular telangiectasia type 2 in the absence of subretinal neovascularization. Retina 2014;34:2063–2071. [DOI] [PubMed] [Google Scholar]
- 15.Heeren TF, Clemons T, Scholl HP, et al. Progression of vision loss in macular telangiectasia type 2. Invest Ophthalmol Vis Sci 2015;56:3905–3912. [DOI] [PubMed] [Google Scholar]
- 16.Grading diabetic retinopathy from stereoscopic color fundus photographs—an extension of the modified Airlie House classification. ETDRS report number 10. Early Treatment Diabetic Retinopathy Study Research Group. Ophthalmology 1991;98:786–806. [PubMed] [Google Scholar]
- 17.Photocoagulation for diabetic macular edema. Early treatment diabetic retinopathy study report number 1. Early treatment diabetic retinopathy study research group. Arch Ophthalmol 1985;103:1796–1806. [PubMed] [Google Scholar]
- 18.Treatment techniques and clinical guidelines for photocoagulation of diabetic macular edema. Early treatment diabetic retinopathy study report number 2. Early treatment diabetic retinopathy study research group. Ophthalmology 1987;94:761–774. [DOI] [PubMed] [Google Scholar]
- 19.Sallo FB, Leung I, Chung M, et al. Retinal crystals in type 2 idiopathic macular telangiectasia. Ophthalmology 2011;118: 2461–2467. [DOI] [PMC free article] [PubMed] [Google Scholar]
- 20.Charbel Issa P, Helb HM, Rohrschneider K, et al. Microperi-metric assessment of patients with type 2 idiopathic macular telangiectasia. Invest Ophthalmol Vis Sci 2007;48:3788–3795. [DOI] [PubMed] [Google Scholar]
- 21.Sallo FB, Peto T, Egan C, et al. “En face” OCT imaging of the IS/OS junction line in type 2 idiopathic macular telangiectasia. Invest Ophthalmol Vis Sci 2012;53:6145–6152. [DOI] [PMC free article] [PubMed] [Google Scholar]
- 22.Wang Q, Tuten WS, Lujan BJ, et al. Adaptive optics microperimetry and OCT images show preserved function and recovery of cone visibility in macular telangiectasia type 2 retinal lesions. Invest Ophthalmol Vis Sci 2015;56:778–786. [DOI] [PMC free article] [PubMed] [Google Scholar]
- 23.Wong WT, Forooghian F, Majumdar Z, et al. Fundus autofluorescence in type 2 idiopathic macular telangiectasia: correlation with optical coherence tomography and microperimetry. Am J Ophthalmol 2009;148:573–583. [DOI] [PMC free article] [PubMed] [Google Scholar]
- 24.Charbel Issa P, Troeger E, Finger R, et al. Structure-function correlation of the human central retina. PLoS One 2010;5:e12864. [DOI] [PMC free article] [PubMed] [Google Scholar]