Abstract
Background:
Hepatocellular cancer (HCC) remains a major unmet clinical need. Although activating CTNNB1 mutations are seen in prominent subsets of HCC cases, these by themselves are insufficient for hepatocarcinogenesis. Co-expression of mutant CTNNB1 with clinically relevant co-occurrence has yielded HCCs. Here, we identify cooperation between β-catenin and Nrf2 signaling in HCC.
Methods:
Public HCC datasets were assessed for concomitant presence of CTNNB1 mutations and either mutations in NFE2L2 or KEAP1, or Nrf2 activation by gene signature. HCC development in mice and similarity to human HCC subsets was assessed following co-expression of T41A-CTNNB1 with either WT-, G31A- or T80K-NFE2L2. Based on mTORC1 activation in CTNNB1-mutated HCCs, response of preclinical HCC to mTOR inhibitor was investigated.
Results:
Overall, 9% of HCC cases showed concomitant CTNNB1 mutations and Nrf2 activation, subsets of which were due to mutations in NFE2L2/KEAP1. Co-expression of mutated-CTNNB1 with mutant-NFE2L2 but not WT-NFE2L2 led to HCC development and mortality by 12–14 weeks. These HCCs were positive for β-catenin targets like Glutamine synthetase and Cyclin-D1, and Nrf2 targets like NAD(P)H Quinone Dehydrogenase 1 and peroxiredoxin 1. RNA-seq and pathway analysis showed high concordance of preclinical HCC to human HCC subset showing activation of unique (Iron Homeostasis and Glioblastoma Multiforme signaling) and expected (Glutamine Metabolism) pathways. NFE2L2-CTNNB1 HCC mice were treated with mTOR inhibitor everolimus (5mg/kg diet ad libitum), which led to >50% decrease in tumor burden.
Conclusion:
Co-activation of β -catenin and Nrf2 is evident in 9% of all human HCCs. Co-expression of mutant-NFE2L2 and mutant-CTNNB1 led to clinically relevant HCC development in mice, which responded to mTOR inhibitors. Thus, this model has both biological and therapeutic implications.
Keywords: Wnt pathway, mutations, CTNNB1, NFE2L2, KEAP1, Glutamine synthetase, liver tumors, mTOR inhibitor
Introduction
Hepatocellular cancer (HCC) is the 5th common cancer around the world, and among the leading cause of cancer-related deaths (1). HCC occurs in chronic liver disease patients including with viral hepatitis (HBV, HCV), alcoholic liver disease, non-alcoholic fatty liver disease, hemochromatosis, primary biliary cholangitis and primary sclerosing cholangitis. These diseases lead to advanced fibrosis and cirrhosis, which is a major risk factor for HCC development. In some patients with HBV, or a NASH subset, HCC can occur without associated cirrhosis. There have been notable advances made in the therapies for HCC especially with the advent of immuno-oncology. A recent phase III clinical trial (IMbrave150) compared the efficacy of atezolizumab (anti PD-L1) plus bevacizumab (anti-VEGFA) to sorafenib, and showed superiority in survival, achieving a response rate of around 30% (2). Likewise, we have gained much better understanding of the molecular mechanisms of HCC development based on whole genome and exome studies (3, 4). However, there is room for improvement through better understanding of the biology of the disease based on the molecular drivers, which may also allow precision therapies, even for immune checkpoint inhibitors, that are currently lacking (5, 6). Additionally, since HCC is one cancer type increasing in incidence globally, it is an important clinical problem requiring both preclinical and clinical investigations.
A major genetic aberration observed in a significant subset of HCC is mutation in the gene encoding β-catenin. In fact, mutations in CTNNB1 are the second most frequent in HCC affecting around 26–38% of all cases (7, 8). Despite stabilizing, gain-of-function (GOF) mutations mostly affecting exon-3 in CTNNB1, they by themselves are insufficient for hepatocarcinogenesis as shown in many preclinical studies (9–12). Thus, it is important to identify clinically relevant alterations cooperating with β-catenin in liver tumorigenesis. Previously, we have identified cooperation between CTNNB1 mutations and activation of Yes associated protein-1 in hepatoblastomas and with Met or c-Myc activation in subset of human HCCs (12–14).
In the current study, we identify around 9% of HCC cases showing concurrent activation of β-catenin through CTNNB1 mutations and activation of Nuclear-factor-like 2 (Nrf2) signaling pathway, well known for its antioxidant role by transcriptionally activating genes containing antioxidant response elements (ARE) (15, 16). We show activation of Nrf2 signaling in HCC due to GOF mutations in NFE2L2, the gene encoding for NRF2, or loss-of-function (LOF) mutations in KEAP1, encoding for a component of the Nrf2 pathway essential for degradation of NRF2, or through other as yet undiscovered mechanisms. Based on this clinical observation, we co-expressed GOF NFE2L2 mutants along with GOF CTNNB1 mutants in a subset of mouse hepatocytes in vivo using sleeping beauty transposon/transposase and hydrodynamic tail vein injection (SB-HDTVI) (17). This led to development of HCC in mice which displayed expression of β-catenin and Nrf2 targets. Furthermore, molecular profiling of these tumors showed notable similarity to human HCC subset displaying activation of the two pathways. Based on our previous observations of identification of mutant-β-catenin-glutamine synthetase-glutamine-mTORC1 axis, we also found tumors in the current HCC model to be susceptible to mTOR inhibitor. Thus, we have generated a clinically relevant HCC model representing around 9% of all human HCC and shown its use for understanding biology and therapy.
Materials and methods
Plasmids.
T41A substitution was introduced in human WT-CTNNB1-Myc-tag-bearing plasmid via PCR-based site-directed mutagenesis, and the resulting gene was subcloned into the pT3-EF1α plasmid (pT3-EF1α-T41A-CTNNB1) via the Gateway PCR cloning technology (Invitrogen, Carlsbad, CA). Gateway Donor vectors containing either wildtype, T80K- or G31A-mutated human NFE2L2 were purchased from Addgene (catalog numbers #81259, #81511, #81524), and were similarly subcloned into pT3-EF1α-based destination vector. Resulting plasmids, along with the pCMV/SB transposase containing plasmid (described previously) were purified from endotoxin (Endotoxin-Free Maxiprep kit, NA 0410, Sigma-Aldrich, St. Louis, MO) prior to being injected into animals (12, 13, 18). All plasmids for hydrodynamic injection were purified with the Endotoxin-Free Maxiprep kit (NA 0410, Sigma-Aldrich, St. Louis, MO). And the 0.9% saline were bought from TEKNOVA (#S5815) for all the in vivo experiments.
Mice for Hydrodynamic Tail Vein Injection.
FVB/N mice were purchased from the Jackson Laboratory (Bar Harbor, ME) and performed in accordance with protocols approved by the Institutional Animal Use and Care Committee at the University of Pittsburgh School of Medicine and the National Institutes of Health. All animals were maintained in ventilated cages under 12h light/dark cycles with access to enrichment, water and standard chow diet ad libitum unless otherwise specified. All mice used in the experiments were monitored continually.
Statistical Analysis.
All the data are presented as mean ± standard error of mean (SEM) of mean ± standard deviation (SD) for each group. Statistical tests were performed using Prism 8 software (GraphPad Software Inc., La Jolla, CA). P < 0.05 was considered statistically significant (*p<0.05, **p<0.01, ***p<0.001, ****p<0.0001). All statistical analysis on patient samples has been included in the results section and respective p-values included in the pertinent text and figure legends.
Additional methods are presented in Online Supplement.
RESULTS
Hepatocellular cancers bearing mutations in CTNNB1 comprise a distinct subgroup and possess specific molecular identity.
In order to examine if a subset of HCC have a distinct signature conferred by mutations in CTNNB1, we first analyzed the frequency of β-catenin gene mutations in liver hepatocellular carcinomas (LIHC) reported in TCGA database (7). Among the exome sequencing results deposited in TCGA, 50 represent tissues adjacent to HCC and 374 represent HCC cases. Of the 374 HCC cases, 99 showed CTNNB1 mutations (26%) and RNA-seq was available for 98 patients. The remaining 278 cases lacked CTNNB1 mutations and RNA-seq was available for 276. Differential gene expression analysis, comparing the 276 CTNNB1 mutation-negative tumors and 98 CTNNB1-mutated tumors, allowed detection of 1075 up-regulated and 3463 down-regulated genes by FDR=5% and absolute fold change greater than 2. Normalized expression of these 4538 altered genes was visualized in a heatmap where each row represents a gene and each column represents a sample (Figure 1A). Similarly, we identified CTNNB1 mutations in the whole coding sequences of liver tumors reported elsewhere (8). Transcriptome expression data was collected across 10 normal samples, 19 CTNNB1 mutation positive tumors and 62 CTNNB1-non-mutated tumors. When comparing these two groups, 505 up-regulated and 724 down-regulated genes were detected (Figure 1B) by means of differential gene expression analysis (FDR=5%). As evident from the heatmaps (Figure 1A, 1B), in both independent cohorts, CTNNB1 mutations result in a specific signaling signature that is absent in the rest of HCCs.
Figure 1: Effect of CTNNB1 mutation on gene expression, and frequency of CTNNB1 mutation with mutations in Nrf2 pathway components, in HCC in TCGA and French Cohort.
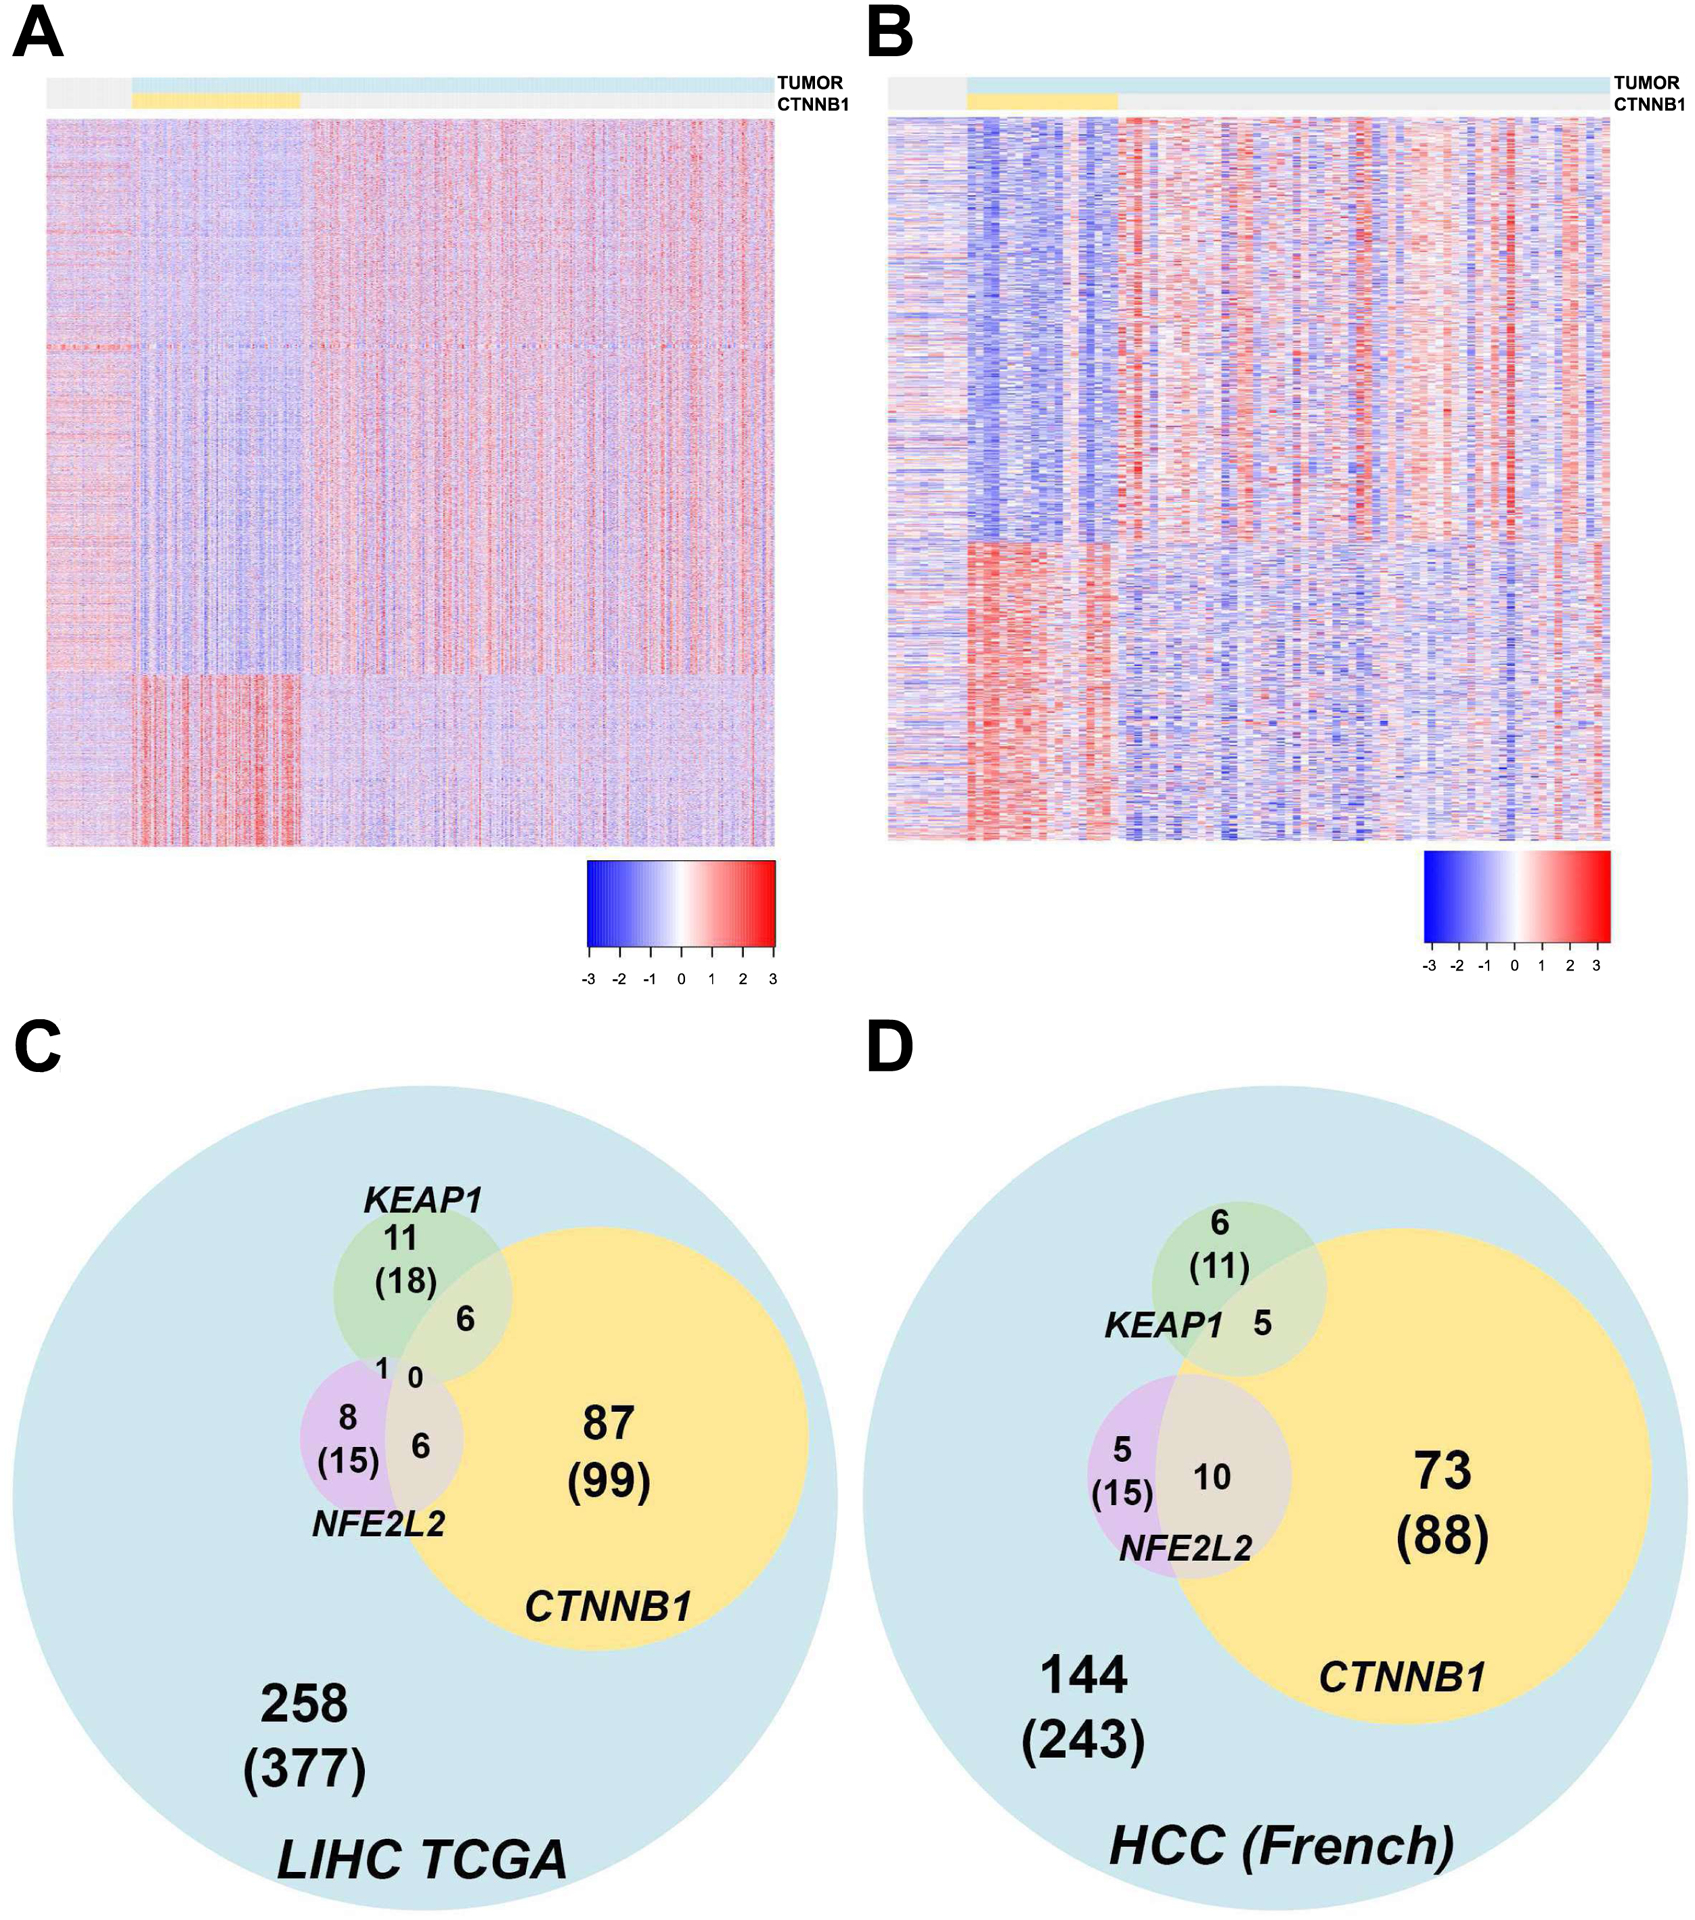
Heatmap depicting differentially expressed genes in CTNNB1-mutated HCC versus, normal or tumor adjacent normal and non-CTNNB1-mutated HCCs in TCGA LIHC (A) an independent European cohort (B). Each row represents a DEG and each column represents a sample. All HCC cases are highlighted in blue and those with CTNNB1 mutations, in yellow. Venn diagrams showing the overlap of cases with mutations in CTNNB1, KEAP1 and NFE2L2 in TCGA LIHC (C) and in the European cohort (D). All HCC cases, CTNNB1-mutated cases, KEAP1-mutated and NFE2L2-mutated cases are identified in blue, yellow, green, and purple, respectively.
Mutations in CTNNB1 and Nrf2 activation co-occur in a subset of HCC cases and confer specific gene expression to this HCC subset.
Since β-catenin activation alone is insufficient for HCC development, many studies have focused on common correlations of CTNNB1 mutations with other aberrations. Mutations in CTNNB1 have been seen to significantly co-occur with mutations in NFE2L2 among other genes (8). NFE2L2 encodes for NRF2, a transcription factor and a major effector of the Nrf2 pathway known for its role in regulating redox homeostasis as well as with a known role in tumorigenesis including HCC (16, 19). Next, we examined prevalence of mutations in the main components of the Nrf2 signaling, including NFE2L2 and KEAP1 in TCGA and another independent database.
Examination of TCGA database revealed mutations in NFE2L2 in 15 of the 377 HCC cases in LIHC (Figure 1C). In another mostly mutually exclusive group, mutations in KEAP1 were observed in 18 out of the 377 HCC cases. One case had mutations in both NFE2L2 and KEAP1. Interestingly, among the 99 CTNNB1-mutated HCC cases, NFE2L2 mutations co-occurred in 6 cases, while 6 additional cases showed mutations in KEAP1 (Figure 1C). Thus, concurrent mutations in CTNNB1 and NFE2L2 or KEAP1 were detected in a little more than 3% (12 out of 377) of cases reported in TCGA LIHC. Similarly, in the French HCC cohort, mutations in NFE2L2 and KEAP1 were seen in 15 (6%) and 11 (4.5%) of the 243 HCC cases, respectively. Among the subset of tumors with CTNNB1 mutations (n=88), NFE2L2 mutations were detected in 10 cases (11%) and KEAP1 in 5 cases (5.6%) of cancers (Figure 1D). In total, more than 6% (15 out of 243) of the HCC patients have double mutations in CTNNB1 and either KEAP1 or NFE2L2. Thus, of the 620 total HCC cases, 187 showed mutations in CTNNB1 (~30%), of which 27 cases showed mutations in two major Nrf2 pathway components (~14%). Together, >4% of all HCC cases have concomitant β-catenin gene mutations with mutations in NFE2L2 or KEAP1.
In order to explore any molecular effects conferred by KEAP1/NFE2L2 mutations to the subset of CTNNB1-mutated HCCs, we compared RNA-seq expression data of 12 double-mutation cases (6 cases with CTNNB1 and KEAP1 mutations and 6 cases with CTNNB1 and NFE2L2 mutations) and 86 CTNNB1-mutated cases without these mutations from the TCGA LIHC (Figure 1C). Differentially expressed genes were detected and visualized by heatmap (Figure 2A), where the subset of double-mutation cases segregated from both the CTNNB1-only mutated cases as well as the non-CTNNB1-mutated remainder of the tumors. This result suggests cooperation between β-catenin and Nrf2 pathways in tumorigenesis, and the presence of additional unique molecular effects of KEAP1/NFE2L2 mutations on the CTNNB1-mutated phenotype.
Figure 2: Effect of Nrf2 pathway mutations/activation on gene expression in HCC with and without CTNNB1-mutations.
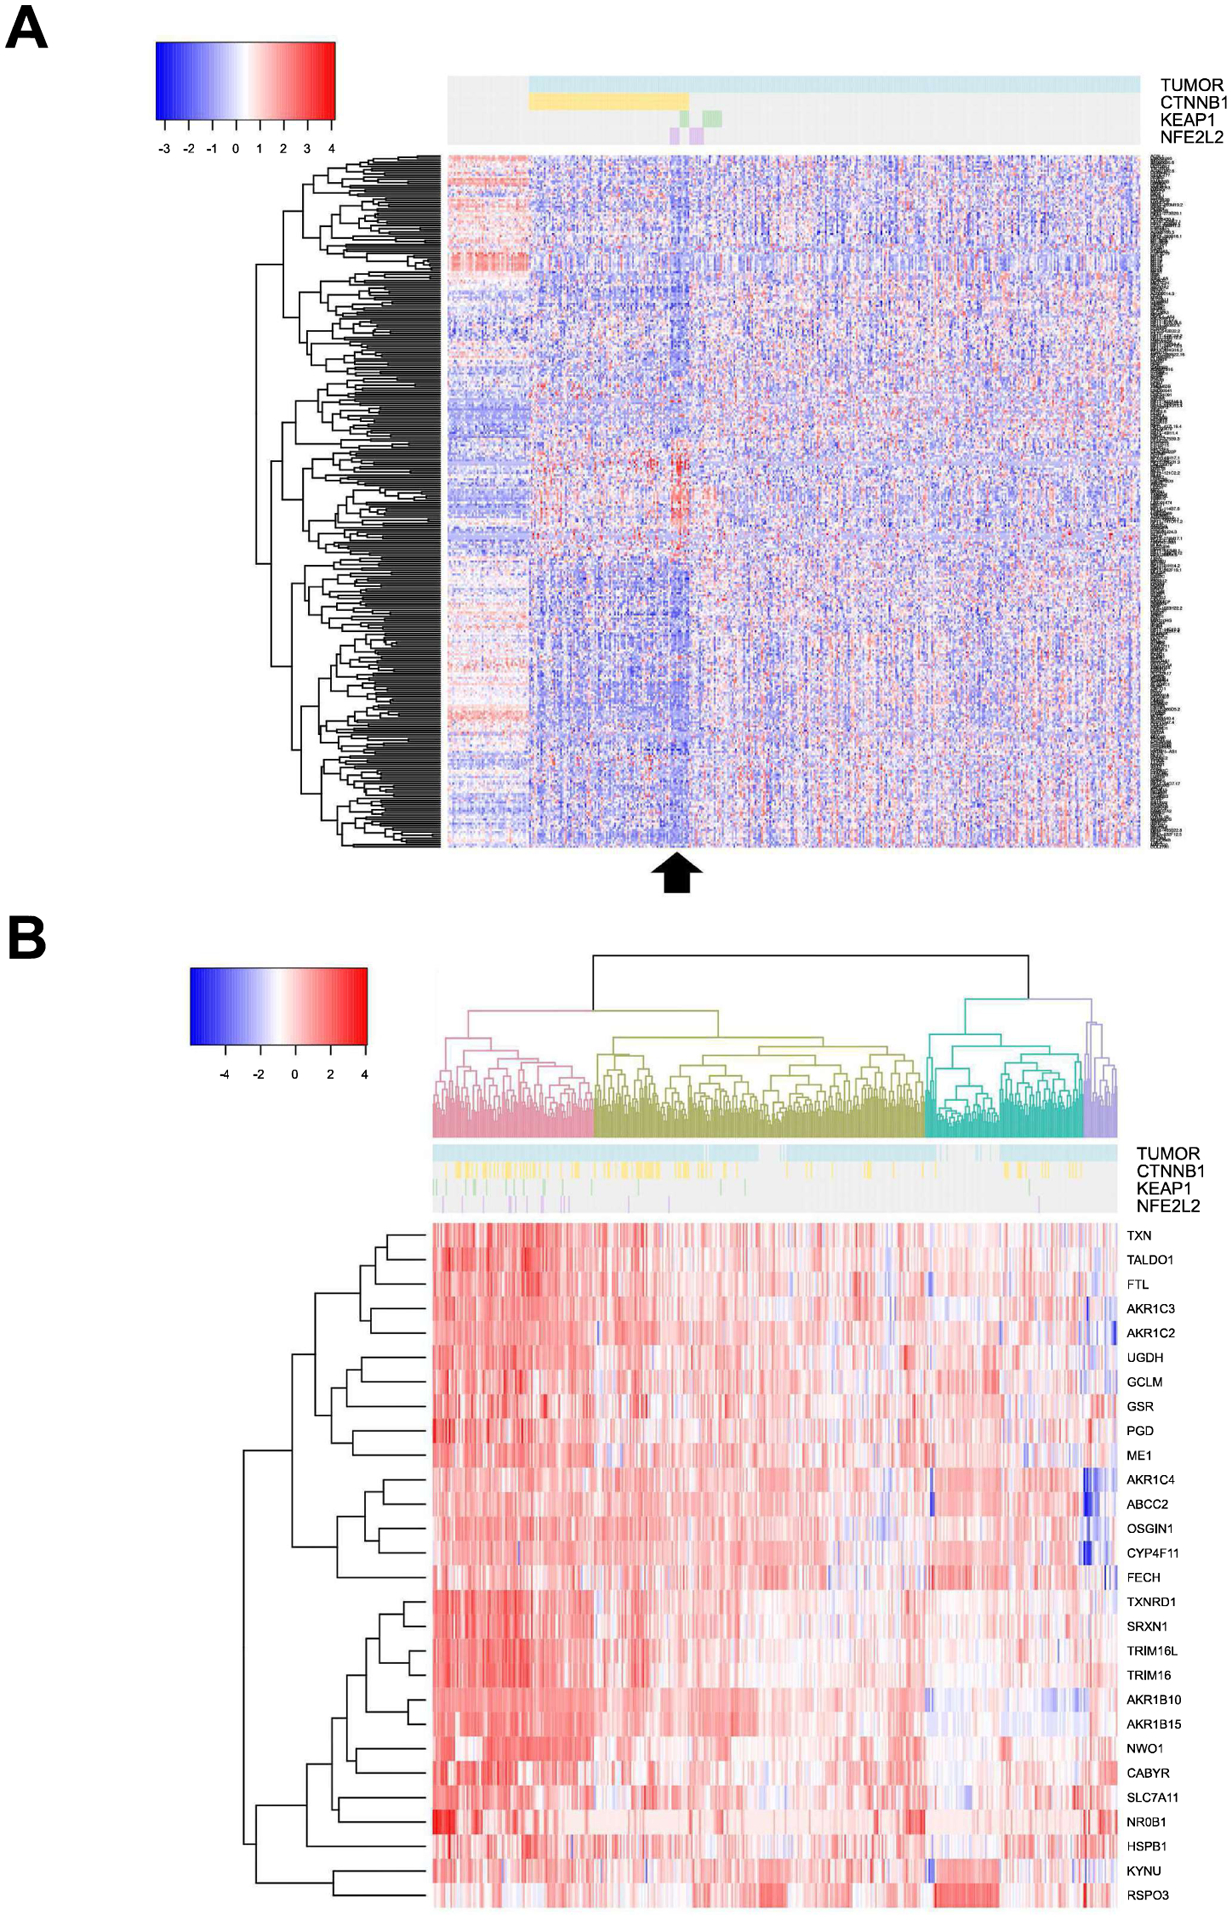
(A). Heatmap of differentially expressed genes comparing 12 HCC cases with mutations in CTNNB1 and either KEAP1 (n=6) or NFE2L2 (n=6) versus 86 cases with CTNNB1 mutations without mutations in Nrf2 pathway components in the TCGA LIHC database. Arrow below identifies these 12 HCC cases. (B) Hierarchical cluster analysis based on 28-gene signature previously identified as a biomarker of Nrf2 pathway activation identifies four clusters identified in different colors with Nrf2-active tumors identified in pink. Of the CTNNB1-mutated cases, 35 were Nrf2-active. For both (A) and (B), each row represents a DEG and each column represents a case. Tumors are identified in blue, CTNNB1-mutated cases in yellow, KEAP1-mutated cases in green and NFE2L2-mutated cases in purple.
As a next step, we investigated if activation of Nrf2 pathway was seen independent of KEAP1 and NFE2L2 mutations and in a larger cohort of HCC patients. Previous study identified a set of 28 KEAP1/NFE2L2 biomarkers (20). Hierarchical clustering was employed to the TCGA LIHC cases using the 28-gene signature of Nrf2 activation, which grouped all tumors into four clusters (Figure 2B). One hundred cases in the pink cluster of Figure 2B were identified with high expression of the biomarker genes suggesting around 26% of all HCC cases to be Nrf2-active. Among these, CTNNB1 mutations were evident in 35 samples. This analysis suggested 35 of the 98 CTNNB1-mutated HCCs to exhibit Nrf2 activation amounting to ~35% of all CTNNB1-mutated HCC or 9% of all HCC to have dual β-catenin and Nrf2 activation. Finally, this analysis also showed that most cases with NFE2L2 and KEAP1 mutations were clustered with Nrf2-active group supporting NFE2L2 mutations to be GOF and mutations in KEAP1 to be LOF (Figure 2B). However, majority of HCC cases exhibiting Nrf2 activation did not show mutations in either NFE2L2 or KEAP1 suggesting other mechanisms of Nrf2 activation.
Lastly, we wanted to determine concomitant β-catenin and Nrf2 activation in HCC cases by determining the expression of known β-catenin target Glutamine synthetase (GS) (12, 14, 21) and Nrf2 target NAD(P)H Quinone Dehydrogenase 1 (Nqo1) (22, 23) in the same tumor or tumor nodules using IHC. Overall, in the UPMC cohort of 59 available cases, most whole sections showed multiple and heterogeneous tumor nodules. Of these 59 cases, 23 showed one or more tumor nodules that were homogeneously GS-positive (~39%) in whole sections, while 32 were strongly positive for Nqo1 (~54%) in one or more tumor foci. Overall, 7 of the 59 (<12%) cases showed presence of GS and Nqo1 in the same one or more nodules in the whole section (Figure 3A and Table S1). The remaining cases showed independent tumor nodule positivity for either GS or Nqo1 or were negative for both markers (Figure 3B and Table S1). Altogether, Nrf2 and β-catenin co-activation occurs in around 9–12% of all HCC cases based on analyses by multiple assays.
Figure 3: Immunohistochemistry for β-catenin target GS and Nrf2 target Nqo1 shows concomitant tumor nodule positivity in a subset of HCC cases.
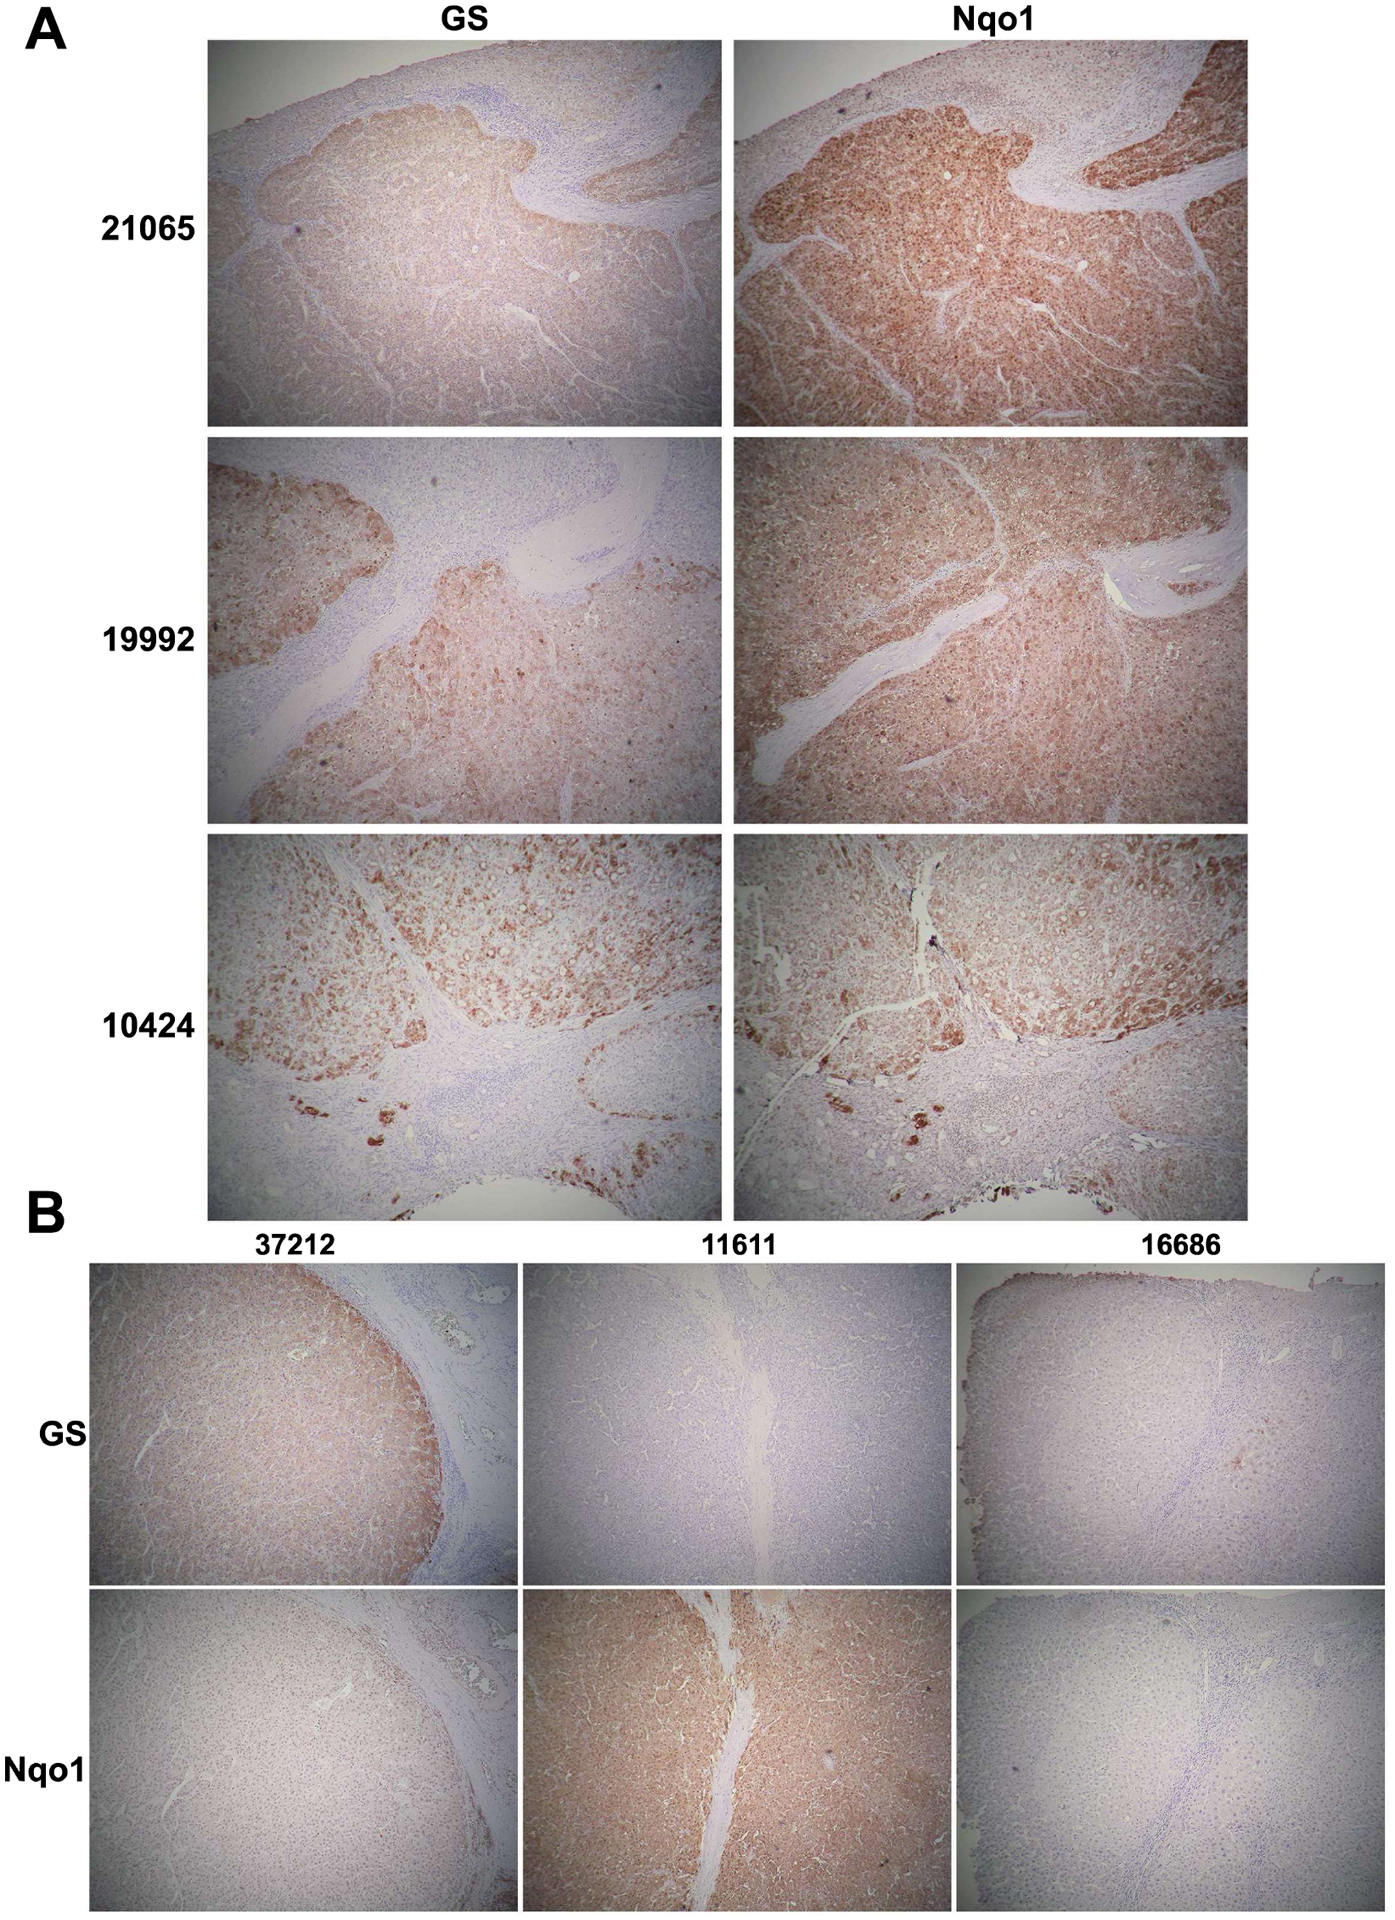
(A) IHC for GS and Nqo1 in serial sections in 3 representative HCCs (patient ID on the left and in Table S1) showing simultaneous positive staining in most (21065 and 10424) or some (19992) tumor nodules. (B) IHC on serial HCC sections for GS and Nqo1 showing various configurations including a nodule being positive for GS but negative for Nqo1 (37212); negative for GS but positive for Nqo1 (11611); or negative for both (16686). Such information for all 59 cases is available in Table S1. (All images at 50x magnification)
Concomitant expression of mutant-GOF β-catenin and NFE2L2 in a subset of murine hepatocytes in vivo induces tumorigenesis.
To functionally test the clinical observation of co-existence of β-catenin mutations and Nrf2 activation in subset of HCC patients, we forced expression of GOF mutants of β-catenin and NFE2L2 in around 6-week old FVB male mice by means of sleeping beauty transposon/transposase and hydrodynamic tail vein injection (SB-HDTVI), as described in methods and elsewhere (Figure 4A) (12, 18, 24). We utilized T41A-CTNNB1-mutant, since it was more frequent than conventionally used S45Y and S33Y mutants. In TCGA, 5 HCC cases showed T41A while 3 cases each showed S33Y and S45Y mutation. In French cohort, T41A mutation was seen in 13 cases, S33Y in 2 and S45Y in one. However, all of these GOF mutations are expected to stabilize and activate β-catenin comparably. For Nrf2 activation, we used GOF G31A-NFE2L2 and T80K-NFE2L2, since these were readily available commercially. Since mutant-CTNNB1 alone has been shown previously to not induce HCC, as controls we injected WT-NFE2L2-T41A-CTNNB1 or G31A-NFE2L2 alone in similarly-aged mice. Mice in either control groups followed up to 26 weeks, lacked gross or microscopic evidence of tumorigenesis and hence showed normal survival, whereas survival of mice co-expressing mutant-CTNNB1 together with either G31A-NFE2L2 or T80K-NFE2L2, showed progressive morbidity due to increased abdominal girth requiring euthanasia and hence displayed significantly shorter survival than the aforementioned controls (Figure 4B). The G31A-NFE2L2-T41A-CTNNB1 mice needed to be euthanized by around 12 weeks and T80K-NFE2L2-T41A-CTNNB1 by 14 weeks, showing significantly shorter survival than controls (p<0.05 by both Mantel-Cox, and Gehan-Breslow-Wilcoxon, tests) (Figure 4B). Intriguingly, the survival was significantly different between G31A-NFE2L2-T41A-CTNNB1 and T80K-NFE2L2-T41A-CTNNB1 groups by the same tests (p<0.05).
Figure 4: Effects of co-expression of mutated-CTNNB1 and mutated-NFE2L2 on hepatic tumorigenesis and survival in mice.
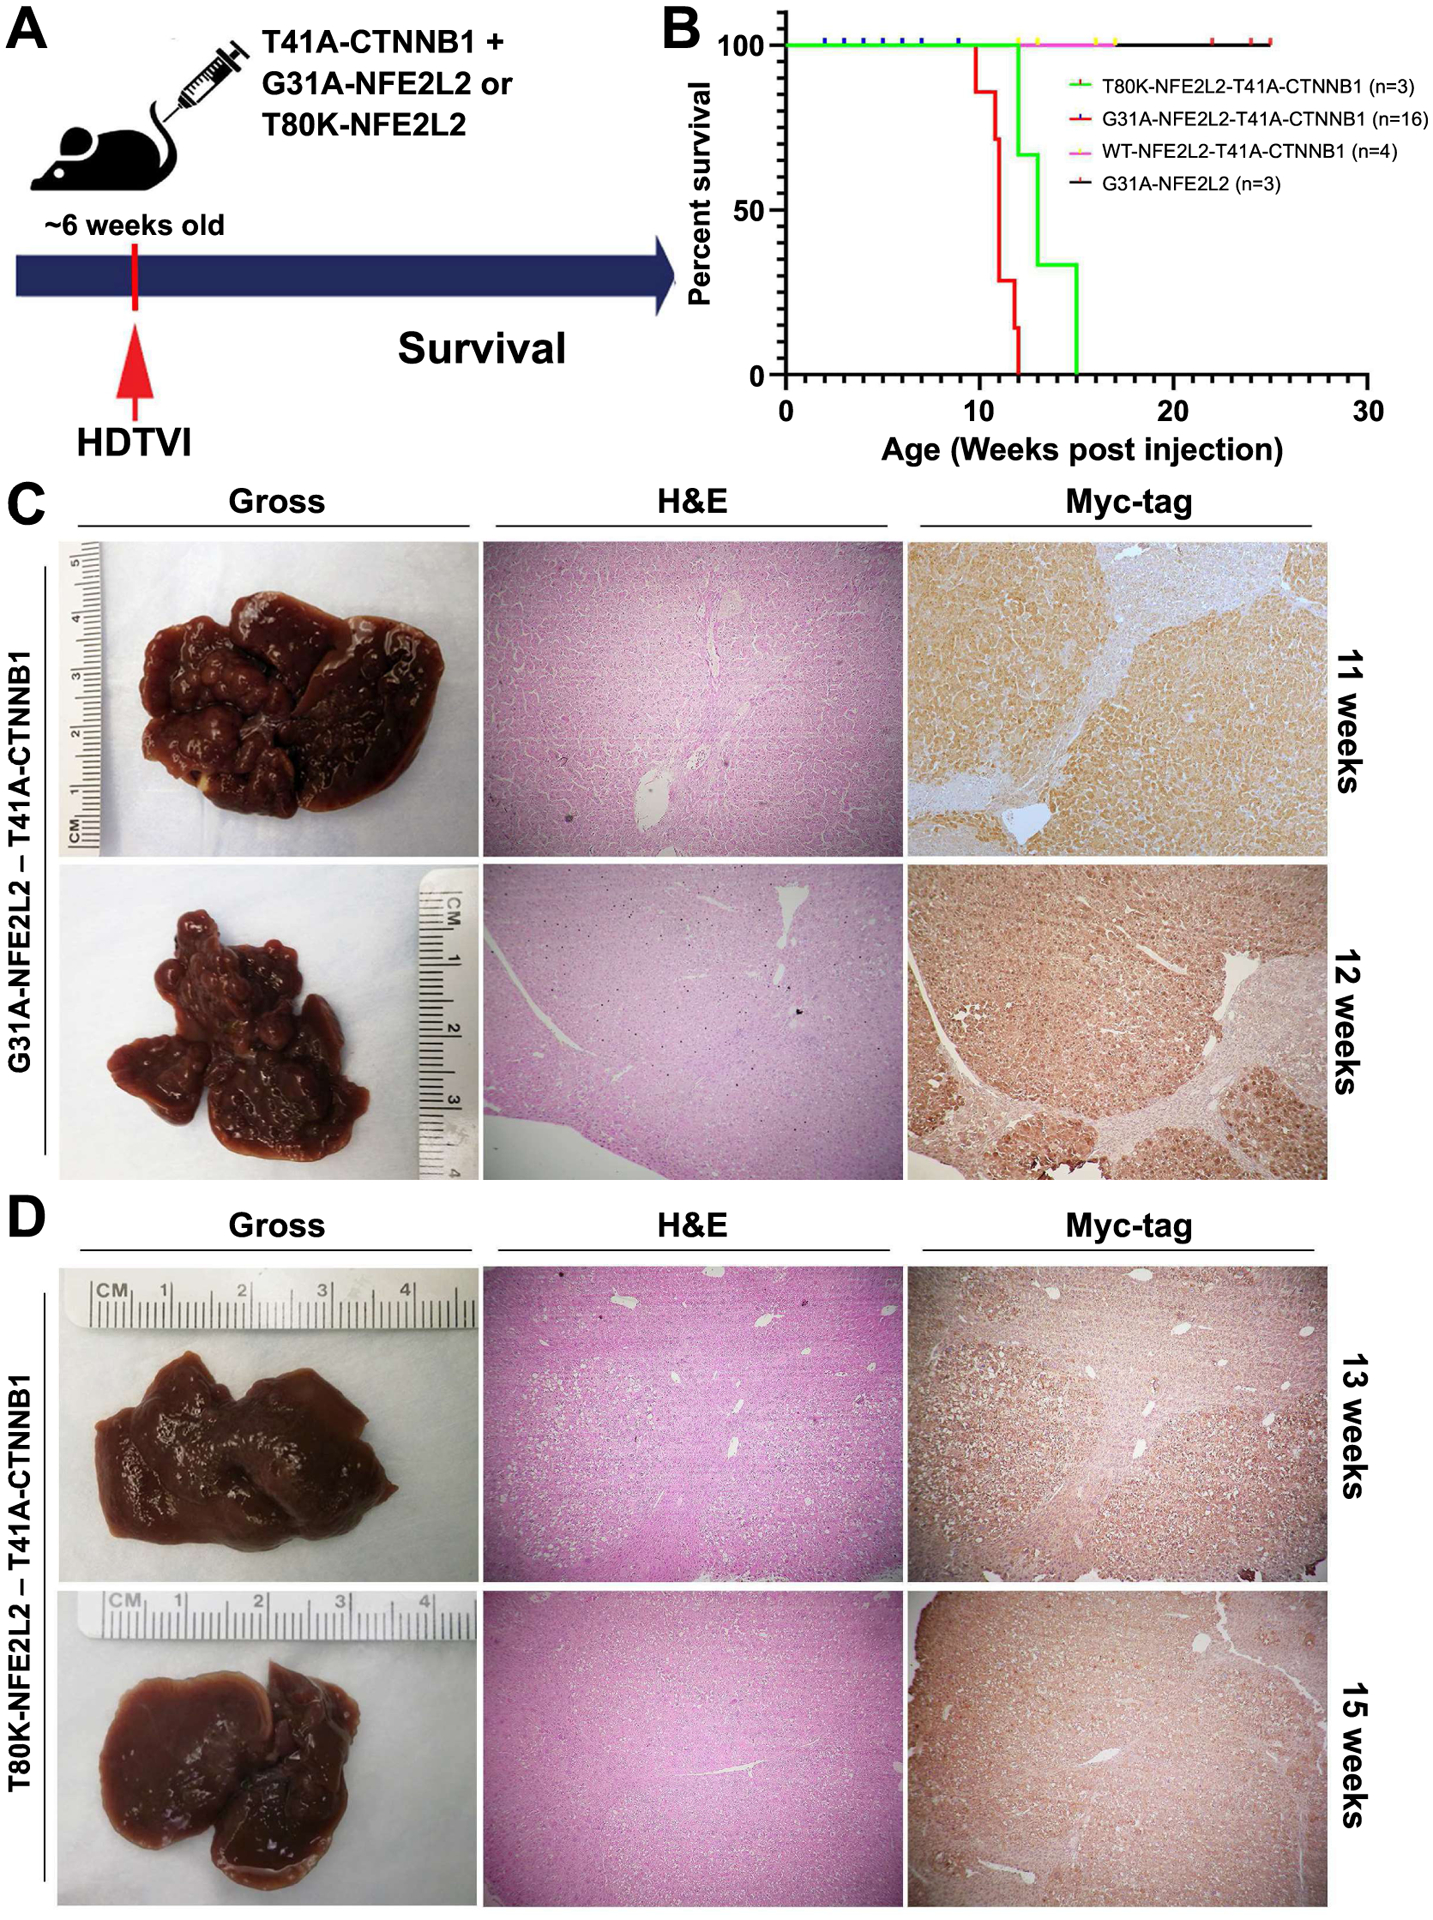
(A) Schematic showing the establishment of the murine model using SB-HDTVI of T41A-CTNNB1 (β-catenin GOF) with either G31A-NFE2L2 or T80K-NFE2L2 (Nrf2 GOF) in 6-week-old FVB mice. (B) Kaplan-Meier curve showing decreased survival (time to morbidity) of T41A-CTNNB1-G31A-NFE2L2 and T41A-CTNNB1-T80K-NFE2L2 mice compared to T41A-CTNNB1-WT-NFE2L2 or G31A-NFE2L2 alone. (C) Macroscopic images of the whole livers and staining of representative liver sections from T41A-CTNNB1-G31A-NFE2L2-injected group at 11-week (upper panel) and 12-week (lower panel) post injection time-point. Both gross images and H&E staining indicates the presence of advanced tumors in this model. IHC on a consecutive section for Myc-tag verifies the tumor is derived from T41A-CTNNB1-transfected cells. (D) Macroscopic images of the whole livers and staining of representative liver sections from T41A-CTNNB1-T80K-NFE2L2-injected group at 13-week (upper panel) and 15-week (lower panel) time-point. Both gross images and H&E staining indicate the presence of advanced tumors derived from T41A-CTNNB1 expressing cells, as evident in IHC for Myc-tag in a consecutive section. (Magnification for microscopic images: 50x)
Co-expression of mutant β-catenin and either G31A-NFE2L2 or T80K-NFE2L2 resulted in development of HCC (Figure 4C, 4D), which did not occur in mice in either control group even at 26 weeks (not shown). Gross morphology displayed large nodular livers at 11 weeks and 12 weeks in G31A-NFE2L2-T41A-CTNNB1 (Figure 4C). Representative histology showed large, well-differentiated and well-circumscribed HCC foci squeezed between adjacent nodules composed of differentiated but somewhat smaller hepatocytes that were eosinophilic, and presented some fatty change but minimal nuclear atypia, and nodules were positive for immunohistochemistry (IHC) for Myc-tag, which detects T41-CTNNB1-plasmid (Figure 4C). Both grossly and microscopically, tumor nodules were smaller in T80K-NFE2L2-T41A-CTNNB1 group, even at 13 and 15 weeks after injection, but showed similar histological features as the other group (Figure 4D). Taken together, mutant CTNNB1 and mutant NFE2L2 cooperate in vivo to induce HCC.
Murine tumors resulting from G31A-NFE2LE-T41A-CTNNB1 or T80K-NFE2LE- T41A-CTNNB1 co-expression exhibited significant similarity in gene expression.
Next, we wanted to compare the tumors occurring in both NFE2L2-mutants especially since the tumorigenesis appeared to be faster in G31A-NFE2LE-T41A-CTNNB1 group (Figure 3B). Transcriptomic analysis was performed on tumor-bearing livers from G31A-NFE2LE-T41A-CTNNB1 group (designated as Model 1; n=3), T80K-NFE2L2-T41A-CTNNB1 group (Model 2; n=3), and compared with livers from age-matched normal FVB mice (CTRL; n=3) (Figure 5A). Principal component analysis was performed based on the genome-wide gene expression of these 9 samples. Livers from mice from each group clustered together and Model 1 and 2 were closer spatially to each other in gene expression than the controls (Figure 5B). To study the gene signatures, differentially expressed genes (DEGs) were identified comparing CTRL and HCC-bearing mice (pooling Model 1 and Model 2). Eventually, 229 up-regulated genes and 145 down-regulated genes were selected by FDR control (5%) and absolute log2 fold-change (>=1) (Figure 5C). The individual genes are listed (Figure S1) and the expression intensities of these DEGs in Model 1 versus 2 as compared to CTRL are visualized in a heatmap (Figure 5D). Pathway analysis on the DEGs identified activation of several relevant pathways that could be contributing to disease biology including Glutathione mediated detoxification, Nrf2-mediated oxidative stress response, Iron homeostasis signaling, Xenobiotic metabolism signaling, Glutamate receptor signaling and Glutamine Biosynthesis, among others (Figure S2). Based on these DEGs, pairwise correlation was performed across all 9 liver samples mice, which showed the 3 control livers and 6 tumor-bearing livers highly correlated to one another within their own groups (Figure 5E). Thus, co-expression of either mutant-NFE2L2 along with mutant-CTNNB1 led to HCCs that were molecularly similar to each other, although the disease was more profound in the G31A-NFE2L2-T41A-CTNNB1 model, which is what we focused on, in the remainder of this study.
Figure 5: Transcriptomic analysis reveals similarities in gene expression in HCC in T41A-CTNNB1-G31A-NFE2L2 and T41A-CTNNB1-T80K-NFE2L2 mice.
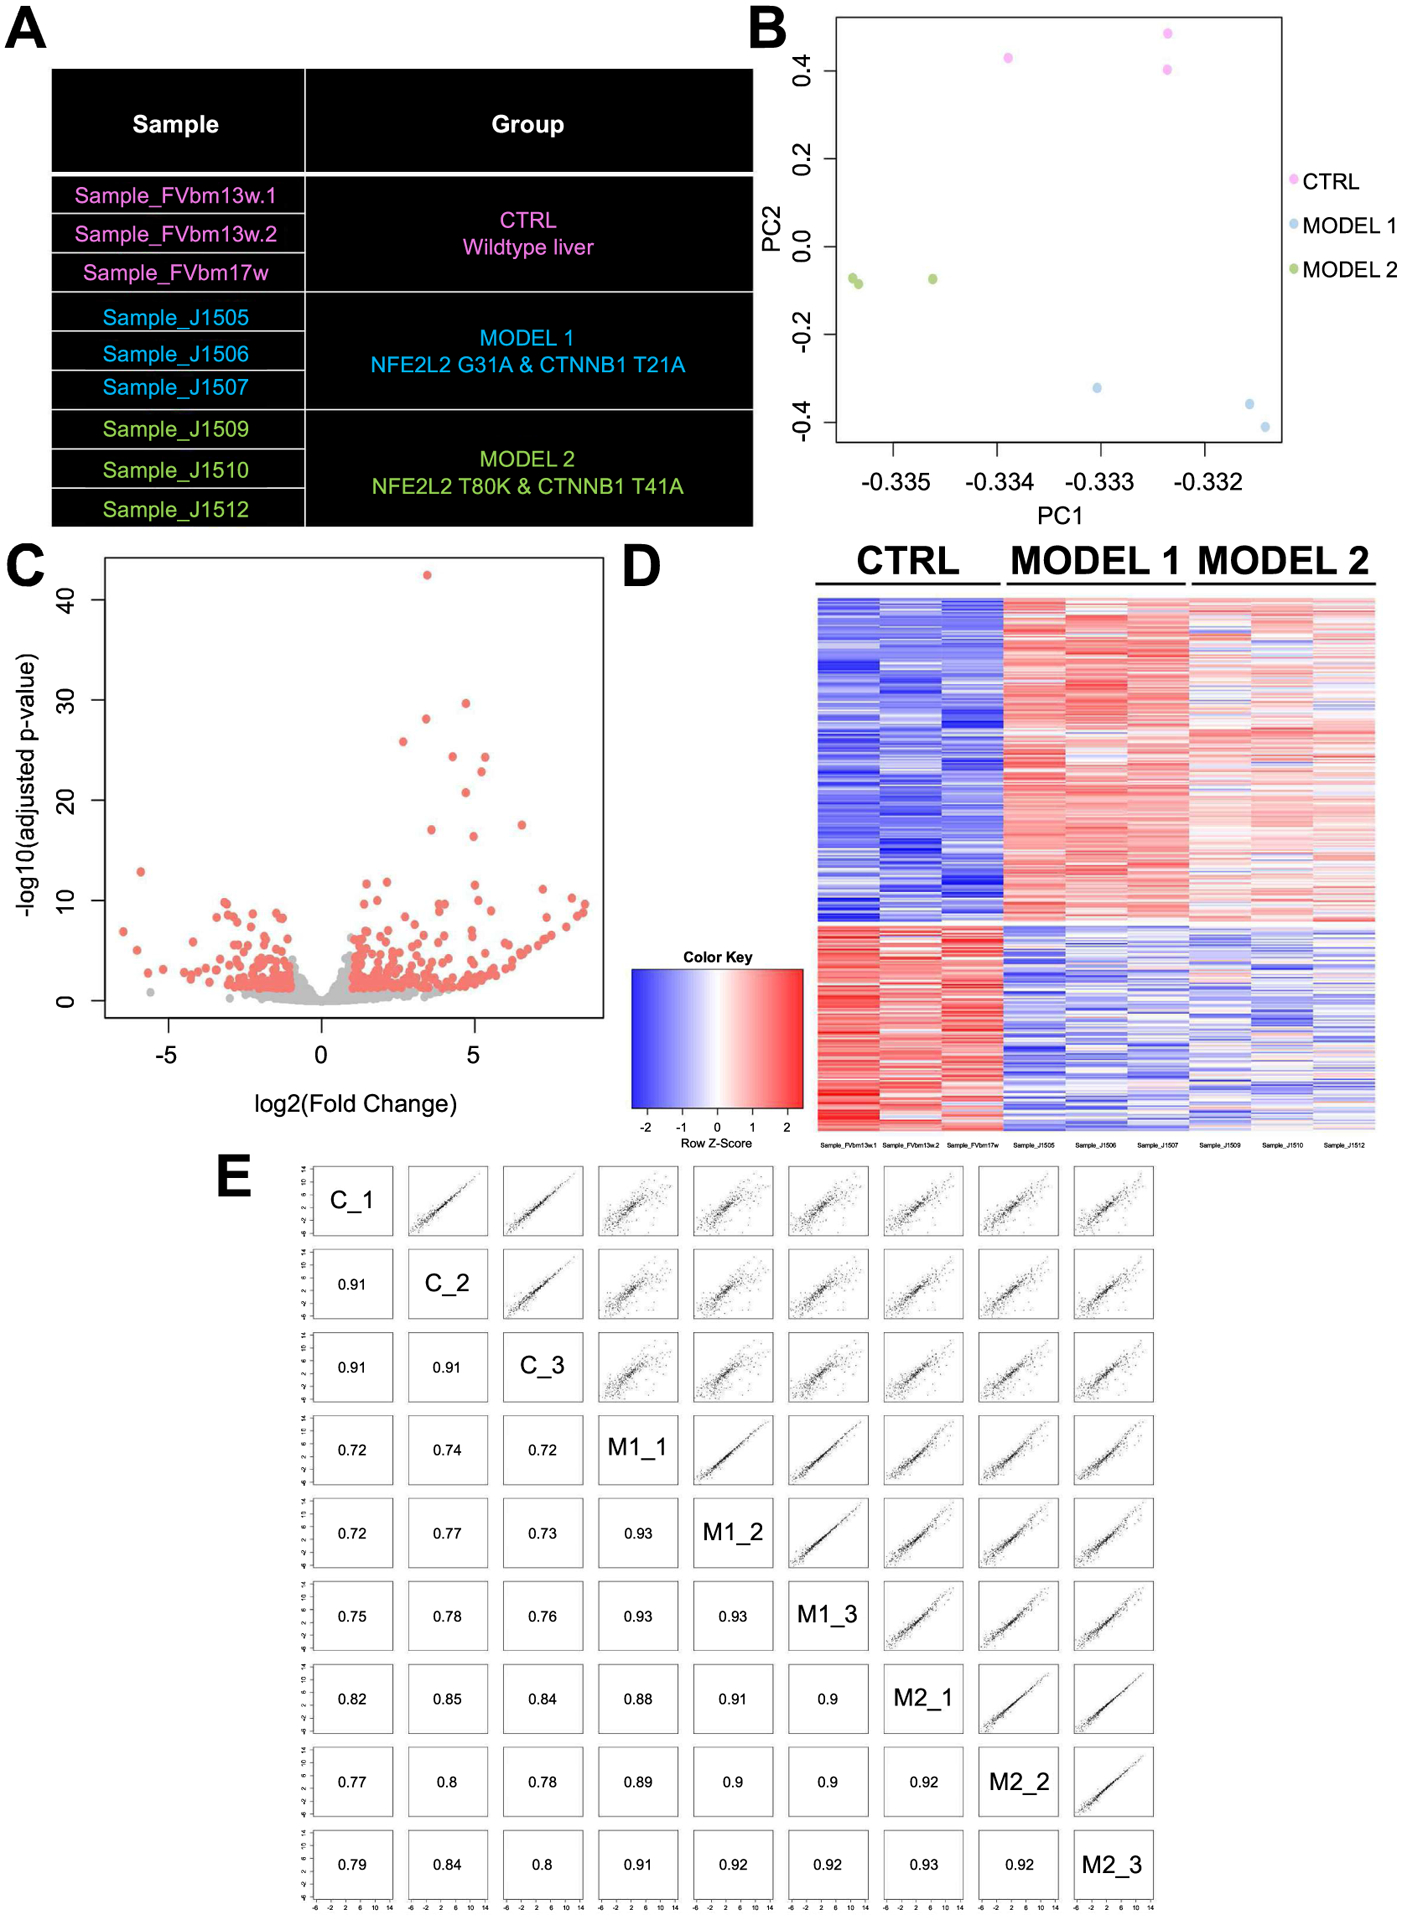
(A) Description of models employed in the analysis. Control group comprised of livers from 3 age-matched normal FVB mice. Model 1 included livers from T41A-CTNNB1-G31A-NFE2L2-injected mice at 11 weeks after injection, and Group 2 comprised of livers from T41A-CTNNB1-T80K-NFE2L2 group >12 weeks post injection. (B) Principal component analysis showing clustering of the samples from each of the group as distinct entities, with samples from Model 1 and Model 2 being dimensionally closer to one another than control group. (C) Volcano plot comparing genome-wide gene expression in controls and HCC-bearing livers from combined Models 1 and 2. Differentially expressed genes are identified by red color. (D) Heatmap visualizing the intensity of difference in gene expression across control (CTRL) and 2 HCC models. (E) Pairwise correlation plot based on the identified DEGs shows high degree of correlation/similarity between Model 1 (M1_1–3) and M2_1–3 compared to controls (C_1–3) with Pearson correlation coefficients indicated in corresponding squares.
Histological evidence that tumors in G31A-NFE2LE-T41A-CTNNB1 model exhibit simultaneous activation of β-catenin and NRF2 signaling pathways.
Next, we examined if the tumors, developing in the G31A-NFE2LE-T41A-CTNNB1 model, stemmed from concomitant activation of β-catenin and Nrf2 signaling. The activation status of the main components of both pathways were interrogated at early (7 weeks post injection) and late (11 weeks post injection) stages of tumorigenesis by IHC. To first confirm that the tumor nodules observed in this model at both stages were composed of cells that arose from the delivered plasmid, we first performed IHC for Myc-tag which was present in the SB-plasmid encoding for T41A-CTNNB1. Indeed, HCCs observed by H&E staining were positive for Myc-tag at both 7- and 11-weeks (Figure 6A, 6B). Next, for β-catenin targets, we examined GS and cyclin-D1 (12, 21), and for Nrf2 targets, we assessed NAD(P)H dehydrogenase 1 (NQO1) (25) and peroxiredoxin 1 (PRDX1) (16), by IHC in serial sections. Most tumors were simultaneously positive for all of the targets at both stages (Figure 6A, 6B). Occasionally, we observed a GS-negative or partial GS-positive tumor, likely due to some tumor heterogeneity or tumor evolution (right nodule, Figure 6B). Overall, these representative IHC results demonstrate simultaneous activation of both β-catenin and Nrf2 pathways in the current HCC model.
Figure 6: IHC for β-catenin and Nrf2 targets reveals their simultaneous activation in murine tumors in T41A-CTNNB1-G31A-NFE2L2 model.
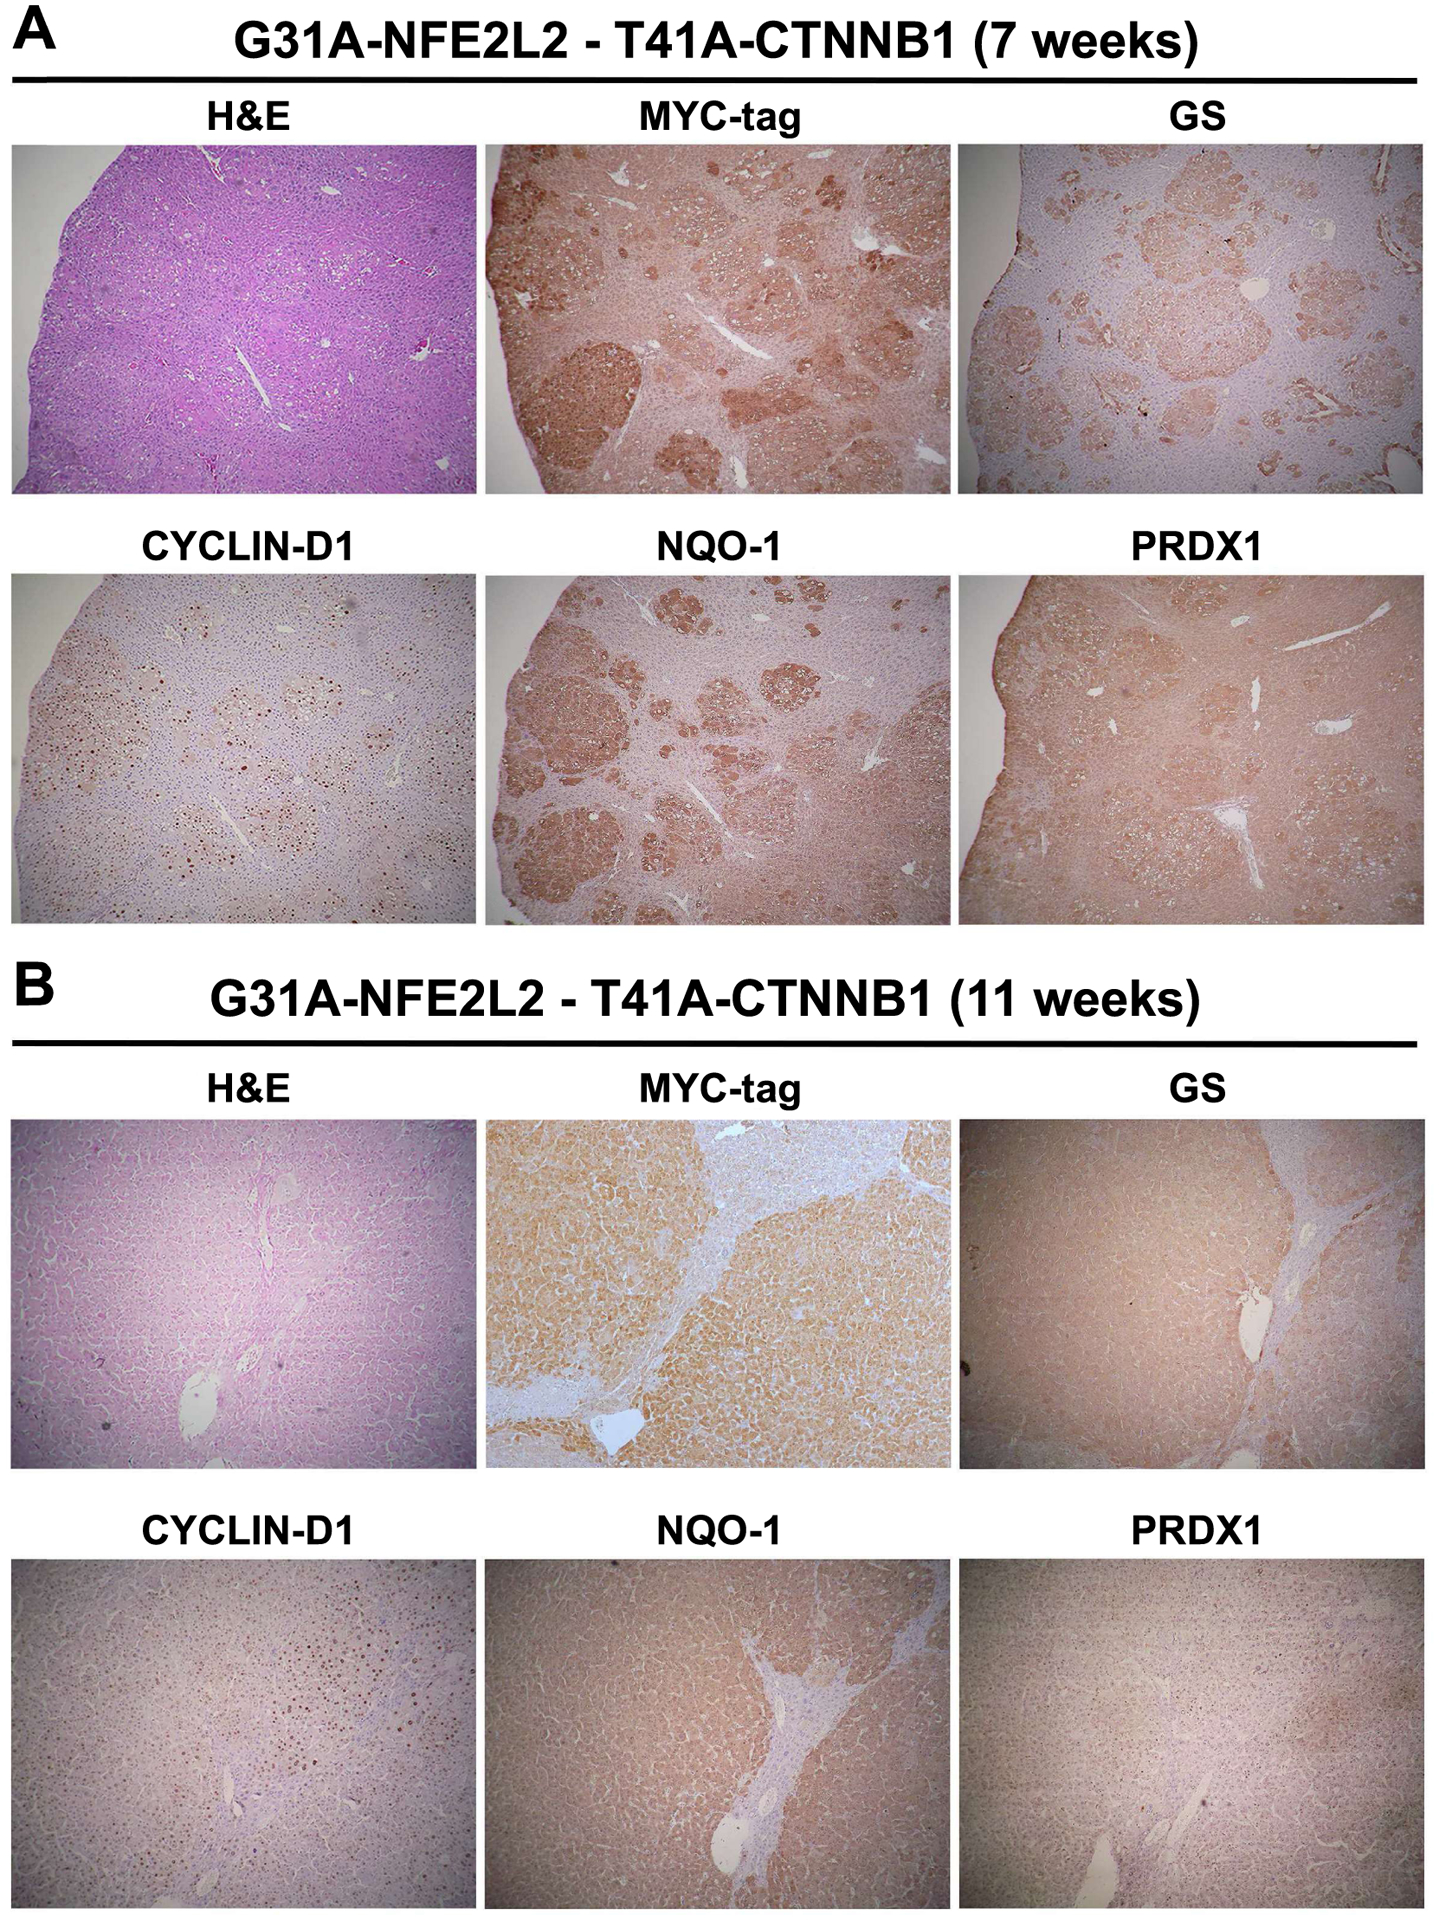
Representative IHC on serial sections after injection in T41A-CTNNB1-G31A-NFE2L2 livers shows tumor foci to be positive β-catenin targets GS and Cyclin D1, and Nrf2 targets NQO1 and PRDX-1 at 7 weeks (A) and 11 weeks after injection (B). (Magnification: 50x)
To address the biological impact of β-catenin and Nrf2 activation on tumorigenesis, we next assessed tumors for cell proliferation through IHC for PCNA to identify extent of tumor cells in S-phase of cell proliferation. Earliest transfected cells composed of single cells or 2–5 cell clusters at 2 weeks after SB-HDTVI were positive for PCNA (Figure S3). Tumor foci at 5- and 7-weeks after injection showed gradual increase in size. A subset of tumors cells in these nodules were clearly PCNA-positive cells at both stages (Figure S3). At 11 weeks, when tumor nodules were large and occupied most of the livers, PCNA-positive cells were seen mostly towards the tumor periphery while the rest of the lesion was PCNA-negative (Figure S3).
Murine tumors resulting from NFE2L2 and CTNNB1 mutations show similarity in molecular signatures to human HCCs subsets with similar perturbations.
The ultimate goal for our novel mouse model is to mimic a subset of human HCC patients to uncover unique biology, biomarkers and potential new therapeutic targets (24). In order to evaluate the similarity, DEG and pathway analysis were performed on the mouse model and human study independently. As mentioned previously, in the mouse model, a total of 374 DEGs were detected comparing control livers and pooled HCC-bearing murine livers (Figure 5, S1). On these DEGs, 64 significantly enriched pathways (FDR=0.1) were identified by Ingenuity pathway analysis (IPA). In human TCGA LIHC database, when comparing 50 adjacent normal cases and 12 double-mutation cases (Figure 1C), we detected 9479 DEGs (Figure S4A–B) and 125 significant pathways (Figure S5) by the same criteria. Interestingly, one-third of the significant pathways enriched in the mouse model (21 out of 64), were also significantly altered in human study (Figure 7A). In another comparison, a similar analysis was performed on the TCGA LIHC study where we compared the 50 adjacent normal cases to 35 cases which simultaneously were CTNNB1-mutated and Nrf2-active (Figure 2B). Using similar criteria, we identified 8727 DEGs (Figure S6A–B) and 110 significantly enriched pathways (Figure S7). Again, approximately one-third (23 out of 64) of the pathways altered in the mouse model were found to be altered in this human HCC subset analysis (Figure 7B). When comparing Figures 7A and 7B, the prominent top overlapping pathways included Iron homeostasis signaling, Glutamine biosynthesis, and Glioblastoma Multiforme pathways. Some pathways were unique to each comparison. Lastly, when we specifically checked overlap of genes between murine model and HCC subset, 64 key genes were commonly identified to be altered with high correlation (0.769 by Pearson correlation) (Figure 7C). Overall, our analysis depicts successful generation of a mouse model representing a subset of human HCC and begins to provide novel insight into tumor biology through identification of key genes and pathways.
Figure 7: Ingenuity pathway analysis (IPA) comparing preclinical HCC to clinical HCC with either combined CTNNB1 mutations and NFE2L2/KEAP1 mutations, or CTNNB1 mutations and Nrf2 activation.
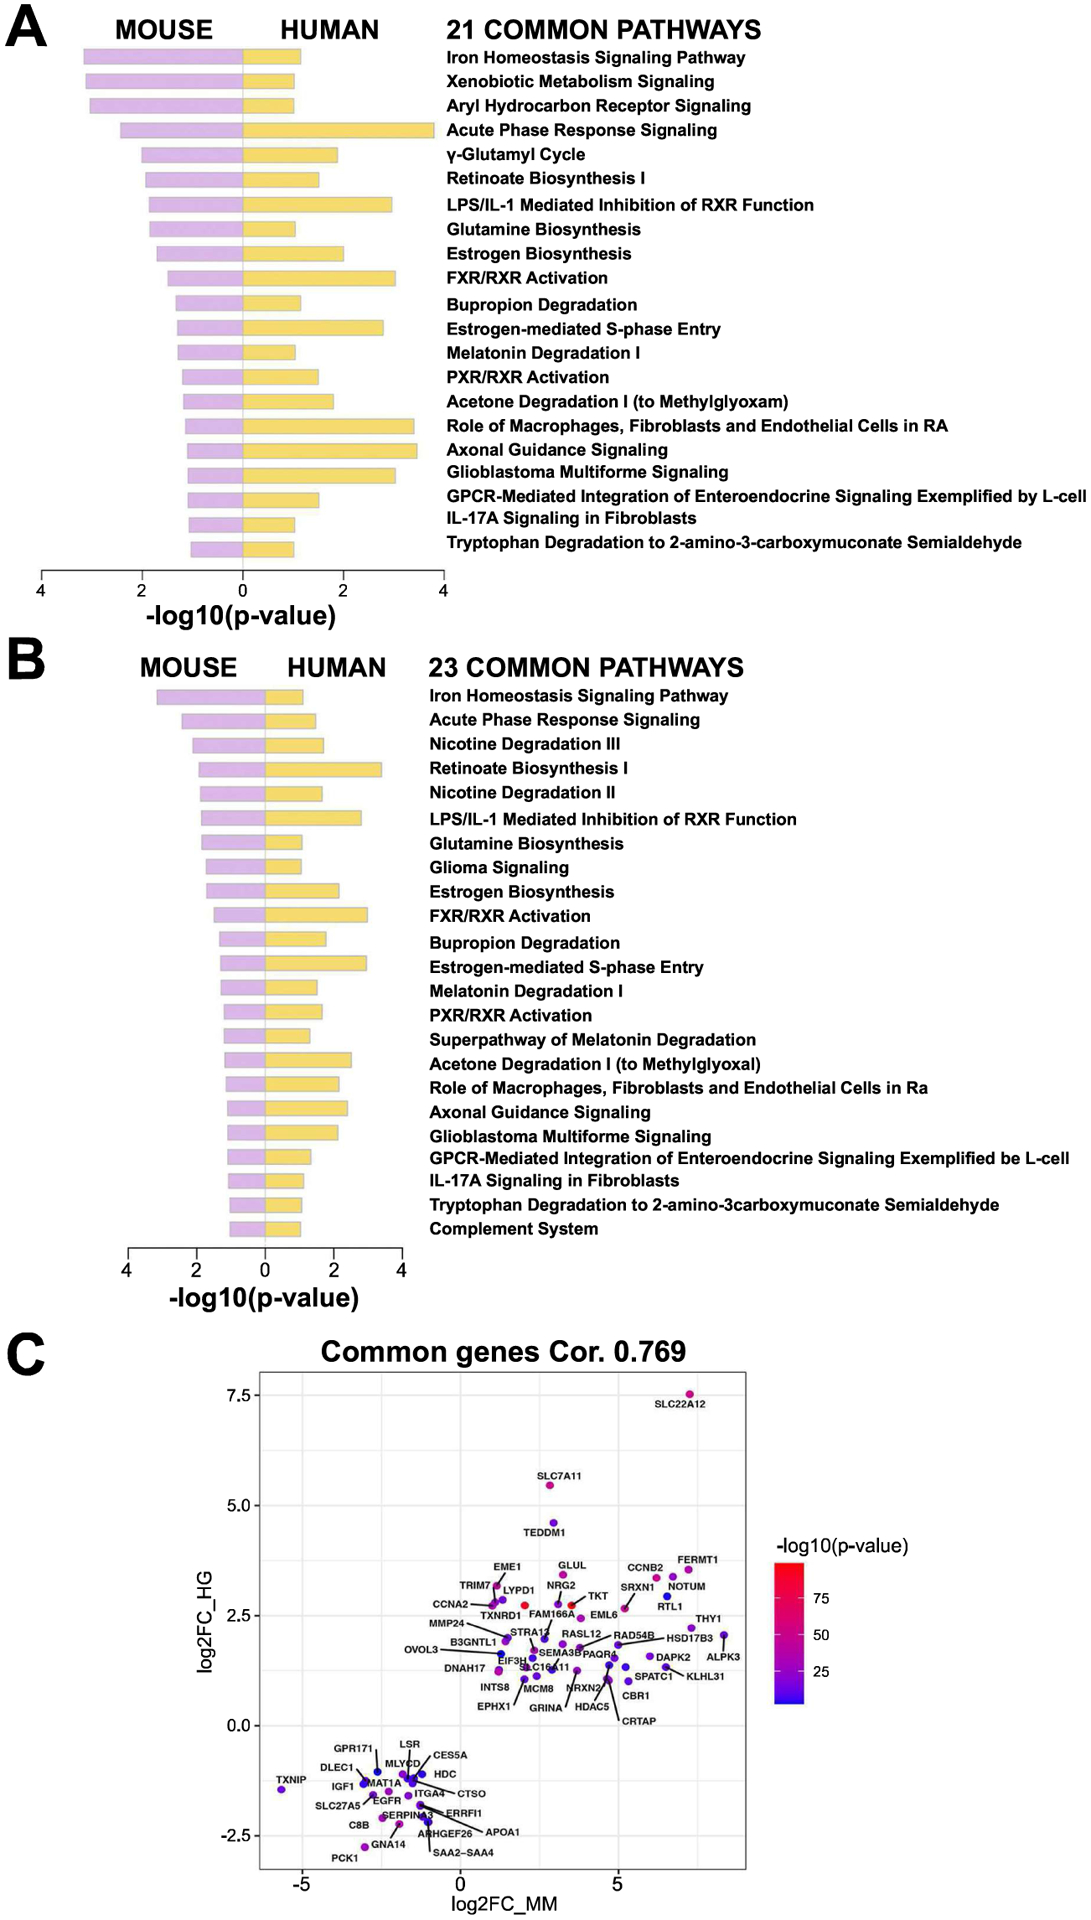
(A) 21 common pathways detected when comparing IPA using DEGs identified in HCCs in combined T41A-CTNNB1-G31A-NFE2L2 and T41A-CTNNB1-T80K-NFE2L2 NFE2L2-models (versus normal control livers) to human HCC subset with both CTNNB1 and NFE2L2/KEAP1 mutations (versus normal or adjacent normal livers). (B) 23 common pathways detected when comparing IPA using DEGs identified in HCCs in combined T41A-CTNNB1-G31A-NFE2L2 and T41A-CTNNB1-T80K-NFE2L2 NFE2L2-models (versus normal control livers) to human HCC subset with both CTNNB1 mutations and Nrf2 activation using published signature (versus normal or adjacent normal livers). (C) 64 key genes showed an overlap between preclinical HCC model (combined) and HCC subset with CTNNB1 and NFE2L2/KEAP1 mutations, with high correlation (0.769 by Pearson correlation). Mouse gene expression is plotted on x-axis (MM) and human on y-axis (HG).
Single-agent treatment with an mTOR inhibitor resulted in the significant suppression of tumor growth in G31A-NFE2LE-T41A-CTNNB1 mouse HCC model.
Glul, the gene encoding GS, was one of the 64 genes commonly altered in both human HCC subset with combined Nrf2 and β-catenin activation, and in the mouse model of HCC (Figure 7C). Previously, we showed that enhanced GS induced rapamycin-sensitive mTOR complex 1 (mTORC1) activation through glutamine in multiple models of CTNNB1-mutated HCCs, and inhibition of mTOR led to decreased tumor burden in such models (21). To test if mTOR activation is similarly evident in the current HCC model, we examined early (5-week post-injection) and advanced (11-week post-injection) tumors for p-mTOR-S2448, which is indicative of mTORC1 activation. Additionally, we assessed mTORC1 downstream effectors including translation initiation factor 4E-binding protein 1 (4E-BP1) and ribosomal protein S6 kinase, for their respective phosphorylated forms. At both early and later stages in the G31A-NFE2LE-T41A-CTNNB1 model, tumor nodules but not adjacent tissues, were positive for p-mTOR-S2448 by IHC (Figure 8A). Similarly, tumors were positive for p-4E-BP1-Thr37/46, implying it is primed for release from eIF4E subunit of eIF4F (Figure 8A). Furthermore, ribosomal pS6-Ser235/236 and pS6-Ser240/244, also downstream of mTORC1 signaling, were present in the tumors at both early and late times, although there was some intratumoral heterogeneity likely due to dynamic signaling (Figure 8A). Together, these observations show increased mTOR signaling in the current HCC.
Figure 8: Effect of mTOR inhibitor, everolimus, on HCC in T41A-CTNNB1-G31A-NFE2L2 mice.
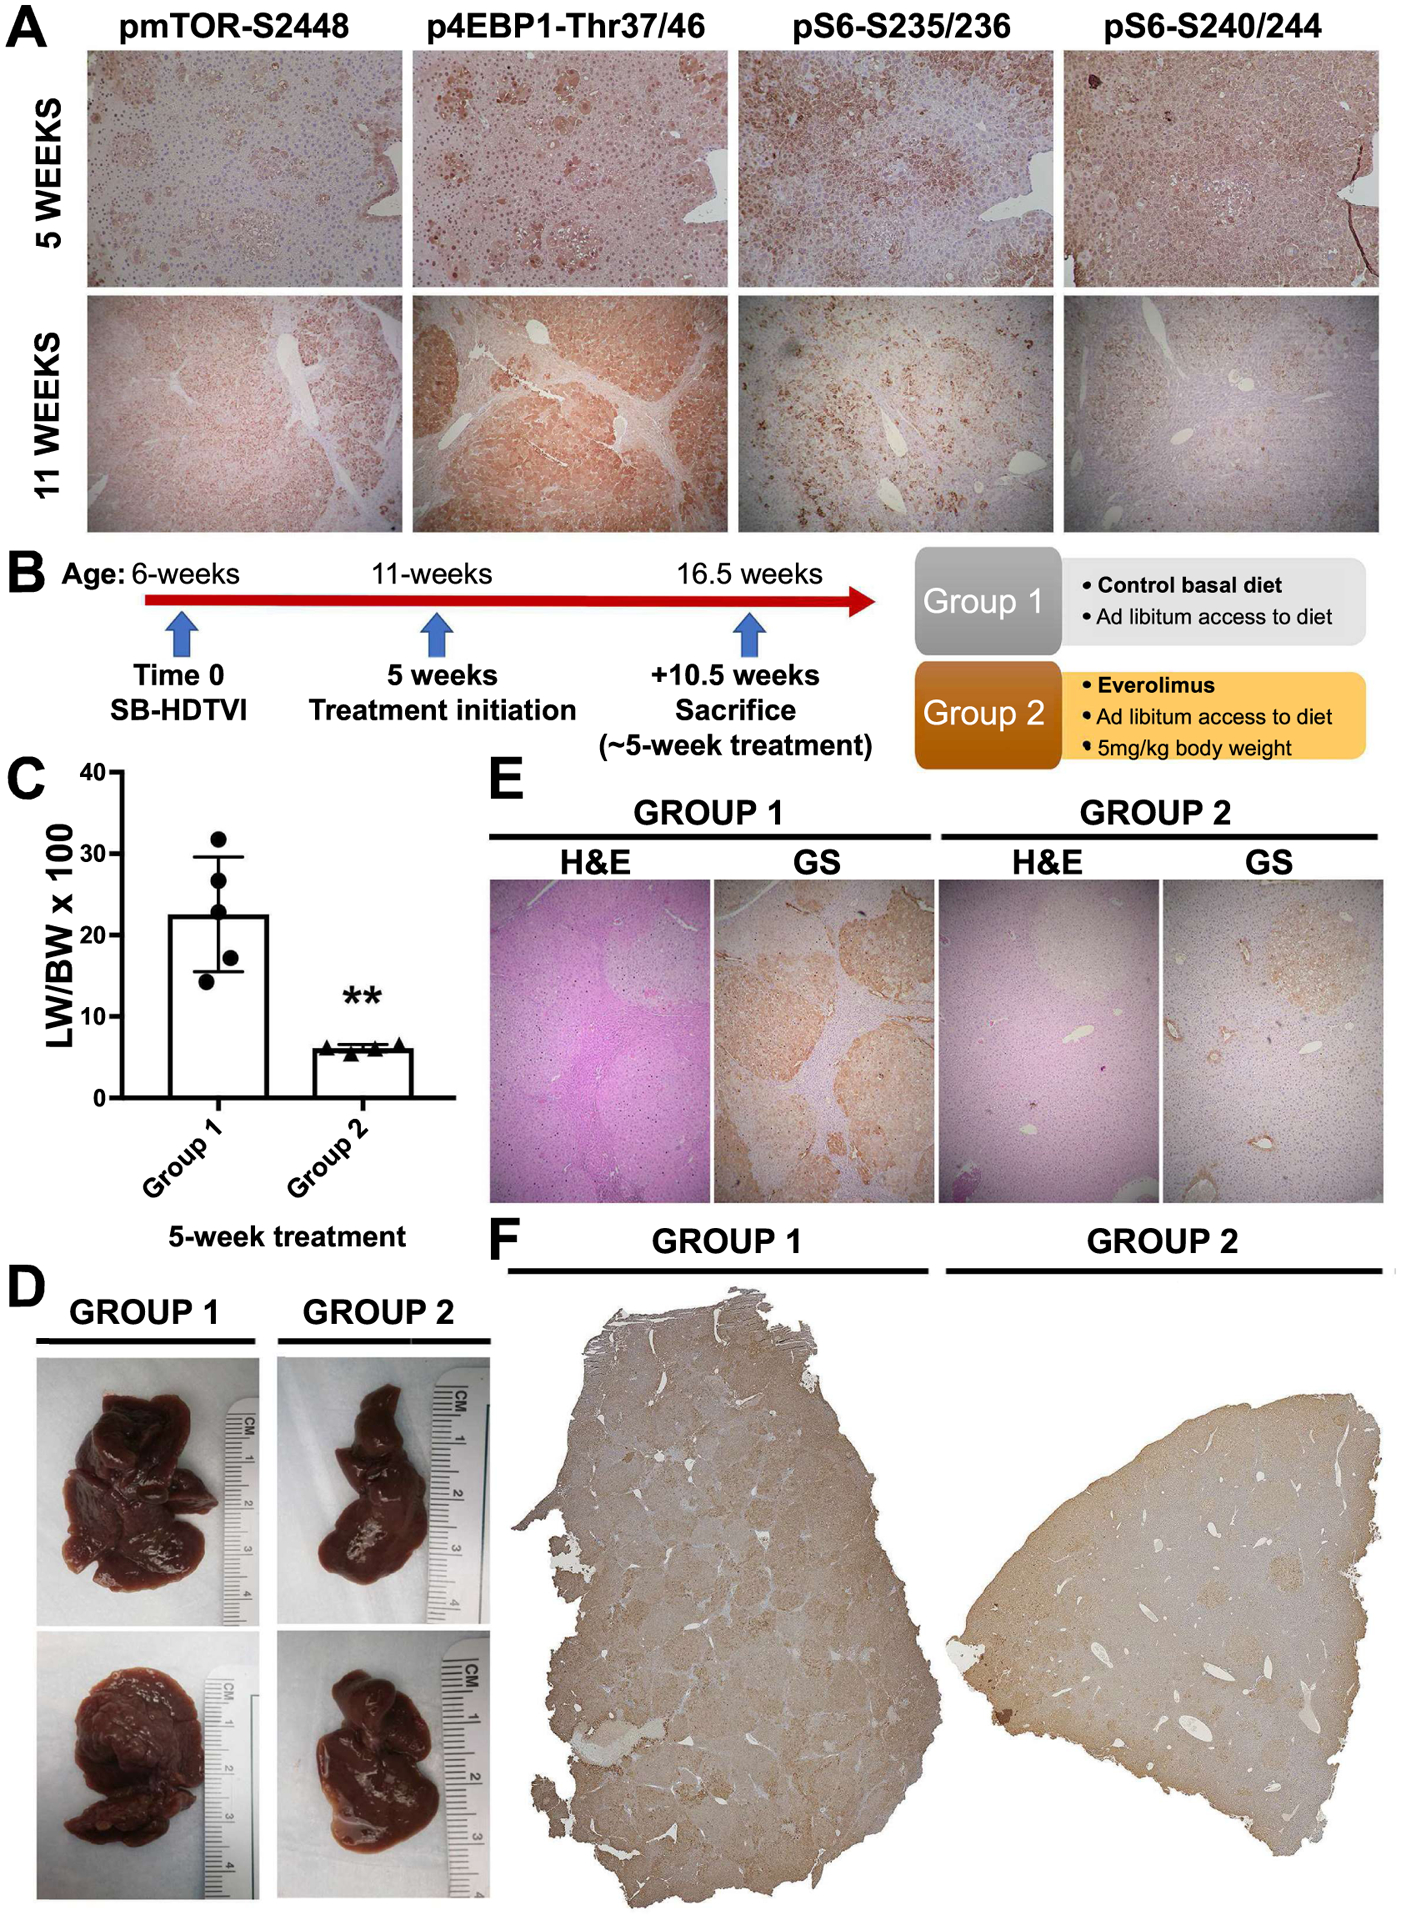
(A) Evidence of mTORC1 signaling activation in T41A-CTNNB1-G31A-NFE2L2 tumors at 5 and 11 weeks, post-injection, as shown by IHC for phosphorylated downstream effectors. (B) Schematic of experimental setup showing dietary Everolimus administration (Group 2) in the treatment group at 5 weeks, post SB-HDTVI-mediated T41A-CTNNB1-G31A-NFE2L2 delivery, and lasting for approximately 5 weeks, versus controls on normal diet (Group 1). (C) Bar graph shows significant decrease in the LW/BW in Everolimus treatment group versus the control arm (**p<0.01). (D) Representative gross images of the livers from Group 1 showing large nodular livers with macroscopic disease versus relatively smaller tumors with smaller visible nodules in Group 2. (E) Representative H&E staining and IHC for glutamine synthetase (GS) on consecutive sections of livers in Group 1 and 2 (Magnification −50x). (F) Tiled image for IHC staining for Myc-tag showing notably fewer tumor foci in Group 2 versus Group 1, which showed multiple large tumor foci throughout the parenchyma.
Consequently, we proceeded with investigation whether tumor growth would be diminished by the use of an mTOR inhibitor, Everolimus. After HCC establishment in mice at 5 weeks after SB-HDTVI-mediated G31A-NFE2L2-T41A-CTNNB1 delivery, animals were randomly assigned to either control or Everolimus-treated groups. Treatment group (Group 2) was administered Everolimus at 5mg/kg of BW through diet made available ad libitum (Figure 8B). Group 1 was left on normal basal diet for the same amount of time. For both groups, the mean duration of the treatment comprised 5 weeks, after which mice were sacrificed and assessed for tumor burden. In Group 2, administration of mTOR inhibitor resulted in a marked, almost three-fold decrease in liver weight to body weight ratio (LW/BW × 100), a surrogate for overall tumor burden, relative to untreated controls (Figure 8C). Gross assessment of the liver revealed notable decline in the number of macroscopic nodules, which accompanied the reduction LW as compared to the control (Figure 8D). Similarly, a representative histological examination of Myc-tag stained tissues, which reproducibly labels all HCC nodules in the current model, revealed clear decrease in both size and counts of tumor foci seen in a tiled image of a part of the larger lobe in the Everolimus-treated group versus the control (Figure 8F). Taken together, these observations indicate that in Nrf2-β-catenin active HCC, inhibition of mTOR signaling may demonstrate potential therapeutic benefit even as a single agent.
Discussion
In the current study, we generate a model that demonstrates cooperation of β-catenin and Nrf2 signaling in HCC development. CTNNB1 mutations alone don’t yield HCC, and another hit either in the form of a chemical carcinogen or overexpression of another gene, or mutation in another gene, is needed for successful tumorigenesis (26). We also show that GOF mutant of NFE2L2 alone is insufficient for tumorigenesis. However, co-expression of the two mutant oncogenes in a small subset of normal hepatocytes in vivo, underscores their significance in tumor initiation, even in a healthy liver. While most HCCs occur in the background of chronic liver injury, cell death, inflammation, fibrosis, and regeneration, these events eventually trigger DNA damage and aberrations in a subset of hepatocytes. And if such alterations including gene amplification, mutations, etc, impart a survival or proliferative advantage to a cell, while chronic injury is ongoing, it initiates neoplastic transformation. Our study provides a clear proof-of-concept that forcing clinically relevant aberrations exogenously into a normal hepatocyte without any preexisting injury is sufficient to induce neoplasia. The SB-HDTVI model is thus an excellent ‘inside-out’ model of HCC development, provided clinically relevant combinations are employed (24). We show co-expression of GOF mutants of NFE2L2 and CTNNB1 lead to HCC development. We did not directly test the if silencing KEAP1, like mutant-NFE2L2 would also cooperate with mutant-CTNNB1, and would need direct investigation (27, 28). Interestingly, co-expression of Met with active-β-catenin or Axin-1 silencing, both led to HCC development, but with specific differences, likely due to extent of β-catenin activation seen due to β-catenin GOF versus Axin-1 LOF, since Axin-1 is required for β-catenin degradation (12, 29).
It is important to state the role of Nrf2 can be a tumor suppressor or as a tumor promoter (27). We believe that this does not necessarily suggest a controversy, rather its stage-specific function. Nrf2 signaling is the major defense against oxidative stress as well as xenobiotics through transcriptional regulation of many genes with such protective functions. Since most HCCs occur as a consequence of chronic liver insult, which is often associated with oxidative stress, Nrf2 activation is likely a protective countermeasure and hence suppresses tumorigenesis in that context (30, 31). Indeed, Nrf2 deletion promoted tumorigenesis in mice (32). Also, many chemopreventive compounds work through stimulation of Nrf2 signaling (33, 34). However, unregulated and sustained activation of Nrf2 pathway in hepatocytes during chronic liver injury may allow these cells to have an unparalleled advantage of survival leading to their clonal expansion and tumor initiation. Indeed, GOF mutations in NFE2L2 have been identified as an early event in HCC in preclinical models (35). And several studies have validated the role of Nrf2 as tumor promoter (15, 16, 36). We posit that Nrf2 activation due to the microenvironment could be one hit, while mutation in CTNNB1 provides second hit, leading to tumorigenesis. Indeed, co-expression of the active-β-catenin and active Nrf2 was sufficient for HCC development.
Nrf2-β-catenin mice required euthanasia by 12–14 weeks and showed overall fewer PCNA-positive cells during tumorigenesis as compared to some other liver tumor models with high PCNA in tumor nodules including Yap-β-catenin, Met-β-catenin and Kras-β-catenin models (12, 13, 18). Because of higher proliferation, notable tumor burden was apparent in these models requiring earlier euthanasia.
We show notable molecular similarity between mouse HCC and human HCC subset, which showed concomitant CTNNB1 mutations and Nrf2 activation, either due to mutations in NFE2L2 or KEAP1 or due to unidentified mechanisms. The similarity was evident at both gene and pathway level, which also allowed to address some potential mechanisms of how Nrf2 and β-catenin signaling cooperate in HCC development. While we saw traditional Nrf2 and β-catenin targets to be upregulated in the preclinical model, IPA identified some interesting hits that could reveal molecular underpinnings of this subset of HCC. Based on the two analyses, one for overlapping pathways between the preclinical model and HCC subset with CTNNB1 and NFE2L2 or KEAP1 mutations, and another with CTNNB1 mutations and Nrf2 activation, we identified changes in Iron Homeostasis Signaling, Glutamine Biosynthesis, and Glioblastoma Multiforme signaling, among others. Both Nrf2 and β-catenin signaling has been shown to impact iron homeostasis, which has been linked to cancer, including glioblastoma and HCC. Several components of the iron homeostasis machinery including heme metabolism, catabolism, iron storage and iron export, are regulated by Nrf2 pathway (37). Nrf2 activation in cancers can induce ferritin levels through regulating expression of ferritin heavy chain (FTH1) and ferritin light chain (FTL) polypeptides, which has antioxidant effect through sequestering iron atoms and preventing it from participating in Fenton reaction to produce OH• (38). Ferritin upregulation can also promote cell proliferation through FoxM1 activation (39). While the overall impact of Nrf2 activation on iron content in the context of HCC development will need to be investigated further, the dependence of β-catenin signaling in cancer on iron has been shown previously (40). Thus, Nrf2 and β-catenin activation together may be playing a role in HCC growth and development, at least in part due to impact on iron homeostasis, a topic currently under investigation in our lab.
Another major common pathway activated in Nrf2-β-catenin HCC model was that of the Glutamine Biosynthesis. Indeed, β-catenin has been shown to regulate several key players in glutamine metabolism including GLUL (encoding for GS), ornithine aminotransferase (OAT), and the glutamate transporter GLT-1. In fact, we have shown β-catenin-mutated HCC to have higher levels of glutamine which in turn led to mTORC1 activation (21). Extending these observations, we found HCCs in the Nrf2-β-catenin model to be positive for GS, pmTOR-S2448, and downstream effectors, and showed good efficacy to mTOR inhibitors like Everolimus, even as a single agent. This supports the presence of mutant-β-catenin-Glul-glutamine-mTORC1 axis in the CTNNB1-mutated HCCs in more than one β-catenin driven HCC model. Further, synthesis of glutathione, the chief intracellular antioxidant promoting survival, is under Nrf2 control and requires glutamine (and glucose) and cysteine (41, 42). In fact, NRF2-addicted cancer cells show an increased uptake of cysteine through enhanced expression of Slc7a11 (xCT) as well as on increased glutamate production from glutamine for glutathione synthesis, which has itself been shown to be sufficient to drive cancer development(43). Increased expression of Slc7a11 and Glul, seen in both our preclinical model and in patients with β-catenin and Nrf2 activation, likely create a self-sustaining axis to promote tumorigenesis through GS-glutamine-mTORC1 axis as well as gluthathione synthesis in this subset of HCC. More direct studies are underway to determine the role of inhibiting glutathione synthesis as well as Nrf2 in the current preclinical HCC model.
Supplementary Material
Funding:
This work was supported by NIH grants 1R01CA251155 (SPM and AL), 1R01CA204586 (SPM and XC), 1R01DK62277 (SPM) and Endowed Chair for Experimental Pathology (SPM), and by NIH grant 1P30DK120531-01 to Pittsburgh Liver Research Center (PLRC) for services provided by Biospecimen Repository and Processing Core and Genomics and Systems Biology Core. This research was also supported in part by the University of Pittsburgh Center for Research Computing through the resources provided.
REFERENCES
- 1.Asrani SK, Devarbhavi H, Eaton J, Kamath PS. Burden of liver diseases in the world. J Hepatol 2019;70:151–171. [DOI] [PubMed] [Google Scholar]
- 2.Finn RS, Qin S, Ikeda M, Galle PR, Ducreux M, Kim TY, Kudo M, et al. Atezolizumab plus Bevacizumab in Unresectable Hepatocellular Carcinoma. N Engl J Med 2020;382:1894–1905. [DOI] [PubMed] [Google Scholar]
- 3.Llovet JM, Zucman-Rossi J, Pikarsky E, Sangro B, Schwartz M, Sherman M, Gores G. Hepatocellular carcinoma. Nat Rev Dis Primers 2016;2:16018. [DOI] [PubMed] [Google Scholar]
- 4.Pinyol R, Nault JC, Quetglas IM, Zucman-Rossi J, Llovet JM. Molecular profiling of liver tumors: classification and clinical translation for decision making. Semin Liver Dis 2014;34:363–375. [DOI] [PubMed] [Google Scholar]
- 5.Nakagawa H, Fujita M, Fujimoto A. Genome sequencing analysis of liver cancer for precision medicine. Semin Cancer Biol 2019;55:120–127. [DOI] [PubMed] [Google Scholar]
- 6.Onuma AE, Zhang H, Huang H, Williams TM, Noonan A, Tsung A. Immune checkpoint inhibitors in hepatocellular cancer: current understanding on mechanisms of resistance and biomarkers of response to treatment. Gene Expr 2020. [DOI] [PMC free article] [PubMed] [Google Scholar]
- 7.Cancer Genome Atlas Research Network. Electronic address wbe, Cancer Genome Atlas Research N. Comprehensive and Integrative Genomic Characterization of Hepatocellular Carcinoma. Cell 2017;169:1327–1341 e1323. [DOI] [PMC free article] [PubMed] [Google Scholar]
- 8.Schulze K, Imbeaud S, Letouze E, Alexandrov LB, Calderaro J, Rebouissou S, Couchy G, et al. Exome sequencing of hepatocellular carcinomas identifies new mutational signatures and potential therapeutic targets. Nat Genet 2015;47:505–511. [DOI] [PMC free article] [PubMed] [Google Scholar]
- 9.Cadoret A, Ovejero C, Terris B, Souil E, Levy L, Lamers WH, Kitajewski J, et al. New targets of beta-catenin signaling in the liver are involved in the glutamine metabolism. Oncogene 2002;21:8293–8301. [DOI] [PubMed] [Google Scholar]
- 10.Harada N, Miyoshi H, Murai N, Oshima H, Tamai Y, Oshima M, Taketo MM. Lack of tumorigenesis in the mouse liver after adenovirus-mediated expression of a dominant stable mutant of beta-catenin. Cancer Res 2002;62:1971–1977. [PubMed] [Google Scholar]
- 11.Nejak-Bowen KN, Thompson MD, Singh S, Bowen WC Jr., Dar MJ, Khillan J, Dai C, et al. Accelerated liver regeneration and hepatocarcinogenesis in mice overexpressing serine-45 mutant beta-catenin. Hepatology 2010;51:1603–1613. [DOI] [PMC free article] [PubMed] [Google Scholar]
- 12.Tao J, Xu E, Zhao Y, Singh S, Li X, Couchy G, Chen X, et al. Modeling a human hepatocellular carcinoma subset in mice through coexpression of met and point-mutant beta-catenin. Hepatology 2016;64:1587–1605. [DOI] [PMC free article] [PubMed] [Google Scholar]
- 13.Tao J, Calvisi DF, Ranganathan S, Cigliano A, Zhou L, Singh S, Jiang L, et al. Activation of beta-catenin and Yap1 in human hepatoblastoma and induction of hepatocarcinogenesis in mice. Gastroenterology 2014;147:690–701. [DOI] [PMC free article] [PubMed] [Google Scholar]
- 14.Ruiz de Galarreta M, Bresnahan E, Molina-Sanchez P, Lindblad KE, Maier B, Sia D, Puigvehi M, et al. beta-Catenin Activation Promotes Immune Escape and Resistance to Anti-PD-1 Therapy in Hepatocellular Carcinoma. Cancer Discov 2019;9:1124–1141. [DOI] [PMC free article] [PubMed] [Google Scholar]
- 15.Ngo HKC, Kim DH, Cha YN, Na HK, Surh YJ. Nrf2 Mutagenic Activation Drives Hepatocarcinogenesis. Cancer Res 2017;77:4797–4808. [DOI] [PubMed] [Google Scholar]
- 16.Taguchi K, Yamamoto M. The KEAP1-NRF2 System in Cancer. Front Oncol 2017;7:85. [DOI] [PMC free article] [PubMed] [Google Scholar]
- 17.Chen X, Calvisi DF. Hydrodynamic transfection for generation of novel mouse models for liver cancer research. Am J Pathol 2014;184:912–923. [DOI] [PMC free article] [PubMed] [Google Scholar]
- 18.Tao J, Zhang R, Singh S, Poddar M, Xu E, Oertel M, Chen X, et al. Targeting beta-catenin in hepatocellular cancers induced by coexpression of mutant beta-catenin and K-Ras in mice. Hepatology 2017;65:1581–1599. [DOI] [PMC free article] [PubMed] [Google Scholar]
- 19.Sanghvi VR, Leibold J, Mina M, Mohan P, Berishaj M, Li Z, Miele MM, et al. The Oncogenic Action of NRF2 Depends on De-glycation by Fructosamine-3-Kinase. Cell 2019;178:807–819 e821. [DOI] [PMC free article] [PubMed] [Google Scholar]
- 20.Goldstein LD, Lee J, Gnad F, Klijn C, Schaub A, Reeder J, Daemen A, et al. Recurrent Loss of NFE2L2 Exon 2 Is a Mechanism for Nrf2 Pathway Activation in Human Cancers. Cell Rep 2016;16:2605–2617. [DOI] [PubMed] [Google Scholar]
- 21.Adebayo Michael AO, Ko S, Tao J, Moghe A, Yang H, Xu M, Russell JO, et al. Inhibiting Glutamine-Dependent mTORCl Activation Ameliorates Liver Cancers Driven by beta-Catenin Mutations. Cell Metab 2019;29:1135–1150 e1136. [DOI] [PMC free article] [PubMed] [Google Scholar]
- 22.Itoh K, Chiba T, Takahashi S, Ishii T, Igarashi K, Katoh Y, Oyake T, et al. An Nrf2/small Maf heterodimer mediates the induction of phase II detoxifying enzyme genes through antioxidant response elements. Biochem Biophys Res Commun 1997;236:313–322. [DOI] [PubMed] [Google Scholar]
- 23.Raghunath A, Sundarraj K, Arfuso F, Sethi G, Perumal E. Dysregulation of Nrf2 in Hepatocellular Carcinoma: Role in Cancer Progression and Chemoresistance. Cancers (Basel) 2018;10. [DOI] [PMC free article] [PubMed] [Google Scholar]
- 24.Monga SP. “Inside-out” or “Outside-in”: Choosing the right model of Hepatocellular Cancer. Gene Expr 2020. [DOI] [PMC free article] [PubMed] [Google Scholar]
- 25.Kim J, Shin SH, Ko YE, Miki T, Bae HM, Kang JK, Kim JW. HX-1171, a Novel Nrf2 Activator, Induces NQO1 and HMOX1 Expression. J Cell Biochem 2017;118:3372–3380. [DOI] [PubMed] [Google Scholar]
- 26.Monga SP. beta-Catenin Signaling and Roles in Liver Homeostasis, Injury, and Tumorigenesis. Gastroenterology 2015;148:1294–1310. [DOI] [PMC free article] [PubMed] [Google Scholar]
- 27.Menegon S, Columbano A, Giordano S. The Dual Roles of NRF2 in Cancer. Trends Mol Med 2016;22:578–593. [DOI] [PubMed] [Google Scholar]
- 28.Wang R, An J, Ji F, Jiao H, Sun H, Zhou D. Hypermethylation of the Keap1 gene in human lung cancer cell lines and lung cancer tissues. Biochem Biophys Res Commun 2008;373:151–154. [DOI] [PubMed] [Google Scholar]
- 29.Qiao Y, Wang J, Karagoz E, Liang B, Song X, Shang R, Evert K, et al. Axis inhibition protein 1 (Axin1) Deletion-Induced Hepatocarcinogenesis Requires Intact beta-Catenin but Not Notch Cascade in Mice. Hepatology 2019;70:2003–2017. [DOI] [PMC free article] [PubMed] [Google Scholar]
- 30.Miyanishi K, Hoki T, Tanaka S, Kato J. Prevention of hepatocellular carcinoma: Focusing on antioxidant therapy. World J Hepatol 2015;7:593–599. [DOI] [PMC free article] [PubMed] [Google Scholar]
- 31.Ramos-Tovar E, Muriel P. Free radicals, antioxidants, nuclear factor-E2-related factor-2 and liver damage. J Appl Toxicol 2020;40:151–168. [DOI] [PubMed] [Google Scholar]
- 32.Ramos-Gomez M, Dolan PM, Itoh K, Yamamoto M, Kensler TW. Interactive effects of nrf2 genotype and oltipraz on benzo[a]pyrene-DNA adducts and tumor yield in mice. Carcinogenesis 2003;24:461–467. [DOI] [PubMed] [Google Scholar]
- 33.Giudice A, Arra C, Turco MC. Review of molecular mechanisms involved in the activation of the Nrf2-ARE signaling pathway by chemopreventive agents. Methods Mol Biol 2010;647:37–74. [DOI] [PubMed] [Google Scholar]
- 34.Hayes JD, McMahon M, Chowdhry S, Dinkova-Kostova AT. Cancer chemoprevention mechanisms mediated through the Keap1-Nrf2 pathway. Antioxid Redox Signal 2010;13:1713–1748. [DOI] [PubMed] [Google Scholar]
- 35.Zavattari P, Perra A, Menegon S, Kowalik MA, Petrelli A, Angioni MM, Follenzi A, et al. Nrf2, but not beta-catenin, mutation represents an early event in rat hepatocarcinogenesis. Hepatology 2015;62:851–862. [DOI] [PubMed] [Google Scholar]
- 36.Vilarinho S, Erson-Omay EZ, Harmanci AS, Morotti R, Carrion-Grant G, Baranoski J, Knisely AS, et al. Paediatric hepatocellular carcinoma due to somatic CTNNB1 and NFE2L2 mutations in the setting of inherited bi-allelic ABCB11 mutations. J Hepatol 2014;61:1178–1183. [DOI] [PubMed] [Google Scholar]
- 37.Kerins MJ, Ooi A. The Roles of NRF2 in Modulating Cellular Iron Homeostasis. Antioxid Redox Signal 2018;29:1756–1773. [DOI] [PMC free article] [PubMed] [Google Scholar]
- 38.Theil EC. Ferritin: the protein nanocage and iron biomineral in health and in disease. Inorg Chem 2013;52:12223–12233. [DOI] [PMC free article] [PubMed] [Google Scholar]
- 39.Schonberg DL, Miller TE, Wu Q, Flavahan WA, Das NK, Hale JS, Hubert CG, et al. Preferential Iron Trafficking Characterizes Glioblastoma Stem-like Cells. Cancer Cell 2015;28:441–455. [DOI] [PMC free article] [PubMed] [Google Scholar]
- 40.Song S, Christova T, Perusini S, Alizadeh S, Bao RY, Miller BW, Hurren R, et al. Wnt inhibitor screen reveals iron dependence of beta-catenin signaling in cancers. Cancer Res 2011;71:7628–7639. [DOI] [PubMed] [Google Scholar]
- 41.Lim JKM, Delaidelli A, Minaker SW, Zhang HF, Colovic M, Yang H, Negri GL, et al. Cystine/glutamate antiporter xCT (SLC7A11) facilitates oncogenic RAS transformation by preserving intracellular redox balance. Proc Natl Acad Sci U S A 2019;116:9433–9442. [DOI] [PMC free article] [PubMed] [Google Scholar]
- 42.Okazaki K, Papagiannakopoulos T, Motohashi H. Metabolic features of cancer cells in NRF2 addiction status. Biophys Rev 2020;12:435–441. [DOI] [PMC free article] [PubMed] [Google Scholar]
- 43.Harris IS, Treloar AE, Inoue S, Sasaki M, Gorrini C, Lee KC, Yung KY, et al. Glutathione and thioredoxin antioxidant pathways synergize to drive cancer initiation and progression. Cancer Cell 2015;27:211–222. [DOI] [PubMed] [Google Scholar]
Associated Data
This section collects any data citations, data availability statements, or supplementary materials included in this article.


