

Abstract
Background:
Pigment epithelium-derived factor (PEDF) is a member of the serpin family secreted by adipocytes. Plasma PEDF is increased in obese children and adults. Adults with type 2 diabetes mellitus (T2DM) have higher circulating PEDF but there are no reports in children with T2DM.
Objective:
To compare PEDF concentration in children with T2DM to normal weight and obese children without T2DM and determine associations with anthropometric or serum factors.
Methods:
Participants were 34 obese children with T2DM diagnosed by American Diabetes Association (ADA) criteria, 61 normal weight [body mass index (BMI) 25–75 percentile] and 63 obese (BMI ≥95 percentile) children of age 8–18 yr. Plasma PEDF was measured in fasting plasma samples. Anthropometric, serum, and body composition (dual-energy x-ray absorptiometry, DXA) data were obtained for each subject to identify potential predictor variables.
Results:
PEDF was 55% higher (p = 0.001) in the T2DM group compared with normal weight children, but did not differ from obese children. In the T2DM group, fat mass and lean mass both individually predicted PEDF (r2 = 0.22 and 0.17, p = 0.02 and p < 0.01, respectively). PEDF was positively correlated with homeostatic model assessment - insulin resistance (HOMA-IR) when all groups were combined (r2 = 0.15, p<0.001).
Conclusions:
Plasma PEDF was similar in the T2DM and obese groups, therefore, obesity, rather than diabetes, may account for the higher PEDF in children with T2DM compared with normal weight children. PEDF was positively associated with both lean mass and fat mass both of which may contribute to the circulating level of the protein, and potentially to PEDF’s association with insulin resistance in obese children with and without diabetes.
Keywords: obesity, PEDF, T2DM
Pigment epithelium-derived factor (PEDF) is a 50 kDa glycoprotein belonging to the serpin family of peptidase inhibitors (1, 2). Initially identified in the conditioned medium of human retinal pigment epithelial cells, PEDF in circulation is currently thought to be secreted primarily from the liver and adipose tissue but recent studies have also identified a role for skeletal muscle and other tissues (3, 4).
Studies in adults have shown that PEDF is associated with insulin resistance, metabolic syndrome, and visceral adiposity (5–9). When obese men completed a weight-loss program PEDF, which was elevated at the start of the intervention, declined and that change was associated with reduced insulin resistance (5). PEDF has also been shown to be increased in adults with type 2 diabetes mellitus (T2DM) compared with non-diabetic subjects and positively associated with body mass index (BMI), serum creatinine, and low-density lipoprotein (LDL) cholesterol (10). Studies in mice demonstrated that manipulations to increase or decrease the amount of PEDF in circulation resulted in a corresponding increase or decrease, respectively, in insulin resistance (6). Thus, it appears that an increase in PEDF could be a marker, and potential mediator, of insulin resistance.
Our group recently reported that PEDF is increased in overweight/obese children compared with normal weight controls and positively associated in children with BMI and insulin resistance (11). Although PEDF was reported to be increased in adults with T2DM (10) the non-T2DM group in that study had significantly lower BMI so it was not clear whether the difference in PEDF was attributable to obesity or diabetes. To our knowledge, the impact of T2DM on PEDF in children has not been reported. This study tested the hypothesis that children with T2DM would have higher plasma PEDF compared with groups of normal weight or obese children. We also investigated whether PEDF concentration in the T2DM group was associated with insulin resistance and other metabolic risk factors, including body composition, fasting lipids, and C-reactive protein as a measure of inflammation.
Methods
Subjects
Participants were 34 (9 boys) children with T2DM, 61 (30 boys) children with normal weight, and 63 (30 boys) obese children of age 8–18yr. The participants were recruited through the pediatric diabetes/endocrinology clinic as well as through local advertisements. Primary outcome data from the three groups were previously published.(12, 13) The criterion for inclusion in the normal weight group was a BMI between the 25th and 75th percentile based on 2000 Centers for Disease Control (CDC) growth charts. Children in the obese group had a BMI greater than the 95th percentile based on CDC growth charts. The children in the normal weight and obese groups were free of diabetes, cardiovascular disease, or other chronic disease. The children in the T2DM group were diagnosed according to the American Diabetes Association guidelines (14). Among the participants with diabetes, none used insulin at the time of the study, and the duration of diabetes for all participants was less than 5 yr (average duration of diagnosis 1.9 ± 1.7 yr).
Informed written consent and assent were obtained in accordance with the guidelines of the University of Oklahoma Health Sciences Center Institutional Review Board for Human Subjects.
Anthropometric measures
A pediatrician completed a medical history and physical examination on each participant. Tanner staging was determined by examination of pubic hair as well as external genitalia in males and breast in females according to the published reports of Marshall and Tanner (15, 16). Measures of height and weight were used to calculate BMI, which was expressed as a percentile using normative data for the child’s age and sex from the United States Centers for Disease Control. Blood pressure was measured using an appropriate sized cuff. Body composition was quantified using dual energy X-ray absorptiometry (GE iDXA, Fairfield, CT, USA).
Blood analyses
A confirmed fasting blood sample was collected for measurement of selected outcomes in serum and plasma. Glucose was measured by the glucose oxidase method (YSI 2300 STAT plus, Yellow Springs, OH, USA). Insulin was measured using an enzyme-linked immunosorbent assay (ELISA) kit for human samples from Millipore (#EZHIASF-14K, St. Charles, MO, USA). The assay was 100% specific for human insulin according to the manufacturer’s specifications. Glucose and insulin values were used to calculate fasting insulin resistance using the HOMA-IR model (17). Serum triglycerides and total, HDL and LDL cholesterol, and C-reactive protein were measured at the Clinical Chemistry Laboratory of the Oklahoma Veterans Administration Hospital (Oklahoma City) using validated enzymatic assays (Synchron Systems, Beckman Coulter, Brea, CA, USA). Plasma PEDF was measured using an ELISA kit from Millipore (#CYT420).
Statistical analysis
All outcomes were inspected for normality of distribution. Outcomes that were notably skewed were log-transformed for statistical analysis. Models explored both raw- and log-transformed PEDF. Regression models for raw PEDF values were chosen when their residuals showed no evidence that the models’ assumptions were violated or that their inference (p values or confidence intervals) was invalid. Separate analysis of variance models identified differences in the mean anthropometric and serum measures among the normal weight, obese and T2DM groups. Univariate modeling established correlations between PEDF and anthropometric or serum outcomes in the group with T2DM. Assessment of these results caused us to probe secondary analyses to illuminate the pattern of differences, between patient groups, in mean PEDF. Variables that were significantly correlated with PEDF were then combined to identify the multivariable regression models that best predicted PEDF in each of the three groups. sas version 9.1 (SAS Institute Inc., Cary, NC, USA) was used to calculate the regression models. Because the study explored novel hypotheses, we did not adjust for multiple comparisons, but considered any association significant that yielded a p-value less than 0.05.
Results
In a separate publication addressing the effects of T2DM on arterial compliance in this same study cohort, we reported the group characteristics shown in Table 1 (13). For many of the anthropometric and clinical outcomes, including lean mass and fat mass, the T2DM group was similar to the obese group and significantly different from the normal weight group. HOMA-IR were higher in the T2DM group than in both the other groups (p < 0.001). Likewise, mean CRP was higher in the T2DM group than in both the normal weight (p < 0.001) and the obese group (p = 0.012).
Table 1.
Participant characteristics
| Normal weight (N = 50) | Obese (N = 58) | Type 2 diabetes (N = 34) | |
|---|---|---|---|
| BMI (kg/m2)*, ‡ | 19.6±1.9 (19.1–20.1) | 32.4±5.9 (30.9–33.9) | 37.2±9.0 (34.2–40.2) |
| BMI SDs* | 0.05±0.41 (−0.06–0.16) | 2.13±0.33 (2.05–2.21) | 2.33±0.48 (2.17–2.49) |
| Lean mass (kg)* | 33.5±9.0 (31.0–36.0) | 44.7±10.6 (42.0–47.4) | 47.1±12.8 (43.1–51.7) |
| Appendicular lean mass (kg)* | 21.1±6.4 (19.522.7) | 38.7±10.5 (36.141.4) | 45.3±19.9 (38.6–52.0) |
| Truncal lean mass (kg)*, ‡ | 20.0±6.2 (18.5–21.6) | 40.1±12.6 (37.0–43.2) | 48.1±15.7 (42.9–53.4) |
| Fat mass (kg)*, ‡ | 12.6±4.4 (11.4–13.8) | 38.0±13.7 (34.5–41.5) | 45.4±18.3 (39.3–51.6) |
| Appendicular fat mass (kg)* | 6.5±2.4 (5.97.1) | 17.2±5.9 (15.718.6) | 20.1±8.4 (17.2–22.9) |
| Truncal fat mass (kg)*, ‡ | 4.9±2.4 (4.3–5.5) | 19.5±8.3 (17.4–21.5) | 25.0±10.5 (21.5–28.5) |
| Insulin (pmol/L)*, ‡ | 47.64±37.29 (37.30–57.98) | 167.03±133.27 (132.73–201.33) | 247.03±166.68 (191.00–303.06) |
BMI, body mass index; CI, confidence interval; SDs, standard deviations; T2DM, type 2 diabetes mellitus. All results are reported as mean ± SD (95% CI).
Denotes p < 0.05 comparing obese and T2DM groups to normal weight groups.
Denotes p < 0.05 comparing T2DM group to the obese group.
Mean PEDF was 55% higher in children with T2DM (6.33 μg/mL) than in those of normal weight (4.10 μg/mL; p = 0.0023), but was non-significantly different from obese children (6.74 μg/mL; p = 0.5778) (Fig. 1). In univariate models for the group with T2DM, PEDF was positively associated with both fat mass and lean mass (r2 = 0.22, p = 0.02 and r2 = 0.17, p < 0.01, respectively; Fig. 2A, B). On analysis of regional lean and fat mass, appendicular lean and fat mass showed significant associations with PEDF (r2 = 0.19, p = 0.01 and r2 = 0.20, p < 0.001, respectively).
Fig. 1.

Pigment-epithelium derived factor (PEDF) in normal weight, obese, and type 2 diabetes mellitus (T2DM) children. Values are for mean ± SEM; *obese and T2DM greater than normal weight (p < 0.05).
Fig. 2.

Associations with pigment-epithelium derived factor (PEDF) in type 2 diabetes mellitus (T2DM) children. (A) Association of PEDF and fat mass; r2 = 0.22. (B) Association of PEDF and lean mass; r2 = 0.17.
Because the group with T2DM included more girls (25/34 or 74%) than the group of obese children (33/63 or 52%), secondary analyses were performed to search for evidence that the association between fat mass and mean PEDF, and the association between lean mass and mean PEDF, might differ between boys and girls. No statistical evidence of sex-related interactions was identified.
As fat mass and lean mass were higher in the group with T2DM than the normal weight and obese groups but PEDF did not follow the same pattern was not higher, evidence of interactions or other effects that might predict an attenuation of mean PEDF at high levels were evaluated, especially in the group with T2DM. That analysis revealed a curvilinear association between PEDF and insulin, such that high levels of insulin predicted an attenuation of mean PEDF levels compared with intermediate concentrations of both proteins. A polynomial regression model, applied to the groups of children who were obese or diagnosed with T2DM, detected significant linear (p = 0.0003) and quadratic (p = 0.0003) effects for insulin levels (r2 = 0.14; Fig. 3). This model produces predicted PEDF values whose mean is higher among those with T2DM (6.98 μg/mL) than among those who are obese but not diagnosed with T2DM (6.40 μg/mL). The difference in predicted means approaches statistical significance (p = 0.06) in the expected direction.
Fig. 3.
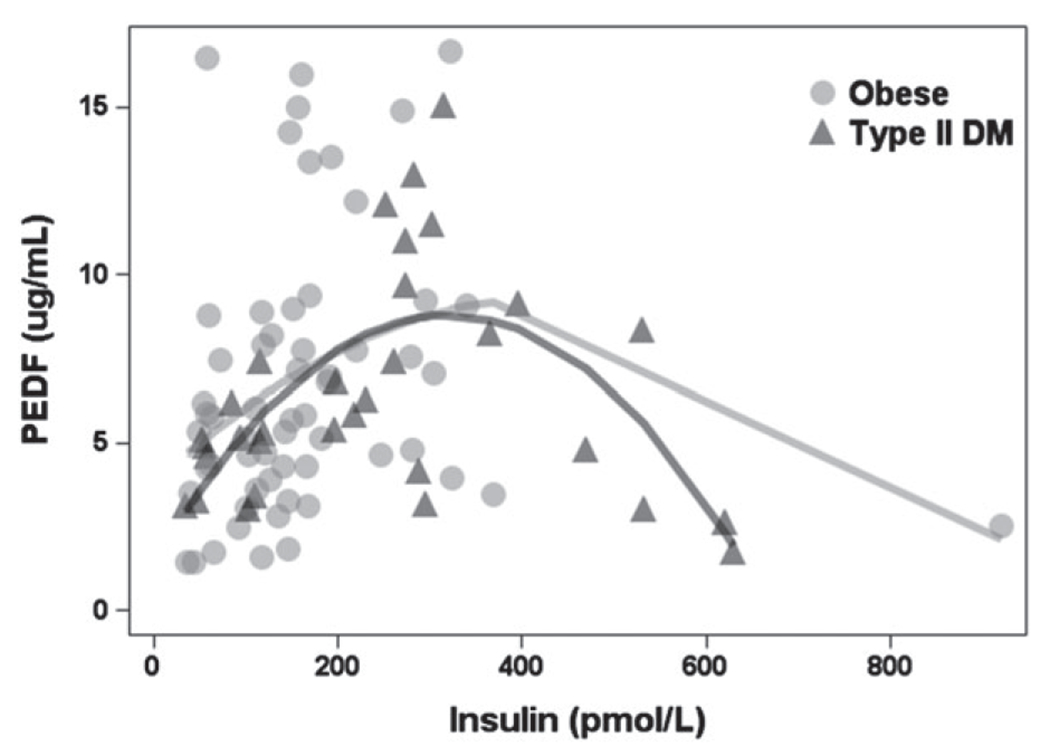
Curvilinear association between pigment-epithelium derived factor (PEDF) and insulin in obese and type 2 diabetes mellitus (T2DM) children.
In multivariable models using the curvilinear association between PEDF and insulin, among children diagnosed with T2DM, both lean mass (p = 0.0105, model r2 = 0.56) and fat mass (p = 0.0154, model r2 = 0.55) independently predicted PEDF in separate regression models that adjusted for insulin levels. At a given insulin level, a 1 kg difference in lean mass was associated with mean PEDF that was 0.11 μg/mL higher, and a 1 kg difference in fat mass was associated with a mean PEDF that was 0.069 μg/mL higher. Lean mass and fat mass were sufficiently correlated (r2 = 0.52, p < 0.001) that including both in a regression model with insulin was not informative.
Discussion
The goal of this study was to examine the impact of T2DM on plasma PEDF concentration in children and to explore factors associated with those concentrations. We found that PEDF concentrations were significantly higher in children with T2DM compared with normal weight children, but similar to obese peers. PEDF was associated with fat mass and lean mass in the group with T2DM. On the basis of the impact of insulin in our statistical models, circulating PEDF concentration in children can be predicted by insulin levels and the size of fat and lean tissue depots.
We previously reported that PEDF was increased in overweight/obese children and young adults (ages 8–35 yr old) compared with normal weight peers (11). This study demonstrates that PEDF concentration in obese children with T2DM is similar to that of obese children without diabetes, but after controlling for the relationship with insulin, the group with T2DM is predicted to have higher PEDF. The current findings therefore appear to differ slightly from a prior study with adults (10) that showed that plasma PEDF was 65% higher in a group with T2DM compared with non-T2DM controls (10). However, in that study the T2DM group had significantly greater BMI (34.7 vs. 26.7 kg/m2) than the non-T2DM group and therefore the separate contributions of obesity and diabetes to PEDF variation were not fully controlled. We overcame that limitation in this study by including both normal weight and obese age-matched groups to which the T2DM group could be compared.
Our study, however, is the first to our knowledge to report values for PEDF in children with T2DM. The lack of difference in PEDF attributable to diabetes per se seems to be related to insulin levels which may be associated with the duration of diabetes. The average duration of diabetes in the cohort reported by Jenkins et al. was 10 yr (10), whereas our average duration of diabetes was about 2 yr. One would expect that over time with increasing β-cell dysfunction expected in the T2DM group, insulin would begin to decline, and therefore the relationship of PEDF and insulin may also change to a linear relationship. A longer duration of diabetes may also explain why PEDF has been associated with diabetes complications in adults, such as nephropathy (18). It is possible that PEDF level increases with duration of diabetes, but further longitudinal studies are necessary to address that possibility.
The association of PEDF with fat mass in T2DM might be expected as PEDF is one of the most abundant adipocytokines secreted by adipose tissue (19). Using primary cultures of human adipocytes, Famulla et al. found that PEDF concentration in conditioned media was significantly higher than other adipocytokines such as interleukin-6 (IL-6) and adiponectin (19). PEDF mRNA content in cultured adipocytes was also reported to be positively associated with BMI of the adult donor (7). Additionally, Sabater et al. showed that PEDF concentration is responsive to changes in adipose tissue mass as plasma PEDF declined in obese adults after completing a weight loss program (5). Thus, our finding that fat mass was positively related to PEDF concentration in children with and without diabetes agrees with the existing literature.
We also found that PEDF was positively correlated with lean mass within the group with T2DM, and in the combined group analyses. Among lean tissues that could be sources of PEDF, it has been established that PEDF is secreted by the liver (20) and skeletal muscle (3, 4). Norheim et al. (3) demonstrated that PEDF was secreted by cultured human myotubules. Raschke et al. (4) have also shown that PEDF was released by myotubes in response to electrical stimulation. We previously found that PEDF was positively correlated with whole body lean mass, and with appendicular lean mass (which is comprised predominantly of skeletal muscle in the arms and legs) in children and young adults (11). The association of PEDF with appendicular mass also held true for the children with T2DM. These finding were consistent with the possibility that PEDF is released into circulation from both skeletal muscle and visceral organs such as liver. Thus, variation in lean mass and fat mass, which are both higher in obese and T2DM children, accounts for about 21% of the variation in PEDF across all three groups. From the available data the relationship appears to be linear and there does not appear to be a qualitative difference in the contribution of lean or fat mass to PEDF variability across the range of measured values in our study.
We and others have previously shown that PEDF is positively associated with insulin resistance (1, 5, 6, 11). In this study, HOMA-IR was unassociated with PEDF within the T2DM group, but curvilinear association between PEDF and insulin was identified. Using a frequently sampled IV glucose tolerance test, Sabater et al. demonstrated that insulin sensitivity independently explained 14% of circulating PEDF levels (5), a predictive value similar to the r2 observed of the combined groups in this study (15%). Using a more direct approach, Crowe et al. showed that PEDF infusion into lean mice resulted in reduced whole-body insulin sensitivity and insulin-stimulated glucose uptake in skeletal muscle (6). To determine if PEDF induces insulin resistance by changes in vascularity, Lakeland et al. recently used a transgenic mouse model to measure the impact of overexpression of PEDF (21). Although insulin resistance was not increased in the model, adipocyte lipolysis was increased (21). Nevertheless, most of the available evidence suggests that a positive, and potentially causal relationship exists between PEDF and insulin resistance, although a mechanism of action has not been determined.
We acknowledge some limitations to our study. The study is a cross-sectional so our data allow us to establish associations, but not causation. Further studies of adipocytes and adipose tissue macrophages will be needed to understand the mechanisms linking PEDF with inflammation. However, to our knowledge this is the first study to examine circulating levels of PEDF in children with T2DM.
In conclusion, we have demonstrated that PEDF is increased in children with T2DM compared with normal weight peers but this difference is attributable to obesity and insulin rather than diabetes per se. PEDF was positively associated with lean mass, fat mass, and insulin in children with T2DM. Further studies will be needed to determine the mechanisms underlying these associations.
Acknowledgements
Funding for this study was provided by the Endocrine Fellows Foundation Marilyn Fishman Grant for Diabetes Research, the Lawson Wilkins Pediatric Endocrine Society Clinical Scholars Award, the University of Oklahoma Health Sciences Center, Department of Pediatric Diabetes and Endocrinology and NIH Grant Number P20 RR 024215 from the COBRE Program of the National Center for Research Resources.
References
- 1.Bell C Pigment epithelium-derived factor: a not so sympathetic regulator of insulin resistance? Exerc Sport Sci Rev 2011: 39: 187–190. [DOI] [PubMed] [Google Scholar]
- 2.Bohm A, Ordelheide AM, Machann J et al. Common genetic variation in the SERPINF1 locus determines overall adiposity, obesity-related insulin resistance, and circulating leptin levels. PLoS One 2012: 7: e34035. [DOI] [PMC free article] [PubMed] [Google Scholar]
- 3.Norheim F, Raastad T, Thiede B, Rustan AC, Drevon CA, Haugen F. Proteomic identification of secreted proteins from human skeletal muscle cells and expression in response to strength training. Am J Physiol Endocrinol Metab 2011: 301: E1013–E1021. [DOI] [PubMed] [Google Scholar]
- 4.Raschke S, Eckardt K, Bjorklund Holven K, Jensen J, Eckel J. Identification and validation of novel contraction-regulated myokines released from primary human skeletal muscle cells. PLoS One 2013: 8: e62008. [DOI] [PMC free article] [PubMed] [Google Scholar]
- 5.Sabater M, Moreno-Navarrete JM, Jose Ortega F et al. Circulating pigment epithelium-derived factor levels are associated with insulin resistance and decrease after weight loss. J Clin Endocrinol Metab 2010: 95: 4720–4728. [DOI] [PubMed] [Google Scholar]
- 6.Crowe S, Wu LE, Economou C et al. Pigment epithelium-derived factor contributes to insulin resistance in obesity. Cell Metab 2009: 10: 40–47. [DOI] [PubMed] [Google Scholar]
- 7.Nakamura K, Yamagishi S, Adachi H, Kurita-Nakamura Y, Matsui T, Inoue H. Serum levels of pigment epithelium-derived factor (PEDF) are positively associated with visceral adiposity in Japanese patients with type 2 diabetes. Diabetes Metab Res Rev 2009: 25: 52–56. [DOI] [PubMed] [Google Scholar]
- 8.Nakamura K, Yamagishi S, Adachi H, Matsui T, Kurita Y, Imaizumi T. Serum levels of pigment epithelium-derived factor (PEDF) are an independent determinant of insulin resistance in patients with essential hypertension. Int J Cardiol 2010: 143: 96–98. [DOI] [PubMed] [Google Scholar]
- 9.Yamagishi S, Adachi H, Abe A et al. Elevated serum levels of pigment epithelium-derived factor in the metabolic syndrome. J Clin Endocrinol Metab 2006: 91:2447–2450. [DOI] [PubMed] [Google Scholar]
- 10.Jenkins A, Zhang SX, Gosmanova A et al. Increased serum pigment epithelium derived factor levels in type 2 diabetes patients. Diabetes Res Clin Pract 2008: 82: e5–e7. [DOI] [PMC free article] [PubMed] [Google Scholar]
- 11.Sunderland KL, Tryggestad JB, Wang JJ et al. Pigment epithelium-derived factor (PEDF) varies with body composition and insulin resistance in healthy young people. J Clin Endocrinol Metab 2012: 97: E2114–E2118. [DOI] [PMC free article] [PubMed] [Google Scholar]
- 12.Tryggestad JB, Thompson DM, Copeland KC, Short KR. Obese children have higher arterial elasticity without a difference in endothelial function: the role of body composition. Obesity (Silver Spring) 2012: 20: 165–171. [DOI] [PMC free article] [PubMed] [Google Scholar]
- 13.Tryggestad JB, Thompson DM, Copeland KC, Short KR. Arterial compliance is increased in children with type 2 diabetes compared with normal weight peers but not obese peers. Pediatr Diabetes 2013: 14: 259–266. [DOI] [PMC free article] [PubMed] [Google Scholar]
- 14.American Diabetes A Standards of medical care in diabetes – 2012. Diabetes Care 2012: 35 (Suppl. 1): S11–S63. [DOI] [PMC free article] [PubMed] [Google Scholar]
- 15.Marshall WA, Tanner JM. Variations in pattern of pubertal changes in girls. Arch Dis Child 1969: 44: 291–303. [DOI] [PMC free article] [PubMed] [Google Scholar]
- 16.Marshall WA, Tanner JM. Variations in the pattern of pubertal changes in boys. Arch Dis Child 1970: 45: 13–23. [DOI] [PMC free article] [PubMed] [Google Scholar]
- 17.Matthews DR, Hosker JP, Rudenski AS, Naylor BA, Treacher DF, Turner RC. Homeostasis model assessment: insulin resistance and beta-cell function from fasting plasma glucose and insulin concentrations in man. Diabetologia 1985: 28: 412–419. [DOI] [PubMed] [Google Scholar]
- 18.Chen HB, Jia WP, Lu JX et al. Change and significance of serum pigment epithelium-derived factor in type 2 diabetic nephropathy. Zhonghua yi xue za zhi 2007: 87: 1230–1233. [PubMed] [Google Scholar]
- 19.Famulla S, Lamers D, Hartwig S et al. Pigment epithelium-derived factor (PEDF) is one of the most abundant proteins secreted by human adipocytes and induces insulin resistance and inflammatory signaling in muscle and fat cells. Int J Obes (Lond) 2011: 35: 762–772. [DOI] [PubMed] [Google Scholar]
- 20.Matsumoto K, Ishikawa H, Nishimura D, Hamasaki K, Nakao K, Eguchi K. Antiangiogenic property of pigment epithelium derived facgtyor in hepatocellular carcinoma. Hepatology 2004; 40: 252–259. [DOI] [PubMed] [Google Scholar]
- 21.Lakeland TV, Borg ML, Matzaris M, Abdelkader A, Evans RG, Watt MJ. Augmented expression and secretion of adipose-derived pigment epithelium-derived factor does not alter local angiogenesis or contribute to the development of systemic metabolic derangements. Am J Physiol Endocrinol Metab 2014: 306: E1367–E1377. [DOI] [PubMed] [Google Scholar]