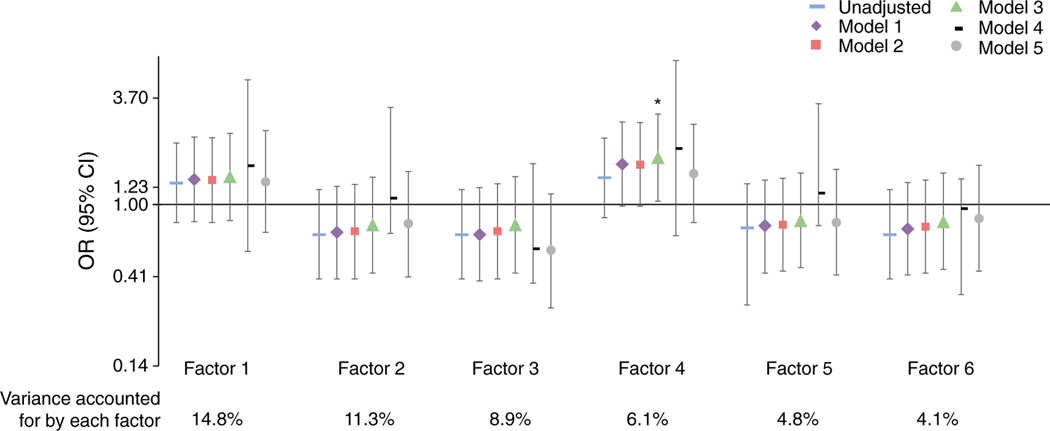
Fig. 5.
PCA was used to consolidate 767 metabolites into latent variables (‘factors’) that may be interpreted as metabolite patterns. Factor scores were selected based on visual inspection of the Scree plot and eigenvalues >1. Six factors were retained for use in analysis. Associations of in utero GDM exposure (yes [n = 92] vs no [n = 500]) with odds (OR) of being in Q4 vs Q1–3 of each factor score at T1 (age 6–14 years) among the 592 EPOCH participants are shown. The variance accounted for by each factor is indicated on the graph. Model 1: adjusted for child’s sex, age and race/ethnicity; Model 2: Model 1 + maternal smoking habits during pregnancy (smoking, yes vs no); Model 3: Model 2 + pubertal status (Tanner stage), physical activity (mean METs/day over a 3-day period) and total energy intake (kJ/day); Model 4: Model 3 + GDM treatment (diet and/or exercise only, diet and/or exercise with insulin or insulin alone, or no treatment); Model 5: Model 2 + maternal pre-pregnancy BMI (kg/m2). The estimates are plotted on a loge scale and the horizontal line represents the null (OR 1.00). *Significant at α = 0.05

