

Abstract
Dendritic cell (DC) activation by viral RNA sensors such as TLR3 and MDA‐5 is critical for initiating antiviral immunity. Optimal DC activation is promoted by type I interferon (IFN) signaling which is believed to occur in either autocrine or paracrine fashion. Here, we show that neither autocrine nor paracrine type I IFN signaling can fully account for DC activation by poly(I:C) in vitro and in vivo. By controlling the density of type I IFN‐producing cells in vivo, we establish that instead a quorum of type I IFN‐producing cells is required for optimal DC activation and that this process proceeds at the level of an entire lymph node. This collective behavior, governed by type I IFN diffusion, is favored by the requirement for prolonged cytokine exposure to achieve DC activation. Furthermore, collective DC activation was found essential for the development of innate and adaptive immunity in lymph nodes. Our results establish how collective rather than cell‐autonomous processes can govern the initiation of immune responses.
Keywords: cytokine signaling, dendritic cell activation, quorum sensing, type I IFN
Subject Categories: Immunology
Optimal initiation of antiviral immune responses requires collective type‐I interferon production by multiple dendritic cells in entire lymph nodes, rather than cell‐autonomous process based on autocrine/paracrine signals.
Introduction
The activation of dendritic cells (DCs) mediated by recognition of pathogen‐associated molecular patterns (PAMPs) represents a central event for the initiation of innate and adaptive immune responses. For example, sensing of viral dsRNA or of the viral mimic poly(I:C) by Toll‐like receptor 3 (TLR3) and melanoma differentiation‐associated protein 5 (MDA‐5) induces major changes in DC biology, associated in particular with a metabolic switch toward glycolysis, the production of inflammatory cytokines, and the upregulation of costimulatory molecules (Longhi et al, 2009; Beuneu et al, 2011; Pantel et al, 2014). These changes are also essential for DCs to gain the capacity to prime T‐cell responses (Schulz et al, 2005; Kumar et al, 2008; Trumpfheller et al, 2008; Longhi et al, 2009).
Dendritic cells produce and sense type I interferon (IFN) upon PAMP recognition (Gautier et al, 2005). Importantly, type I IFN receptor (IFNAR) signaling has been shown to be critical for DC activation in response to poly(I:C) (Longhi et al, 2009; Beuneu et al, 2011; Pantel et al, 2014). It has been proposed that autocrine (cells responding to their own cytokine production) and/or paracrine (cells responding to the production by neighboring cells) signaling drive DC activation (Gautier et al, 2005; Patil et al, 2015). In vitro experiments have shown distinct activation profiles by TLR agonist when cells are cultured as single cells or as a cell population and suggested a role for paracrine signaling propagated by a small subset of cytokine‐producing cells. For example, the in vitro response of bone marrow‐derived DCs (BMDCs) to LPS was found to be initiated by a few precocious cells and extended later in all cells through type I IFN (Shalek et al, 2014). Similarly, a subpopulation of high TNF‐α producers was necessary for optimal macrophage activation at the population level in response to LPS (Xue et al, 2015). Finally, it has been proposed that a small fraction of plasmacytoid DC (pDC)‐producing type I IFN initiates an amplification loop driving robust pDC responses (Wimmers et al, 2018).
In addition to autocrine and paracrine communication, quorum sensing represents an important mode of cellular communication. Initially described in bacteria (Miller & Bassler, 2001), it has recently been observed within immune cells (Amado et al, 2013; Antonioli et al, 2018, 2019; Polonsky et al, 2018; Postat et al, 2018; Postat & Bousso, 2019; Zenke et al, 2020). This model implies that the concentration of a soluble mediator generated by an individual cell is too low to exhibit any biological effect on the producing cell or on neighboring cells. However, once a sufficient proportion of secreting cells is reached, all cells respond in a coordinated manner. Applied to cytokines, the cellular response will be predicted by the quorum of cytokine‐producing cells and operate globally at the tissue level. Quorum sensing shares similarities and differences with autocrine and paracrine communication (Fig 1), although these terms have sometimes been used loosely. Like in autocrine signaling, cells have the ability to respond to a soluble mediator they produce. Yet, in quorum sensing, isolated cells do not produce enough mediators to respond. Quorum sensing has also similarities with paracrine communication as it enables cells to talk to each other. But these modes of communication also differ from each other. First, paracrine implies by definition (para‐), close proximity between the producing and the responding cell. Most importantly, in quorum sensing (unlike in paracrine signaling), cells do not communicate with neighbors when the cellular density is below threshold (Doganer et al, 2016).
Figure 1. Different models of cell‐cell communication through cytokine.
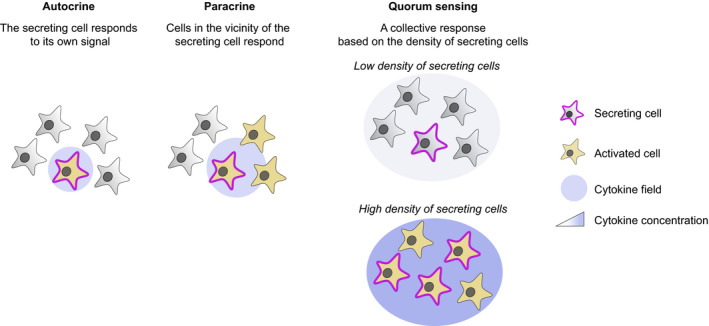
Schemes illustrating distinct modes of cellular communication potentially contributing to DC activation. In the autocrine model, cells respond to their own cytokine production, while in the paracrine model, cells respond to the cytokine produced by their close neighbors. Finally, during quorum sensing, the cellular response is collective but critically depends on the density of secreting cells. In this model, a low density of secreting cells may not achieve detectable activation while a high density of cytokine‐producing cells triggers collective activation.
Here, we investigated the mechanisms governing TLR3/MDA‐5‐mediated DC activation. We found that DC activation is not a cell‐autonomous process but instead requires the collective production of type I IFN by numerous DCs. This process, distinct from autocrine and paracrine communication, was in fact very similar to quorum sensing and enforced a collective and coordinated behavior in lymph nodes that was essential for the proper initiation of innate and adaptive immune responses.
Results
Cellular density influences dendritic cell activation by poly(I:C)
To test whether DC activation is necessarily a cell‐autonomous process, we cultured BMDCs at different cellular densities and stimulated them with the viral mimic poly(I:C) for 24 h. Cell survival was similar in all conditions tested (Appendix Fig S1). We assessed DC activation focusing on the typical costimulatory molecules CD86 and CD40. While potent activation of DC (identified as CD11c+MHC class II+ cells) was noted at densities > 2 × 10⁵ cell/cm2, we did not detect upregulation of these key activation markers at lower densities, suggesting that DC activation by poly(I:C) is not a cell‐autonomous process (Fig 2A and B). The strong cooperativity in the activation process was supported by a sigmoid fit revealing Hill coefficient (cooperativity) of h = 33 and h = 11 for CD86 and CD40, respectively (Appendix Fig S2).
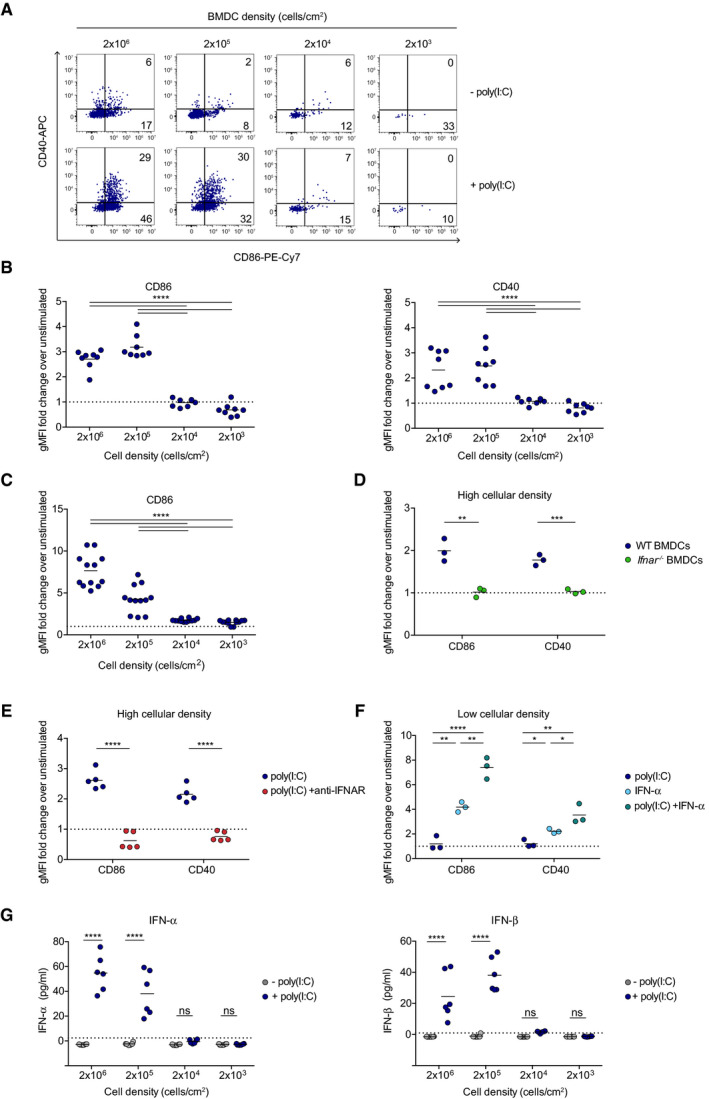
Figure 2. Cellular density influences dendritic cell activation by poly(I:C) in vitro .
-
A, BBMDCs were plated at different densities and stimulated with poly(I:C) for 24 h or left unstimulated. DC activation was evaluated based on surface expression of CD86 and CD40 molecules as measured by flow cytometry. (A) Representative dot plots showing CD86 and CD40 expression. (B) Quantification of CD86 and CD40 upregulation as a fold change in geometric mean fluorescence intensity (gMFI) over unstimulated controls. Data are pooled from 3 independent experiments.
-
CMutuDCs were plated at different cell densities and stimulated with poly(I:C) or left unstimulated. The graph shows the upregulation of CD86 as a fold change in gMFI over unstimulated cells. Data are pooled from 4 independent experiments.
-
DFlow cytometric quantification of CD86 and CD40 upregulation on WT (blue) or Ifnar −/− (green) BMDCs expressed as a fold change in gMFI over unstimulated controls.
-
ECD86 and CD40 expression was quantified on BMDCs plated at high density (2 × 10⁵ cells/cm2) and stimulated with poly(I:C) in the presence (red dots) or absence (blue dots) of anti‐IFNAR1 blocking antibody. Data are pooled from 2 independent experiments.
-
FCD86 and CD40 expression was quantified on BMDCs plated at low density (2 × 10³ cells/cm2) and stimulated with poly(I:C) (dark blue dots), IFN‐α (light blue dots) or a combination of both (green dots). Data are representative of 2 independent experiments.
-
GIFN‐α (left) and IFN‐β (right) production was quantified by ELISA for BMDCs plated at different densities and stimulated or not with poly(I:C). Dotted lines represent the ELISA threshold of detection. Data are pooled from 2 independent experiments.
Data information: Black lines indicate mean values. Dotted lines in B, C, D, E, and F represent a fold change equal to 1. (*P < 0.05, **P < 0.01, ***P < 0.001, ****P < 0.0001, ns; non‐significant, one‐way ANOVA (B, C, and F) and unpaired t‐test (D, E, and G)).
Bone marrow‐derived DC cultures can exhibit substantial cellular heterogeneity, and it remained formally possible that rare subsets may be lost at low density. We therefore repeated the experiment using the MutuDC cell line, a DC line established from the spleen of CD11c:SV40LgT‐transgenic mice (Fuertes Marraco et al, 2012). Similar to what we observed with BMDCs, MutuDC activation was critically dependent on cellular density requiring a density of 2 × 10⁵ cell/cm2 or more (Fig 2C). At high cellular density, we observed an additional regulation of DC activation by the total culture volume, suggesting that a diffusible mediator accounts for the density‐dependent activation process (Appendix Fig S3).
Previous studies have highlighted the role of type I IFN in DC activation (Gautier et al, 2005; Longhi et al, 2009; Beuneu et al, 2011). Confirming these findings, we found that the activation of DCs by poly(I:C) was abolished when using BMDCs derived from Ifnar −/− mice or in the presence of anti‐IFNAR1 Ab (Fig 2D and E). Reciprocally, the addition of type I IFN to low‐density DC cultures was sufficient to restore DC activation (Fig 2F). We therefore examined the production of IFN‐α and IFN‐β by DCs in response to poly(I:C) as a function of cell density. Notably, the production of type I IFN was not proportional to the number of DC present in the culture and was only detected above a cellular density threshold (Fig 2G). Consistent with this idea, the classical ISG (interferon‐stimulated gene) Mx1 was only upregulated when DCs were stimulated at high density (Appendix Fig S4). These results support the idea that a threshold density of DCs is needed to initiate the robust production of type I IFN in response to poly(I:C) and subsequently drive DC activation.
Type I IFN production enforces collective DC activation in vitro
To further dissect the role of type I IFN in DC activation, we took advantage of Irf3 −/− Irf7 −/− mice in which type I IFN production is abolished (Sato et al, 2000; Beuneu et al, 2011). As expected, Irf3 −/− Irf7 −/− BMDCs did not produce IFN‐α or IFN‐β in response to poly(I:C) (Fig 3A). Additionally, Irf3 −/− Irf7 −/− BMDCs did not upregulate CD40 and CD86 costimulatory molecules upon poly(I:C) stimulation, even when cultured at high density (Fig 3B). This defect could be reversed by the addition of IFN‐α during the stimulation, indicating that Irf3 −/− Irf7 −/− BMDCs remain competent for the upregulation of costimulatory molecules (Fig 3C). A certain threshold of IFN‐α was required for DC activation. Above this threshold, the extent of CD40 and CD86 upregulation was somewhat modulated by the cytokine concentration before reaching a plateau (Appendix Fig S5).
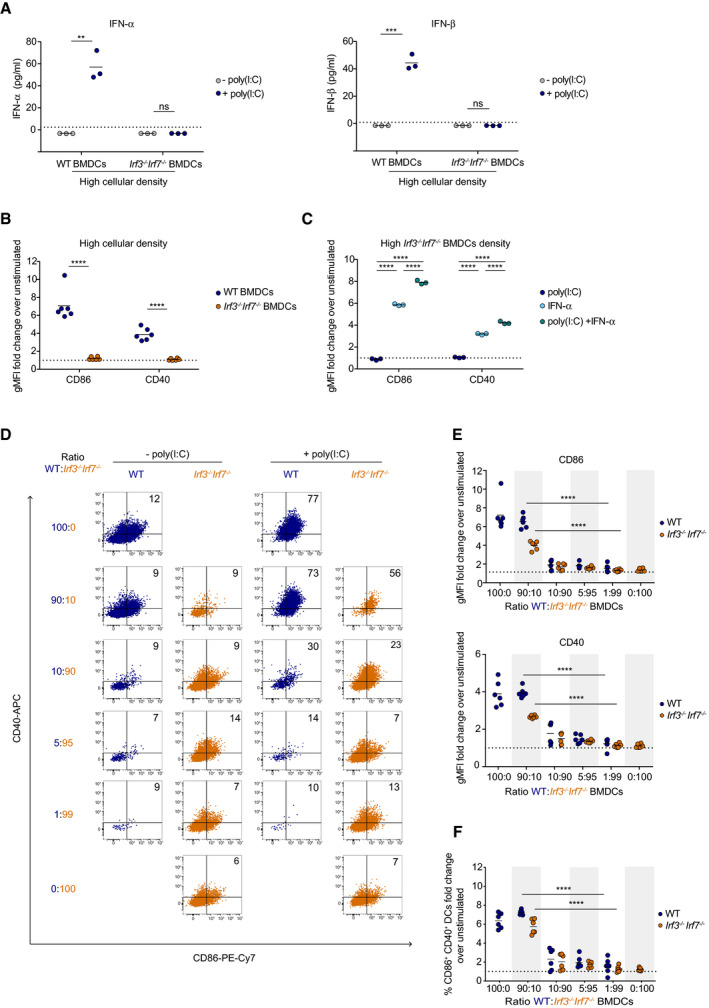
Figure 3. The density of type I IFN‐producing cells regulates DC activation by poly(I:C) in vitro .
-
AIFN‐α (left) and IFN‐β (right) production by WT and Irf3 −/− Irf7 −/− BMDCs plated at high density (2 × 10⁵ cells/cm2) and stimulated with poly(I:C) (blue dots) or left unstimulated (gray dots). Dotted lines represent the ELISA threshold of detection. Data are representative of 2 independent experiments.
-
BCD86 and CD40 expression was quantified on WT (blue dots) and Irf3 −/− Irf7 −/− (orange dots) BMDCs plated at high density (2 × 10⁵ cells/cm2) and stimulated with poly(I:C) or left unstimulated. Data are pooled from 2 independent experiments.
-
CCD86 and CD40 expression on Irf3 −/− Irf7 −/− BMDCs plated at 2 × 10⁵ cells/cm2 and stimulated with poly(I:C) (dark blue dots), IFN‐α (light blue dots), or a combination of both (green dots). Data are representative of 2 independent experiments.
-
D, EWT and Irf3 −/− Irf7 −/− BMDCs were mixed at different ratios for a total number of 2 × 10⁵ cells/cm2 and stimulated with poly(I:C) or left unstimulated. (D) Representative dot plots showing CD86 and CD40 expression on WT (blue dots) and Irf3 −/− Irf7 −/− (orange dots) BMDCs. (E) Flow cytometric quantification of CD86 and CD40 expression on WT (blue dots) and Irf3 −/− Irf7 −/− (orange dots) BMDCs expressed as a fold change in gMFI over unstimulated controls.
-
FCD86 and CD40 expression on WT (blue dots) and Irf3 −/− Irf7 −/− (orange dots) BMDCs expressed as a fold change in the proportion of CD86+ CD40+ cells over unstimulated controls. Data are pooled from 2 independent experiments.
Data information: Black lines indicate mean values. Dotted lines in B, C, E, and F represent a fold change equal to 1. (**P < 0.01, ***P < 0.001, ****P < 0.0001, ns; non‐significant, unpaired t‐test (A, B, E, and F) and one‐way ANOVA (C)).
Based on these results, we thought to test the idea that the density of type I IFN‐producing cells is critical for DC activation by poly(I:C). We therefore prepared wild‐type (WT) and Irf3 −/− Irf7 −/− BMDCs and subsequently mixed them at different ratios, keeping the total cell number constant (corresponding to a cellular density at which WT DCs are efficiently activated by poly(I:C)) and stimulated the cells with poly(I:C) (Fig 3D–F). Cell ratios were stable during the stimulation suggesting similar survival capacity for WT and Irf3 −/− Irf7 −/− BMDCs (Appendix Fig S6). In cultures containing a majority of WT DCs (ratio 90:10), we observed that both WT and Irf3 −/− Irf7 −/− DCs were efficiently activated, suggestive of DC activation in trans (Fig 3D–F). At this ratio, we noted a small difference in the activation of WT and Irf3 −/− Irf7 −/− DCs, possibly due to a minor contribution of autocrine signaling. Most importantly, when the frequency of DCs competent for type I IFN production decreased (ratio 5:95 or 1:99), we observed defective BMDC activation not only for Irf3 −/− Irf7 −/− DCs but also for WT DCs (Fig 3D–F). Similar observations were made by testing additional WT:Irf3 −/− Irf7 −/− DC ratios (Appendix Fig S7). These results are not compatible with a major contribution of autocrine type I IFN signaling in response to poly(I:C) that would imply a robust activation of WT DCs. The data are also not in favor of a local paracrine mode of communication that would additionally result in the activation of some Irf3 −/− Irf7 −/− DCs present in the vicinity of WT DCs. Instead, these data support the idea that DC activation by poly(I:C) in vitro is a collective process, in which the outcome of the entire population is dependent on a threshold density of type I IFN‐producing cells.
Quorum sensing drives collective DC activation in draining lymph nodes
While our in vitro results suggest a collective regulation of DC activation, it is unclear whether this model also pertains to in vivo settings where cytokine diffusion, cell behavior, and distribution in tissue may substantially differ from culture conditions.
We noted that footpad injection of poly(I:C) led to the activation of DCs in the draining lymph node but not in the non‐draining lymph node, providing an in vivo model for local DC responses (Fig 4A). DC activation was abolished in Irf3 −/− Irf7 −/− mice but could be restored by the administration of exogenous IFN‐α (Appendix Fig S8), confirming the requirement for type I IFN production in vivo (Fig 4A). Based on these results, we thought to generate mice with defined densities of type I IFN‐producing immune cells. To this end, we prepared mixed‐bone marrow chimeras reconstituted with distinct ratios of WT and Irf3 −/− Irf7 −/− bone marrow cells (Fig 4B). We used Irf3 −/− Irf7 −/− recipients to ensure that type I IFN‐producing cells are of hematopoietic origin. Of note, a similar distribution of cDC1 and cDC2 was noted for WT, Irf3 −/− Irf7 −/−, or chimeric mice (Appendix Fig S9).
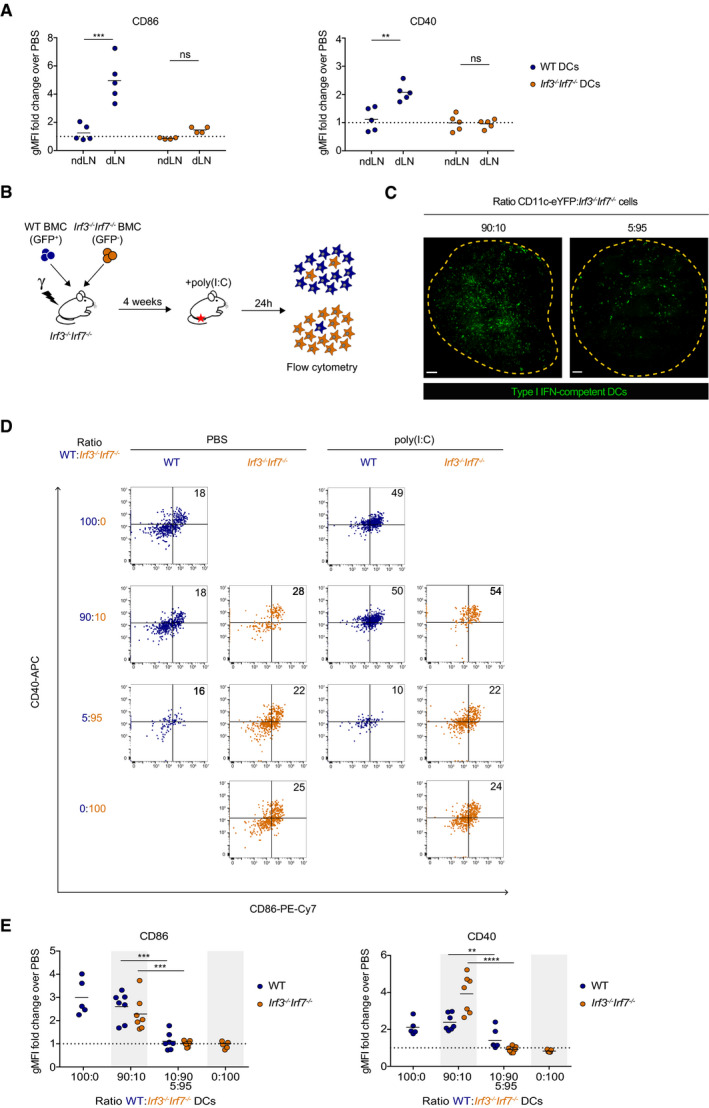
Figure 4. A quorum‐based mechanism governs DC activation in vivo .
-
ACD86 and CD40 expression was quantified on WT (blue dots) and Irf3 −/− Irf7 −/− (orange dots) DCs in non‐draining (ndLN) and draining (dLN) popliteal lymph nodes of WT and Irf3 −/− Irf7 −/− mice injected with poly(I:C) or PBS. Data are pooled data from 2 independent experiments.
-
BExperimental set‐up. Irf3 −/− Irf7 −/− recipient mice were lethally irradiated and reconstituted with WT (GFP+) and Irf3 −/− Irf7 −/− (GFP‐) bone marrow cells (BMCs) mixed at different ratios. Chimeras were injected in the footpad 4 weeks later with poly(I:C) and WT and Irf3 −/− Irf7 −/− DCs from non‐draining and draining popliteal lymph nodes were analyzed 24 h after poly(I:C) injection by flow cytometry.
-
CMicroscopy images of sliced draining lymph nodes in CD11c‐eYFP:Irf3 −/− Irf7 −/− chimeras with 90:10 (left) and 5:95 (right) ratios. Type 1 IFN‐competent cells appear in green. Mosaic images were generated by acquisition of overlapping imaging fields. Scale bars represent 25 µm.
-
D, ECD86 and CD40 expression on WT (blue dots) and Irf3 −/− Irf7 −/− (orange dots) DCs from draining lymph nodes of mixed‐bone marrow chimeras with indicated WT:Irf3 −/− Irf7 −/− ratios. (D) Representative dot plots of CD86 and CD40 expression on WT (blue dots) and Irf3 −/− Irf7 −/− (orange dots) DCs of chimeras injected with PBS or poly(I:C). (E) Flow cytometric quantification of CD86 and CD40 expression on WT and Irf3 −/− Irf7 −/− DCs in chimeras injected with PBS or poly(I:C). Results from 5:95 and 10:90 chimeras were similar and pooled. Data are pooled from 3 independent experiments.
Data information: Each dot represents one mouse. Black lines indicate mean values. Dotted lines in A and E represent a fold change equal to 1. (**P < 0.01, ***P < 0.001, ****P < 0.0001, ns; non‐significant, unpaired t‐test).
To visualize that chimeras indeed exhibited distinct densities of DCs competent for type I IFN production in lymph nodes, we also created chimeras using CD11c‐eYFP bone marrow cells instead of WT cells as a source of type I IFN‐competent cells (Fig 4C). We calculated the density of type I IFN‐competent DCs to be 2.7 ± 0.7 × 10⁴ and 1.4 ± 0.4 × 10⁵ cells/cm2 when 5% and 90% of WT cells were used in the chimeras, respectively. In chimeras reconstituted with 100% of WT cells, DCs were efficiently activated in response to poly(I:C), while no activation was detected in chimeras reconstituted with 100% of Irf3 −/− Irf7 −/− cells (Fig 4D and E). In chimeric mice containing a majority of DC competent for type I IFN production (WT:Irf3 −/− Irf7 −/− ratio = 90:10), we observed potent activation of WT but also of Irf3 −/− Irf7 −/− DCs (Fig 4D and E). By contrast, in chimeric mice containing only 5‐10% of WT DCs, neither Irf3 −/− Irf7 −/− nor WT DCs became activated in response to poly(I:C) (Fig 4D and E). Taken together, these results provide in vivo evidence that DC activation follows a collective but not a cell‐autonomous process and operates in a widespread manner in the lymph node. While previous studies have indicated that, within hematopoietic compartments, DCs (and monocytes) are the main producers of type I IFN in response to poly(I:C) (Longhi et al, 2009), it is formally possible that other cells contribute as well. We tested whether type I IFN produced by DCs could be at least sufficient to activate bystander DCs by transferring poly(I:C)‐activated WT DCs in Irf3 −/− Irf7 −/− mice and monitoring host DC activation. Irf3 −/− Irf7 −/− DCs were efficiently activated (Appendix Fig S10) supporting the idea that DC‐derived type I IFN contributes to collective activation. Overall, our results establish the requirement of a quorum of type I IFN‐producing cells to enforce collective DC activation.
Prolonged exposure to type I IFN is required for DC activation
It is expected that type I IFN concentration is initially higher around cytokine‐producing DCs, but progressively homogenize in the tissue due to diffusion. The fact that we did not observe any evidence for cell‐autonomous DC activation is intriguing but could possibly be explained if the cytokine diffuses too rapidly to act locally. We therefore asked how long do DCs need to be exposed to type I IFN to become activated. We took advantage of the fact that WT BMDCs cultured at low density and stimulated with poly(I:C) became activated when supplemented by exogenous type I IFN and used anti‐IFNAR1 Ab to interrupt cytokine signaling at various time points (Fig 5A). DC activation was assessed at 24 h for all conditions. Robust BMDC activation was seen when BMDCs were exposed to IFN‐α for 24 h whereas exposure during the first 6 h only resulted in partial activation (Fig 5B and C). Importantly, stimulation of BMDCs with IFN‐α for only one hour at any time during the first 6 h was insufficient to trigger a substantial upregulation of CD86 and CD40 costimulatory molecules (Fig 5B and C).
Figure 5. Optimal DC activation requires prolonged exposure to type I IFN.
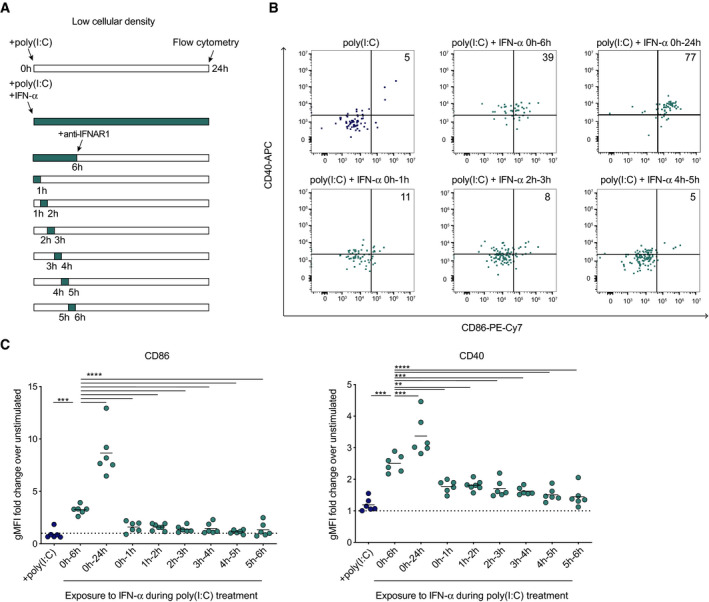
- Experimental set‐up. BMDCs cultured at low density (2 × 10³ cells/cm2) were stimulated with poly(I:C) and IFN‐α was added at various time points. IFNAR signaling was interrupted using anti‐IFNAR1 blocking antibody at the indicated time point. BMDC activation was measured 24 h after poly(I:C) stimulation by flow cytometry.
- Representative dot plots showing CD86 and CD40 expression by low‐density BMDCs stimulated with poly(I:C) for different periods of IFN‐α exposure.
- Quantification of CD86 and CD40 upregulation by BMDCs expressed as a fold change in gMFI over unstimulated controls. Data are pooled from 2 independent experiments. Black lines indicate mean values. Dotted lines represent a fold change equal to 1. (**P < 0.01, ***P < 0.001, ****P < 0.0001, one‐way ANOVA).
By examining cytokine exposure periods spanning between 6 and 24 h, we found that the need for prolonged exposure was even more marked for CD86 (24 h) than for CD40 (6 h) (Appendix Fig S11). Thus prolonged (>6 h) exposure to type I IFN is required for optimal DC activation, likely limiting local cytokine effects.
Collective DC activation is essential to initiate inflammatory responses
To test whether collective DC activation is important during immune responses in vivo, we analyzed the inflammatory responses in the draining lymph node after poly(I:C) injection. In particular, it is well established that DC activation can trigger NK cell activation (Fernandez et al, 1999; Akazawa et al, 2007; Lucas et al, 2007; McCartney et al, 2009). NK cell activation in response to poly(I:C) is known to be critically dependent on the presence of DCs and on their ability to transpresent IL‐15 to NK cells (Lucas et al, 2007; Mortier et al, 2008). We used mixed‐bone marrow chimeras containing high or low frequencies of cells competent for type I IFN production to test the impact of collective DC activation on innate immunity. We found that chimeras reconstituted with 90:10 (WT:Irf3 −/− Irf7 −/−) cells exhibit a strong inflammatory response with the recruitment of monocytes in the draining lymph node (Fig 6A and B). Importantly, NK cells were efficiently activated in chimeric mice containing a majority of type I IFN‐competent cells as detected by an increased granzyme B intracellular content and high CD69 surface expression (Fig 6C and D). This was not the case for NK cells in chimeras containing a low proportion of cells competent for type I IFN production (Fig 6C and D). Importantly, both WT and Irf3 −/− Irf7 −/− NK cells behave identically in the various chimeras arguing against a direct impact of Irf3/Irf7 deficiency on NK cell activation (Appendix Fig S12A). Thus, collective DC activation is essential to drive innate immune activation in the draining lymph node in response to poly(I:C).
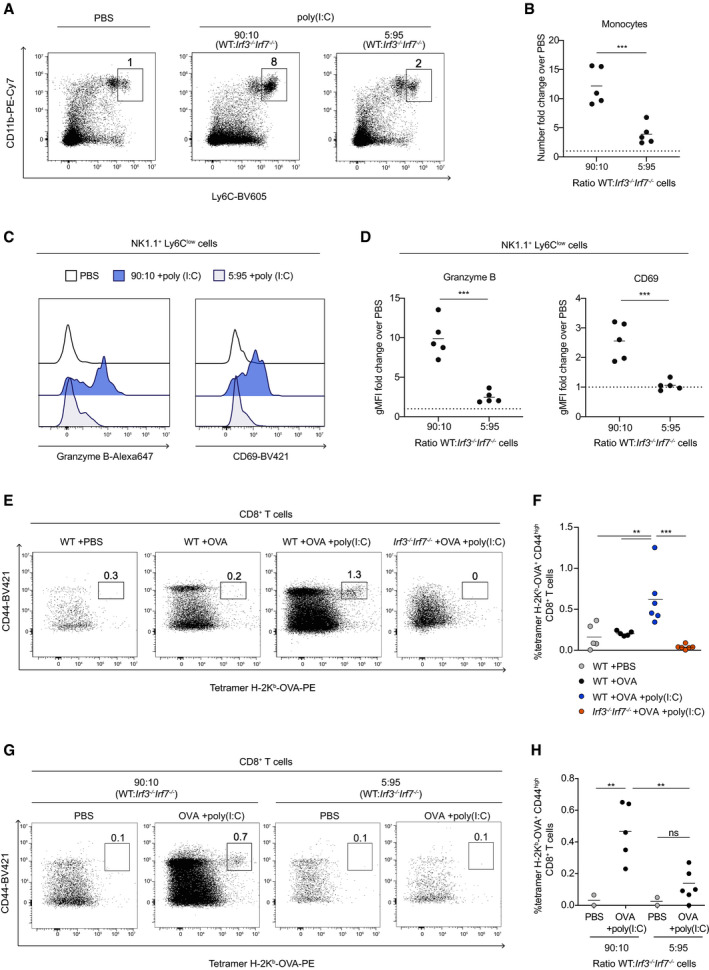
Figure 6. Collective DC activation regulates inflammation and T‐cell immunity.
-
A, BMonocyte recruitment in the draining lymph node requires collective DC activation (A) Representative dot plots showing the percentage of monocytes (CD11b+ Ly6Chigh cells, black box) present in popliteal dLN of WT:Irf3 −/− Irf7 −/− chimeric mice injected with poly(I:C) (middle and right) or with PBS (left). CD11b+ Ly6Clow/int cells corresponded to neutrophils and were not included in the analysis. (B) Flow cytometric quantification of monocyte numbers in the lymph nodes of mice injected with poly(I:C) expressed as a fold change over PBS controls. Data are pooled from 2 independent experiments.
-
C, DActivation of NK cells in the draining lymph node requires collective DC activation. (C) Representative histograms showing granzyme B and CD69 expression by NK1.1+ Ly6Clow cells in dLN of 90:10 (dark blue) and 5:95 (gray) WT:Irf3 −/− Irf7 −/− chimeric mice injected with poly(I:C) or with PBS (black line). (D) Quantification of granzyme B intracellular content (left) and CD69 expression (right) in NK1.1+ Ly6Clow cells of chimeric mice injected with poly(I:C), expressed as a fold change in gMFI over PBS‐injected controls. Data are pooled from 2 independent experiments.
-
E, FCross‐priming of CD8+ T cells requires DC activation and type I IFN. (E) Representative dot plots showing the percentage of CD44high Kb‐OVA tetramer+ CD8+ T cells in the draining lymph node of WT and Irf3 −/− Irf7 −/− mice injected with PBS, OVA, or a mixture of OVA plus poly(I:C). (F) Flow cytometric quantification of CD44high H‐2Kb‐OVA tetramer+ CD8+ T cells in the draining lymph node of WT mice injected with PBS (gray dots), OVA (black dots), OVA plus poly(I:C) (blue dots) and in draining lymph node of Irf3 −/− Irf7 −/− mice injected with OVA plus poly(I:C) (orange dots). Data are pooled from 2 independent experiments.
-
G, HCollective DC activation is essential for the generation of T‐cell responses. (G) Representative dot plots showing the percentage of CD44high tetramer H‐2Kb‐OVA+ CD8+ T cells in the draining lymph node of chimeric mice injected with PBS or a mixture of OVA+poly(I:C). (H) Flow cytometric quantification of CD44high H‐2Kb‐OVA tetramer+ CD8+ T cells in the draining lymph node of 90:10 and 5:95 (WT:Irf3 −/− Irf7 −/−) chimeric mice injected with PBS or OVA+poly(I:C). Data are pooled from 2 independent experiments.
Data information: Each dot represents one mouse. Black lines indicate mean values. Dotted lines indicate fold change equal to 1. (**P < 0.01, ***P < 0.001, ns; non‐significant, unpaired t‐test (B and D) and one‐way ANOVA (F and H)).
Collective DC activation is essential to elicit antigen‐specific T‐cell responses
We next assessed whether collective DC activation is also important for the initiation of adaptive immune responses. Mice immunized with ovalbumin (OVA) protein in the presence of poly(I:C) developed an OVA‐specific CD8+ T‐cell response as measured by H‐2Kb‐OVA tetramer staining (Fig 6E and F). This CD8+ T‐cell response was, however, barely detectable in the absence of poly(I:C) or when we immunized Irf3 −/− Irf7 −/− mice (Fig 6E and F). These results suggest that, in this model, cross‐priming of CD8+ T cells requires DC activation and type I IFN. To test the importance of collective DC activation in this process, we immunized mixed‐bone marrow chimeras containing distinct frequencies of cells competent for type I IFN production. As shown in Fig 6G and H and Appendix Fig S12B, robust T‐cell responses (as measured by the percentage of tetramer‐positive cells) were only detected in chimeras containing a high frequency of cytokine‐producing cells, indicating that collective DC activation can be essential for the generation of T‐cell responses in vivo.
Discussion
Here, we have investigated whether dendritic cell activation is a cell‐autonomous process or whether it largely relies on extrinsic factors. We report that DC activation by poly(I:C) harbors the hallmark of a quorum sensing phenomenon, whereby the collective production of type I IFN drives DC activation at the population level in vivo. We provide evidence that the requirement for sustained type I IFN signaling in mediating full DC activation limits cell‐autonomous activity and instead promotes collective behaviors. Finally, the coordinated activation of DCs in lymph nodes was found to be essential to initiate innate and adaptive immune responses.
Dendritic cells become activated upon engagement of pathogen recognition receptors (PRR) and/or response to inflammatory mediators, such as type I IFN (Reis e Sousa, 2004). Of note, cytokines alone are not sufficient to endow DCs with their full capacity to prime T‐cell responses (Sporri & Reis e Sousa, 2005), yet IFNAR signaling remains essential, for example, in response to poly(I:C) (Longhi et al, 2009; Beuneu et al, 2011). This led us to ask how type I IFNs produced by PRR‐stimulated DCs propagate in situ to provide the required signals for DC activation.
Whether DCs respond to their own cytokine production is not clear, and in vitro experiments have reported suboptimal activation when cells are isolated (Shalek et al, 2014; Xue et al, 2015; Wimmers et al, 2018). Our in vitro and in vivo data extend these studies and establish that autocrine signaling alone cannot account for DC activation.
It is also well established that DC can become activated in trans (Le Bon et al, 2001; Sporri & Reis e Sousa, 2005). However, these studies did not address whether such activation occurred through local paracrine signaling or through quorum sensing. In the present study, the absence of DC activation when type I IFN‐producing cells are present at low density does not support the idea that DC activation proceeds in the vicinity of cytokine‐producing cells through paracrine signaling. The bulk of our data establishes that DC activation follows an all‐or‐nothing process based on a threshold level of type I IFN in the microenvironment. This response mode is reminiscent of quorum sensing mechanisms where cells produce and respond to a soluble mediator, termed autoinducer (here type I IFN). In quorum sensing, the concentration of autoinducer produced by a single cell has no biological effect, but the accumulation of the autoinducer when produced by many cells drives a collective response. Initially described in bacteria, this work and that of others indicate that quorum sensing represents an underappreciated mode of communication within the immune system (Antonioli et al, 2018, 2019; Postat & Bousso, 2019).
In order to simulate conditions where only a fraction of DCs would be responding to an infection, we deliberately devised a reductionist experimental system to restrict type I IFN production to a defined fraction of hematopoietic cells. It is important to stress that the physiological response to poly(I:C) is more complex, involving in particular type I IFN produced by stromal cells (Longhi et al, 2009).
A quorum sensing of type I IFN‐producing cells was also important for NK and T‐cell responses. Type I IFN may act directly on these lymphocyte populations, but also indirectly through DC activation known to be critical for NK and T‐cell priming (Reis e Sousa, 2004; Lucas et al, 2007).
What are the implications for a collective mode of DC activation? It is tempting to speculate that a quorum sensing mechanism may help ensure that full immune activation is only triggered when enough DCs are being stimulated. Thus, the density of type I IFN‐producing cells (or the total cell number when considering a defined volume) is expected to dictate the collective cell behavior. Consequently, such an all‐or‐nothing phenomenon should help build a margin of safety to limit undesired responses but generate strong tissue‐wide responses against rapidly spreading pathogens.
Mechanistically, both spatial and temporal parameters are likely to tune quorum sensing processes. First, efficient cytokine diffusion is by definition essential for remote activity and in vivo evidences for distant activity of cytokines have been reported previously (Perona‐Wright et al, 2010; Müller et al, 2012; Thibaut et al, 2020). Yet, the length scale at which cytokine functions in tissue is poorly characterized and is dictated by many parameters, including cytokine production, consumption, and immobilization (Altan‐Bonnet & Mukherjee, 2019). Second, biological responses that require long period of cytokine exposure (as observed here and elsewhere (Thibaut et al, 2020)) will also facilitate collective behaviors because diffusion will tend to homogenize cytokine concentration over time.
Of note, quorum sensing mechanism does not exclude heterogeneity in cellular behaviors. In some instances, activation can be propagated by a minority of cells, yet the total amount of mediator released likely dictates the coordinated response (Shalek et al, 2014; Xue et al, 2015; Wimmers et al, 2018). In addition, it is likely that autocrine, paracrine, and quorum sensing communication could co‐exist in vivo with both local and collective biological effects occurring simultaneously.
A synthetic biology approach in budding yeast has illustrated how cells that secrete and respond to the same molecule can achieve different modes of communication (autocrine, paracrine, or quorum sensing) depending on key parameters of the secrete‐and‐sense circuit, like positive feedback (Youk & Lim, 2014). In this respect, understanding under which circumstances immune activation is dictated by cell‐autonomous processes or by collective behaviors represents an important challenge for future immunological studies.
Materials and Methods
Cell line and reagent
MutuDCs were cultured in Iscove’s modified Dulbecco’s medium (IMDM) + GlutaMAX‐I (Gibco, USA) supplemented with 10% heat‐inactivated fetal bovine serum (Sigma‐Aldrich, USA), 100 U/ml penicillin (Gibco), 100 ng/ml streptomycin (Gibco), 1 mM sodium pyruvate (Gibco), 10 mM HEPES (Gibco), and 5 µM 2‐mercaptoethanol (Gibco). Phosphate‐buffered saline (PBS) (Gibco) supplemented with 2% heat‐inactivated fetal bovine serum and 1 mM EDTA (Gibco) (fluorescence‐activated cell sorting (FACS) buffer) was used for cell staining. ACK buffer (0.15 M NH4Cl, 10 mM KHCO3, 1 mM EDTA‐2Na) was used for red blood cell lysis.
Mice
Six‐ to 8‐week‐old C57BL/6J mice were purchased from ENVIGO, France. UBC‐GFP, Ifnar −/−, Irf3 −/− Irf7 −/−, and CD11c‐eYFP mice were bred in the animal facilities of Institut Pasteur. All mice were housed at Institut Pasteur animal facilities under pathogen‐free conditions. All animal studies were approved by the Institut Pasteur Safety Committee in accordance with French and European guidelines (CETEA no: 190148; MESR no: 23179).
Generation of bone marrow‐derived dendritic cells
Femurs and tibias were isolated from adult WT, UBC‐GFP, Ifnar −/−, or Irf3 −/− Irf7 −/− mice, sterilized in 70% ethanol, and flushed with PBS. Single‐cell suspensions were prepared by filtering the bone marrow through a 30‐µm cell strainer. Red blood cells were lysed using ACK buffer. 30 × 106 bone marrow cells (BMC) were cultured in 150‐mm non‐treated Petri dishes for 9 to 11 days, at 37°C, 5% CO2, in 30 ml RPMI medium 1640‐GlutaMAX™ (Gibco) supplemented with 10% heat‐inactivated fetal bovine serum, 100 U/ml penicillin (Gibco), 100 ng/ml streptomycin (Gibco), 1 mM sodium pyruvate (Gibco), 10 mM HEPES (Gibco), 5 µM 2‐mercaptoethanol (Gibco) (complete RPMI), and 20 ng/ml GM‐CSF (BioLegend, USA). Three days after plating, 30 ml of fresh medium supplemented with 20 ng/ml GM‐CSF (BioLegend) was added. Nine to eleven days after BMC plating, floating and low adherent BMDCs were used for in vitro experiments or adoptive transfers.
Generation of mixed‐bone marrow chimeras
Irf3 −/− Irf7 −/− recipient mice were γ‐irradiated with two doses of 5.5 Gy 4 h apart. For bone marrow (BM) isolation, femurs and tibias were isolated from adult UBC‐GFP or CD11c‐eYFP and Irf3 −/− Irf7 −/− mice, sterilized in 70% ethanol, and BM flushed with PBS. Single‐cell suspensions were prepared by filtering the BM through a 30‐μm cell strainer. BM CD4+ and CD8+ T cells were depleted using biotinylated anti‐mouse CD4 (clone RM 4‐4; eBiosciences, USA) and anti‐mouse CD8 (clone 53‐6.7; BioLegend) antibodies, Magnetic MojoSort streptavidin nanobeads (BioLegend) and LS columns (Miltenyi, Germany). Mice were reconstituted with a total of 4 × 10⁶ bone marrow cells (UBC‐GFP cells, Irf3 −/− Irf7 −/− cells, or mixture at different ratios of UBC‐GFP or CD11c‐eYFP cells and Irf3 −/− Irf7 −/− cells) by i.v. injection. Four weeks after reconstitution, BM chimeras were injected subcutaneously in the footpad with 10 µg poly(I:C) (InvivoGen, USA).
In vitro treatments
For experiments assessing the impact of cell density, WT or Irf3 −/− Irf7 −/− BMDCs, or MutuDCs were plated at 2 × 10³, 2 × 10⁴, 2 × 10⁵, and 2 × 10⁶ cells/cm2 in 48‐well‐treated plates (Falcon, USA) and stimulated with 5 µg/ml poly(I:C) (InvivoGen) for 24 h. When indicated, 1 µg/ml anti‐mouse IFNAR1 blocking antibody (clone MAR1‐5A3; BioLegend) or 200 ng/ml IFN‐α (BioLegend) was added in the culture. Mixtures of UBC‐GFP and Irf3 −/− Irf7 −/− BMDCs at various ratios were performed in 48‐well‐treated plates (Falcon) at a density of 2 × 10⁵ cells/cm2, and cells were stimulated with 5 µg/ml poly(I:C) for 24 h. For all experiments, BMDC activation was assessed by flow cytometry 24 h after poly(I:C) addition.
Flow cytometry
Cell suspensions from in vitro generated BMDCs, MutuDCs, or lymph node cells were Fc‐blocked using anti‐CD16/32 mAbs (clone 93; BioLegend). When indicated, cell viability was assessed using a Zombie‐NIR (BioLegend) viability dye. Stainings were performed using combination of fluorescently labeled monoclonal antibodies among BV421 (clone N418; BioLegend) or BUV 737 anti‐mouse CD11c (clone HL3; BD Biosciences), APC/Fire 750 anti‐mouse MHC‐II (I‐A/I‐E) (clone M5/114.15.2; BioLegend), APC anti‐mouse CD40 (clone 3/23; BioLegend), PE‐Cy7 anti‐mouse CD86 (clone GL‐1; BioLegend), PE‐Cy7 anti‐mouse/human (clone M1/70; BioLegend) or BUV395 anti‐mouse CD11b (clone M1/70; BD Biosciences), BV605 anti‐mouse Ly6C (clone HK1.4; BioLegend), BUV395 anti‐mouse Ly6G (clone 1A8; BD Biosciences), PE anti‐mouse NK1.1 (clone S17016D; BioLegend), BV421 anti‐mouse CD69 (clone H1.2.F3; BioLegend), APC‐Cy7 anti‐mouse CD19 (clone 6D5; BioLegend), BV786 anti‐mouse CD8 (clone HL3; BD Biosciences), BUV395 anti‐mouse CD4 (clone GK 1.5; BD Biosciences), Alexa Fluor® 488 (clone IM7; BioLegend) or BV421 anti‐mouse/human CD44 (clone IM7; BioLegend), and Alexa647 anti‐mouse CD8a (clone 53‐6.7; BD Biosciences). H‐2Kb‐OVA (SIINFEKL) monomers were produced as previously described (Bousso et al, 1998; Moreau et al, 2012), and fluorescent tetramers were prepared using PE‐conjugated UltraAvidin (Leinco Technologies, USA). Granzyme B and Mx1 intracellular staining were performed using the Cytofix/Cytoperm kit (BD Biosciences) according to the manufacturer’s guidelines and Alexa Fluor® 647 anti‐mouse/human Granzyme B mAb (clone GB11; BioLegend) and PE anti‐mouse Mx1 (clone E‐5; Santa Cruz Biotechnology), respectively. Analyses were performed using a Cytoflex LX (Beckman Coulter) flow cytometer and analyzed with FlowJo v10.5.3 (Tree Star).
Enzyme‐linked immunosorbent assay (ELISA)
IFN‐α and IFN‐β production by WT and Irf3 −/− Irf7 −/− BMDCs was quantified from BMDC culture supernatants using Mouse IFN Alpha All Subtype ELISA Kit, High Sensitivity (PBL Assay Science, USA) and Mouse IFN Beta ELISA Kit, High Sensitivity (PBL Assay Science), following manufacturer’s instructions. Absorbance was measured using an ELISA reader (Appollo LB912, Berthold Technologies, USA).
Tissue sections and confocal microscopy
Popliteal lymph nodes of CD11c‐eYFP: Irf3 −/− Irf7 −/− chimeras were harvested and fixed in periodate‐lysine‐paraformaldehyde (PLP) buffer (1% PFA, 0.02 M L‐Lysine, and 0.55 g/l NaIO4 diluted in PBS). Twenty‐four hours later, fixed lymph nodes were embedded in 5% low‐gelling temperature agarose (type VII‐A, Sigma‐Aldrich) prepared in PBS. Lymph node sections (250 µm) were prepared using a vibrating microtome (VT 1000 S, Leica, Germany). Images of lymph node slices were obtained using a confocal spinning‐disk (CSU‐X1; Yokogawa, Japan) upright microscope (DM6000FS; Leica) equipped with an ORCAFlash4.0LT camera (Hamamatsu, Japan) and a 25 × 0.95NA W objective (Leica). All images were acquired with MetaMorph 7 imaging software (Molecular Devices, USA) and were processed using Fiji software (ImageJ 2.0).
In vivo DC activation
WT, Irf3 −/− Irf7 −/−, or mixed‐bone marrow chimeras were injected in the right footpad with 10 µg poly(I:C) or PBS as control. Twenty‐four hours later, draining and non‐draining popliteal lymph nodes were collected, mechanically dissociated using small scissors, and digested with 50 µg/ml DNase (Sigma‐Aldrich) and 1 mg/ml collagenase (Sigma‐Aldrich) in 250 µl RPMI for 20 min at 37°C. Single‐cell suspensions were obtained by vigorous pipetting and filtered through a 70‐µm cell strainer. Cells were then stained with the indicated antibodies and analyzed by flow cytometry. To quantify CD8+ T‐cell responses after immunization, WT, Irf3 −/− Irf7 −/−, or mixed‐bone marrow chimeras were injected in the right footpad with 400 μg ovalbumin (OVA) low endotoxin (Worthington Biochemical, USA) either alone or with 20 μg poly(I:C) (InvivoGen) or PBS. Eight days later, popliteal draining lymph nodes were harvested and crushed on 70‐µm cell strainers using syringe plungers. OVA‐specific CD8+ T cells were quantified by H‐2Kb‐OVA tetramer staining.
BMDC adoptive transfer
UBC‐GFP BMDCs were stimulated overnight with 5 µg/ml poly(I:C) (InvivoGen) and injected (10 × 106 cells) in the footpad of Irf3 −/− Irf7 −/− mice along with 10 µg of poly(I:C). Twenty‐four hours later, draining and non‐draining popliteal lymph nodes were collected and single‐cell suspensions were obtained as described above.
Statistical analysis
All statistical tests were performed using Prism v.6.0h (GraphPad). Unpaired Student’s t‐test and one‐way analysis of variance (ANOVA) were used as indicated in individual figure legends, using post hoc Holm–Sidak test for multiple comparison correction. For t‐test, normal distribution of the data was checked using the Shapiro–Wilk test. All statistical tests were two‐tailed with a significance level of 0.05. ns, non‐significant; *P < 0.05; **P < 0.01; ***P < 0.001, ****P < 0.0001.
Author contributions
MB, JP, CL, FL, and ZG conducted the experiments. MB, JP, CL, and PB designed the experiments. MB, JP, GR, and PB analyzed the data. MB and PB wrote the manuscript.
Conflict of interest
The authors declare that they have no conflict of interest.
Supporting information
Review Process File
Appendix
Acknowledgements
We thank members of the Bousso laboratory for critical review of the manuscript. We thank M. Guerin for help in image acquisition and the mouse facility and Technology Core of the Center for Translational Science (CRT) at Institut Pasteur for support in conducting the present study. The work was supported by Institut Pasteur, INSERM, and an advanced grant (ENLIGHTEN) from the European Research Council.
The EMBO Journal (2021) 40: e107176.
Data availability
This study includes no data deposited in external repositories.
References
- Akazawa T, Ebihara T, Okuno M, Okuda Y, Shingai M, Tsujimura K, Takahashi T, Ikawa M, Okabe M, Inoue N et al (2007) Antitumor NK activation induced by the Toll‐like receptor 3‐TICAM‐1 (TRIF) pathway in myeloid dendritic cells. Proc Natl Acad Sci U S A 104: 252–257 [DOI] [PMC free article] [PubMed] [Google Scholar]
- Altan‐Bonnet G, Mukherjee R (2019) Cytokine‐mediated communication: a quantitative appraisal of immune complexity. Nat Rev Immunol 19: 205–217 [DOI] [PMC free article] [PubMed] [Google Scholar]
- Amado IF, Berges J, Luther RJ, Mailhe MP, Garcia S, Bandeira A, Weaver C, Liston A, Freitas AA (2013) IL‐2 coordinates IL‐2‐producing and regulatory T cell interplay. J Exp Med 210: 2707–2720 [DOI] [PMC free article] [PubMed] [Google Scholar]
- Antonioli L, Blandizzi C, Pacher P, Guilliams M, Hasko G (2018) Quorum sensing in the immune system. Nat Rev Immunol 18: 537–538 [DOI] [PMC free article] [PubMed] [Google Scholar]
- Antonioli L, Blandizzi C, Pacher P, Guilliams M, Hasko G (2019) Rethinking communication in the immune system: the quorum sensing concept. Trends Immunol 40: 88–97 [DOI] [PMC free article] [PubMed] [Google Scholar]
- Beuneu H, Deguine J, Bouvier I, Di Santo JP, Albert ML, Bousso P (2011) Cutting edge: a dual role for type I IFNs during polyinosinic‐polycytidylic acid‐induced NK cell activation. J Immunol 187: 2084–2088 [DOI] [PubMed] [Google Scholar]
- Bousso P, Casrouge A, Altman JD, Haury M, Kanellopoulos J, Abastado JP, Kourilsky P (1998) Individual variations in the murine T cell response to a specific peptide reflect variability in naive repertoires. Immunity 9: 169–178 [DOI] [PubMed] [Google Scholar]
- Doganer BA, Yan LKQ, Youk H (2016) Autocrine signaling and quorum sensing: extreme ends of a common spectrum. Trends Cell Biol 26: 262–271 [DOI] [PubMed] [Google Scholar]
- Fernandez NC, Lozier A, Flament C, Ricciardi‐Castagnoli P, Bellet D, Suter M, Perricaudet M, Tursz T, Maraskovsky E, Zitvogel L (1999) Dendritic cells directly trigger NK cell functions: cross‐talk relevant in innate anti‐tumor immune responses in vivo . Nat Med 5: 405–411 [DOI] [PubMed] [Google Scholar]
- Fuertes Marraco SA, Grosjean F, Duval A, Rosa M, Lavanchy C, Ashok D, Haller S, Otten LA, Steiner Q‐G, Descombes P et al (2012) Novel murine dendritic cell lines: a powerful auxiliary tool for dendritic cell research. Front Immunol 3: 331 [DOI] [PMC free article] [PubMed] [Google Scholar]
- Gautier G, Humbert M, Deauvieau F, Scuiller M, Hiscott J, Bates EE, Trinchieri G, Caux C, Garrone P (2005) A type I interferon autocrine‐paracrine loop is involved in Toll‐like receptor‐induced interleukin‐12p70 secretion by dendritic cells. J Exp Med 201: 1435–1446 [DOI] [PMC free article] [PubMed] [Google Scholar]
- Kumar H, Koyama S, Ishii KJ, Kawai T, Akira S (2008) Cutting edge: cooperation of IPS‐1‐ and TRIF‐dependent pathways in poly IC‐enhanced antibody production and cytotoxic T cell responses. J Immunol 180: 683–687 [DOI] [PubMed] [Google Scholar]
- Le Bon A, Schiavoni G, D'Agostino G, Gresser I, Belardelli F, Tough DF (2001) Type I interferons potently enhance humoral immunity and can promote isotype switching by stimulating dendritic cells in vivo . Immunity 14: 461–470 [DOI] [PubMed] [Google Scholar]
- Longhi MP, Trumpfheller C, Idoyaga J, Caskey M, Matos I, Kluger C, Salazar AM, Colonna M, Steinman RM (2009) Dendritic cells require a systemic type I interferon response to mature and induce CD4+ Th1 immunity with poly IC as adjuvant. J Exp Med 206: 1589–1602 [DOI] [PMC free article] [PubMed] [Google Scholar]
- Lucas M, Schachterle W, Oberle K, Aichele P, Diefenbach A (2007) Dendritic cells prime natural killer cells by trans‐presenting interleukin 15. Immunity 26: 503–517 [DOI] [PMC free article] [PubMed] [Google Scholar]
- McCartney S, Vermi W, Gilfillan S, Cella M, Murphy TL, Schreiber RD, Murphy KM, Colonna M (2009) Distinct and complementary functions of MDA5 and TLR3 in poly(I:C)‐mediated activation of mouse NK cells. J Exp Med 206: 2967–2976 [DOI] [PMC free article] [PubMed] [Google Scholar]
- Miller MB, Bassler BL (2001) Quorum sensing in bacteria. Annu Rev Microbiol 55: 165–199 [DOI] [PubMed] [Google Scholar]
- Moreau HD, Lemaitre F, Terriac E, Azar G, Piel M, Lennon‐Dumenil AM, Bousso P (2012) Dynamic in situ cytometry uncovers T cell receptor signaling during immunological synapses and kinapses in vivo . Immunity 37: 351–363 [DOI] [PubMed] [Google Scholar]
- Mortier E, Woo T, Advincula R, Gozalo S, Ma A (2008) IL‐15Ralpha chaperones IL‐15 to stable dendritic cell membrane complexes that activate NK cells via trans presentation. J Exp Med 205: 1213–1225 [DOI] [PMC free article] [PubMed] [Google Scholar]
- Müller AJ, Filipe‐Santos O, Eberl G, Aebischer T, Späth G, Bousso P (2012) CD4+ T cells rely on bystander effector activity to control local infection. Immunity 37: 147–157 [DOI] [PubMed] [Google Scholar]
- Pantel A, Teixeira A, Haddad E, Wood EG, Steinman RM, Longhi MP (2014) Direct type I IFN but not MDA5/TLR3 activation of dendritic cells is required for maturation and metabolic shift to glycolysis after poly IC stimulation. PLoS Biol 12: e1001759 [DOI] [PMC free article] [PubMed] [Google Scholar]
- Patil S, Fribourg M, Ge Y, Batish M, Tyagi S, Hayot F, Sealfon SC (2015) Single‐cell analysis shows that paracrine signaling by first responder cells shapes the interferon‐beta response to viral infection. Sci Signal 8: ra16 [DOI] [PubMed] [Google Scholar]
- Perona‐Wright G, Mohrs K, Mohrs M (2010) Sustained signaling by canonical helper T cell cytokines throughout the reactive lymph node. Nat Immunol 11: 520–526 [DOI] [PMC free article] [PubMed] [Google Scholar]
- Polonsky M, Rimer J, Kern‐Perets A, Zaretsky I, Miller S, Bornstein C, David E, Kopelman NM, Stelzer G, Porat Z et al (2018) Induction of CD4 T cell memory by local cellular collectivity. Science 360: eaaj1853 [DOI] [PubMed] [Google Scholar]
- Postat J, Bousso P (2019) Quorum sensing by monocyte‐derived populations. Front Immunol 10: 2140 [DOI] [PMC free article] [PubMed] [Google Scholar]
- Postat J, Olekhhnovitch R, Lemaïtre F, Bousso P (2018) A metabolism‐based quorum sensing mechanism contributes to termination of inflammatory responses. Immunity 49: 654–665 [DOI] [PubMed] [Google Scholar]
- Reis e Sousa C (2004) Activation of dendritic cells: translating innate into adaptive immunity. Curr Opin Immunol 16: 21–25 [DOI] [PubMed] [Google Scholar]
- Sato M, Suemori H, Hata N, Asagiri M, Ogasawara K, Nakao K, Nakaya T, Katsuki M, Noguchi S, Tanaka N et al (2000) Distinct and essential roles of transcription factors IRF‐3 and IRF‐7 in response to viruses for IFN‐alpha/beta gene induction. Immunity 13: 539–548 [DOI] [PubMed] [Google Scholar]
- Schulz O, Diebold SS, Chen M, Naslund TI, Nolte MA, Alexopoulou L, Azuma YT, Flavell RA, Liljestrom P, Reis e Sousa C (2005) Toll‐like receptor 3 promotes cross‐priming to virus‐infected cells. Nature 433: 887–892 [DOI] [PubMed] [Google Scholar]
- Shalek AK, Satija R, Shuga J, Trombetta JJ, Gennert D, Lu D, Chen P, Gertner RS, Gaublomme JT, Yosef N et al (2014) Single‐cell RNA‐seq reveals dynamic paracrine control of cellular variation. Nature 510: 363–369 [DOI] [PMC free article] [PubMed] [Google Scholar]
- Sporri R, Reis e Sousa C (2005) Inflammatory mediators are insufficient for full dendritic cell activation and promote expansion of CD4+ T cell populations lacking helper function. Nat Immunol 6: 163–170 [DOI] [PubMed] [Google Scholar]
- Thibaut R, Bost P, Milo I, Cazaux M, Lemaître F, Garcia Z, Amit I, Breart B, Cornuot C, Schwikowski B et al (2020) Bystander IFN‐γ activity promotes widespread and sustained cytokine signaling altering the tumor microenvironment. Nat Cancer 1: 302–314 [DOI] [PMC free article] [PubMed] [Google Scholar]
- Trumpfheller C, Caskey M, Nchinda G, Longhi MP, Mizenina O, Huang Y, Schlesinger SJ, Colonna M, Steinman RM (2008) The microbial mimic poly IC induces durable and protective CD4+ T cell immunity together with a dendritic cell targeted vaccine. Proc Natl Acad Sci U S A 105: 2574–2579 [DOI] [PMC free article] [PubMed] [Google Scholar]
- Wimmers F, Subedi N, van Buuringen N, Heister D, Vivié J, Beeren‐Reinieren I, Woestenenk R, Dolstra H, Piruska A, Jacobs JFM et al (2018) Single‐cell analysis reveals that stochasticity and paracrine signaling control interferon‐alpha production by plasmacytoid dendritic cells. Nat Commun 9: 3317 [DOI] [PMC free article] [PubMed] [Google Scholar]
- Xue Q, Lu Y, Eisele MR, Sulistijo ES, Khan N, Fan R, Miller‐Jensen K (2015) Analysis of single‐cell cytokine secretion reveals a role for paracrine signaling in coordinating macrophage responses to TLR4 stimulation. Sci Signal 8: ra59 [DOI] [PMC free article] [PubMed] [Google Scholar]
- Youk H, Lim WA (2014) Secreting and sensing the same molecule allows cells to achieve versatile social behaviors. Science 343: 1242782 [DOI] [PMC free article] [PubMed] [Google Scholar]
- Zenke S, Palm MM, Braun J, Gavrilov A, Meiser P, Böttcher JP, Beyersdorf N, Ehl S, Gerard A, Lämmermann T et al (2020) Quorum regulation via nested antagonistic feedback circuits mediated by the receptors CD28 and CTLA‐4 confers robustness to T cell population dynamics. Immunity 52: 313–327.e317 [DOI] [PubMed] [Google Scholar]
Associated Data
This section collects any data citations, data availability statements, or supplementary materials included in this article.
Supplementary Materials
Review Process File
Appendix
Data Availability Statement
This study includes no data deposited in external repositories.