Abstract
Background:
Neoadjuvant chemotherapy (NACT) may reduce perioperative morbidity in women undergoing primary treatment for ovarian cancer. We evaluated patterns of use and outcomes in a population-based cohort of elderly women with ovarian cancer (OC).
Methods:
A cohort of patients ≥66 years old diagnosed between 2000-2013 with stage III-IV epithelial OC who received surgery and platinum/taxane chemotherapy for primary treatment was identified from the SEER-Medicare database. Propensity-score matching methods were used to examine differences in outcomes. Kaplan–Meier analysis was performed to compare overall survival (OS) in the matched cohort.
Results:
From 2000-2013, 22.5% of older women received NACT. The use of NACT increased over time from 16% in 2000 to 35.4% in 2013 (p<.0001). Among women who received PCS, the rate of ostomy creation was higher compared with NACT (23.3% vs. 10.8%, p<.0001). Infectious and other surgical complications were higher among those who had PCS, regardless of stage. Median OS of women III ovarian cancer who underwent PCS was longer compared with NACT (38.8 vs. 28months, p≤.0001). There were no survival differences between NACT and PCS in women with stage IV disease (29.4 vs. 29.8 months, p=0.61) or for women aged greater than 80.
Conclusion:
Careful consideration should be given to older patients prior to undergoing PCS. Survival outcomes were similar for patients with stage IV disease, although NACT was associated with decreased perioperative morbidity compared with PCS. Among women with stage III disease, PCS was associated with improved overall survival, but higher rates of perioperative morbidity and acute care.
INTRODUCTION
Despite consensus that optimal primary therapy for advanced ovarian cancer includes a combination of platinum-based chemotherapy and cytoreductive surgery, controversy about the preferred initial approach—primary cytoreductive surgery (PCS) followed by postoperative chemotherapy or neoadjuvant chemotherapy (NACT) followed by interval cytoreductive surgery and post-operative chemotherapy continues. The historical standard of PCS was challenged in 2010 by a landmark randomized controlled trial (EORTC 55971) that compared PCS vs. NACT in Europe, and found no difference in survival between groups.[1] A second randomized trial (CHORUS) confirmed these findings.[2] Since the publication of these trials use of NACT has increased somewhat since NACT has several advantages compared with PCS, including shorter time to initiation of chemotherapy, higher rates of complete tumor resection, significantly fewer colostomies and ileostomies, and lower surgical morbidity.[3]
Despite these results, PCS remains the predominant strategy for treating ovarian cancer in the United States.[4] This may be because randomized trials had slow accrual, relatively short operative times, and a lower median overall survival than expected, or because observational studies have found that the best survival outcomes are seen in women who have no gross residual disease after PCS followed by chemotherapy.[4-8] For example, in a younger, healthier cohort of women with advanced ovarian cancer PCS was associated with increased survival compared with NACT.[4] Similarly, recent data from a National Cancer Institute-designated cancer centers suggests that NACT is the preferred approach for patients with stage IV disease, but PCS is associated with a survival advantage in women with stage III disease.[9] Similarly, a subset analysis from the randomized EORTC 55971 trial suggests a survival advantage for select stage III patients with smaller metastases (<5cm) who underwent PCS.[1, 10]
Because older patients often have more comorbid conditions and increased frailty and NACT is associated with less perioperative morbidity, we hypothesized that we would not find a similar advantage to PCS in elderly women. Therefore, we aimed to evaluate the use and effectiveness of NACT in an older patient population with advanced epithelial ovarian cancer by evaluating patterns of care, complications and outcomes.
MATERIALS AND METHODS
Data and Cohort Selection
Data for this retrospective population-based analysis came from the linkage of Surveillance, Epidemiology, and End Results registry with Medicare health claims from 2000 to 2013.[11] We included patients aged 66 or older with pathologic confirmation of stage III or IV adenocarcinoma of the ovary who received both surgery and a platinum/taxane-based chemotherapy (Table 1). To exclude those who may have only received chemotherapy for palliative intent, we required that patients have both chemotherapy and surgery. We used two cohorts to examine the use and effectiveness of NACT. In cohort 1, we analyzed the patterns of care among all women in the sample. In cohort 2, we used propensity matching techniques to minimize observed differences between women who received NACT vs. PCS to examine treatment complications and survival outcomes.
Table 1.
Cohort selection
| Selection Criteria | Remaining | Excluding |
|---|---|---|
| Ovarian cancer | 70352 | |
| 1st cancer-ovarian cancer (siterwho1 = ‘27040’) | 62742 | 7610 |
| Year of diagnosis 2000-2013 | 46377 | 16365 |
| Birth dates are same in SEER and Medicare | 45754 | 623 |
| Age 66 and older | 30021 | 15733 |
| AJCC Stage II-IV and Stage Unknown | 26718 | 3303 |
| Patients with pathologic confirmation | 22807 | 3911 |
| Selected patients whose ICD-O-3 histology codes were consistent with the adenocarcinomas of the ovary but excluding borderline tumors, stromal and germ cell tumors | 19432 | 3375 |
| Excluded patients diagnosed at autopsy or by death certificate only | 19420 | 12 |
| Full A and B coverage and No HMO enrollment 12 months before diagnosis to the death or end of the study(12/2014) | 12457 | 6963 |
| Receipt of surgery and chemotherapy | 6767 | 5690 |
| Receipt of taxane or platinum chemotherapy | 6502 | 265 |
| Excluded the patients who received intraperitoneal chemotherapy | 6234 | 268 |
| Stage III or IV | 5417 | 817 |
Patient and Tumor Characteristics and Treatment Identification
Variables for socio-demographic status and tumor characteristics were collected from SEER, while patients’ cancer treatment were identified using Medicare claims. Independent variables included age, year of diagnosis, tumor size, tumor histology, tumor stage, tumor grade, and first cancer therapy (PCS or NACT). Additional variables included race/ethnicity, marital status at diagnosis, Charlson comorbidity index, region, and SEER registry. Comorbidity was estimated using Klabunde-modified Charlson comorbidity score [12, 13] using claims from the 12 months prior to the diagnosis of ovarian cancer. Patients’ socioeconomic status was estimated at the census-tract level, by using data from the 2000 Census, including education, poverty level, and income data.
Treatment data were identified in Medicare claims using a combination of ICD-9 diagnosis and procedure codes, Common Procedural Terminology (CPT) codes, Healthcare Common Procedure Coding System (HCPCS) codes, and revenue center codes (Supplemental table S1).[14] The day of diagnosis for all patients was assigned the 15th of the month because SEER only reports the month and year of diagnosis.
Outcome variables included treatment complications and overall survival. Complications were defined by a combination of ICD-9 diagnosis codes, Common Procedural Terminology (CPT) codes, Healthcare Common Procedure Coding System (HCPCS) codes, and revenue center codes (Table S2).[15] The date of surgery served as the index date for the analysis of postoperative complications as well as use of acute care services (emergency center, intensive care unit, and readmission within 30 days. Survival was defined as the time from diagnosis to death or last contact. Patients were censored if they were alive at the last known contact. Both complication and survival outcomes were further evaluated by age, with the cohort subdivided into age groups (66-70 years, 71-75 years, 76-80 years, and 80 years and older).
Statistical Analysis
Descriptive statistics (means and standard deviations of continuous variables and frequencies of discrete variables) of patients’ sociodemographic and clinical characteristics were calculated. The Chi-square test (for discrete variables) or F test (for group means) was used to assess differences between patients’ characteristics and treatments.
Outcomes analyses were performed in propensity-score matched cohorts, separated by stage in order to balance covariates that might confound the effect of treatment approach on survival.[16, 17] We included patient demographics and tumor characteristic information to develop a propensity score for receipt of NACT using multivariable logistic regression for each patient. Variables used in computing the propensity scores were age, year of diagnosis, Comorbidity Index score, marital status, race/ethnicity, region, area of residence, SEER registry, census tract variables, tumor size, histology, stage and grade. The propensity score was then used to match patients who received NACT with those who underwent PCS in a 1:1 fashion. The 1:1 matching process utilized a greedy algorithm as well as the nearest available pair matching method. The cases were ordered and sequentially selected from lowest to highest propensity score to be matched to the nearest unmatched control on 8 digits of the propensity score. For those that did not match, cases were then matched to controls on 7 digits of the propensity score. The algorithm proceeded sequentially to the lowest digit match on propensity score (1 digit). Once a control has been matched to a case, that control was no longer eligible for consideration as a match for other cases. The algorithm makes "best" matches first and "next-best" matches next, in a hierarchical sequence until no more matches can be made. Best matches were defined as those with the highest digit match on propensity score.
Survival curves were estimated with Kaplan-Meier methods in the matched cohort. Cox proportional hazards regression was used to examine associations between primary treatment (PCS vs. NACT) and overall survival. All analyses were conducted with the SAS statistical software program (version 9.3, SAS Institute, Cary, NC). P-values of less than 0.05 were considered statistically significant.
A sensitivity analysis was performed including only patients who survived at least 3 months after diagnosis. A second sensitivity analysis was performed, evaluating survival based on hospital volume. The SEER-Medicare database does not provide a variable for hospital volume. In order to study the relationship of hospital volume and survival, we computed hospital volume as the number of patients in our cohort treated by each hospital and further classified hospital volume as a dichotomous variable (low vs high) using the median value. Cox proportional hazards model was used to estimate association between hospital volume and survival. Other variables in the multivariable model included age, marital status, tumor histology, tumor size, Charlson comorbidity index, treatment group, tumor stage, year of diagnosis, and census tract percent persons 25+ with <12 years education.
RESULTS
Study cohort 1 included a total of 5,417 patients: 1,221 patients (22.5%) received NACT followed by interval cytoreductive surgery and 4,196 underwent primary surgery followed by chemotherapy. Sociodemographic and clinical characteristics are displayed in Table 2. There were statistically significant differences between the two groups in regards to year of diagnosis, race/ethnicity, tumor size, histology, grade and stage, as well as region, area of residence and SEER registry state, however no overtly obvious pattern to differentiate a group of patients more likely to receive one therapy over the other.
Table 2.
Patient characteristics in the unmatched cohort
| Characteristics | Treatment Group |
P- value |
Total, n (%) | ||||
|---|---|---|---|---|---|---|---|
| NACT, n (%) |
Primary Surgery, n (%) |
||||||
| Patients | |||||||
| Age at diagnosis (y) | 0.19a | ||||||
| 66-70 | 387 (31.7) |
1326 (31.6) |
1713 | (31.6) | |||
| 71-75 | 379 (31.0) |
1264 (30.1) |
1643 | (30.3) | |||
| 76-80 | 270 (22.1) |
1038 (24.7) |
1308 | (24.1) | |||
| 80+ | 185 (15.2) |
568 (13.5) |
753 | (13.9) | |||
| mean (SD) | 74.1 ± 5.6 | 74.1 ± 5.5 | 0.90b | 74.1 ± 5.5 | |||
| Year of diagnosis | <.01a | ||||||
| 2000 | 69 (5.7) |
363 (8.7) |
432 | (8.0) | |||
| 2001 | 57 (4.7) |
372 (8.9) |
429 | (7.9) | |||
| 2002 | 80 (6.6) |
371 (8.8) |
451 | (8.3) | |||
| 2003 | 89 (7.3) |
365 (8.7) |
454 | (8.4) | |||
| 2004 | 70 (5.7) |
342 (8.2) |
412 | (7.6) | |||
| 2005 | 89 (7.3) |
335 (8.0) |
424 | (7.8) | |||
| 2006 | 79 (6.5) |
333 (7.9) |
412 | (7.6) | |||
| 2007 | 82 (6.7) |
257 (6.1) |
339 | (6.3) | |||
| 2008 | 90 (7.4) |
311 (7.4) |
401 | (7.4) | |||
| 2009 | 93 (7.6) |
274 (6.5) |
367 | (6.8) | |||
| 2010 | 100 (8.2) |
234 (5.6) |
334 | (6.2) | |||
| 2011 | 99 (8.1) |
223 (5.3) |
322 | (5.9) | |||
| 2012 | 109 (8.9) |
206 (4.9) |
315 | (5.8) | |||
| 2013 | 115 (9.4) |
210 (5.0) |
325 | (6.0) | |||
| Comorbidity index | 0.05a | ||||||
| 0 | 816 (66.8) |
2956 (70.4) |
3772 | (69.6) | |||
| 1 | 278 (22.8) |
865 (20.6) |
1143 | (21.1) | |||
| ≥2 | 127 (10.4) |
375 (8.9) |
502 | (9.3) | |||
| Marital status at diagnosis | 0.05a | ||||||
| Married | 585 (47.9) |
2096 (50.0) |
2681 | (49.5) | |||
| Unknown | 25 (2.0) |
128 (3.1) |
153 | (2.8) | |||
| Not Married | 611 (50.0) |
1972 (47.0) |
2583 | (47.7) | |||
| Race | <0.01a | ||||||
| African American, non-Hispanic | 67 (5.5) |
189 (4.5) |
256 | (4.7) | |||
| Hispanic | 63 (5.2) |
184 (4.4) |
247 | (4.6) | |||
| Other/Unknown | 57 (4.7) |
124 (3.0) |
181 | (3.3) | |||
| White, non-Hispanic | 1034 (84.7) |
3699 (88.2) |
4733 | (87.4) | |||
| Region | <0.01a | ||||||
| Midwest | 108 (8.8) |
497 (11.8) |
605 | (11.2) | |||
| Northeast | 271 (22.2) |
874 (20.8) |
1145 | (21.1) | |||
| South | 264 (21.6) |
1048 (25.0) |
1312 | (24.2) | |||
| West | 578 (47.3) |
1777 (42.3) |
2355 | (43.5) | |||
| Area of residence | <0.01a | ||||||
| Large metropolitan | 706 (57.8) |
2151 (51.3) |
2857 | (52.7) | |||
| Metropolitan | 343 (28.1) |
1299 (31.0) |
1642 | (30.3) | |||
| Urban | 73 (6.0) |
272 (6.5) |
345 | (6.4) | |||
| Less urban | 74 (6.1) |
391 (9.3) |
465 | (8.6) | |||
| Rural | 25 (2.0) |
83 (2.0) |
108 | (2.0) | |||
| SEER registry | <0.01a | ||||||
| Connecticut | 102 (8.4) |
235 (5.6) |
337 | (6.2) | |||
| Detroit | 59 (4.8) |
224 (5.3) |
283 | (5.2) | |||
| Hawaii | 11 (0.9) |
27 (0.6) |
38 | (0.7) | |||
| Iowa | 49 (4.0) |
273 (6.5) |
322 | (5.9) | |||
| New Mexico | 25 (2.0) |
98 (2.3) |
123 | (2.3) | |||
| Seattle | 117 (9.6) |
247 (5.9) |
364 | (6.7) | |||
| Utah | 26 (2.1) |
114 (2.7) |
140 | (2.6) | |||
| Kentucky | 51 (4.2) |
279 (6.6) |
330 | (6.1) | |||
| Louisiana | 58 (4.8) |
257 (6.1) |
315 | (5.8) | |||
| New Jersey | 169 (13.8) |
639 (15.2) |
808 | (14.9) | |||
| Georgia | 155 (12.7) |
512 (12.2) |
667 | (12.3) | |||
| California | 399 (32.7) |
1291 (30.8) |
1690 | (31.2) | |||
| Census tract percent below poverty (Census 2000), mean (SD) | 9.6 ± 8.4 | 10.1 ± 8.5 | 0.07b | 10.0 ± 8.5 | |||
| Census tract median income (Census 2000), mean (SD) (US$) | 53469.0 ± 22695.1 | 52658.0 ± 24881.0 | 0.32b | 52835.8 ± 24418.6 | |||
| Census tract percent non high school graduates (Census 2000), mean (SD) | 16.2 ± 11.6 | 16.9 ± 11.9 | 0.07b | 16.7 ± 11.9 | |||
| Tumor | |||||||
| Size (mm) | <.01a | ||||||
| 0 -25 | 99 (8.1) |
317 (7.6) |
416 | (7.7) | |||
| 26 – 50 | 109 (8.9) |
446 (10.6) |
555 | (10.2) | |||
| 51 -75 | 104 (8.5) |
476 (11.3) |
580 | (10.7) | |||
| 76 + | 176 (14.4) |
1241 (29.6) |
1417 | (26.2) | |||
| Unknown | 733 (60.0) |
1716 (40.9) |
2449 | (45.2) | |||
| Mean (SD) | 69.6 ± 55.8 | 86.1 ± 66.9 | <.01b | 83.4 ± 65.5 | |||
| Histology groupings | <.01a | ||||||
| Clear cell | 17 (1.4) |
76 (1.8) |
93 | (1.7) | |||
| Endometrioid | 18 (1.5) |
271 (6.5) |
289 | (5.3) | |||
| Serous | 856 (70.1) |
3180 (75.8) |
4036 | (74.5) | |||
| Mucinous/Other adenocarcinomas | 330 (27.0) |
669 (16.0) |
999 | (16.7) | |||
| AJCC stage | <.01a | ||||||
| Stage III | 662 (54.2) |
2967 (70.7) |
3629 | (67.0) | |||
| Stage IV | 559 (45.8) |
1229 (29.3) |
1788 | (33.0) | |||
| Grade | <.01a | ||||||
| Grade I | 14 (1.1) |
93 (2.2) |
107 | (2.0) | |||
| Grade II | 92 (7.5) |
565 (13.5) |
657 | (12.1) | |||
| Grade III/IV | 667 (54.6) |
2875 (68.5) |
3542 | (65.4) | |||
| Grade Unknown | 448 (36.7) |
663 (15.8) |
1111 | (20.5) | |||
P values were derived using the chi-square test for comparing differences between two treatment groups.
P values were derived using the F test for comparing means between two treatment groups.
In cohort 1, the use of NACT in women with stages III and IV ovarian cancer increased significantly over time, from 16% in 2000 to a high of 35.4% by 2013, p<.0001 (Figure 1). Among women with stage III disease, the uptake of NACT increased from 13.8% to 27.2% during this time period, p<.0001; among women with stage IV disease, use of NACT increased from 20.9% in 2000 to 55.9% in 2013, p<.0001.
Figure 1.
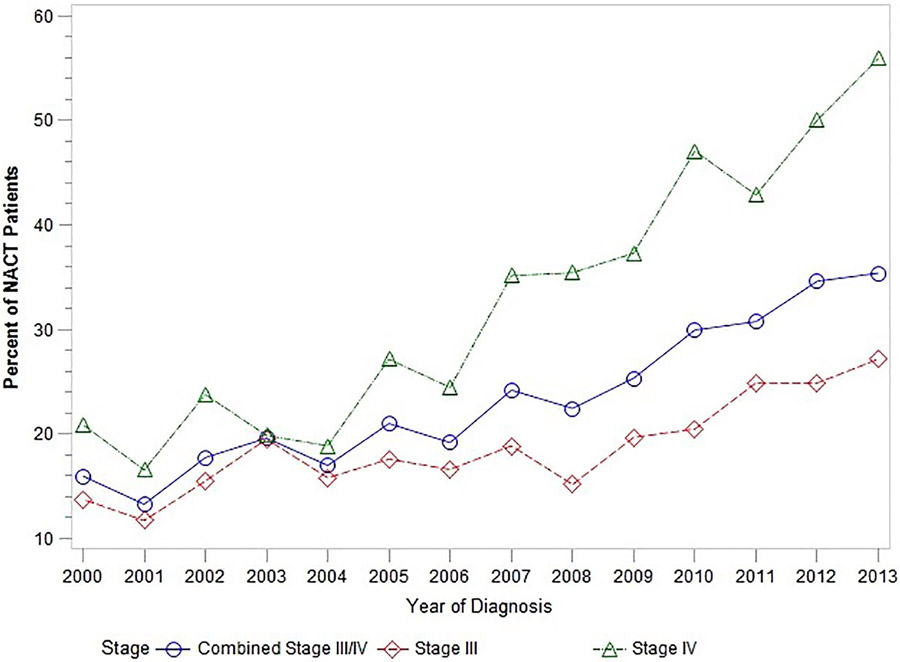
Utilization of neoadjuvant chemotherapy (NACT) over time
In cohort 2, the propensity-score matched cohort (N=1,123 NACT and 1,123 PCS patients) there were no significant differences between the two groups in observed characteristics (Supplemental Table 3). Among women with stage III disease, the risk of ostomy was significantly higher in women who received PCS vs. NACT (23.3% vs. 10.8%, p<.0001), as were bowel resections (42.0% vs. 23.2%, p<.0001). The odds of infectious complications were higher in women who received PCS (OR=1.53 for wound infection, [95% CI 1.21-1.93, p=.0004] and OR=1.62, [95% CI 1.29-2.03, p<.0001] overall).
Thirty-day complications and utilization of acute care services (emergency room visit, stay in the intensive care unit (ICU), and readmission after surgery) were evaluated in the matched cohort (Table 3). In patients with stage III disease, there were significantly more wound infections (17.2% versus 11.8%, P=0.006), shock (9.7% versus 6.4%, p=0.03), respiratory complications (34.9% versus 20.9 %, p<0.0001), and other surgical complications (46.1% versus 36.4%, p=.0004) in the group receiving PCS compared to those who underwent NACT. Similarly, patients who received PCSNACT had morer episodes of acute renal failure (6.8% versus 4.2%, p=.04) and infections (19.0% versus 12.4%), p=.0001).
Table 3.
Surgical Morbidity and use of acute care services by stage (matched population)
| Stage III (N=1,296) |
P value |
Stage IV(N=950) | P value | |||
|---|---|---|---|---|---|---|
| NACT(N=645) | PCS(N=651) | NACT(N=478) | PCS(N=472) | |||
| 30-day complication, n (%) | ||||||
| Wound infection | 76 (11.8) |
112 (17.2) |
<.01 | 62 (13.0) |
86 (18.2) |
0.03 |
| Pulmonary embolus/deep venous thrombosis | 65 (10.1) |
62 (9.5) |
0.74 | 64 (13.4) |
53 (11.2) |
0.31 |
| Hematoma/hemorrhage | 159 (24.7) |
166 (25.5) |
0.73 | 130 (27.2) |
116 (24.6) |
0.36 |
| Other surgical complications | 235 (36.4) |
300 (46.1) |
<.01 | 156 (32.6) |
237 (50.2) |
<.01 |
| Cardiac | 96 (14.9) |
107 (16.4) |
0.44 | 71 (14.9) |
97 (20.6) |
0.02 |
| Respiratory | 135 (20.9) |
227 (34.9) |
<.01 | 102 (21.3) |
204 (43.2) |
<.01 |
| Stroke | 22 (3.4) |
16 (2.5) |
0.31 | 12 (2.5) |
a | 0.26 |
| Acute renal failure | 27 (4.2) |
44 (6.8) |
0.04 | 29 (6.1) |
48 (10.2) |
0.02 |
| Shock | 41 (6.4) |
63 (9.7) |
0.03 | 32 (6.7) |
42 (8.9) |
0.21 |
| Fluid/electrolyte imbalances | 191 (29.6) |
217 (33.3) |
0.15 | 134 (28.0) |
163 (34.5) |
0.03 |
| General infections | 80 (12.4) |
124 (19.0) |
<0.01 | 65 (13.6) |
93 (19.7) |
0.01 |
| Acute care (index day = surgery day), n (%) | ||||||
| ER | 93 (14.4) |
146 (22.4) |
<. 01 | 79 (16.5) |
128 (27.1) |
<.01 |
| ICUa | a | a | 0.05 | 18 (3.8) |
16 (3.4) |
0.76 |
| Readmission | 115 (17.8) |
145 (22.3) |
0.05 | 87 (18.2) |
115 (24.4) |
0.02 |
Values are censored to maintain patient confidentiality (n ≤ 11).
In women with stage IV disease, there were more significant differences noted in perioperative morbidity between those who underwent PCS compared to women who underwent NACT. Women who received PCS had significantly more wound infections, (18.2%versus 13.0%,p=0.03), respiratory complications (43.2% versus 21.3% , p<.0001), fluid/electrolyte imbalances 34.5% versus 28.0%, p =.03), episodes of acute renal failure (10.2% versus 6.1%, , p=0.02), infections (19.7% versus 13.6% p=.01), cardiac complications 20.6%, versus 14.9% p=.02), and other surgical complications 50.2%, versus 32.6% p<.0001).
Overall, compared with PCS, NACT was associated with a decreased odds of post-operative ER visits (OR=0.56, 95% CI [0.45-0.69]) and readmissions (OR= .73, 95% CI [0.59-0.89]). When evaluated by stage, women with stage III disease who underwent NACT were significantly less likely to visit the emergency room in the 30 days following surgery compared to women who underwent PCS (14.4% versus 22.4%, p=0.0002). Postoperative ICU stays overall were low for women with stage lll disease, with <3% ICU stay in both groups, but lowest in the NACT group, p=0.05) Readmission within 30 days of surgery was also lower in women with stage III disease who underwent NACT (17.8% versus 22.3%, p=.046). For women with stage IV disease, there was no significant difference in ICU stay (3.8% versus 3.4%, p=.76). However, the rate of readmission was lower in those who received NACT (18.2% versus 24.4%), p=.02). Additionally, there were fewer ER visits postoperatively in those who received NACT compared to patients who underwent PCS (16.5% versus 27.1%, p<.0001).
Cohort 2 was further divided into age groups (66-70 years, 71-75 years, 76-80 years, and 80 years and older) and similar trends in 30-day complications and use of acute care services between women with stage III and IV disease were observed. Among women with stage III disease, perioperative cardiac complications increased significantly with age from 10.3% in the 66-70 year old group to 21.1% amongst women 80 years or older, p=.0014. Readmission after surgery also increased significantly from 13.6% to 26.3% in women over 80 years of age, p<.0001. Among women with stage IV disease (n=950), there was an increase in cardiac complications with age from 14.5% in women of 66-70 years to 20.8%, however this did not reach statistical significance, p=.22). Out of assessed complications, only increase in acute renal failure was significant (4.7% in age 66-70 years to 12.8% in age 80 years and older, p=0.02. Readmission rates increased with age, from 13.6% in women 66-70 years to a high of 38.4% in women >80 years old, p<0.0001. In this oldest group of women with stage IV disease, the readmission rate for those 80 years or older who underwent PCS was 44.4% compared to 30.2% for those who underwent NACT.
There was a significantly increased median survival for patients with stage III disease who underwent PCS compared to patients who received NACT (38.8 months, [95% CI 35.4-43.0] versus 28.0 months [95% CI 26.0-30.2]; Figure 2a). In contrast, the median overall survival was similar among women with stage IV disease who received PCS vs. NACT: median overall survival of 29.8 months, [95% CI 25.3-34.7]) vs. 29.4 months, [95% CI 26.8-31.7]; (Figure 2b). Findings from the sensitivity analysis that included patients that survived at least 3 months after diagnosis were similar. In this analysis, the median survival for patients with stage III disease who underwent PCS compared to patients who received NACT was (39.6 months, [95% CI 36.3-43.8] versus 28.1 months [95% CI 26.2-30.4]. For women with stage IV disease, the median overall survival was 32.3 months, [95% CI 27.0-35.0]) vs. 29.6 months, [95% CI 26.9-31.7]. There were no significant differences in survival between women treated at high or low hospital volume centers (HR1.009, 95% CI 0.948-1.074).
Figure 2.
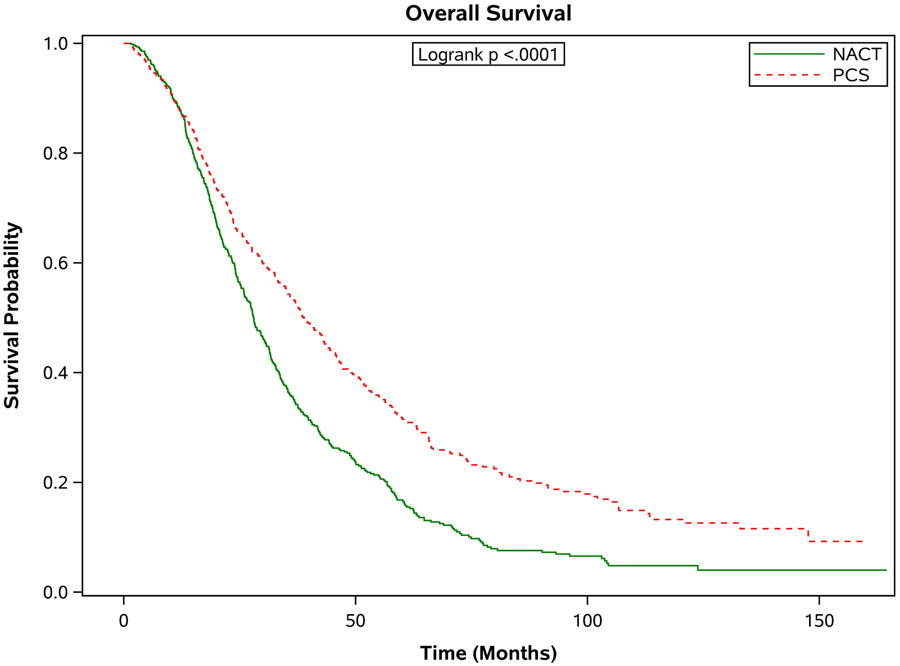
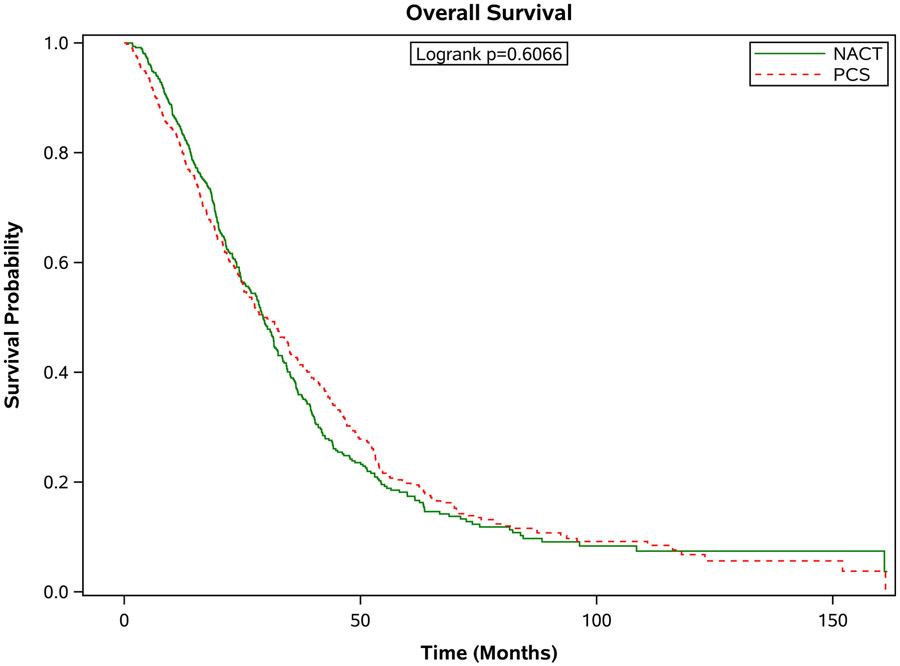
Estimated product-limit survival rates of 1:1 matched ovarian cancer patients stratified by stage. (Figure 2a) Stage III, n = 1,296; (Figure 2b) Stage IV, n = 950)
Figure 3 shows the survival outcomes in the matched population stratified by age. In all but the oldest patients, PCS was associated with significantly better survival outcomes compared with patients who received NACT (see Figure 3 a-d). In those age 66-70 years, the median survival was 37.8 months [95% CI 33.1-43.7 months] compared to 29.3 months [95% CI 26.0-31.6 months] in the NACT group. In the 71-75 age group, the median survival for those who had PCS was 37.0 months [95% CI 31.8-41.1 months] compared to 30.2 months [95% CI 27.9-34.0 months] in those who had NACT. In those age 76-80, the median survival for those who had PCS was 36.2 months [95% CI 30.2-42.1 months] versus 27.9 months [95% CI 22.5-31.5 months] for those who received NACT. For those older than 80 years of age, the median survival for those who had PCS was 27.2 months [95% CI 22.6-32.8 months] compared to 25.9 months [95% CI 23.2-29.7 months]. These differences in survival were largely driven by patients with stage III disease. When broken down by age grouping and stage, there was no significant difference in survival for patients in any age group with stage IV disease. For patients with stage III disease, there was improved survival for patients who underwent PCS, except for those age 80 or greater, where survival with PCS was 30 months [95% CI 23.5-36.0] compared to NACT 25.9 months [95% CI 22.3-30.7], p=0.09.
Figure 3.
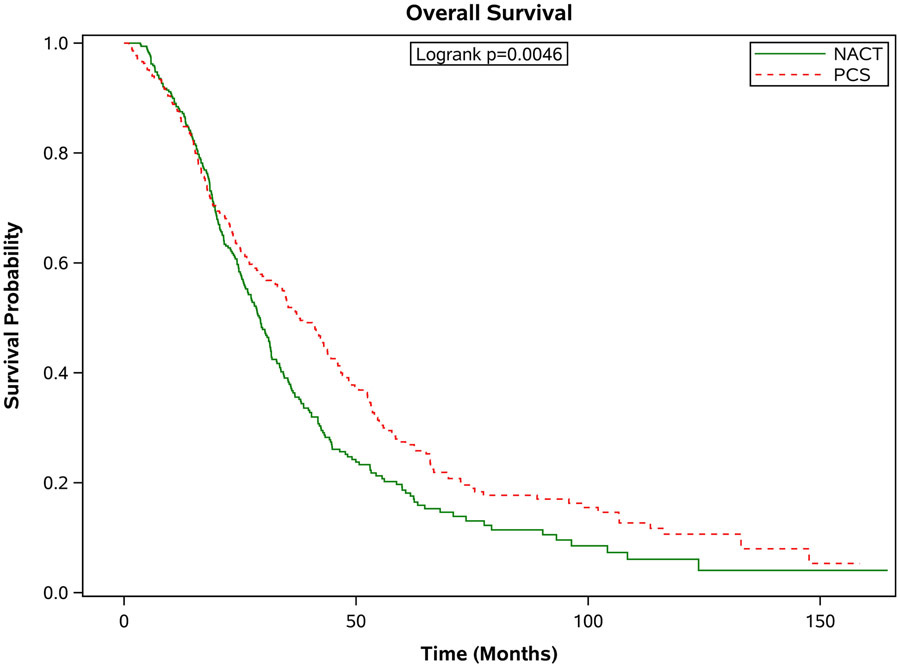
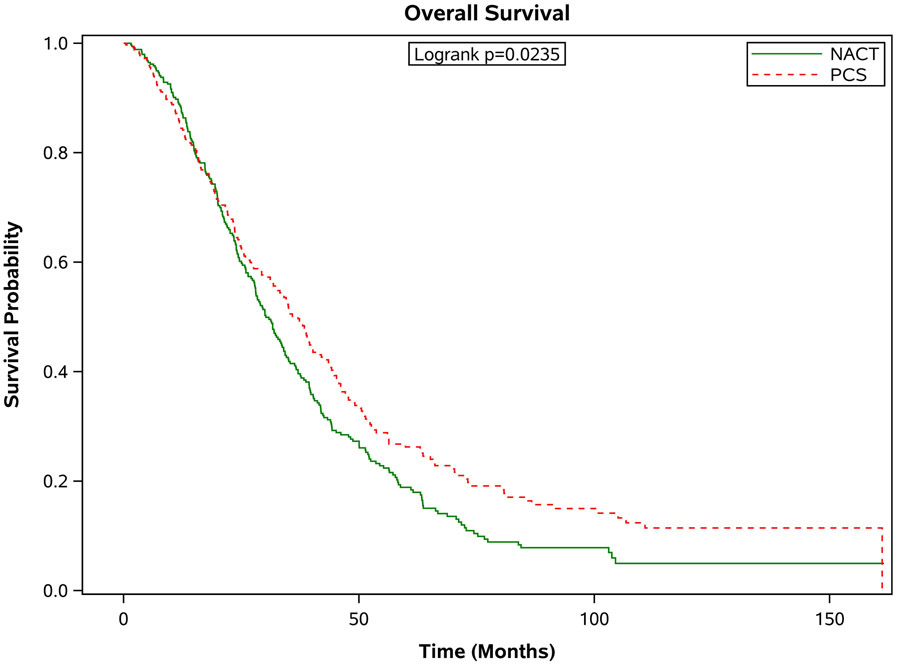
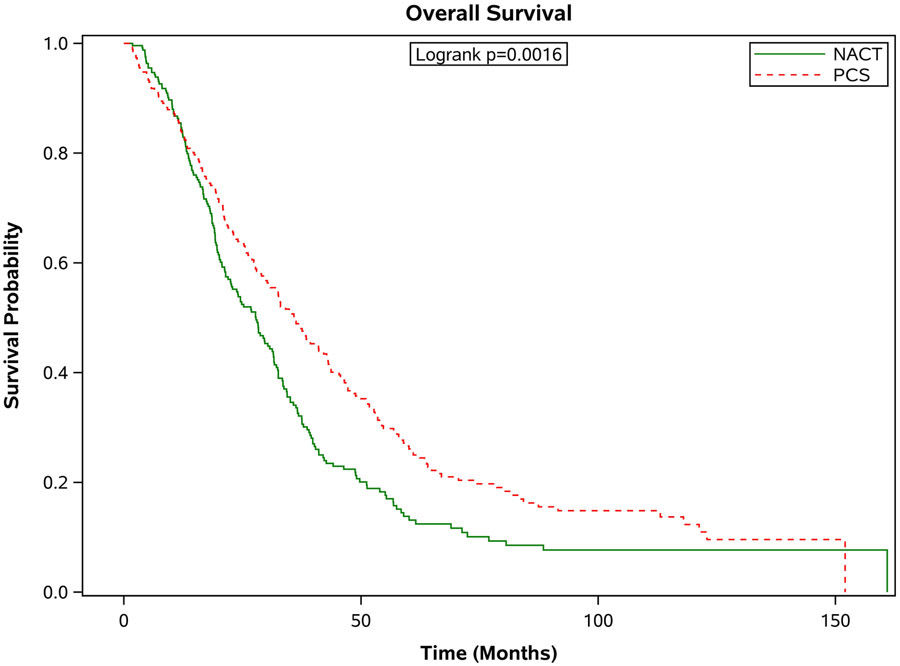
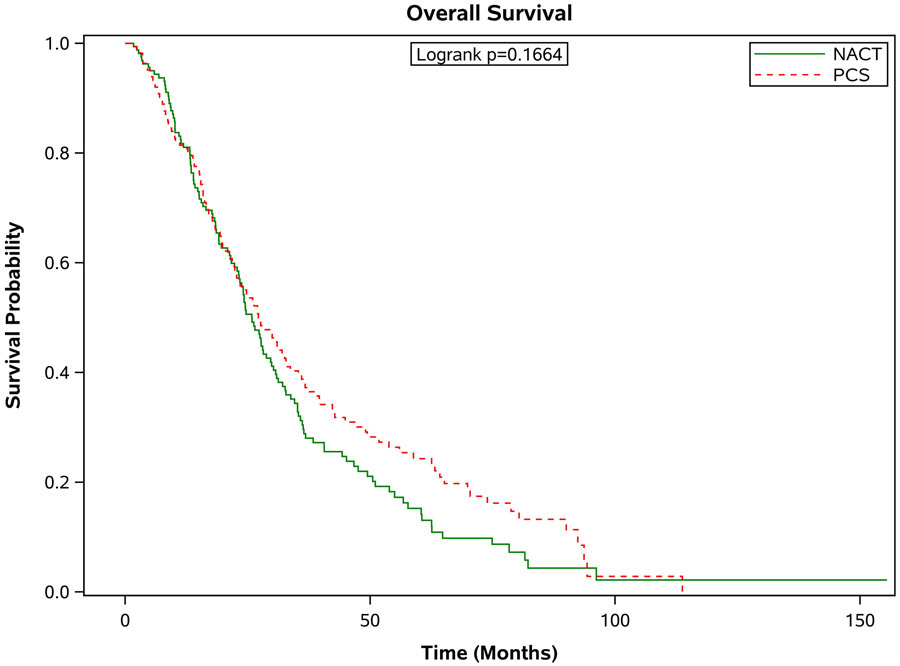
Estimated product-limit survival rates of ovarian cancer patients (1:1 matched population, N = 2,246) stratified by age group. (Figure 3a) age 66-70 years, n = 715; (Figure 3b) age 71-75 years, n = 677; (Figure 3c) age 76-80 years, n=520; (Figure 3d) age ≥80 years, n =334)
DISCUSSION
In this cross-sectional analysis of older women with advanced ovarian cancer, we found that although the majority of women underwent PCS, there was a significant increase in the adoption of NACT over time, especially in women with stage IV disease. Interestingly, the utilization of NACT in this older patient population was lower than what was reported at six NCI-designated cancer centers during a similar study period.[9] Use of NACT in stage IV patients in this study cohort increased from 20.9% in 2000 to 55.9% in 2013, compared to a high of 62% in 2011-12 in the study of NCI-designated cancer centers.[9] This may reflect a slower diffusion of practice changes based on the randomized clinical trial data in the broader community. However, similar to prior studies,[4, 9] we found an association between PCS and improved survival in women with stage III disease, and confirmed the finding of no difference in survival in patients with stage IV disease. Similarly, we found that a NACT strategy is associated with decreased utilization of acute care services and decreased complications.
Our study has limitations that are similar and inherent to all observational studies, including selection bias, and the inability to control for unobserved confounders such as physician bias, operative effort, tumor biology, and lack of information regarding residual disease after surgery. One of the strengths of this study is the utilization of the SEER database which allows inclusion of older women treated in a variety of regions of the country, as well as in more diverse settings than are traditionally reported on from single academic institutions. An additional strength includes careful cohort selection of women who received chemotherapy and surgery in order to minimize the inclusion of women who may have received chemotherapy with palliative intent as well as rigorous propensity score matching. However, thus by design, this cohort likely selects for patients with improved performance status and health as we required all patients to receive both chemotherapy and surgery. As outlined in Table 1, this requirement eliminated 45% of the patients available in earlier steps of the cohort selection. We felt this step was necessary to appropriate matching and the elimination of individuals either not treated or treated for palliative intent. However, this limits our ability to look at other important outcomes such as 30 or 90 day mortality. A prior study suggests that 30-day mortality in a similar patient population is 8% with each additional year older than 65 being associated with a 7.5% increase in the risk of 30-day mortality. Women older than 75 had a 12.7% risk of death with primary cytoreductive surgery.[18]
Although evidence suggests many older women can safely tolerate chemotherapy and surgery for ovarian cancer, advanced age can be associated with decreased PS as well as higher cancer therapy related complications. In this study, we found that several important perioperative complications such as cardiac complications increased with age. Readmission rates after surgery also increased with age. Performance status (PS) is often considered a marker for poor outcome with treatment of advanced malignancy. However, as disease related symptoms that contribute to poor PS improve with effective therapy, poor PS alone should not always be a reason to withhold curative intent therapy.[19]
In conclusion, we have found that many older women can safely tolerate therapy for advanced ovarian cancer and can have an extended survival even when diagnosed later in life. Careful consideration should be given to older patients prior to undergoing PCS. In this observational study, we found that there may be a survival advantage for select individuals in an older OC population with stage III disease who undergo PCS, although with higher rate of perioperative morbidity and utilization of acute care services. For patients age 80 and greater, and for women with stage IV disease, survival outcomes are similar in both groups but with decreased perioperative morbidity in those receiving NACT. NACT should be strongly considered in this patient population.
Supplementary Material
Acknowledgements:
This work was supported by the National Cancer Institute/National Institutes of Health through a K07-CA20103 (Meyer), the Cancer Prevention and Research Institute of Texas, Comparative Effectiveness Research on Cancer in Texas (C2:Training Core) grant RP140020 (Meyer) and the NIH T32 training grant CA101642 (Dottino, Suidan). This work was also supported by the Cancer Center Support Grant, P30CA016672.
This work was presented at the Society of Gynecologic Oncology Annual Meeting on Women’s Cancer, March, 2016.
Conflict of Interest Statement:
Dr. Meyer reports grants from NIH/NCI K07 CA201013, and from Cancer Prevention & Research Institute of Texas- Comparative Effectiveness Research on Cancer in Texas (Training Core) RP140020 during the conduct of the study. Dr. Meyer has unrelated research funded by AstraZeneca, and participated in an Advisory Board for Clovis Oncology. Dr. Sun receives funding from AstraZeneca for unrelated research.
REFERENCES:
- 1.Vergote I, et al. , Neoadjuvant chemotherapy or primary surgery in stage IIIC or IV ovarian cancer. N Engl J Med, 2010. 363(10): p. 943–53. [DOI] [PubMed] [Google Scholar]
- 2.Kehoe S, et al. , Primary chemotherapy versus primary surgery for newly diagnosed advanced ovarian cancer (CHORUS): an open-label, randomised, controlled, non-inferiority trial. Lancet, 2015. 386(9990): p. 249–57. [DOI] [PubMed] [Google Scholar]
- 3.Thrall MM, et al. , Neoadjuvant chemotherapy in the Medicare cohort with advanced ovarian cancer. Gynecol Oncol, 2011. 123(3): p. 461–6. [DOI] [PMC free article] [PubMed] [Google Scholar]
- 4.Rauh-Hain JA, et al. , Overall Survival Following Neoadjuvant Chemotherapy vs Primary Cytoreductive Surgery in Women With Epithelial Ovarian Cancer: Analysis of the National Cancer Database. JAMA Oncol, 2017. 3(1): p. 76–82. [DOI] [PMC free article] [PubMed] [Google Scholar]
- 5.Chi DS, et al. , Is the easier way ever the better way? J Clin Oncol, 2011. 29(31): p. 4073–5. [DOI] [PubMed] [Google Scholar]
- 6.Chi DS, et al. , An analysis of patients with bulky advanced stage ovarian, tubal, and peritoneal carcinoma treated with primary debulking surgery (PDS) during an identical time period as the randomized EORTC-NCIC trial of PDS vs neoadjuvant chemotherapy (NACT). Gynecol Oncol, 2012. 124(1): p. 10–4. [DOI] [PubMed] [Google Scholar]
- 7.Naik R, et al. , The "definitive" trial of surgical cytoreduction in advanced-stage ovarian cancer. Int J Gynecol Cancer, 2013. 23(4): p. 588–91. [DOI] [PubMed] [Google Scholar]
- 8.Fagotti A, et al. , Introduction of staging laparoscopy in the management of advanced epithelial ovarian, tubal and peritoneal cancer: Impact on prognosis in a single institution experience. Gynecol Oncol, 2013. [DOI] [PubMed] [Google Scholar]
- 9.Meyer LA, et al. , Use and Effectiveness of Neoadjuvant Chemotherapy for Treatment of Ovarian Cancer. J Clin Oncol, 2016. [DOI] [PMC free article] [PubMed] [Google Scholar]
- 10.Vergote IB, Van Nieuwenhuysen E, and Vanderstichele A, How to Select Neoadjuvant Chemotherapy or Primary Debulking Surgery in Patients With Stage IIIC or IV Ovarian Carcinoma. J Clin Oncol, 2016. [DOI] [PubMed] [Google Scholar]
- 11.Warren JL, et al. , Overview of the SEER-Medicare data: content, research applications, and generalizability to the United States elderly population. Med Care, 2002. 40(8 Suppl): p. IV-3–18. [DOI] [PubMed] [Google Scholar]
- 12.Klabunde CN, et al. , Development of a comorbidity index using physician claims data. J Clin Epidemiol, 2000. 53(12): p. 1258–67. [DOI] [PubMed] [Google Scholar]
- 13.Klabunde CN, Harlan LC, and Warren JL, Data sources for measuring comorbidity: a comparison of hospital records and medicare claims for cancer patients. Med Care, 2006. 44(10): p. 921–8. [DOI] [PubMed] [Google Scholar]
- 14.Thrall MM, et al. , Trends in treatment of advanced epithelial ovarian cancer in the Medicare population. Gynecol Oncol, 2011. 122(1): p. 100–6. [DOI] [PMC free article] [PubMed] [Google Scholar]
- 15.Earle CC, et al. , Effect of surgeon specialty on processes of care and outcomes for ovarian cancer patients. J Natl Cancer Inst, 2006. 98(3): p. 172–80. [DOI] [PubMed] [Google Scholar]
- 16.D'Agostino RB Jr., Propensity score methods for bias reduction in the comparison of a treatment to a non-randomized control group. Stat Med, 1998. 17(19): p. 2265–81. [DOI] [PubMed] [Google Scholar]
- 17.Rosenbaum P, Rubin DB, Reducing bias in observational studies using subclassification on the propensity score. J Am Stat Assoc., 1984. 79: p. 516–524. [Google Scholar]
- 18.Thrall MM, et al. , Thirty-day mortality after primary cytoreductive surgery for advanced ovarian cancer in the elderly. Obstet Gynecol, 2011. 118(3): p. 537–47. [DOI] [PMC free article] [PubMed] [Google Scholar]
- 19.Seifert H, et al. , Poor performance status (PS) is an indication for an aggressive approach to neoadjuvant chemotherapy in patients with advanced epithelial ovarian cancer (EOC). Gynecol Oncol, 2015. 139(2): p. 216–20. [DOI] [PubMed] [Google Scholar]
Associated Data
This section collects any data citations, data availability statements, or supplementary materials included in this article.


