

Abstract
Importance:
SARS-CoV-2
Objective:
To determine the characteristics, changes over time, outcomes, and severity risk factors of SARS-CoV-2 affected children within the National COVID Cohort Collaborative (N3C)
Design:
Prospective cohort study of patient encounters with end dates before May 27th, 2021.
Setting:
45 N3C institutions
Participants:
Children <19-years-old at initial SARS-CoV-2 testing
Main Outcomes and Measures:
Case incidence and severity over time, demographic and comorbidity severity risk factors, vital sign and laboratory trajectories, clinical outcomes, and acute COVID-19 vs MIS-C contrasts for children infected with SARS-CoV-2.
Results:
728,047 children in the N3C were tested for SARS-CoV-2; of these, 91,865 (12.6%) were positive. Among the 5,213 (6%) hospitalized children, 685 (13%) met criteria for severe disease: mechanical ventilation (7%), vasopressor/inotropic support (7%), ECMO (0.6%), or death/discharge to hospice (1.1%). Male gender, African American race, older age, and several pediatric complex chronic condition (PCCC) subcategories were associated with higher clinical severity (p≤0.05). Vital signs (all p≤0.002) and many laboratory tests from the first day of hospitalization were predictive of peak disease severity. Children with severe (vs moderate) disease were more likely to receive antimicrobials (71% vs 32%, p<0.001) and immunomodulatory medications (53% vs 16%, p<0.001).
Compared to those with acute COVID-19, children with MIS-C were more likely to be male, Black/African American, 1-to-12-years-old, and less likely to have asthma, diabetes, or a PCCC (p<0.04). MIS-C cases demonstrated a more inflammatory laboratory profile and more severe clinical phenotype with higher rates of invasive ventilation (12% vs 6%) and need for vasoactive-inotropic support (31% vs 6%) compared to acute COVID-19 cases, respectively (p<0.03).
Conclusions:
In the largest U.S. SARS-CoV-2-positive pediatric cohort to date, we observed differences in demographics, pre-existing comorbidities, and initial vital sign and laboratory test values between severity subgroups. Taken together, these results suggest that early identification of children likely to progress to severe disease could be achieved using readily available data elements from the day of admission. Further work is needed to translate this knowledge into improved outcomes.
Introduction
As of June, 2021, severe acute respiratory syndrome associated with coronavirus-2 (SARS-CoV-2) has infected more than 177 million people and caused more than 3.8 million deaths worldwide1. SARS-CoV-2 can cause coronavirus disease of 2019 (COVID-19), a condition characterized by pneumonia, hypoxemic respiratory failure, thrombosis, cardiac and renal dysfunction, hyperinflammation, and substantial mortality and morbidity. Though children often experience milder illness2–4, SARS-CoV-2 can cause severe pediatric disease in the form of both acute COVID-19 and multisystem inflammatory syndrome in children (MIS-C). Both acute COVID-19 and MIS-C can cause significant morbidity and mortality5–10. MIS-C is a hyperinflammatory condition thought to represent a post-infectious complication of SARS-CoV-2 infection5,11,12. It is characterized by cardiovascular, respiratory, neurologic, gastrointestinal, and mucocutaneous manifestations and organ dysfunction. Thus far, over 1,700 cases of MIS-C have been reported to the U.S. Centers for Disease Control and Prevention, with over half requiring ICU admission and greater than one-third experiencing shock13.
Research in pediatric COVID-19 and MIS-C has been slowed by the lack of large, multi-institutional datasets of affected children. Investigators in Europe7 and the U.S.10,13,14 have reported multi-center studies, but analysis of individual patient vital sign and laboratory data in those cohorts was absent. An extensive, granular, representative clinical dataset is needed to improve our understanding of the presentation, risk factors, and severity signals of pediatric COVID-19 and MIS-C.
The National COVID Cohort Collaborative (N3C) was formed to improve understanding of SARS-CoV-2 infections and clinical outcomes via a novel approach to data sharing and analytics. The N3C15 is comprised of members from the NIH Clinical and Translational Science Awards Program, its Center for Data to Health, the IDeA Centers for Translational Research16, and several EHR-based research networks17. We have previously reported details regarding N3C structure, data ingestion and integration, the number of N3C sites using each common data model (CDM), and the patient variables supported by each CDM15,17. See supplemental methods for information on N3C patient inclusion criteria and available data, and details regarding N3C funding sources.
Our objective was to provide a detailed clinical characterization of the largest cohort of U.S. pediatric SARS-CoV-2 positive cases to date. We hypothesized that we would be able to 1) identify risk factors for higher severity disease among hospitalized children, 2) evaluate rates of SARS-CoV-2 positive cases and hospitalizations over time, 3) visualize changes in SARS-CoV-2 medication treatment regimens over time, 4) compare trends in vital sign and laboratory markers between hospitalized children in different clinical severity subgroups, and 5) identify differences in clinical risk factors and outcomes between children with acute COVID-19 versus MIS-C.
Methods & Study Design
Cohort definition
We performed a retrospective analysis of all children <19-years-old at first SARS-CoV-2 testing at the 45 N3C sites whose data 1) completed harmonization and integration, 2) were released for analysis, and 3) included the necessary death and mechanical ventilation information. Patients were included if their index encounter (see supplemental methods) ended before May 27th, 2021.
Children were considered to have SARS-CoV-2 if they had a documented positive test by polymerase chain reaction (PCR), antigen (Ag), or antibody (Ab). Children were considered to have MIS-C if they were 1) hospitalized with a positive SARS-CoV-2 test and 2) assigned either of two recommended ICD-10 diagnosis codes for MIS-C; during the early phase of the pandemic, M35.818, or the more specific M35.81 introduced October 1st, 2020 and effective January 1st, 202119.
We described the geographic location of pediatric N3C patients including the incidence of positive cases by month with comparison to the adult N3C cohort. We evaluated changes in pediatric age distribution and maximum clinical severity over time (see below for clinical severity definition). We determined the proportion of hospitalized children who received different antimicrobial and immunomodulatory medications by month and provided corresponding adult trends for comparison. Lastly, we compared the clinical characteristics, outcomes, and laboratory test profiles between children with MIS-C vs those with acute COVID-19 (children with a positive SARS-CoV-2 PCR or Ag test but no MIS-C diagnosis code nor positive antibody test result).
Hospital Index Encounter and Clinical Severity
We identified a single clinical encounter for each laboratory-confirmed SARS-CoV-2 positive child by selecting the encounter demonstrating the maximum Clinical Progression Scale (CPS) score (created by the World Health Organization [WHO] for COVID-19 clinical research17,20) (see Supplement). Clinical severity categories included mild (outpatient or emergency department visits only), moderate (hospitalized without need for invasive ventilation, vasopressor / inotropic medications, or ECMO), and severe (hospitalized and requiring invasive ventilation, vasopressors / inotropes, or ECMO, or death, or discharge to hospice).
Variable Definition and Statistical Methods
For each clinical concept (e.g., laboratory measure, vital sign, medication, or preselected comorbidity) we defined or identified existing established concept sets in the Observational Medical Outcomes Partnership (OMOP)21 CDM. We used established concept sets to identify children with the preselected comorbidities of asthma, diabetes mellitus (types I and II), and obesity given prior reports of more severe disease among such patients8,10. We identified children with chronic medical conditions for disease-severity risk analysis using the pediatric complex chronic conditions (PCCC) algorithm via adaptation of our prior R implementation22,23. We validated our newly defined concept sets with input from informatics and clinical subject matter experts. All concept sets and analytic pipelines are fully reproducible and will be made publicly available.
We tested demographic differences in the relative proportions of moderate and severe patients via logistic regression models. We used chi-square deviance tests to evaluate changes in relative proportions of predefined pediatric age ranges over time and to evaluate changes in the proportion of moderate and severe cases over time. We evaluated differences in initial vital sign and lab values between moderate and severe subgroups using generalized estimating equations. We assessed for significance in change over time for each vital sign or lab result during a patient’s hospitalization; we did this using a linear model to average over the first week of values and then used the model results to estimate the difference between hospital day 0 and day 7 for each severity subgroup. See Supplemental Methods for additional information including software packages used.
Results
Study Cohort Demographics and Comorbidities
The N3C dataset released May 27th, 2021 contains 728,047 pediatric patients, of which 91,865 (13%) had a positive SARS-CoV-2 test (PCR/Ag, or Ab) (Table 1, Supplemental Table 1). The 45 hospital systems from which these data were obtained were located in several US geographic subregions (defined using the US Census Bureau divisions) and were most concentrated in the South Atlantic and East North Central regions (Figure 1). Figures 1c and 1d demonstrate the evolution of monthly pediatric SARS-CoV-2 cases by geographic region and overall for each month during the study period, which closely mimics the N3C adult case incidence as shown. The incidence of positive SARS-CoV-2 tests peaked in November, 2020 with peak hospitalization incidence in December, 2020 for adults and children (Figure 2b).
Table 1: Demographics and Comorbidities for SARS-CoV-2 Positive Children.
SARS-CoV-2 laboratory-confirmed positive pediatric cohort characteristics stratified by maximum clinical severity (adapted from the Clinical Progression Scale (CPS) established by the World Health Organization (WHO) for COVID-19 clinical research20). Pediatric complex chronic condition (PCCC) comorbidities were determined via adaptation of our prior R implementation of PCCC to the N3C data enclave22,23. Per N3C policy, we censored any cells with <20 patients and replaced them with “<20 (0%).”
| Category | All Cases | Mild | Mild ED | Moderate | Severe | p value↟ |
|---|---|---|---|---|---|---|
| Total (N) | 91,865 | 77,073 | 9,579 | 4,528 | 685 | |
| Gender | p < 0.001 | |||||
| Male | 45,995 (50.1%) | 38,608 (50.1%) | 4,780 (49.9%) | 2,218 (49.0%) | 389 (56.8%) | |
| Female | 45,805 (49.9%) | 38,400 (49.8%) | 4,799 (50.1%) | 2,310 (51.0%) | 296 (43.2%) | |
| Age | ||||||
| Age(y), median(IQR) | 12.5 (6.4, 16.5) | 12.8 (7.0, 16.6) | 10.1 (2.5, 16.0) | 11.1 (2.3, 16.3) | 11.4 (5.0, 16.1) | p = 0.05 |
| Ethnicity* | ||||||
| Hispanic / Latino | 22,342 (24.3%) | 18,218 (23.6%) | 2,676 (27.9%) | 1,285 (28.4%) | 163 (23.8%) | p = 0.01 |
| Not Hispanic or Latino | 57,072 (62.1%) | 47,876 (62.1%) | 5,973 (62.4%) | 2,769 (61.2%) | 454 (66.3%) | p = 0.01 |
| Missing / Unknown | 12,451 (13.6%) | 10,979 (14.2%) | 930 (9.7%) | 474 (10.5%) | 68 (9.9%) | p = 0.67 |
| Race* | ||||||
| Asian | 2,076 (2.3%) | 1,769 (2.3%) | 207 (2.2%) | 82 (1.8%) | <20 (0%) | p = 0.15 |
| Black | 13,130 (14.3%) | 8,649 (11.2%) | 3,159 (33.0%) | 1,127 (24.9%) | 195 (28.5%) | p = 0.05 |
| Native Hawaiian/ Pacific Islander | 248 (0.3%) | 217 (0.3%) | <20 (0%) | <20 (0%) | <20 (0%) | p = 0.47 |
| White | 50,863 (55.4%) | 44,811 (58.1%) | 3,766 (39.3%) | 1,993 (44.0%) | 293 (42.8%) | p = 0.54 |
| Other | 23,893 (26.0%) | 20,258 (26.3%) | 2,232 (23.3%) | 1,234 (27.3%) | 169 (24.7%) | p = 0.16 |
| Missing / Unknown | 1,561 (1.7%) | 1,311 (1.7%) | 178 (1.9%) | 63 (1.4%) | <20 (0%) | p = 0.87 |
| Comorbidities | ||||||
| Known BMI⇟ | 34,966 (38.1%) | 29,318 (38.0%) | 2,821 (29.4%) | 2,329 (51.4%) | 498 (72.7%) | |
| Obese: BMI ≥95th%⇟ | 8,412 (24.1%) | 6,681 (22.8%) | 875 (31.0%) | 705 (30.3%) | 151 (30.3%) | p = 0.98 |
| Asthma | 7,088 (7.7%) | 5,858 (7.6%) | 748 (7.8%) | 405 (8.9%) | 77 (11.2%) | p = 0.05 |
| Diabetes Mellitus | 583 (0.6%) | 369 (0.5%) | 73 (0.8%) | 120 (2.7%) | 21 (3.1%) | p = 0.53 |
| PCCC | ||||||
| Any Category | 13,282 (14.5%) | 10,430 (13.5%) | 1,446 (15.1%) | 1,163 (25.7%) | 243 (35.5%) | p < 0.001 |
| Congenital/Genetic | 3,730 (4.1%) | 2,958 (3.8%) | 361 (3.8%) | 315 (7.0%) | 96 (14.0%) | p < 0.001 |
| Cardiovascular | 2,665 (2.9%) | 1,870 (2.4%) | 298 (3.1%) | 371 (8.2%) | 126 (18.4%) | p < 0.001 |
| Gastrointestinal | 2,041 (2.2%) | 1,397 (1.8%) | 215 (2.2%) | 325 (7.2%) | 104 (15.2%) | p < 0.001 |
| Heme / Immune | 3,240 (3.5%) | 2,403 (3.1%) | 375 (3.9%) | 390 (8.6%) | 72 (10.5%) | p = 0.1 |
| Malignancy | 974 (1.1%) | 659 (0.9%) | 84 (0.9%) | 186 (4.1%) | 45 (6.6%) | p = 0.004 |
| Metabolic | 3,139 (3.4%) | 2,382 (3.1%) | 342 (3.6%) | 347 (7.7%) | 68 (9.9%) | p = 0.04 |
| Neonatal | 1,064 (1.2%) | 700 (0.9%) | 179 (1.9%) | 146 (3.2%) | 39 (5.7%) | p = 0.001 |
| Neuromuscular | 2,357 (2.6%) | 1,651 (2.1%) | 258 (2.7%) | 336 (7.4%) | 112 (16.4%) | p < 0.001 |
| Renal | 1,577 (1.7%) | 1,134 (1.5%) | 164 (1.7%) | 230 (5.1%) | 49 (7.2%) | p = 0.03 |
| Respiratory | 1,452 (1.6%) | 1,020 (1.3%) | 171 (1.8%) | 194 (4.3%) | 67 (9.8%) | p < 0.001 |
| Tech Dependent | 1,238 (1.3%) | 678 (0.9%) | 151 (1.6%) | 300 (6.6%) | 109 (15.9%) | p < 0.001 |
| Transplant | 148 (0.2%) | 72 (0.1%) | <20 (0%) | 45 (1.0%) | <20 (0%) | NA |
Abbreviations: BMI = body mass index, ED = emergency department, IQR = interquartile range, PCCC = pediatric complex chronic condition,
p value given denotes result of comparison of that specific demographic subgroup (e.g. Hispanic / Latino, Asian) to all other patients in that demographic category
Comparison of moderate vs severe maximum clinical severity subgroups. p values ≤ 0.05 highlighted in bold
BMI calculated as per the Centers for Disease Control and Prevention (CDC) guidelines32 with obesity defined as any child ≥ 2-years-old with a BMI ≥ 95th percentile for age and sex. Percentages reported in the “Obese: BMI ≥95th” row represent the percent of patients with a known BMI value who had a BMI greater than 95th percentile for age and sex.
Figure 1: Geographic distribution and case incidence over time for SARS-CoV-2 positive patients.

Figure 1a shows the geographic distribution of all pediatric N3C patients (N = 728,047). Figure 1b shows the geographic distribution of the positive pediatric cases only (N = 91,865). Figure 1c shows the monthly trends for positive pediatric SARS-CoV-2 testing by subregion and test type. Figure 1d shows the monthly trends for SARS-CoV-2 positive children by test type along with overall adult positive PCR/Ag cases (N = 609,734) for comparison.
Figure 2: Age, maximum clinical severity, and antimicrobial and immunomodulatory medication use over time for SARS-CoV-2 positive children.

Figure 2a illustrates changes in the distribution of maximum clinical severity (by WHO CPS score) by month during the study period compared to N3C positive adults. Red = hospital mortality, discharge to hospice, or invasive ventilation, vasoactive-inotropic support, or ECMO. Yellow = Hospitalized without any of those. Dark Green = Emergency Department visit. Light Green = Outpatient visit. March, 2020 censored given <20 pediatric patients in the severe subgroup. Figure 2b shows the age category distribution of infected children by month during the study period stratified by test type (PCR/Ag+ with negative or no Ab testing vs Ab+ regardless of PCR/Ag testing results). The trendline demonstrates the monthly positive test incidence. Figure 1c shows the evolution in use of selected antimicrobial and immunomodulatory medications by quarter (Apr 2020 – Mar 2021) among hospitalized children with SARS-CoV-2 compared to hospitalized N3C adult cases: Q1 = Apr 2020 – Jun 2020, Q2 = Jul 2020 – Sep 2020, Q3 = Oct 2020 – Dec 2020, and Q4 = Jan 2021 – Mar 2021
The demographics of the SARS-CoV-2 positive pediatric cohort are shown in Table 1, stratified by maximum clinical severity. The cohort is a diverse group representative of many segments of the US pediatric population. Compared to the moderate severity subgroup patients, the severe subgroup patients were more likely to be older, male, African-American, and have asthma or a PCCC (except the hematologic/immunologic category)(p ≤ 0.05 for all).
Clinical Course and Illness Severity
Overall, 5,213 (5.7%) children were hospitalized. Of these, 355 (6.8%) required mechanical ventilation, and 57 (1.1%) died. The 1.1% mortality rate is consistent with two pediatric reports (0.9% and 2%)10,14 and lower than the 11.6% rate reported for hospitalized adults in the N3C cohort17. We and others have reported a decrease in adult COVID-19 severity as the pandemic has progressed.17,24 We also observed a statistically significant decrease in the proportion of moderate and severe pediatric cases over the study period (p < 0.001) (Figure 2a).
Age Distribution
The age distributions for SARS-CoV-2 positive children are illustrated in Figure 2b. Most patients were 12–17 years of age. The age distribution had a statistically significant change (p < 0.001) during the study period increasing in the 1–5 and 5–12 age groups. Among Ab+ (positive antibody test regardless of PCR/Ag testing) hospitalized children, we observed a larger proportion of 1–5 and 5–12 year old patients with a later peak incidence in January, 2021. As antibody testing may be a surrogate for MIS-C evaluation, the timing of this peak is consistent with prior studies demonstrating maximal MIS-C risk in the 2-to-5 weeks after initial SARS-CoV-2 infection13.
Treatments
Use of antimicrobial and immunomodulatory medications changed considerably during the study period (Figure 2c). As with N3C adults17, a higher proportion of children from the severe subgroup received antimicrobials compared to the moderate subgroup (71% vs 32%), with antibacterials (68% vs 31%) and antivirals (14% vs 3%) specifically being more common (p < 0.001 for all)(Supplemental Table 2). We observed a decrease in azithromycin use over time in both pediatric and adult patients, presumably related to accumulating evidence regarding lack of efficacy.
Immunomodulatory medication use was also more common among severely ill children compared to the moderately ill (53% vs 16%, p < 0.001 overall and for each medication). Systemic corticosteroid (50% vs 15%, p < 0.001) and anakinra (9% vs 0.8%, p < 0.001) use was markedly higher in the severe subgroup than in the moderate subgroup.
Of the 5,213 hospitalized children, 1,931 (37%) received at least one antimicrobial and 1,071 (20%) received at least one immunomodulatory medication with 1,004 (19%) specifically receiving a systemic corticosteroid. Antivirals with potential activity against SARS-CoV-2 (remdesivir) were administered to 148 (3%) of hospitalized children with higher frequency use among the severe subgroup compared to moderate (9% vs 2%, p < 0.001). Of note, the FDA’s Emergency Use Authorization for remdesivir25 occurred on May, 1st, 2020, and the trial indicating survival benefit from dexamethasone26 as well as a landmark publication describing MIS-C5 were both published in July, 2020.
Vital Sign and Laboratory Measurements
Compared to the moderate severity subgroup, children in the severe subgroup had significantly more abnormal initial values for many vital signs including systolic and diastolic blood pressure (lower), SpO2 (lower), heart rate (higher), and respiratory rate (higher) (p ≤ 0.002 for all). We saw improvement (values becoming more normal) in most vital signs from day 0 to day 7 for both subgroups (Figure 3)(Supplemental Table 3).
Figure 3: Vital sign and laboratory value trajectories.

Trajectories of selected vital sign (a-e) and laboratory (f-i) median values by day of hospitalization during pediatric hospital encounters as compared to N3C adult values, stratified my maximum clinical severity
Children who eventually experienced the highest maximum clinical severity also had many laboratory tests whose initial values were more abnormal than in the moderate severity subgroup (Figure 3, Supplemental Table 4). Specifically, initial median values were more abnormal in the severe subgroup for ALT and AST (higher), albumin (lower), BNP (higher), creatinine (higher), D-dimer (higher), ferritin (higher), CRP (higher), and total white blood cell count (higher)(p < 0.05 for all). Comparing hospital day 0 to day 7, we observed a trend toward normalization for most laboratory tests within both subgroups. Exceptions include more abnormal values for albumin and hemoglobin (lower) in moderate and severe subgroups and erythrocyte sedimentation rate (higher) within the moderate subgroup (p < 0.05 for all). See Supplement Table 5 for proportions of children with each lab test available. The improving trajectories for most vital sign and laboratory values likely reflect the low mortality rate (and high recovery rate) of infected children.
Acute COVID vs MIS-C
We used specific ICD-10 codes to identify 498 patients with MIS-C, of which 439 (88%) were hospitalized and 153 (31%) met criteria for severe disease. The demographics, lab results, and clinical outcomes for children with MIS-C versus acute COVID-19 (positive PCR/Ag test but no Ab+ test nor MIS-C ICD-10 code) are in Figure 4. The MIS-C group demonstrated a slight male predominance (59%) with a significant proportion of Hispanic and Black/African American children (25% and 33%, respectively). Of children with MIS-C, 12% required mechanical ventilation and 31% received vasopressors or inotropes.
Figure 4: Characteristics and outcomes of children with MIS-C versus acute COVID-19.
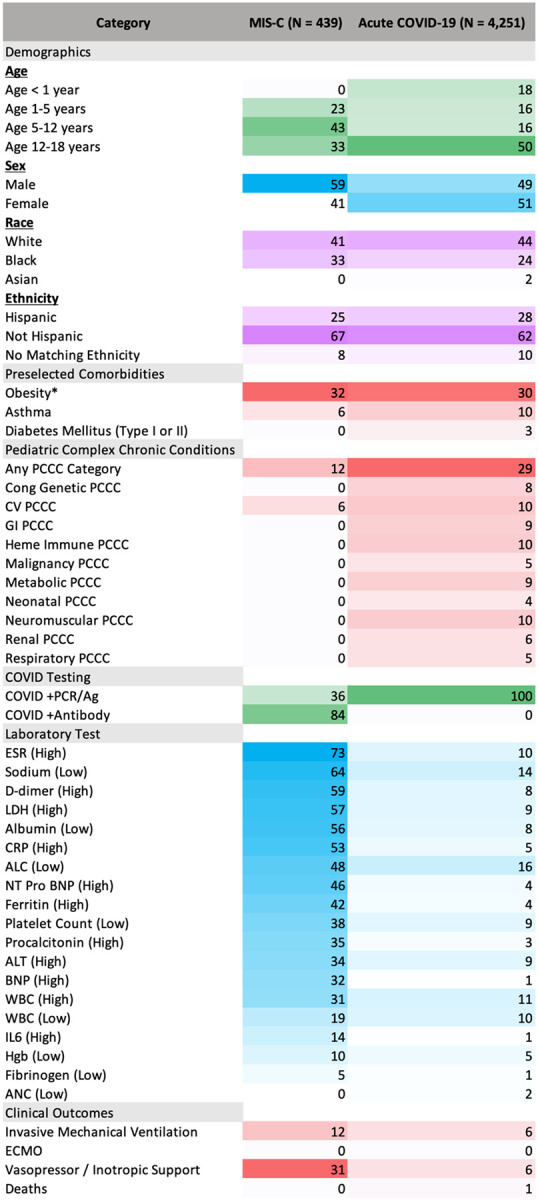
Heatmap comparing the percent of children in the MIS-C and acute COVID-19 subgroups with a given demographic characteristic, pre-existing comorbidity, abnormal lab value during hospitalization, or clinical outcome. See Supplemental Table 6 for the absolute number of patients in each corresponding category. *The percent of children with obesity was calculated by dividing the number of children ≥2-years-old who had a BMI for age and sex that was ≥95th percentile by the number of children in that subgroup who were ≥2 years old who had a BMI measurement available.
Compared to hospitalized children with acute COVID-19 only, hospitalized children with MIS-C were more likely to be 1-to-12-years-old, male, Black/African American, and less likely to have asthma, diabetes, or a PCCC (p < 0.04 for all). MIS-C patients were more likely to require vasoactive-inotropic support or invasive ventilation, and more likely to have a severe maximum clinical severity (p < 0.03)(Figure 4). Lastly, for 18 of the 19 preselected laboratory tests, the MIS-C group had a higher proportion of children with abnormal values compared to the acute COVID group (p < 0.001 for each).
Discussion
In the largest U.S. SARS-CoV-2 positive pediatric cohort to date, we fill a gap in the pediatric SARS-CoV-2 literature: a description of vital sign and laboratory values and trajectories during hospitalization among infected children with varying peak clinical severity. Although reports from Feldstein et al.5,6 include median lab results from children with MIS-C and acute COVID-19, ours is the first report describing vital sign and laboratory trajectories during pediatric hospitalization with specific attention to maximum clinical severity. We observed notable differences in initial vital sign and laboratory test values between severity subgroups, which, combined with the observed intergroup differences in demographics and pre-existing comorbidities, suggest that early identification of children likely to progress to a more severe phenotype could be achieved using readily available data elements from the day of admission. Future work should include design of predictive models and clinical decision support tools geared toward early identification of children at high risk for subsequent deterioration and severe disease.
In addition, we report on changes in case and hospitalization rates, age and severity distributions, and treatment regimens throughout the study period. This cohort’s 5.7% hospitalization rate among positive cases is similar to the 7% rate in Bailey14 et al. although lower than that noted in Kompaniyets et al.10 (9.9%) and Preston et al.4 (12%). Our cohort’s median age was similar to that of Kompaniyets et al10 (12.5 years in our study vs 12 years) as was the prevalence of comorbid asthma (8% vs 10.2%) and neurologic/neuromuscular disease (3% vs 3.9%). Our cohort’s rate of mechanical ventilation (7%) among hospitalized patients was similar to two prior reports (7% and 6%)7,10 though less than that of Belay et al.13 (14.6% in the acute COVID-19 cohort). Similar to Gotzinger7 and Preston4 et al., we observed that male sex and the presence of a pre-existing chronic medical condition were risk factors for more severe disease. In addition, we found that Black/African American race and numerous other PCCC categories were similarly associated with higher maximum clinical severity once hospitalized.
Although Shekerdemian9 and Feldstein et al.6 both reported use of various antimicrobial and immunomodulatory medications in pediatric SARS-CoV-2, ours is the first report outlining differences in medication use over time. In this study, systemic antimicrobials and immunomodulatory medications were frequently used (especially in the severe subgroup) with antibacterials and systemic corticosteroids most commonly employed. The high frequency of steroid use, specifically, is likely related to emerging evidence of efficacy for treatment of severe COVID-19 and MIS-C26,27.
As others have reported6,13, compared to children with acute COVID-19, we found that children with MIS-C were more likely to be male, Black/African-American, and less likely to have pre-existing comorbidities (asthma, diabetes, or a PCCC). In our study, MIS-C cases also demonstrated a more severe clinical phenotype with significant laboratory evidence of inflammation and frequent need for invasive ventilation and vasoactive-inotropic support.
Given the recent introduction of ICD-10 codes for MIS-C (and unknown consistency of use), their sensitivity for MIS-C is uncertain. However, in the setting of a positive SARS-CoV-2 test, the positive predictive value is likely to be high. The MIS-C incidence we describe is likely a conservative estimate. Further work is needed to develop and validate computable phenotypes for identification of MIS-C cases within N3C and other large databases for subsequent research.
Clinical outcomes (e.g. rates of mechanical ventilation) and medication utilization in acute COVID-19 and MIS-C have varied between studies6,7,9,10,14,28. Many reports of pediatric acute COVID-19 and MIS-C originate from single centers or health systems2,3,28–31. Recently, several large-scale studies reported risk factors and outcomes for pediatric COVID-194,7,9,10,14 and MIS-C6,13. However, none have included analysis of highly granular, patient-level data to compare trajectories of individual vital sign and laboratory values between different clinical severity subgroups. Such analyses improve the capacity to build SARS-CoV-2 specific predictive models and clinical decision support tools.
This study has important limitations to consider. As data are aggregated from many health systems using four different CDMs that vary in granularity, some sites may have systematic missingness of certain variables. Additionally, some respiratory data (oxygen flow, FiO2, and specific ventilator settings) are not fully available. The exact timing of laboratory specimens is inconsistently provided by sites. As such, labs were standardized to a calendar day. Furthermore, with high rates of asymptomatic-to-minimally-symptomatic pediatrics infections and increasing adoption of universal SARS-CoV-2 testing policies for pediatric hospital admissions, we cannot definitively attribute reasons for hospital admissions (SARS-CoV-2 versus another unrelated cause). This may limit interpretation of variables associated with higher clinical severity. Additionally, given the low number of severe pediatric cases, interpretation of incidence over time is challenging. Lastly, although ICD-10 coding for MIS-C has likely improved with time and increased awareness of the condition, many cases of MIS-C (especially in the earlier months of the study period) were likely not identified as such, limiting interpretation of MIS-C subgroup analysis.
In summary, this study reports the characteristics and outcomes of the largest U.S. cohort of children with SARS-CoV-2 infection to date. The N3C database provides a geographically and demographically diverse, granular view of pediatric SARS-CoV-2 infections and allows for novel vital sign and laboratory value trajectory mapping. Further work is needed to optimize translation of this knowledge into improved clinical care.
Supplementary Material
Footnotes
Ethics and Regulatory
The N3C data transfer to NCATS is performed under a Johns Hopkins University Reliance Protocol # IRB00249128 or individual site agreements with NIH.
| Site | IRB name | Exempted vs approved | Protocol number |
|---|---|---|---|
| University of Colorado | Colorado Multiple Institutional Review Board | approved | 20–2225 |
| Johns Hopkins University | Johns Hopkins Office of Human Subjects Research - Institutional Review Board | approved | IRB00249128 |
| University of North Carolina | University of North Carolina Chapel Hill Institutional Review Board | exempted | 20–3106 |
| Stony Brook University | Office of Research Compliance, Division of Human Subject Protections, Stony Brook University | exempted | IRB2020–00604 |
References
- 1.Center for Systems Science and Engineering (CSSE) at Johns Hopkins University (JHU). COVID-19 Dashboard. Johns Hopkins University & Medicine. https://coronavirus.jhu.edu/map.html. Published 2021. Accessed June 18, 2021. [Google Scholar]
- 2.Ludvigsson JF. Systematic review of COVID-19 in children shows milder cases and a better prognosis than adults. Acta Paediatr. 2020;109(6):1088–1095. [DOI] [PMC free article] [PubMed] [Google Scholar]
- 3.She J, Liu L, Liu W. COVID-19 epidemic: Disease characteristics in children. J Med Virol. 2020;92(7):747–754. [DOI] [PMC free article] [PubMed] [Google Scholar]
- 4.Preston LE, Chevinsky JR, Kompaniyets L, et al. Characteristics and Disease Severity of US Children and Adolescents Diagnosed With COVID-19. Jama Netw Open. 2021;4(4):e215298. [DOI] [PMC free article] [PubMed] [Google Scholar]
- 5.Feldstein LR, Rose EB, Horwitz SM, et al. Multisystem Inflammatory Syndrome in U.S. Children and Adolescents. N Engl J Med. 2020;383(4):334–346. [DOI] [PMC free article] [PubMed] [Google Scholar]
- 6.Feldstein LR, Tenforde MW, Friedman KG, et al. Characteristics and Outcomes of US Children and Adolescents With Multisystem Inflammatory Syndrome in Children (MIS-C) Compared With Severe Acute COVID-19. JAMA. 2021;325(11):1074–1087. [DOI] [PMC free article] [PubMed] [Google Scholar]
- 7.Gotzinger F, Santiago-Garcia B, Noguera-Julian A, et al. COVID-19 in children and adolescents in Europe: a multinational, multicentre cohort study. Lancet Child Adolesc Health. 2020;4(9):653–661. [DOI] [PMC free article] [PubMed] [Google Scholar]
- 8.Ouldali N, Yang DD, Madhi F, et al. Factors Associated With Severe SARS-CoV-2 Infection. Pediatrics. 2021;147(3). [DOI] [PubMed] [Google Scholar]
- 9.Shekerdemian LS, Mahmood NR, Wolfe KK, et al. Characteristics and Outcomes of Children With Coronavirus Disease 2019 (COVID-19) Infection Admitted to US and Canadian Pediatric Intensive Care Units. JAMA Pediatr. 2020;174(9):868–873. [DOI] [PMC free article] [PubMed] [Google Scholar]
- 10.Kompaniyets L, Agathis NT, Nelson JM, et al. Underlying Medical Conditions Associated With Severe COVID-19 Illness Among Children. Jama Netw Open. 2021;4(6):e2111182–e2111182. [DOI] [PMC free article] [PubMed] [Google Scholar]
- 11.Centers for Disease Control and Prevention. Information for Healthcare Providers about Multisystem Inflammatory Syndrome in Children. Centers for Disease Control and Prevention. https://www.cdc.gov/mis-c/hcp/. Updated May 20, 2021. Accessed April 1, 2021. [Google Scholar]
- 12.Verdoni L, Mazza A, Gervasoni A, et al. An outbreak of severe Kawasaki-like disease at the Italian epicentre of the SARS-CoV-2 epidemic: an observational cohort study. Lancet. 2020;395(10239):1771–1778. [DOI] [PMC free article] [PubMed] [Google Scholar]
- 13.Belay ED, Abrams J, Oster ME, et al. Trends in Geographic and Temporal Distribution of US Children With Multisystem Inflammatory Syndrome During the COVID-19 Pandemic. JAMA Pediatr. 2021. [DOI] [PMC free article] [PubMed] [Google Scholar]
- 14.Bailey LC, Razzaghi H, Burrows EK, et al. Assessment of 135794 Pediatric Patients Tested for Severe Acute Respiratory Syndrome Coronavirus 2 Across the United States. JAMA Pediatr. 2021;175(2):176–184. [DOI] [PMC free article] [PubMed] [Google Scholar]
- 15.Haendel MA, Chute CG, Bennett TD, et al. The National COVID Cohort Collaborative (N3C): Rationale, design, infrastructure, and deployment. J Am Med Inform Assoc. 2021;28(3):427–443. [DOI] [PMC free article] [PubMed] [Google Scholar]
- 16.NIH National Institute of General Medical Sciences. Institutional Development Award (IDeA) Networks for Clinical and Translational Research (IDeA-CTR). National Institutes of Health. https://www.nigms.nih.gov/Research/DRCB/IDeA/Pages/IDeA-CTR.aspx. Accessed April 1, 2021. [Google Scholar]
- 17.Bennett TD, Moffitt RA, Hajagos JG, et al. The National COVID Cohort Collaborative: Clinical Characterization and Early Severity Prediction. medRxiv. 2021. [Google Scholar]
- 18.AAP Division of Health Care Finance. New ICD-10-CM guidance addresses coding for MIS-C, COVID, influenza. AAP News. 2020. https://www.aappublications.org/news/2020/09/01/coding090120. Published September 1, 2020. Accessed April 1, 2021. [Google Scholar]
- 19.Centers for Medicare & Medicaid Services. ICD-10-CM Official Guidelines for Coding and Reporting: FY 2021 – UPDATED January 1, 2021. CMS.gov. https://www.cms.gov/files/document/2021-coding-guidelines-updated-12162020.pdf. Published 2020. Accessed April 1, 2021.
- 20.Marshall J, Murthy S, Diaz J, Adhikari N, Angus D, Arabi Y. WHO Working Group on the Clinical Characterisation and Management of COVID-19 infection: A minimal common outcome measure set for COVID-19 clinical research. Lancet Infect Dis. 2020;20:e192–e197. [DOI] [PMC free article] [PubMed] [Google Scholar]
- 21.Observational Health Data Sciences and Informatics (OHDSI). OMOP Common Data Model. Observational Health Data Sciences and Informatics. https://www.ohdsi.org/data-standardization/the-common-data-model/. Published 2021. Accessed June 18, 2021. [Google Scholar]
- 22.Feinstein JA, Russell S, DeWitt PE, Feudtner C, Dai D, Bennett TD. R package for pediatric complex chronic condition classification. JAMA pediatrics. 2018;172(6):596–598. [DOI] [PMC free article] [PubMed] [Google Scholar]
- 23.Feudtner C, Christakis DA, Connell FA. Pediatric deaths attributable to complex chronic conditions: a population-based study of Washington State, 1980–1997. Pediatrics. 2000;106(1 Pt 2):205–209. [PubMed] [Google Scholar]
- 24.Horwitz LI, Jones SA, Cerfolio RJ, et al. Trends in COVID-19 Risk-Adjusted Mortality Rates. J Hosp Med. 2021;16(2):90–92. [DOI] [PubMed] [Google Scholar]
- 25.Veklury (remdesivir) EUA Letter of Approval, reissued 10/22/2020 [press release]. fda.gov: The Food and Drug Administration, October 22, 2020. [Google Scholar]
- 26.Group RC, Horby P, Lim WS, et al. Dexamethasone in Hospitalized Patients with Covid-19. N Engl J Med. 2021;384(8):693–704. [DOI] [PMC free article] [PubMed] [Google Scholar]
- 27.Ouldali N, Toubiana J, Antona D, et al. Association of Intravenous Immunoglobulins Plus Methylprednisolone vs Immunoglobulins Alone With Course of Fever in Multisystem Inflammatory Syndrome in Children. JAMA. 2021;325(9):855–864. [DOI] [PMC free article] [PubMed] [Google Scholar]
- 28.Verma S, Lumba R, Dapul HM, et al. Characteristics of Hospitalized Children With SARS-CoV-2 in the New York City Metropolitan Area. Hosp Pediatr. 2021;11(1):71–78. [DOI] [PubMed] [Google Scholar]
- 29.Oualha M, Bendavid M, Berteloot L, et al. Severe and fatal forms of COVID-19 in children. Arch Pediatr. 2020;27(5):235–238. [DOI] [PMC free article] [PubMed] [Google Scholar]
- 30.Zachariah P, Johnson CL, Halabi KC, et al. Epidemiology, Clinical Features, and Disease Severity in Patients With Coronavirus Disease 2019 (COVID-19) in a Children’s Hospital in New York City, New York. JAMA Pediatr. 2020;174(10):e202430. [DOI] [PMC free article] [PubMed] [Google Scholar]
- 31.Ma X, Liu S, Chen L, Zhuang L, Zhang J, Xin Y. The clinical characteristics of pediatric inpatients with SARS-CoV-2 infection: A meta-analysis and systematic review. J Med Virol. 2021;93(1):234–240. [DOI] [PMC free article] [PubMed] [Google Scholar]
- 32.Centers for Disease Control and Prevention. Defining Childhood Obesity. https://www.cdc.gov/obesity/childhood/defining.html. Updated July 3, 2018. Accessed March 1, 2021.
Associated Data
This section collects any data citations, data availability statements, or supplementary materials included in this article.