Abstract
Purpose
To develop and evaluate deep learning models for the detection and semiquantitative analysis of cardiomegaly, pneumothorax, and pleural effusion on chest radiographs.
Materials and Methods
In this retrospective study, models were trained for lesion detection or for lung segmentation. The first dataset for lesion detection consisted of 2838 chest radiographs from 2638 patients (obtained between November 2018 and January 2020) containing findings positive for cardiomegaly, pneumothorax, and pleural effusion that were used in developing Mask region-based convolutional neural networks plus Point-based Rendering models. Separate detection models were trained for each disease. The second dataset was from two public datasets, which included 704 chest radiographs for training and testing a U-Net for lung segmentation. Based on accurate detection and segmentation, semiquantitative indexes were calculated for cardiomegaly (cardiothoracic ratio), pneumothorax (lung compression degree), and pleural effusion (grade of pleural effusion). Detection performance was evaluated by average precision (AP) and free-response receiver operating characteristic (FROC) curve score with the intersection over union greater than 75% (AP75; FROC score75). Segmentation performance was evaluated by Dice similarity coefficient.
Results
The detection models achieved high accuracy for detecting cardiomegaly (AP75, 98.0%; FROC score75, 0.985), pneumothorax (AP75, 71.2%; FROC score75, 0.728), and pleural effusion (AP75, 78.2%; FROC score75, 0.802), and they also weakened boundary aliasing. The segmentation effect of the lung field (Dice, 0.960), cardiomegaly (Dice, 0.935), pneumothorax (Dice, 0.827), and pleural effusion (Dice, 0.826) was good, which provided important support for semiquantitative analysis.
Conclusion
The developed models could detect cardiomegaly, pneumothorax, and pleural effusion, and semiquantitative indexes could be calculated from segmentations.
Keywords: Computer-Aided Diagnosis (CAD), Thorax, Cardiac
Supplemental material is available for this article.
© RSNA, 2021
Keywords: Computer-Aided Diagnosis (CAD), Thorax, Cardiac
Summary
A database of chest radiographs was established consisting of cardiomegaly, pneumothorax, and pleural effusion, which were used to train deep learning models for lesion detection and semiquantitative analyses.
Key Points
■ The detection models achieved high accuracy for detecting cardiomegaly (average precision with intersection over union > 75% [AP75], 98.0%;), pneumothorax (AP75, 71.2%), and pleural effusion (AP75, 78.2%).
■ The segmentation performance of the lung field (Dice, 0.960), cardiomegaly (Dice, 0.935), pneumothorax (Dice, 0.827), and pleural effusion (Dice, 0.826) was good, which provided important support for semiquantitative analysis.
■ The readout time required for the detection and semiquantitative analysis of cardiomegaly, pneumothorax, and pleural effusion of the deep learning models was lower than that of the radiologists (P < .001).
Introduction
In radiologic studies, chest radiography is among the most common and noninvasive screening techniques for diagnosis of thoracic and cardiac diseases such as cardiomegaly, pneumothorax, and pleural effusion. However, there are differences between individual radiologists in interpreting studies that may affect the consistency and accuracy of diagnosis. Abnormal interference in chest radiographic images also can make radiologists prone to subjective assessment errors (1). To mitigate these problems and effectively assist clinical diagnosis, computer-aided diagnosis of chest radiographic images has become important.
In recent years, because of the computational power of modern computers and some open-source datasets of labeled chest radiographs (eg, ChestX-ray14 [2,3], MIMIC-CXR [4], and CheXpert [5]), many diagnostic deep learning approaches such as image classification (2,6–9), disease detection (10–13), and lesion location (14–17) have been developed by using chest radiographic images. For example, architectures have been developed to detect consolidation on pediatric chest radiographs (11) and pneumonia on chest radiographs by using a modified 121-layer DenseNet (13,18). Additional models have been developed to detect 14 different pathologic abnormalities on chest radiographs (19) as well as to distinguish the presence or absence of fracture, nodule or mass, pneumothorax, or opacity at radiologist-level performance (20,21).
Previous studies regarding the computer-aided diagnosis on chest radiographic images have mainly focused on disease detection. Some classic lesion location studies used heat maps to localize areas in the images that most indicated the pathologic abnormality (7,9,13). Other studies have used a rectangular bounding box to locate lesions; however, rectangular bounding boxes are not accurate for outlining lesions (7,11). Many of these shortcomings in lesion detection are because of the model training data, in which the chest radiograph databases lack region of interest (ROI) markers. For example, in ChestX-ray14 (2,3), which contains 112 120 frontal-view radiographs, only about 1000 images are labeled with rectangular bounding boxes. Additionally, labels from most public chest radiograph datasets are derived from the original radiology reports, which are often generated by natural language processing. Therefore, images within these datasets may have incorrect labeling. For example, in ChestX-ray14, the reported accuracy of labels was approximately 90% (2,3).
The biggest challenge of computer-aided diagnosis is the high false-positive rate (22), which may mislead radiologists to make false-positive assessments (23). Currently, most detection networks only provide high-probability markers and lesion areas in chest radiographic images. On the basis of accurate lesion location, it is vital to calculate the relevant semiquantitative indicators. In daily clinical diagnosis, the method of quantifying lesions consists of a combination of subjective visual observation and manual measurement, which is cumbersome and could easily be affected by subjective factors. Although either the heat map or rectangular bounding box method could locate the high-probability location of the lesion, it is possible that neither may accurately define the boundary of the lesion, which limits the accuracy of semiquantitative metrics.
In our study, we curated a chest radiograph database with high-quality labeled findings that were positive for cardiomegaly, pneumothorax, and pleural effusion. All the images in this dataset were identified by labels and by delineating ROIs indicated by radiologists. Moreover, deep learning models were developed and evaluated to detect cardiomegaly, pneumothorax, and pleural effusion. Additionally, our work provided quantitative analyses to effectively aid in diagnosis. The automatic detection and quantitative analysis of chest radiographic images could be beneficial to the initial screening of cardiomegaly, pneumothorax, and pleural effusion.
Materials and Methods
Datasets
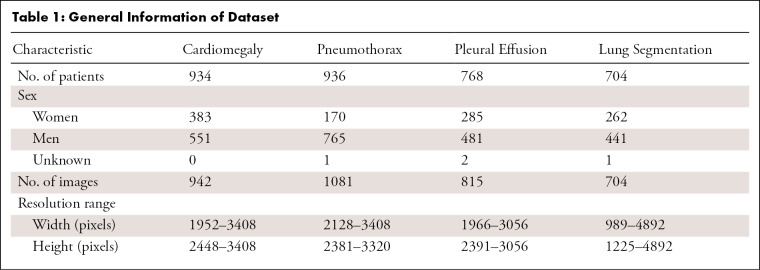
In this retrospective study, two independent datasets were used for developing lesion detection models and a lung segmentation model. The lesion detection dataset contained 2838 chest radiographic images in the Digital Imaging and Communications in Medicine (DICOM) format from 2638 patients evaluated at Nanjing First Hospital (Nanjing, China) between November 2018 and January 2020. Institutional ethics committee approval was obtained from Nanjing First Hospital. This dataset consisted of high-quality labeled findings positive for cardiomegaly, pneumothorax, and pleural effusion, which included 942 frontal chest radiographs of 934 patients with cardiomegaly, 1081 frontal chest radiographs from 936 patients with pneumothorax, and 815 frontal chest radiographs from 768 patients with pleural effusion (Table 1). Data from patients with cardiomegaly, pneumothorax, and pleural effusion were collected by using keyword searches in the picture archiving and communication system. Patients who met one of the following four criteria were excluded from our study: portable anteroposterior radiographs, images with chest tube inserted, images with significant artifacts, and images without lung apex or costophrenic angler. Although the images in this dataset were selected based on the radiology report, radiologists identified the reference labels for each image and manually delineated the ROIs.
Table 1:
General Information of Dataset
For further quantitative analysis, we developed a model to segment the lung in frontal chest radiographic images. The lung segmentation dataset was derived from the publicly available dataset from the Montgomery County Department of Health and Human Services (Maryland, United States) and Shenzhen No. 3 People’s Hospital, Guangdong Medical College (Shenzhen, China) (24). The Montgomery County dataset contained 138 frontal chest radiographic images, in which the corresponding manual segmentation masks were made separately for the left and right lung fields. The Shenzhen dataset included 662 frontal chest radiographic images (mostly from September 2012), and the manually segmented lung masks were prepared by Stirenko et al (25) of the National Technical University of Ukraine Igor Sikorsky Kyiv Polytechnic Institute. Images without masks were excluded. A total of 704 identified images from these two datasets were used for development of the lung segmentation model. Table 1 shows an overview of the datasets.
Processing Chest Radiographic Images
In our dataset (2838 images in the lesion detection model), the original radiographic image dimension was 2048 × 2048, which imposed challenges in both the capacity of computing hardware and the design of the deep learning model. On the premise of keeping the aspect ratio unchanged and not substantially losing the detail contents, we first scaled the width to 800. If the length exceeded 1333 at this time, the length was rescaled to 1333. During the training process, when there were multiple images of different sizes in the same batch, we filled these images to the same size as the smallest image in this batch. Moreover, because DICOMs with a different modality might have a different intensity range (some DICOMs had intensity of > 4095, whereas most DICOMs had an intensity between 0 and 4095), we converted the pixel intensity of all DICOMs into [0, 4095] to keep the intensity range consistent. We then linearly compressed the intensity range to [0, 255] for all DICOMs. Last, we used the OpenCV (https://opencv.org/) Python library to equalize the images to enhance the contrast of those images. The images were saved as PNG files.
Reference Standard and Image Annotation
For the detection dataset, we sought to identify three findings on chest radiographs: cardiomegaly, pneumothorax, and pleural effusion. Clinical definitions for these categories were derived from a glossary of terms for thoracic imaging (26). Reference-standard labels for all images in the detection dataset were independently evaluated by an adjudicated review conducted by three radiologists (M.P., 14 years of experience in image diagnostics; Y.F., 8 years of experience in image diagnostics; T.Z., 2 years of experience in image diagnostics). In cases where consensus was not reached, the majority vote was used. All radiologists had access to the image view, but they did not have access to additional clinical data or any patient data. Radiologists manually sketched the outline of the lesion (ie, ROI) in all the images in the three datasets. The rectangular bounding box labels were generated by coding to locate the upper, lower, left, and right limits of the abnormality contour.
The cardiothoracic ratio is a useful index of cardiomegaly. To estimate the cardiothoracic ratio, the widest transverse diameter of the heart was compared with the widest internal transverse diameter of the thoracic cage. The cardiothoracic ratio is less than 50% in most healthy adults on a standard frontal radiograph (27).
Pneumothorax was diagnosed by the presence of a white visceral pleural line on the chest radiograph, without pulmonary vessels visible beyond this. The compression ratio is an important indicator for the diagnosis of pneumothorax; it is one parameter in clinical decision-making in deciding between conservative treatment or closed drainage.
Typically, it is difficult to quantify the entire volume of pleural effusion on chest radiographic images, although some clinical trials tried to grade pleural effusion based on the costophrenic angle (28). Minimal pleural effusion typically resolves with no intervention. Moderate to severe pleural effusion requires tapping or closed drainage. In this study, the grade of pleural effusion was classified as minor or not minor on the basis of the diagnosis of radiologists.
We chose the cardiothoracic ratio, the degree of lung compression, and the grade of pleural effusion as semiquantitative indicators to further assist radiologists in the diagnosis of cardiomegaly, pneumothorax, and pleural effusion, respectively.
Model Development
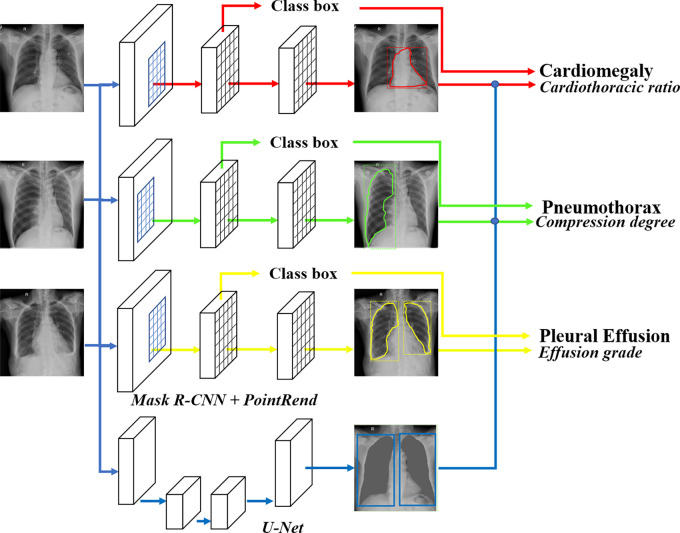
Radiographic findings detection.— To obtain the location and shape of the desired radiographic findings, we applied the Mask region-based convolutional neural network (R-CNN) (29) pretrained on ImageNet (30) in computer vision, which could detect and delineate each distinct object of interest appearing in an image. The first stage generated proposals about regions where there might be an object of interest based on the input image. The second stage classified the proposals, refined the rectangular bounding box, and generated a mask at the pixel level of the object based on the first stage proposal. Both stages were connected to the backbone structure, which scanned the input image and extracted features from it.
To optimize the boundary quality, we incorporated the Point-based Rendering (PointRend) module (31) into Mask R-CNN by using PointRend to replace Mask R-CNN’s default mask head (Mask R-CNNPointRend). The central idea of PointRend was to view image segmentation as a rendering problem, adapting classic ideas from computer graphics to efficiently “render” high-quality label maps, and by using a subdivision strategy to adaptively select a nonuniform set of points at which to compute labels. Three separate detection models were trained and optimized to detect cardiomegaly, pneumothorax, and pleural effusion field. All models were trained to output both a lesion ROI as well as a rectangular bounding box around the lesion.
Lung segmentation for semiquantitative analysis.— For data from patients with cardiomegaly, the cardiothoracic ratio was defined as the ratio between the maximum transverse diameter of the heart and the maximum width of the thorax, as follows:
 |
First, the rectangular bounding box of the heart was obtained through Mask R-CNN. Second, the rectangular bounding box of the thoracic cage was obtained based on the segmentation of the left and right lungs by U-Net (32). In Equation (1), the ratio of the widths of the two bounding boxes was calculated.
In prior clinical trials, the compression degree of pneumothorax typically was calculated by using the equation by Kircher and Swartzel (33), as follows:
 |
We used Mask R-CNN to locate the pneumothorax area. The ipsilateral lung field through U-Net was located. In Equation (2), the area ratio of the two ROIs was calculated.
Pleural effusion was graded as minor or not minor by radiologists. The Mask R-CNN was further used to achieve automatic grading of pleural effusion. The U-Net was not used for semiquantitative analysis for pleural effusion.
Experimental Setup
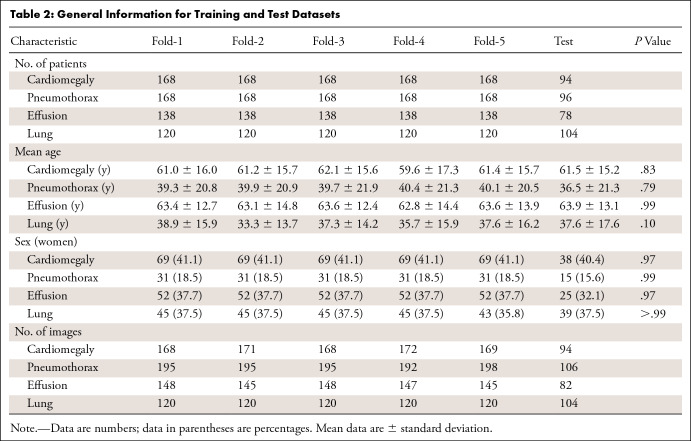
The datasets for the three lesion detection models and the lung segmentation models were randomly divided into training (90%) and testing (10%) datasets. To make full use of the data, model parameters were selected through fivefold cross-validation on the training dataset. A stratified sampling strategy was used during the partition, in which 80% of the training data were used for initial training and the other 20% of the training data were used for selecting optimal weights for the model. Then, relevant evaluation indicators were calculated on the test datasets. Within both the testing and training datasets for all four models, we ensured that images from the same patient remained in the same split to avoid training and testing on the same patient. Patient characteristics among the datasets are shown in Table 2 (Table E1 [supplement]).
Table 2:
General Information for Training and Test Datasets
During training, we adopted data augmentation operations and included randomized image flipping, contrast and brightness adjusting, and rotation with angles between −15° and 15°. The stochastic gradient descent optimizer was used as the optimization method for model training. The basic learning rate was set to 0.01 and was reduced by a factor of 10 at the 60th and 80th epoch, with a total of 100 training epochs. The mini-batch size was set to 16. All models were implemented using the PyTorch framework (Fig 1), and all experiments were performed on a workstation equipped with an Intel Xeon Processor E5–2620 v4 2.10 GHz central processing unit and four 12GB memory NVIDIA GeForce GTX 1080 Ti graphics processing unit cards.
Figure 1:
The overview of the disease detection and semiquantitative analysis framework. PointRend = Point-based Rendering, R-CNN = region-based convolutional neural network.
Statistical Analysis
Because our model could provide location information about the chest radiograph findings, we used the average precision (AP) score and free-response receiver operating characteristic (FROC) curve to assess the accuracy of our model. AP is a common metric for measuring the performance of an object detection model. Following the metrics used in the Common Objects in Context challenge, the mean AP was defined as the mean AP over multiple intersection over union thresholds from 0.5 to 0.95 with a step size of 0.05. AP50 and AP75 were defined as AP within the ROI with an intersection over union greater than 50% and 75%, respectively. The FROC curve is a tool for characterizing the performance of a free-response system at all decision thresholds simultaneously. It mainly evaluates the cost (the number of false-positive findings) of a method to achieve proper sensitivities. In our study, FROC score was the average sensitivity when the number of false-positive findings per image coordinated at 0.125, 0.25, 0.5, 1, 2, 4, and 8. FROC score within the ROI with an intersection over union greater than 75% is referred to here as FROC score75. Additionally, we used area-based metrics (Dice similarity coefficient) to assess the segmentation performance of different methods. The Dice score measures the degree of overlap between the predicted segmentation masks and the ground truth.
To compare the diagnostic efficiency of deep learning models and experienced radiologists, we randomly selected 100 images from each disease in the detection database to perform readout time statistics. Three other radiologists participated in the competition, each with 7–9 years of experience in diagnosis at chest radiography. Before the competition, the radiologists participated in a training including the competition procedures. They were required to read the chest radiographic images on a conventional picture archiving and communication system as they would in their daily work. The readout time of detection and semiquantitative was recorded. A two-tailed P value of less than .05 was considered to indicate statistical significance. Statistical analyses and graphing were performed with software (R version 4.0.2; R Project for Statistical Computing).
Results
Detection Performance Analysis
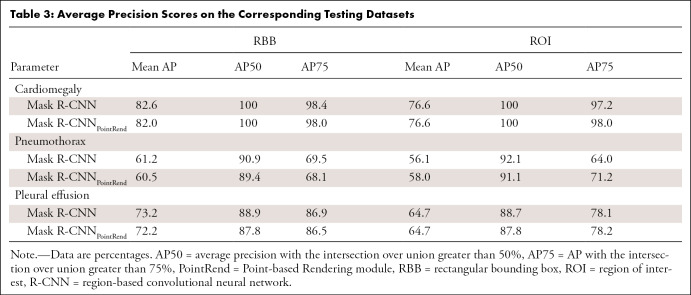
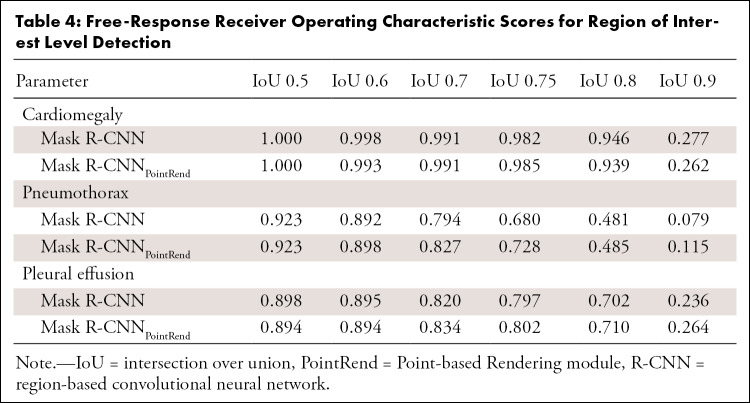
The Mask R-CNNs were trained to output either an ROI (ROI drawn by radiologist was ground truth) or a rectangular bounding box. As shown in Table 3, the performance of the ROI outputs was slightly lower than that of the rectangular bounding box group. The Mask R-CNNs were capable of detecting cardiomegaly (rectangular bounding box vs ROI mean AP, 82.6% vs 76.6%, respectively), pneumothorax (rectangular bounding box vs ROI mean AP, 61.2% vs 56.1%, respectively), and pleural effusion (rectangular bounding box vs ROI mean AP, 73.2% vs 64.7%, respectively). The AP score (Table 3) and FROC score (Table 4) for cardiomegaly detection were higher than that for pneumothorax and pleural effusion detection. The FROC curves for cardiomegaly detection had a steeper slope (Figs E1–E3 [supplement]).
Table 3:
Average Precision Scores on the Corresponding Testing Datasets
Table 4:
Free-Response Receiver Operating Characteristic Scores for Region of Interest Level Detection
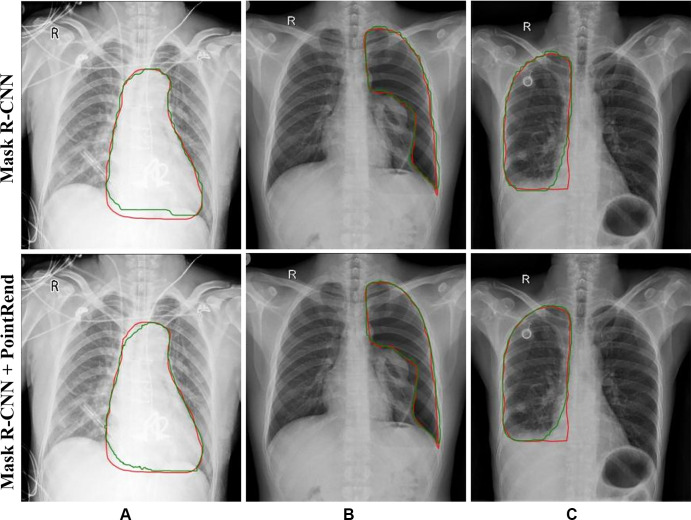
Mask R-CNNPointRend was incorporated to optimize the boundary quality, which resulted in high accuracy and sensitivity detection of the cardiomegaly (AP75, 98.0%; FROC score75, 0.985), pneumothorax (AP75, 71.2%; FROC score75, 0.728), and pleural effusion (AP75, 78.2%; FROC score75, 0.802), but also weakened the boundary aliasing (Fig 2). The aforementioned metrics (Tables 3–5) were calculated based on the average test results of five models selected through cross-validation. The results of fivefold cross-validation are shown in Tables E2 and E3 (supplement).
Figure 2:
Results from Mask region-based convolutional neural network (R-CNN) to Mask R-CNN Point-based Rendering (PointRend) in (A) cardiomegaly, (B) pneumothorax, and (C) pleural effusion detection. Red lines indicate ground truth labels; green lines are from the models.
Table 5:
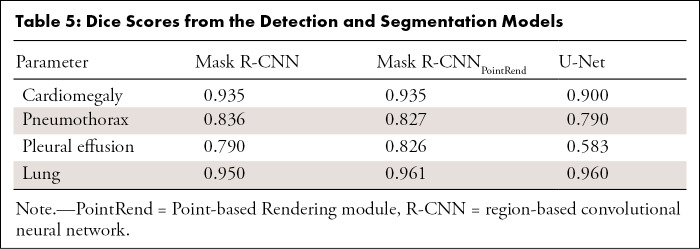
Dice Scores from the Detection and Segmentation Models
Semiquantitative Analysis
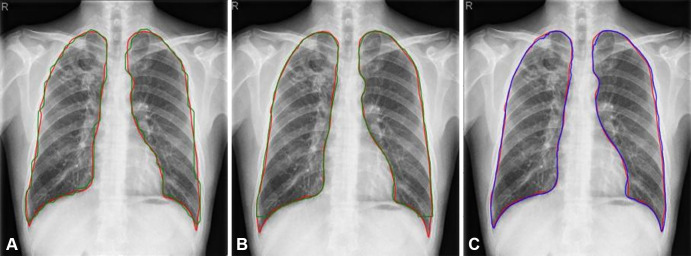
As shown in Table 5, the Mask R-CNNPointRend and Mask R-CNN Dice scores for cardiomegaly, pneumothorax, and pleural effusion segmentation were higher than those for U-Net. For lung segmentation, the performance of these three models was similar. However, the ROI boundary obtained by using U-Net was visually smoother (Fig 3). The Dice scores of fivefold cross-validation are shown in Table E4 (supplement).
Figure 3:
Results of Mask region-based convolutional neural network Point-based Rendering (R-CNNPointRend) and Mask R-CNN compared with U-Net for lung segmentation. Red contours were ground truth. Predictions from (A) Mask R-CNN (green line), (B) Mask R-CNNPointRend (green line), and (C) U-Net (blue line).
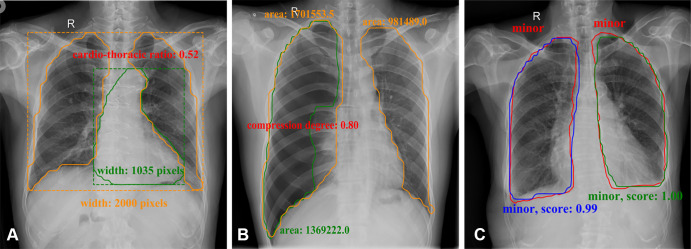
Mask R-CNNPointRend and Mask R-CNN were used to locate ROI, and then U-Net was used for segmentation of the lung field. Based on accurate segmentation, commonly used clinical disease assessment indicators were automatically calculated. While outputting high-probability label and areas on the image that most clearly depicted the area of the pathologic abnormality, corresponding semiquantitative indicators were the output. As shown in Figure 4A, the boundary of the heart shadow and bilateral lung fields was detected, and these values were used to calculate the cardiothoracic ratio. In Figure 4B, the boundary of the white visceral pleural line was detected and the ipsilateral lung field was segmented, and then pneumothorax compression degree based on the area method was computed. In Figure 4C, the boundary of pleural effusion was detected, and the level of effusion was provided (minor or not minor).
Figure 4:
Semiquantitative analysis results for (A) cardiomegaly (orange contours were predicted lung masks and green contour was predicted heart boundary; these were used to calculate the cardiothoracic ratio), (B) pneumothorax (orange contours were predicted lung masks and green contour was predicted lung masks with lung texture; these were used to calculate the area compression degree), and (C) pleural effusion in frontal chest radiographs (red contours were ground truth and others were outputs of the model; these were used to calculate effusion level and confidence score).
Comparison of Diagnostic Efficiency
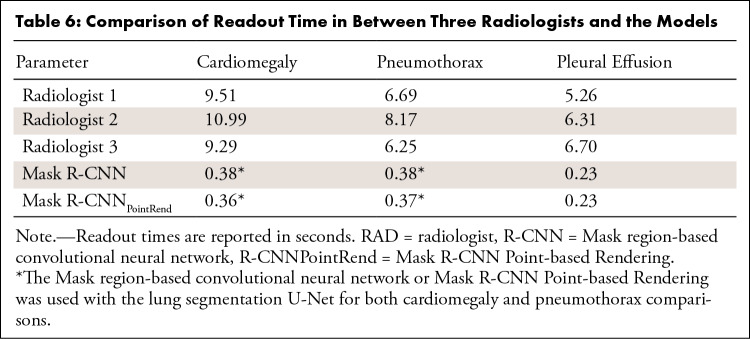
We randomly selected 100 images from each disease category in the detection database to perform readout time statistics. Table 6 summarizes the readout time of three radiologists and our deep learning models. The readout times of our deep learning models were lower than those of the radiologists (P < .001) (Figs E4–E6 [supplement]). On average, the time required for detection and semiquantitative analysis of cardiomegaly, pneumothorax, and pleural effusion by using the deep learning model was reduced by 9.5 seconds, 6.66 seconds, and 5.64 seconds, respectively.
Table 6:
Comparison of Readout Time in Between Three Radiologists and the Models
Discussion
We developed and validated deep learning models for detection and segmentation at chest radiography of cardiomegaly, pneumothorax, and pleural effusion. These models used ROIs drawn by radiologists as the segmentation ground truth and the labels adjudicated by radiologists as the reference standard. The three disease models could distinguish the radiographic findings and segment ROIs at the same time. On this basis, the semiquantitative analysis indicators, such as the cardiothoracic ratio, pneumothorax compression degree, and grade of pleural effusion, were calculated to further assist radiologists in achieving an accurate diagnosis.
For most public chest radiographic image datasets (2–5), the images were labeled based on the original radiology reports by natural language processing; therefore, there may be incorrect labels. To improve the detection accuracy of the computer-aided chest radiographic images diagnosis system, datasets with high-quality labels are needed. Moreover, in the existing public chest radiographic image database, the number of rectangular bounding boxes in the lesion area was limited and the boundary of the lesion was absent. Therefore, there were few studies regarding ROI location and segmentation. Some studies (7,9,13) used the heat map method, through the feature maps to localize areas on the images that were most indicative of the pathologic abnormality. However, the heat map method could not accurately provide an outline of the lesion area. In this study, we established a chest radiographic image database with lesion masks and high-quality labels to advance research on lesion detection in cardiomegaly, pneumothorax, and pleural effusion.
Mask R-CNNPointRend outperformed the default Mask R-CNN in ROI detection of three different findings, including cardiomegaly (AP75 increased 0.81%, FROC score75 increased 0.3%), pneumothorax (AP75 increased 11.38%, FROC score75 increased 4.8%), and pleural effusion (AP75 increased 0.24%, FROC score75 increased 0.5%). Visually, the difference in boundary quality remained obvious. However, the AP score (Table 3) and FROC score (Table 4) for cardiomegaly detection was higher than that for pneumothorax and pleural effusion detection. The FROC curve (Fig E1 [supplement]) of cardiomegaly detection was also steeper. The possible reason was that, compared with cardiomegaly, the shape of the pneumothorax and pleural effusion changes greatly and the boundaries were also less clear. It could be further improved by collecting more data.
Most detection models only give high-probability labels directly, which might result in radiologists making false-positive assessments (6). We speculate that while giving the test results, calculating the commonly used clinical quantitative indicators could reduce the work of radiologists and improve the quantitative accuracy. In daily clinical work, radiologists perform quantitative analysis by manual measurement, which is time-consuming and can be inaccurate. In addition, there are certain differences between individual radiologists in interpreting studies, which may affect the consistency and accuracy of diagnosis, especially when observing the development of a disease. Because the number of ground truths for manually segmenting the lesion area is limited and it is difficult to accurately segment lesions in radiographic images of the chest, to our knowledge, there is currently no relevant automatic chest radiography quantitative analysis system. We used the existing open dataset to train the U-Net model to achieve lung field segmentation, which had higher accuracy (Dice, 0.960) compared with previous research (Dice, 0.934) (34). Then, combined with lesion information detected by Mask R-CNNPointRend and lung field information detected by U-Net, the corresponding quantitative values were calculated according to the relevant definition of the index. Compared with radiologists, the deep learning model has a significantly shorter readout time for cardiomegaly, pneumothorax, and pleural effusion (Table 6) (P < .001).
Some limitations must be acknowledged. First, the detection dataset was a single-center study, and the amount of data was relatively small. Second, the data used in this study included only three radiographic findings. We speculated that the predictions may be improved by incorporating more findings. In the future, we plan to collect multicenter and multifocus data, and further improve the generalizability of the model. Third, the general diagnosis for the pleural effusion needs to integrate the features of frontal and lateral radiographs. Because lateral images were not available for some patients, the current pleural effusion detection model only input frontal images for model training. In future work we will expand the pleural effusion dataset and develop a multiposition combined model for the diagnosis of pleural effusion.
In our study, we established a high-quality labeled chest radiograph database that consisted of chest radiographs with findings positive for cardiomegaly, pneumothorax, and pleural effusion. By using these databases, we developed a method for detection and quantitative analysis of these diseases to assist radiologists in diagnosis. Specifically, the Mask R-CNNPointRend model achieved high accuracy and sensitivity of disease detection. Semiquantitative analysis could reduce the work of radiologists, improve the objective accuracy of quantitative measurement, and be a reasonable option to assist clinical diagnosis. Further studies are required for assessing the effects of these models on health care delivery.
Supported by the National Natural Science Foundation of China (grant 81901806).
Disclosures of Conflicts of Interest: L.Z. disclosed no relevant relationships. X.Y. disclosed no relevant relationships. T.Z. disclosed no relevant relationships. Y.F. disclosed no relevant relationships. Y.Z. disclosed no relevant relationships. M.J. disclosed no relevant relationships. M.P. disclosed no relevant relationships. C.X. disclosed no relevant relationships. F.L. disclosed no relevant relationships. Z.W. disclosed no relevant relationships. G.W. disclosed no relevant relationships. X.J. disclosed no relevant relationships. Y.L. disclosed no relevant relationships. X.W. disclosed no relevant relationships. L.L. disclosed no relevant relationships.
Abbreviations:
- AP
- average precision
- DICOM
- Digital Imaging and Communications in Medicine
- FROC
- free-response receiver operating characteristic
- PointRend
- Point-based Rendering
- ROI
- region of interest
- R-CNN
- region-based convolutional neural network
References
- 1.Brady A, Laoide RÓ, McCarthy P, McDermott R. Discrepancy and error in radiology: concepts, causes and consequences. Ulster Med J 2012;81(1):3–9. [PMC free article] [PubMed] [Google Scholar]
- 2.Wang X, Peng Y, Lu L, et al. ChestX-Ray8: Hospital-Scale Chest X-Ray Database and Benchmarks on Weakly-Supervised Classification and Location of Common Thorax Diseases. In: 2017 IEEE Conference on Computer Vision and Pattern Recognition (CVPR),Honolulu, HI,July 21–26, 2017.Piscataway, NJ:IEEE,2017;3462–3471. [Google Scholar]
- 3.NIH Chest X-ray Dataset of 14 Common Thorax Disease Categories. https://nihcc.app.box.com/v/ChestXray-NIHCC/file/220660789610. Published 2019. Accessed July 7, 2021.
- 4.Johnson AEW, Pollard TJ, Berkowitz S, et al. MIMIC-CXR: A large publicly available database of labeled chest radiographs. arXiv 1901.07042[preprint] https://arxiv.org/abs/1901.07042. Posted January 21, 2019. Accessed July 7, 2021. [DOI] [PMC free article] [PubMed] [Google Scholar]
- 5.Irvin J, Rajpurkar P, Ko M, et al. CheXpert: A large chest radiograph dataset with uncertainty labels and expert comparison. Proc Conf AAAI Artif Intell 2019;33:590–597. [Google Scholar]
- 6.Tajbakhsh N, Suzuki K. Comparing two classes of end-to-end machine-learning models in lung nodule detection and classification. Pattern Recognit 2017;63(476):486. [Google Scholar]
- 7.Guan Q, Huang Y. Multi-label chest X-ray image classification via category-wise residual attention learning. Pattern Recognit Lett 2020;130(259):266. [Google Scholar]
- 8.Chen B, Li J, Guo X, et al. DualCheXNet: dual asymmetric feature learning for thoracic disease classification in chest X-rays. Biomed Signal Process Control 2019;53:101554.1–101554.10. [Google Scholar]
- 9.Guan Q, Huang Y, Zhong Z, et al. Thorax Disease Classification with Attention Guided Convolutional Neural Network. Pattern Recognit Lett 2020;131(38):45. [Google Scholar]
- 10.Li X, Shen L, Xie X, et al. Multi-resolution convolutional networks for chest X-ray radiograph based lung nodule detection. Artif Intell Med 2020;103101744. [DOI] [PubMed] [Google Scholar]
- 11.Behzadi-Khormouji H, Rostami H, Salehi S, et al. Deep learning, reusable and problem-based architectures for detection of consolidation on chest X-ray images. Comput Methods Programs Biomed 2020;185105162. [DOI] [PubMed] [Google Scholar]
- 12.Maduskar P, Philipsen RH, Melendez J, et al. Automatic detection of pleural effusion in chest radiographs. Med Image Anal 2016;28(22):32. [DOI] [PubMed] [Google Scholar]
- 13.Rajpurkar P, Irvin J, Zhu K, et al. CheXNet: Radiologist-Level Pneumonia Detection on Chest X-Rays with Deep Learning. arXiv 1711.05225 [preprint]. Computer Vision and Pattern Recognition https://arxiv.org/abs/1711.05225. Posted November 14, 2017. Accessed July 7, 2021. [Google Scholar]
- 14.Sirazitdinov I, Kholiavchenko M, Mustafaev T, et al. Deep neural network ensemble for pneumonia location from a large-scale chest x-ray database. Comput Electr Eng 2019;78(388):399. [Google Scholar]
- 15.Souza JC, Bandeira Diniz JO, Ferreira JL, França da Silva GL, Corrêa Silva A, de Paiva AC. An automatic method for lung segmentation and reconstruction in chest X-ray using deep neural networks. Comput Methods Programs Biomed 2019;177(285):296. [DOI] [PubMed] [Google Scholar]
- 16.Zotin A, Hamad Y, Simonov K, et al. Lung boundary detection for chest X-ray images classification based on GLCM and probabilistic neural networks. Procedia Comput Sci 2019;159(1439):1448. [Google Scholar]
- 17.Chondro P, Yao CY, Ruan SJ, et al. Low order adaptive region growing for lung segmentation on plain chest radiographs. Neurocomputing 2018;275(1002):1011. [Google Scholar]
- 18.Huang G, Liu Z, Der Maaten LV, et al. Densely Connected Convolutional Networks. In: 2017 IEEE Conference on Computer Vision and Pattern Recognition (CVPR),Honolulu, HI,July 21–26, 2017.Piscataway, NJ:IEEE,2017;2261–2269. [Google Scholar]
- 19.Rajpurkar P, Irvin J, Ball RL, et al. Deep learning for chest radiograph diagnosis: A retrospective comparison of the CheXNeXt algorithm to practicing radiologists. PLoS Med 2018;15(11):e1002686. [DOI] [PMC free article] [PubMed] [Google Scholar]
- 20.Majkowska A, Mittal S, Steiner DF, et al. Chest radiograph interpretation with deep learning models: Assessment with radiologist-adjudicated reference standards and population-adjusted evaluation. Radiology 2020;294(2):421–431. [DOI] [PubMed] [Google Scholar]
- 21.Chollet F. Xception: Deep Learning with Depthwise Separable Convolutions. In: 2017 IEEE Conference on Computer Vision and Pattern Recognition (CVPR),Honolulu, HI,July 21–26, 2017.Piscataway, NJ:IEEE,2017;2261–2269. [Google Scholar]
- 22.Rodríguez-Ruiz A, Krupinski E, Mordang JJ, et al. Detection of Breast Cancer with Mammography: Effect of an Artificial Intelligence Support System. Radiology 2019;290(2):305–314. [DOI] [PubMed] [Google Scholar]
- 23.Abdelhafiz D, Yang C, Ammar R, Nabavi S. Deep convolutional neural networks for mammography: advances, challenges and applications. BMC Bioinformatics 2019;20(Suppl 11):281. [DOI] [PMC free article] [PubMed] [Google Scholar]
- 24.Jaeger S, Candemir S, Antani S, Wáng YX, Lu PX, Thoma G. Two public chest X-ray datasets for computer-aided screening of pulmonary diseases. Quant Imaging Med Surg 2014;4(6):475–477. [DOI] [PMC free article] [PubMed] [Google Scholar]
- 25.Stirenko S, Kochura Y, Alienin O, et al. Chest X-Ray Analysis of Tuberculosis by Deep Learning with Segmentation and Augmentation. arXiv 1803.01199 [preprint] https://arxiv.org/abs/1803.01199. Posted March 3, 2018. Accessed July 7, 2021. [Google Scholar]
- 26.Hansell DM, Bankier AA, MacMahon H, McLoud TC, Müller NL, Remy J. Fleischner Society: glossary of terms for thoracic imaging. Radiology 2008;246(3):697–722. [DOI] [PubMed] [Google Scholar]
- 27.Razavi MK, Dake MD, Semba CP, Nyman UR, Liddell RP. Percutaneous endoluminal placement of stent-grafts for the treatment of isolated iliac artery aneurysms. Radiology 1995;197(3):801–804. [DOI] [PubMed] [Google Scholar]
- 28.Armato SG 3rd, Giger ML, MacMahon H. Computerized delineation and analysis of costophrenic angles in digital chest radiographs. Acad Radiol 1998;5(5):329–335. [DOI] [PubMed] [Google Scholar]
- 29.He K, Gkioxari G, Dollár D, Girshick R. Mask R-CNN. In: 2017 IEEE International Conference on Computer Vision (ICCV),Venice, Italy,October 22–29, 2017.Piscataway, NJ:IEEE,2017;2980–2988 [Google Scholar]
- 30.Russakovsky O, Deng J, Su H, et al. Imagenet large scale visual recognition challenge. Int J Comput Vis 2015;115(3):211–252. [Google Scholar]
- 31.Kirillov A, Wu Y, He K, Girshick R. PointRend: Image Segmentation as Rendering. arXiv 1912.08193 [preprint] https://arxiv.org/abs/1912.08193. Posted December 17, 2019. Accessed July 7, 2021. [Google Scholar]
- 32.Ronneberger O, Fischer P, Brox T. U-Net: Convolutional Networks for Biomedical Image Segmentation. In: Navab N, Hornegger J, Wells W, Frangi A, eds.Medical Image Computing and Computer-Assisted Intervention – MICCAI 2015. MICCAI 2015. Lecture Notes in Computer Science,vol 9351.Cham, Switzerland:Springer,2015;234–241. [Google Scholar]
- 33.Kircher LT Jr, Swartzel RL. Spontaneous pneumothorax and its treatment. J Am Med Assoc 1954;155(1):24–29. [DOI] [PubMed] [Google Scholar]
- 34.Chen C, Dou Q, Chen H, et al. Semantic-Aware Generative Adversarial Nets for Unsupervised Domain Adaptation in Chest X-Ray Segmentation. arXiv 1806.00600 [preprint] https://arxiv.org/abs/1806.00600. Posted June 2, 2018. Accessed July 7, 2021. [Google Scholar]


