

Abstract
Thioamides are found in a few natural products and two known protein assemblies: the Escherichia coli ribosome and methyl coenzyme M reductase (MCR) from methane-metabolizing archaea. Compared to an amide, thioamides alter the physical and chemical properties of peptide backbones, including the conformation dynamics, proteolytic stability, hydrogen-bonding capabilities, and possibly reactivity of a protein when installed. Recently, there has been significant progress in elucidating enzymatic post-translational thioamide installation, with most work leveraging the archaeal MCR-modifying enzymes. This chapter describes the protocols used for the in vitro enzymatic thioamidation of MCR-derived peptides, including polypeptide overexpression, purification, reaction reconstitution, and mass spectrometry-based product analysis. In addition, we highlight the protocols used for the biochemical, kinetics, and binding studies using recombinant enzymes obtained heterologously from E. coli. We anticipate that these methods will serve to guide future studies on peptide post-translational thioamidation, as well as other peptide backbone modifications using a parallel workflow.
Keywords: Thioamidation, MCR, YcaO, TfuA, ATP, O-phosphorylation, recombinant proteins, PTM, fluorescence polarization
1. Introduction
Thioamides are rare in biology. Most reported natural thioamides are from bacteria and archaea, with the only known exception being a plant-derived natural product cycasthioamide. Among these are the ribosomally synthesized and post-translationally modified peptide (RiPP) natural products thioviridamide and its analogs, methanobactin, and thioamidated thiopeptides in addition to closthioamide, which is a non-ribosomal compound (Figure 1) (Mahanta et al., 2019). Additional thioamide-containing nucleotides include thiouridine, thiocytidine, and thioguanine (Mahanta et al., 2019). Compared with thioamide-containing nucleosides, until recently, the biosynthesis of peptidic thioamides was poorly understood. Recently, the biosynthetic pathway was identified for closthioamide, which shares features of thionated nucleoside biosynthesis (Dunbar et al., 2019). As for post-translationally installed thioamides such as those seen in RiPPs, it was predicted that enzymes from the YcaO superfamily (PF02624) could be responsible for their installation, based on the peptide backbone activation mechanism utilized by this enzyme family (Burkhart et al., 2017). This hypothesis was supported by the co-occurrence of YcaO and a partner protein named TfuA (PF07812) in the biosynthetic gene clusters of almost all the thioamide-containing RiPPs, including thioviridamide and its homologs (Izawa et al., 2013; Frattaruolo et al., 2017; Kjaerulff et al., 2017), thioamidated thiopeptides (Schwalen et al., 2018), and thiovarsolin (Santos-Aberturas et al., 2019). Moreover, a functional expression study (Schwalen et al., 2018) demonstrated that YcaO and TfuA are necessary and sufficient for installing a thioamide to form the thiopeptide Sch 18640. The only thioamide-containing RiPPs that is not linked to YcaO-dependent biosynthesis are the methanobactins, which were recently shown to utilize Fe(II)-dependent bipartite enzymatic machinery (Kenney et al., 2018). These YcaO-dependent thioamide-containing RiPPs are now referred to as thioamitides (Montalbán-López et al., 2021). Collectively, these revelations suggest that diverse thioamidation strategies arose through different independent enzymatic pathways. Similarly, discrete enzymes have been shown to install thiazol(in)e moieties in RiPPs (YcaO), thiamine (ThiG), and non-ribosomal peptides (cyclization domain of EpoB) (Jurgenson et al., 2009; Dunbar et al., 2012; Dowling et al., 2016)
Figure 1:

Structures of thioamidated peptidic natural products. Adapted from Mahanta et al., 2018.
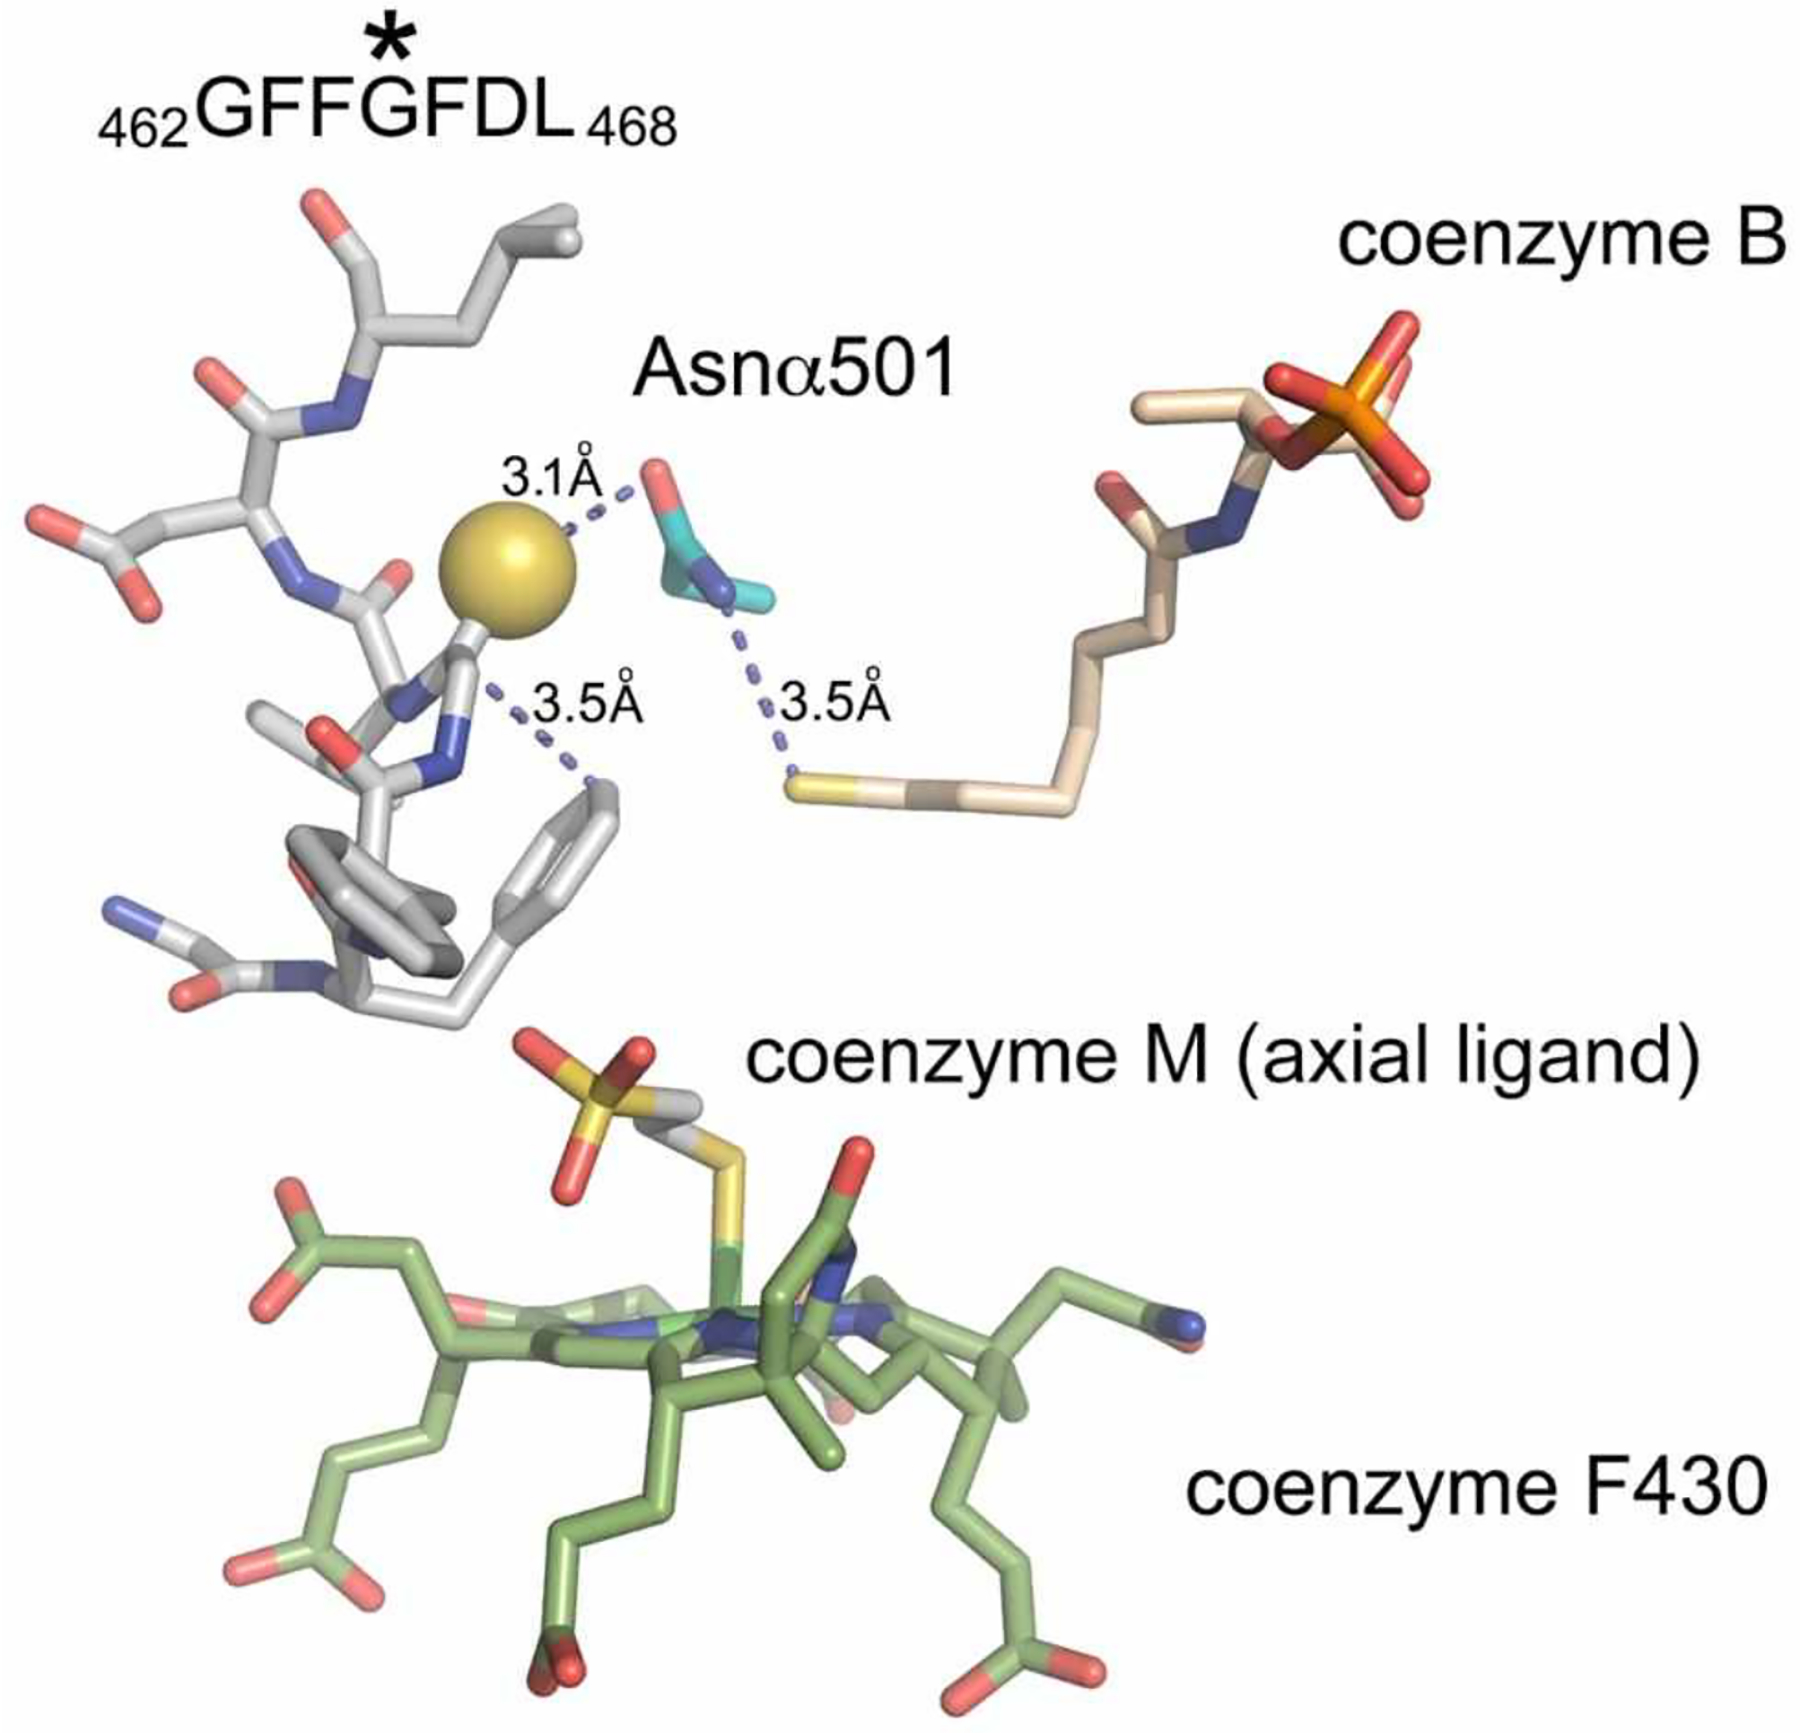
In addition to natural products and nucleotide analogs, thioamides are also found as a rare form of post-translational modification (PTM), as identified in the alpha subunit of methyl-coenzyme M reductase (McrA) and L16 protein from the ribosome (Ermler et al., 1997; Watson et al., 2020). Notably, McrA and L16 thioamidation was only discovered when the ultrahigh-resolution structures were solved and examined, as the installation of a thioamide (+15.977 Da) can be easily miss-assigned as an oxidation event (+15.995 Da) in mass spectrometry-based analysis. MCR is an essential enzyme found strictly in methanogenic and methanotrophic archaea which catalyzes a reversible reaction involved in the production and consumption of the potent greenhouse gas methane (Ermler et al., 1997; Scheller et al., 2010). McrA contains several unusual post-translational modifications (Kahnt et al., 2007; Wagner et al., 2016; Nayak et al., 2020), including the thioglycine that has been observed in all characterized MCRs (Kahnt et al., 2007) (Figure 2). Genetic deletion, functional expression, and mass spectrometry showed that the tfuA and ycaO genes of Methanosarcina acetivorans are necessary and sufficient for thioglycine formation at McrA-Gly465 (Nayak et al., 2017). Due to proximity to the MCR active site, the thioglycine has been postulated to stabilize the active site structure, consistent with a considerable growth defect observed in M. acetivorans mutants lacking the thioamide. Notably, while ycaO is ubiquitous in all sequenced methanogens, ~10% of them lack a tfuA, including those with a characterized MCR that contains the thioglycine. This observation suggests that some YcaO homologs might be able to install thioamides in a TfuA-independent manner.
Figure 2:
View of the MCR active site with the thioglycine involved in several stabilizing interactions using the crystal structure of Methanosarcina barkeri (Protein Data Bank entry 1E6Y). Adapted from Nayak et al., 2017.
The in vivo evidence connecting thioamides to YcaO and TfuA in both thioamitides and MCR prompted an in vitro study using recombinant proteins and McrA-derived peptides (Mahanta et al., 2018). Specifically, thioglycine formation was reconstituted at the position corresponding to the natural site of thioamidation on McrA-derived peptides. Heterologously expressed and purified YcaO and TfuA proteins from M. acetivorans or YcaOs from TfuA-independent methanogens (Methanopyrus kandleri and Methanocaldococcus jannaschii) were used for the reconstitution. Thioamidation reactions require an external sulfide source and proceed via backbone O-phosphorylation, analogous to the azoline-forming YcaO proteins (Figure 3). The kinetic parameters were also determined using a TfuA-independent YcaO (M. jannaschii YcaO, hereafter, MjYcaO) for ATP and the peptide substrate. Further, the basis for regioselectivity and substrate recognition of thioamide formation was evaluated using extensive mutational, biochemical, and binding studies, allowing for the assignment of critical residues.
Figure 3:

Comparison of reactions catalyzed by YcaO enzymes. (Top panel) Well characterized azoline-forming YcaO proteins catalyze the ATP dependent cyclodehydration of Cys, Ser, and Thr residues. Shown is the conversion of peptidic Cys to thiazoline, which proceeds via an O-phosphorylated hemiorthoamide intermediate. (Bottom panel) A similar mechanism for the thioamide forming YcaOs, which utilize an external source of sulfide (such as Na2S), as opposed to an adjacent cysteine, as the nucleophile. Adapted from Mahanta et al., 2018.
In a follow-up study, the structure of MjYcaO bound to its peptide substrate (derived from the native MCR sequence) in the active site was reported (Dong et al., 2019). In the light of the structural information, several residues were identified to be involved in substrate binding or catalysis, which were further examined via site-directed mutagenesis and various biochemical and biophysical assays. Kinetic and ATP-derived product analyses were also conducted to gain mechanistic insight. Additionally, two methanogenic thioamide-forming YcaOs were shown to perform the cyclodehydration on a slightly altered peptide substrate, which contains a Cys residue C-terminal to the natural site of thioamidation. This observation underscores the mechanistic conservation across the YcaO family and allows for the extrapolation of mechanistic details to azoline-forming YcaOs involved in RiPP biosynthesis (Figure 3).
Herein, we describe the methods for the enzymological studies conducted in Mahanta et al. (2018) and Dong et al. (2019), including the preparation of recombinant proteins, peptide thioamidation reaction reconstitution, and detailed reaction analysis from various standpoints. With the recent discovery of several peptide-based thioamide containing natural products, we anticipate that this chapter will be useful to the scientific community associated with this area in designing their experimental studies.
2. Cloning, expression and purification of the enzymes and peptides
Successful heterologous expression and purification of the enzymes are critical for in vitro reconstitution and biochemical studies. The E. coli BL21-CodonPlus (DE3)-RIPL strain (Agilent) was utilized for protein overproduction. The RIPL strain contains extra copies of argU, ileY, proL, and leuW tRNA genes, which could aid the expression of archaeal proteins used in our studies. While most TfuA homologs tested were readily expressed and purified as N-terminally hexa His-tagged proteins, full-length YcaO homologs and McrA-derived peptides generally could not be obtained as His-tagged polypeptides. Therefore, a pET28b vector (kanamycin-resistant) containing an N-terminal maltose-binding protein (MBP) tag was employed. Among the YcaO homologs expressed and purified through this strategy, YcaOs presumptively responsible for MCR modification demonstrated superior solubility and stability, which are therefore the focus of this chapter. Notably, even among the methanogenic YcaO homologs successfully expressed and purified, some form precipitates upon removal of the N-terminal MBP tag (Table 1). This section highlights the detailed expression and purification protocols for the proteins responsible for peptide backbone thioamidation as well as the peptide substrates.
Table 1:
Summary of YcaO homolog purification outcomes and relative stability.
| Protein | Organism | Accession number | MBP-protein quality | protein stability# |
|---|---|---|---|---|
| YcaO | Methanosarcina acetivorans | WP_011020223 | full-length | precipitate |
| YcaO | Methanothermobacter sp. CaT2 | WP_048175616 | full-length | precipitate (phosphate buffer); stable (Tris or HEPES buffer) |
| YcaO | Methanocaldococcus jannaschii | WP_010870606 | full-length | stable |
| YcaO | Methanopyrus kandleri | AAM01332 | full-length | stable |
| TfuA | Methanosarcina acetivorans | WP_011020222 | full-length | stable |
| McrA | Methanosarcina acetivorans | WP_011024419 | truncated | - |
| TfuA | Methanothermobacter sp. CaT2 | WP_048175617 | full-length | stable |
| YcaO | Azospirillum sp. 510 | BAI72909 | full-length | precipitate |
| TfuA | Azospirillum sp. 510 | BAI72908 | full-length | stable |
protein stability was assessed based on whether precipitates were formed upon removal of the MBP tag using the TEV protease. This experiment is generally done in the synthetase buffer (pH=7.5), with K2HPO4, tris(hydroxymethyl)aminomethane (Tris), or 2-[4-(2-hydroxyethyl)piperazin-1-yl]ethanesulfonic acid (HEPES) as the buffering reagent. A clear solution of the protein after TEV cleavage was considered to be stable which was also further verified by SDS-PAGE analysis.
Materials, Reagents and Equipment
Equipment
Eppendorf Centrifuge 5424 (Eppendorf, DE)
Sorvall RC6 Plus floor centrifuge, Rotor SS-34 (Thermo Scientific)
Ultrasonic cell disruptor (Microson, NY)
New Brunswick Excella E25R Shaker (Eppendorf, DE)
Materials
EconoSpin All-In-One Silica Membrane Mini Spin Column (Epoch Life Science, TX, Cat. No. 1910–250 and 1920–250)
Amylose resin (New England BioLabs, MA, Cat. No. E8021S)
1.5 × 20 cm CrystalCruz Chromatography Column (Santa Cruz Biotechnology, CA, Cat. No. sc-205557)
Amicon Ultra centrifugal filter (EMD Millipore, Cat. No. UFC9030)
Reagents and buffers
Synthetic DNA in pUC57 plasmid for Mj and M. kandleri YcaO (GenScript, NJ)
Q5 DNA polymerase (New England BioLabs, MA, Cat. No. M0491S)
Restriction enzymes (New England BioLabs, MA)
T4 DNA ligase (New England BioLabs, MA, Cat. No. M0202S)
Protease inhibitor cocktail (1 × solution contains 2 μM leupeptin, 2 μM benzamidine HCl, 2 μM E64, and 30 mM phenylmethylsulfonyl fluoride; 100 × or 50 × solution is generally prepared and stored at −80 °C until needed)
Luria-Bertani (LB) medium (1 L medium contains 10 g tryptone, 10 g NaCl, 5 g yeast extract, 15 g agar is supplemented for solid format cultivation)
Phosphate-buffered saline (PBS): 137 mM NaCl, 2.7 mM KCl, 10 mM Na2HPO4, and 1.8 mM KH2PO4
Lysis buffer: 50 mM tris(hydroxymethyl)aminomethane-HCl (Tris-HCl) pH 7.5, 500 mM NaCl, 2.5% glycerol (v/v), and 0.1% Triton X-100 (v/v)
Wash buffer: 50 mM Tris-HCl pH 7.5, 500 mM NaCl, 2.5% glycerol (v/v), and 0.5 mM tris-(2-carboxyethyl)-phosphine (TCEP)
Elution buffer: 50 mM Tris-HCl pH 7.5, 150 mM NaCl, 2.5% glycerol (v/v), 10 mM maltose, and 0.5 mM TCEP
Storage buffer: 50 mM HEPES pH 7.5, 300 mM NaCl, 2.5% glycerol (v/v), and 0.5 mM TCEP
-
Bovine serum albumin (BSA) standard (Thermo Fisher Scientific, Cat. No. 23209)
Note: Additional reagents used for molecular biology experiments were purchased from New England Biolabs (Ipswich, MA), Thermo Fisher Scientific (Waltham, MA) or Gold Biotechnology Inc. (St. Louis, MO). Common chemicals were purchased from Sigma-Aldrich (St. Louis, MO) unless stated otherwise. Oligonucleotides were purchased from Integrated DNA Technologies (Coralville, IA).
2.1. General cloning strategy
E. coli strain DH5α was used for plasmid maintenance. Genes of interest were obtained through PCR amplification that introduced appropriate restriction sites through the amplification primers. The resulting PCR products and vectors were digested, purified, and ligated following conventional recombinant procedures using T4 DNA ligase. Genes from M. acetivorans (ycaO, tfuA, iscS, and mcrA; accession IDs are given in Table 1) were PCR amplified directly from the cell lysate and cloned into the aforementioned pET28-MBP vectors. Genes of M. kandleri (hereafter, Mk) and M. jannaschii YcaOs were optimized for expression in E. coli, synthesized by GenScript, and sub-cloned into pET28-MBP vectors. The resulting constructs were confirmed through Sanger sequencing using vector-derived primers at the sequencing center of University of Illinois, Urbana-Champaign.
2.2. Expression protocol for proteins/peptides
Timing: 2–3 d
Transform the pET28-MBP plasmid encoding the proteins of interest into E. coli BL21-CodonPlus (DE3)-RIPL strain using standard chemical competent cell transformation procedures.
Grow the cells for 12–16 h on LB agar plates containing 50 μg/mL kanamycin at 37 °C.
Pick a freshly transformed single colony to inoculate 10 mL of LB as the starter culture, containing 50 μg/mL kanamycin and 34 μg/mL chloramphenicol (for maintaining the pACYC-based plasmid containing extra copies of the argU and proL tRNA genes).
Incubate the starter culture at 37 °C with vigorous shaking (New Brunswick shaker, 200 rpm) for 16–18 h.
Inoculate 1 L of sterile LB medium containing 50 μg/mL kanamycin and 34 μg/mL chloramphenicol with 10 mL of starter culture.
Grow at 37 °C with vigorous shaking to an optical density at 600 nm (OD600) of 0.6–0.8 then placed on ice for 15 min (for substrate peptides, grow until an OD600 of 1.0).
Induce protein expression with the addition of 500 μM isopropyl β-D-1-thiogalactopyranoside (IPTG) (for substrate peptides, use 1 mM IPTG).
Incubate the culture for 12–16 h at 15 °C with shaking at 180 rpm (for substrate peptides, shake for 1.5–2 h at 18 °C to avoid nonspecific proteolytic cleavage).
Harvest the cells by centrifugation at 3,000 × g for 20 min, resuspend the cell pellet in pre-chilled PBS, and harvest again by centrifugation at 4,000 × g for 30 min. Discard the supernatant.
Flash-freeze the cell pellets and store at −80 °C until use.
2.3. Purification protocol for proteins/peptides
Timing: 5–10 h
Resuspend the cell pellets in lysis buffer containing 4 mg/mL lysozyme and 1 × protease inhibitor cocktail on ice bath.
Vortex mildly with tapping the tube until cells get resuspend in the buffer solution.
Lyse the cells by using an ultrasonic cell disruptor for 40 s with an output power of ~12 W. Repeat 3–4 times with 10 min periods with gentle rocking at 4 °C.
Remove the insoluble cell debris via centrifugation at 20,000 × g for 1 h at 4 °C.
Load the supernatant to a pre-equilibrated amylose resin column (10 mL of resin per L of original cell culture).
Wash the column with 20 mL of lysis buffer supplemented with 0.5 mM TCEP followed by 40 mL of wash buffer.
Elute the MBP-tagged proteins/peptides using 30 mL elution buffer.
Concentrate the eluent using a 30 kDa molecular weight cut-off (MWCO) Amicon Ultra centrifugal filter.
Perform a buffer exchange with 10 × volume of protein storage buffer prior to final concentration and storage.
Determine the concentrations of proteins/peptides using both 280 nm absorbance (theoretical extinction coefficients were calculated using the ExPASy ProtParam tool; http://web.expasy.org/protparam/) and a Bradford colorimetric assay using bovine serum albumin (BSA) as a standard. In addition, use Bicinchoninic Acid (BCA) protein assay to confirm the quantitative protein measurements (Stoscheck, 1990). Assess the purity of the protein/peptide by Coomassie-stained SDS-PAGE analysis by comparing with a standard protein marker. Typical SDS-PAGE gels of the proteins and peptides are provided in the previous publications (Mahanta et al., 2018; Dong et al., 2019).
3. Enzyme activity assays and mass spectrometric analysis
The purified MBP-tagged YcaO (and TfuA for TfuA-dependent YcaOs) can be directly used in peptide thioamidation reactions in the presence of ATP and Li2S or Na2S as the sulfur donor. The resulting thioamidated peptides can be readily detected through various mass spectrometry (MS)-based assays. Here we describe the general conditions used to reconstitute peptide thioamidation on McrA-derived peptides as well as two MS methods: matrix-assisted laser desorption/ionization time-of flight (MALDI-TOF) MS to rapidly detect the thioamide and electron-spray ionization (ESI)-based high resolution (HR) and tandem MS (MS/MS) to confirm and locate the site of thioamide modification.
Materials, Reagents and Equipment
Equipment
Eppendorf Centrifuge 5424 (Eppendorf, DE)
Bruker UltrafleXtreme Mass Spectrometer (Bruker Daltonics)
Speedvac concentrator (ThermoFisher)
TriVersa Nanomate 100 S (Advion)
Orbitrap Fusion ESI-MS (Thermo Fisher Scientific)
Materials
C18 ZipTip pipette tips (MilliporeSigma, Cat. No. Z720070)
Reagents
Tobacco Etch Virus (TEV) protease (prepared in-house through affinity purification and stored in −80 °C)
Synthetase buffer: 50 mM Tris-HCl pH 7.5, 125 mM NaCl, 20 mM MgCl2, 5 mM DTT, 5 mM ATP
High performance liquid chromatography (HPLC) grade acetonitrile (Millipore Sigma, Cat. No. 34851)
ZipTip solutions: solution A (HPLC grade acetonitrile), solution B (50% HPLC acetonitrile, 0.1% formic acid, v/v), and solution C (0.1% formic acid, v/v)
ProteoMass Peptide MALDI-MS Calibration kit (Millipore Sigma, Cat. No. MSCAL1–1KT)
-
Pierce LTQ Velos ESI Positive Ion Calibration Solution (ThermoFisher, Cat. No. 88323).
Note: When preparing the buffers that contain ATP, add ATP before adjusting the pH.
3.1. In vitro thioamidation of peptides
Timing: 4–5 h
Digest peptide substrate (100 μM), MBP-YcaO (2 μM) and MBP-TfuA (2 μM)) with TEV protease (1:10, molar ratio) in synthetase buffer for 30 min at 25 °C. (This step can be omitted or conducted after thioamide installation without severely compromising the reactivity, which is recommended if using a YcaO homolog that is unstable upon removal of the MBP tag)
Initiate reactions with the addition of Na2S (2 mM) or an enzymatic sulfide source (10 μM IscS (cysteine desulfurase), 2 mM cysteine, 2 mM pyridoxal phosphate (PLP), and 5 mM DTT) in the synthetase buffer can be used for the generation of free sulfide in-situ (Urbina et al., 2001).
Let the reaction proceed at 25 °C for 3–4 h.
-
Desalt the reaction through the ZipTip process (described below). Alternatively, quench the reaction by removing the enzymes by adding 50% acetonitrile (HPLC grade). When acetonitrile was used to quench the reaction, centrifuge the resultant solution to remove the precipitated proteins (17,000 × g, 10 min, 25 °C).
Note: In vitro peptide thioamidation could be performed using several conditions. The procedure described above was used in published studies and led to full thioamidation in all the methanogenic systems tested (Mahanta et al., 2018; Dong et al., 2019).
3.2. MALDI-TOF-MS qualitative analysis of thioamidated products
Timing: 10–30 min
Condition C18 ZipTips with ZipTip solutions A, B, and C sequentially using a 10 μL micropipette. Avoid air bubbles in the process and follow the manufacturer’s instruction.
Load the thioamidation reactions from above onto the conditioned ZipTips, wash with water, and elute with 2 μL of 70% aq. acetonitrile saturated with sinapic acid (SA) and deposit onto a stainless-steel MALDI target plate. Formic acid should not be introduced in the wash or elution process to avoid acid-induced non-enzymatic thioamide hydrolysis (Kahnt et al., 2007). Steps 1–2 are not obligatory for MALDI-TOF analysis, which might lead to dominant sodium and potassium adduct peaks but does not compromise the spectrum quality otherwise.
Analyze samples by MALDI-TOF-MS using a Bruker UltrafleXtreme instrument in reflector positive mode. Our published MALDI-TOF analysis was conducted at the University of Illinois School of Chemical Sciences Mass Spectrometry Laboratory, and the instrument was calibrated using the MALDI calibration kit prior to data acquisition.
Analyze the data using the Bruker FlexAnalysis software. Reactions described above typically lead to fully thioamidated peptides, as demonstrated in Figure 4 (MALDI-TOF-MS spectra of thioamidated MCR peptides using TfuA-dependent M. acetivorans YcaO). Similar results were obtained for the TfuA-independent M. kandleri and M. jannaschii YcaOs (Figure 5) with their native McrA peptide substrates (Mahanta et al., 2018).
Figure 4:

MALDI-TOF-MS analysis of McrA 11-mer peptide thioamidation using M. acetivorans YcaO-TfuA. The McrA fragment was from M. acetivorans with the residue naturally thioamidated (Gly465) shown in red. (A) Mass spectrum of the unmodified peptide, m/z 1,428 Da. (B) Mass spectrum of the peptide after reaction with the full array of reactants. (C) Identical to B except an enzymatic sulfide source was used rather than a chemical donor (PLP, pyridoxal phosphate). (D) Identical to B but with omission of YcaO. (E) Omission of TfuA. (F) Omission of sodium sulfide. Analysis by high-resolution electrospray ionization mass spectrometry (HR-ESI-MS) and the requirement for an external sulfide source support thioamidation (formal replacement of oxygen by sulfur, +15.9772 Da, error ~0.3 ppm), as opposed to oxidation or hydroxylation (formal addition of oxygen, +15.9949 Da, error >12 ppm). Tandem HR-ESI-MS localized the site of thioamide installation to the position equivalent to Gly465, the native modification site in McrA. Adapted from Mahanta et al., 2018.
Figure 5:

MALDI-TOF-MS analysis of McrA 11-mer peptide thioamidation using M. jannaschii YcaO. The McrA fragment was from M. jannaschii with the residue naturally thioamidated (Gly447) shown in red. (A) Mass spectrum of the unmodified peptide, m/z 1,460 Da. (B) Mass spectrum of the peptide after reaction with the full array of reactants. (C) Identical to B but with the omission of YcaO. (D) Omission of ATP. (E) Omission of sodium sulfide (Na2S). Adapted from Mahanta et al., 2018.
3.3. ESI-HR MS/MS analysis of thioamidated products
Timing: 30–60 min
Desalt the supernatant from the above reactions using ZipTips as described above and elute with 30 μL of 75% aq. acetonitrile. (2–5 ZipTips can be used for one reaction and the eluent can be pooled to ensure that enough peptides are subjected to the MS analysis)
Dry the desalted samples (20–50 μL per sample) under reduced pressure using a speedvac concentrator at 30 °C or below.
Redissolve the dried reaction in 35% (v/v) aq. acetonitrile and 0.1% (v/v) formic acid directly prior to HR-MS analysis.
Infuse the samples using a TriVersa Nanomate 100 into a Thermo Fisher Scientific Orbitrap Fusion ESI-MS.
Prior to data acquisition, the mass spectrometer should be calibrated and tuned routinely. Our published analysis was calibrated on the Pierce LTQ Velos ESI Positive Ion Calibration Solution.
The following parameters can be used to obtain HR-MS and MS/MS data: resolution: 100,000; isolation width (MS/MS): 1 m/z; normalized collision energy (MS/MS): 35–70; activation q value (MS/MS): 0.4, activation time (MS/MS): 30 ms. Fragmentation can be performed using collision-induced dissociation (CID) at 35% or 70%. We note that fragmentation at the thioamide bond was observed under the CID conditions described here, as shown in an example ESI-HR MS/MS (Figure 6).
Analyze data using the Qualbrowser application of Xcalibur software (Thermo-Fisher Scientific). Data can be averaged across the time dimension prior to analysis.
Figure 6:

Thioamide localization by HR-ESI-MS/MS in the M. acetivorans YcaO-TfuA reaction. (A) HR-ESI MS/MS analysis of the thioamidated product from the M. acetivorans YcaO/TfuA reaction with McrA 11-mer (GG-460RLGFFGFDLQD470, m/z 1444 Da). The b7 and b8 ions localize the thioamide modification to Gly465 (yellow circle). (B) HR-ESI MS of the thioamidated product. The error reported is calculated from the thioamide-containing product with the following molecular formula for the doubly-protonated ion: C66H95N17O18S. Adapted from Mahanta et al., 2018.
4. Variants preparation and substrate scope analysis
The peptide substrate tolerance of three methanogenic YcaOs (M. acetivorans, M. jannaschii, and M. kandleri) were investigated through single-residue substitution of the McrA peptide substrate (460RLGFFGFDLQD470, bold letter indicates the site of natural thioamidation on MaMcrA) and subsequent MS and binding analysis. In addition, truncations of the McrA peptide were prepared by inserting stop codons and, upon purification, these peptides were tested to define the minimal substrate for the methanogenic YcaO proteins. Utilizing MALDI-TOF-MS, two reaction conditions were used to semi-quantitatively capture the differences among the substituted variants. Such analysis established that for MaYcaO, substitution of residues equivalent to McrA Gly465 and Asp467 abolished the activity, while positions equivalent to Leu461, Phe463, Leu468, and Gln469 were additionally shown to be important as their substitution diminished the thioamide installation. Moreover, only one residue could be trimmed (equivalent to Asp470) C-terminally for the substrate to be processed by the M. acetivorans proteins. Similarly, the minimal substrates and critical residues for Mj and Mk YcaOs were also established (Mahanta et al., 2018). These results are summarized in Figure 7, as this information can be important for future engineering efforts on the YcaO enzymes. The mutagenesis process (Quik Change method, Agilent) and MS-based reactivity analysis are described in this section.
Figure 7: Substrate scope analysis of the YcaOs.

(A) Fluorescence polarization (FP) binding curve of MaYcaO with the FITC-labeled MaMcrA 11-mer. Error bars represent SD of the mean (n = 3). (B) Summary of the binding constants obtained by competitive FP using Ala-substituted variants of the 11-mer using MaYcaO. Errors on KD and Ki are the SEM calculated during regression analysis. (C) Summary of the substrate tolerance of the Ala-substituted variants of the 11-mer using reactivity-based analysis. Important recognition residues for MaYcaO-TfuA, MkYcaO and MjYcaO were determined from the results of MALDI-TOF-MS assays. Circles indicate the sites of Ala substitution in the MaMcrA 11-mer peptide (thioamidated Gly is shown in red), and the filled circles indicate the variants that inhibited processing in each case. Adapted from Mahanta et al., 2018.
Materials, Reagents and Equipment
Equipment
Eppendorf Centrifuge 5424 (Eppendorf, DE)
Bruker UltrafleXtreme Mass Spectrometer (Bruker Daltonics)
Materials
C18 ZipTip pipette tips (MilliporeSigma, Cat. No. Z720070)
Reagents
Q5 DNA polymerase (New England BioLabs, MA, Cat. No. M0491S)
DpnI restriction enzyme (New England BioLabs, MA, Cat. No. R0176S)
pET28b-MBP-McrA peptide (Constructed as described above)
TEV protease (prepared in-house through affinity purification and stored in −80 °C)
Synthetase buffer: 50 mM Tris-HCl pH 7.5, 125 mM NaCl, 20 mM MgCl2, 5 mM DTT, 5 mM ATP
HPLC grade acetonitrile (Millipore Sigma, Cat. No. 34851–100ML)
ZipTip solutions: solution A (HPLC grade acetonitrile), solution B (50% HPLC acetonitrile, 0.1% formic acid, v/v), and solution C (0.1% formic acid, v/v)
ProteoMass Peptide MALDI-MS Calibration kit (Millipore Sigma, Cat. No. MSCAL1–1KT)
4.1. General site-directed mutagenesis
Timing: 2–3 d
PCR amplify the entire pET28b-MBP-McrA peptide construct using Q5 DNA polymerase and primers that contain the desired mutations. The PCR cycle is shown in Table 2.
Digest the resulting PCR product with 1 μL DpnI restriction enzyme for 3–5 h at 37 °C.
Transform the digested product directly into E. coli DH5α cells and plate them onto LB plates containing 50 μg/mL kanamycin.
After overnight growth (12–16 h), pick 1–3 single colonies to inoculate 10 mL LB media containing 50 μg/mL kanamycin. Grow the 10 mL culture at 37 °C with shaking for 12–16 h.
Harvest the resulting culture via centrifugation (4,000 × g, 10 min, 25 °C) for plasmid isolation. Verify the mutations by sequencing the plasmids.
Use the plasmids containing the desired mutation for peptide expression and purification as described in section 2.
After peptide purification, examine and quantify them as described in section 2.
Subject the intact purified peptides to thioamidation reaction using two conditions: the condition described in section 3.1 (condition A), and the following condition (condition B).
Table 2:
PCR amplification protocol used for site-directed mutagenesis.
| Step | Temperature (°C) | Duration (min:sec) |
|---|---|---|
| 1 | 98 | 10:00 |
| 2 | 98 | 0:30 |
| 3 | 60 | 0:30 |
| 4 | 72 | 16:00 |
| 5 | repeat from step 2–4 for 10 times | |
| 6 | 98 | 0:30 |
| 7 | 60 | 0:30 |
| 8 | 72 | 16:00 (+15 sec/cycle) |
| 9 | repeat from step 6–8 for 20 times | |
| 10 | 72 | 30:00 |
| 11 | 12 | forever |
Note that the annealing temperature is generally set to 60 °C but should be optimized on a case-by-case basis if the PCR fails.
4.2. Reaction conditions for thioamidation
Timing: 17h
Digest the peptide substrate (100 μM, wild-type and the variants), MBP-YcaO (40 μM) (and MBP-TfuA (40 μM)) with TEV protease (1:10 molar ratio) in synthetase buffer for 30 min at 25 °C. (This step should be omitted for YcaOs that are unstable upon removal of the MBP tag, such as MaYcaO)
Initiate reactions with the addition of Na2S (2 mM) and allow the reactions to proceed at 25 °C for 16 h.
-
Desalt the reactions through ZipTip process as described above.
Notes:
Condition B is described above.
The same batch of enzymes should be used to set up reactions simultaneously to test all the variants.
4.3. MALDI-TOF-MS qualitative analysis of thioamidated products
Timing: 4–6 h
Examine the reactions described above by MALDI-TOF-MS and compared with the wild-type substrate experiment.
Under condition A, if a substrate is fully processed like the wild-type substrate, a “++” (wild-type-like) reactivity will be assigned.
For substrate variants that are not fully processed under condition A, their spectra under condition B are further examined. If a substrate is not thioamidated under condition B, “-” (no reactivity) will be assigned. If a substrate is thioamidated under condition B (regardless of the peak height) but not condition A, “+” (reduced reactivity) should be assigned.
Based on the comparative MS analysis, the importance of residues on the McrA peptide can be determined. This information is provided for Ma, Mk and MjYcaOs in the previous publication (Mahanta et al., 2018) and is summarized in Figure 7.
5. Fluorescence polarization binding studies
To investigate the interactions between McrA peptide and the proteinaceous components, we utilized fluorescence polarization (FP)-based experiments to assess the complex formed on the fluorescently tagged McrA peptide (GG-RLGFFGFDLQD and GG-RLGFYGYDLQD, bold letter indicates the site of thioamidation and the N-terminal Gly-Gly is a spacer). This assay in combination with mutagenesis on the YcaO protein revealed the substrate binding pocket, which agrees with a co-crystal structure of MjYcaO (6PEU) and the McrA peptide (RLGFYGYDLQD) (Dong et al., 2019).
Additionally, competitive FP experiments were employed through titrations of MBP-tagged McrA peptide variants, which assisted in the identification of the peptide residues important for YcaO-interactions. We found that while the wild-type MBP-tagged McrA peptide efficiently competed with the fluorescein-labeled peptide (Ki ~ 0.7 μM), other variants were severely reduced in their ability to compete (Mahanta et al., 2018). For instance, Ala substitution of the position equivalent to Leu461 reduced affinity to YcaO by 28-fold. Additional reductions were observed as follows: Gly462 (14-fold), Phe463 (>30-fold), Phe464 (11-fold), Gly465 (14-fold), Asp467 (12-fold), Leu468 (14-fold), and Gln469 (24-fold) (Figure 7B). These binding data align well with the substrate reactivity determined by MALDI-TOF-MS analysis in section 4.3. In this section, we describe the labeling of McrA peptides with fluorescein isothiocyanate (FITC), their subsequent purification, and detailed protocols for the FP and competitive FP assays.
Materials, Reagents and Equipment
Equipment
Eppendorf Centrifuge 5424 (Eppendorf, DE)
Bruker UltrafleXtreme Mass Spectrometer (Bruker Daltonics)
CombiFlash Rf 200 (TeleDyne Isco)
Flexar HPLC system (PerkinElmer)
Synergy H4 Hybrid plate reader (BioTek)
Multichannel pipette, 0.5–10 μL and 20–200 μL (Eppendorf, DE)
Rotary evaporator R-100 (BUCHI)
Materials
CombiFlash C18 column (RediSep Rf 4.3 g)
Betasil C18 column (250 × 4.6 mm; Thermo Scientific, Cat. No. 70103–104630)
384-black-well polystyrene microplates (Corning)
96-well microplates (Corning)
Reagents
McrA synthetic 13-mer peptide (GG-RLGFFGFDLQD and GG-RLGFYGYDLQD, GenScript)
Fluorescein isothiocyanate (Sigma-Aldrich, Cat. No. 1245460250)
NaHCO3 (100 mM) and Na2CO3 (100 mM) solutions, prepared fresh
HPLC grade acetonitrile (MilliporeSigma, Cat. No. 34851)
HPLC grade methanol (MilliporeSigma, Cat. No. 34860)
Binding buffer: 50 mM HEPES (pH 7.5), 300 mM NaCl, 2.5% (v/v) glycerol
5.1. FITC labeling and purification of McrA peptides
Timing: 24–36 h
Dissolve the synthetic Ma and Mj McrA peptides in dimethyl sulfoxide (DMSO) at 10 mg/mL. McrA peptides with an N-terminal Gly-Gly tag (GG-RLGFFGFDLQD and GG-RLGFYGYDLQD) were used, as a linker may reduce the interference from the fluorescein.
Dissolve FITC in 10% DMSO at 6 mg/mL and pH the resulting solution with NaHCO3 and Na2CO3 solutions to pH 9.5.
Mix 300 μL FITC solution and 100 μL dissolved peptide to initiate the N-terminus labeling reaction. Let the reaction proceed in the dark overnight (14–16 h) at 25 °C or room temperature.
Add NH4Cl to a final concentration of 50 mM to quench the reaction. Let proceed in the dark for 1 h.
Examine the reaction by MALDI-TOF-MS as described in previous sections. A typical reaction following this procedure yields large amount of labeled peptide (Figure 8).
Subject the labeled peptides to a CombiFlash purification step using a reverse-phase C18 column (RediSep Rf 4.3 g) with a gradient of 5–90% methanol (10 mM NH4HCO3 was used as the aqueous mobile phase).
Examine the fractions by MALDI-TOF-MS. Pool those containing the fluorescein-13-mer and concentrate them via rotary evaporation.
Redissolve the resultant solid in 5% methanol and remove any insoluble components through filtration (0.22 μm filters should be used).
Inject the filtered solution onto a Betasil C18 column (250 × 4.6 mm) connected to the HPLC system with the absorbance at 280 nm monitored.
Use a gradient of 20–98% methanol (solvent A: 100 mM aq. NH4HCO3; solvent B: methanol) at 1 mL/min (Figure 8). The labeled peptide has a retention time of 24.6 min and a typical chromatogram is shown in Figure 8.
Examine the purified FITC-labeled peptides by MALDI-TOF-MS (Figure 8). Collect the corresponding peak and concentrate using a rotary evaporator.
Re-dissolve the dried material in the binding buffer to make a stock concentration of 250 nM for the binding assay. The concentration of labeled peptide can be determined based on its absorbance at 495 nm and the extinction co-efficient of FITC (73,000 cm−1M−1).
Figure 8: MS and HPLC analysis of the FITC-labeled McrA peptide.

(A) MALDI-TOF mass spectrum of the crude FITC labeling reaction. The unlabeled MjMcrA peptide (1461 Da) and FITC-labeled product (1850 Da) are indicated. (B) HPLC purification method. (C) A typical chromatogram of the FITC labeling reaction after CombiFlash purification step. The product peak is collected (retention time: 24.6 min).
5.2. Fluorescence polarization (FP)-binding assay
Timing: 2–4 h
Dilute the binding partner of interest in binding by two folds for 11 times, starting from 110 mM (in 96-well plates). MBP-tagged M. acetivorans or M. jannaschii YcaO proteins, and M. acetivorans TfuA were examined in our reported studies (Mahanta et al., 2018; Dong et al., 2019).
Mix the serially-diluted protein (30 μL) with 250 nM fluorescein-labeled McrA peptides (3 μL) in the non-binding-surface, 384-black-well microplates. Let equilibrate for 1 h with shaking at 25 °C. Three experiments should be set up for every binding partner concentration.
Acquire the fluorescence polarization data with a plate reader equipped with polarization optics (λex = 485 nm; λem = 538 nm). In our studies, the data were acquired with a Synergy H4 Hybrid plate reader and using SoftMax Pro Gen5 software.
- Process the data by background subtraction and calculation using the following equation (Moerke, 2009): (P is the polarization value; I║ stands for the fluorescence intensity in the horizontal direction while I┴ stands for the fluorescence intensity in the vertical direction; G accounts for differential sensitivity)
-
Fit the resulting data into a nonlinear dose response curve using OriginPro9.1 (OriginLab) to estimate the dissociation constants (KD). An example binding curve measured with MaYcaO is shown in Figure 7A.
Notes:
We observed binding of the native McrA peptide to MaYcaO (KD ~0.7 μM, Figure 7A); binding to TfuA was not detected. The KD between the native McrA peptide and MjYcaO was estimated to be 1.1 μM (Mahanta et al., 2018).
For MaYcaO, 10 mM ATP and 20 mM MgCl2 were added to the binding buffer, as the binding between MaYcaO and its native McrA peptide was only observed in the presence of ATP. This phenomenon can be rationalized by active site conformation changes upon ATP binding.
5.3. Competitive FP assay
Timing: 2–4 h
Competitive FP can be employed to assess the binding of the substituted McrA peptide variants towards YcaO.
Dilute MBP-tagged McrA peptide variants individually in binding buffer by two folds for 11 times, starting from 220 mM (in 96-well plates).
Mix the serially diluted MBP- McrA peptide (15 μL) with MBP-YcaO (6.6 μM, 15 μL) and 250 nM fluorescein-labeled McrA peptides (3 μL) in the non-binding-surface, 384-black-well microplates (carried out in triplicate). Let the mixture equilibrate for 1 h with shaking at 25 °C. Three experiments should be set up for every concentration.
Acquire and process the data as described in section 5.2, with the IC50 value being estimated for each McrA peptide variant through non-linear regression analysis.
- The inhibitor constant Ki can be calculated based on IC50 using the following equation (Dunbar et al., 2015): (L50 is the fluorescently-labelled peptide concentration (25 nM); PO is the protein concentration (3 μM))
6. ATP utilization analysis and mechanistic studies
Azoline-forming YcaOs normally utilize ATP to activate the peptide backbone via formation of a phosphorylated hemiorthoamide intermediate (Figure 3). To investigate the ATP utilization of the thioamide forming YcaOs, 31P NMR was utilized to analyze the products derived from ATP. From this analysis, ADP and phosphate (Pi) were found to be the by-products from YcaO-catalyzed thioamidation reactions (Figure 9). To determine whether the Pi oxygen was derived from the bulk solvent or amide oxygen, thioamidation assay was performed in [18O]-H2O and subsequently examined using 31P NMR. The formation of [16O4] Pi was detected, the identity of which was confirmed by spiking with authentic [16O4] Pi. Thus, bulk solvent was not responsible for ATP hydrolysis but rather the backbone amide oxygen. Based on these studies, a mechanism for YcaO installing thioamides was proposed (Figure 3). Upon peptide substrate binding, sulfide ion will attack the target amide bond (here Gly465), forming a tetrahedral intermediate. The amide oxyanion will then attack the γ-phosphate of ATP, releasing ADP and generating a phosphorylated thiolate intermediate which is potentially a thermodynamically favorable step as the C-S bond formation is linked to ATP hydrolysis. This pathway could be step wise or concerted. Finally, the tetrahedral intermediate will resolve to form the thioamide and release Pi. Additionally, the formation of an azoline was achieved using the MjYcaO and a McrA peptide variant where the residue C-terminal of the Gly to be modified was changed to Cys (hereafter, McrA-Y(+1)C peptide) (Dong et al., 2019). The conversion of ATP to ADP in the MjYcaO-catalyzed cyclodehydration was also confirmed through an HPLC-based assay (Figure 10), further supporting the phosphorylation mechanism shared by the YcaO superfamily. Here we describe the detailed protocols for the 31P NMR and HPLC experiments performed on the thioamidation reactions.
Figure 9: 31P NMR analysis of the thioamidation reaction catalyzed by YcaO.

(A) 31P NMR spectrum of the thioamidation reaction of MjYcaO showing the formation of ADP and phosphate (Pi) from ATP (B) Reaction performed in [18O]-water. The identity of the major product, [16O4]-Pi which appeared at 1.82 ppm (top spectrum), was confirmed by spiking with an authentic sample of [16O4]-Pi (bottom spectrum). Adapted from Mahanta et al., 2018.
Figure 10: Chromatograms of ATP product analysis.

The HPLC traces of ATP, ADP, and AMP standards, as well as the MjYcaO reactions with MjMCR peptide (thioamide formation) and MjMcrA-Y(+1)C peptide (thiazole formation), are stacked. Adapted from Dong et al., 2019.
Materials, Reagents and Equipment
Equipment
Eppendorf Centrifuge 5424 (Eppendorf, DE)
600 MHz NMR (Agilent) with the 15N-31P 5 mm PFG OneNMR Probe
FreeZone 40C Complete Freeze Dryer (Labconco)
Speedvac concentrator (ThermoFisher)
Flexar HPLC system (PerkinElmer) or equivalent
Materials
5-mm NMR tube (Fisher Scientific)
C18 column (Grace/Alltech, 4.6 × 250 cm, 100 Å pore size, 5 μm particle size)
Reagents
Low-salt synthetase buffer: 50 mM Tris pH 8.5, 25 mM NaCl, 5 mM MgCl2, 5 mM dithiothreitol, 1 mM Na2S, and 2 mM ATP
98 atom % [18O]-H2O (Cambridge Isotope Laboratories)
Synthetase buffer: 50 mM Tris-HCl pH 7.5, 125 mM NaCl, 20 mM MgCl2, 5 mM DTT, 5 mM ATP
6.1. Isotope-labelling analysis using 31P NMR
Timing: 1 d
Lyophilize the samples containing the peptide substrate (100 μM) in low-salt synthetase buffer (50 mM Tris pH 8.5, 25 mM NaCl, 5 mM MgCl2, 5 mM dithiothreitol, 1 mM Na2S, and 2 mM ATP) and MjYcaO (10 μM) separately using a freeze dryer for 16 h.
Reconstitute the resulting solid in 500 μL of 98 atom % [18O]-H2O and allow the mixture to react at 23 °C for 6 h. (Step 1–2 should only be included for the detection of bulk solvent incorporation ([18O]-H2O)).
Quench the reactions with 5 μL of 500 mM EDTA (pH 8.0).
Add D2O (50 μL, 10% of the final volume) to the sample and transfer to a standard 5-mm NMR tube.
Acquire the 31P NMR spectrum on a 600- MHz Agilent NMR or equivalent. Our reported analysis was conducted at the Carle R. Woese Institute for Genomic Biology, University of Illinois with a 5- mm Agilent AutoTuneX probe, 512 transients, 32,768 points, and a spectral window of −50 to 50 ppm.
Process and analyze the NMR data using Mnova software (Mestrelab Research). Typical spectra for the product analysis are shown in Figure 9 (panel B is the result for experiments performed in [18O]-H2O).
6.2. HPLC analysis of ATP-derived products
Timing: 4–5 h
Set up the MjYcaO thioamidation reactions with 10 μM MBP-YcaO protein, 100 μM McrA peptide, and 2 mM Na2S in the synthetase buffer (final volume is 100 μL). Set up the MjYcaO cyclodehydration reactions using the same conditions but the McrA-Y(+1)C peptide and in the absence of Na2S.
Allow the reactions to proceed at 37 °C for 2 h (similar results were observed if reactions were allowed to proceed at 25 °C for 3–4 h).
Quench the reactions by adding one equivalent volume of acetonitrile with 0.1% formic acid. Remove the precipitate by centrifugation (17,000 × g, 10 min, 25 °C).
A small portion of the reactions (1–2 μL) can be directly examined by MALDI-TOF-MS as described above to confirm reaction completion. (ZipTip step can be omitted)
Dry the supernatant under vacuum using a Speedvac concentrator and re-dissolve the material in 100 μL water for HPLC analysis.
Inject the resulting solution to a C18 column (4.6 × 250 cm) for High Performance Liquid Chromatography (HPLC) analysis (absorbance at 260 nm should be monitored), with the mobile phase containing 5% (v/v) acetonitrile and 20 mM ammonium acetate (pH 5.0, final concentrations). The run is isocratic and at 1 mL min−1.
Analyze the ATP, ADP, and AMP standards (20 μM, injection volume: 120 μL) via the same method and compared to the reactions using their retention times (Figure 10). The standards should be analyzed on the same day as the samples, and ideally before and after the sample runs, to ensure the comparability of the retention times.
7. Kinetic analysis
Kinetic analysis was conducted on thioamidation reaction catalyzed by the MjYcaO using the native McrA 13-mer peptide (GG-RLGFYGFYLQD) as the substrate and ATP via the purine nucleoside phosphorylase (PNP)-coupled assay and HPLC-based analysis.
The PNP-coupled kinetics assay utilizes the formation of 2-amino-6-mercapto-7-methylpurine (strong absorbance at 360 nm; extinction coefficient: 11,000 M−1 cm−1) and ribose-1-phosphate from 2-amino-6-mercapto-7-methylpurine ribonucleoside (MESG) and Pi by PNP (Webb, 1992). As our previous investigation has revealed that YcaO hydrolyzes ATP to form ADP and Pi, the PNP-coupled assay was used to monitor Pi formation continuously in a one-pot reaction (Mahanta et al., 2018). From this method, the kinetic parameters (after three replicates) were found as follows: kcat = 0.89 ± 0.04 s−1; KM, peptide = 83 ± 8 μM; and kcat/KM = 1.07 × 10⁴ M−1s−1. The ATP KM was found out to be 117 ± 11 μM.
An HPLC method was also developed to separate unmodified and thioamidated McrA peptides (GG-RLGFYGFYLQD), which allowed for quantification of the thioamide product (Dong et al., 2019). By quenching the reactions within the linear phase and quantifying the thioamide product, we assessed the kinetic behavior of the MjYcaO. While this method allows for the direct quantification of the reaction product, its discontinuous nature renders the method laborious. From this method, the kinetic parameters were found as follows: kcat = 5.3 × 10⁻² s−1; KM, peptide = 59.9 μM; and kcat/KM = 8.9 × 10² M−1s−1.
We note that while the KM determined by the two different methods were similar, the kcat determined by the PNP-coupled assay was 10 times larger than that determined by the HPLC assay. This discrepancy can be attributed to two factors. First, Pi is actively consumed by PNP in the coupled assay, which in theory could accelerate the YcaO-catalyzed reaction. Further mechanistic investigation involving the determination of the rate-limiting step is needed to support or refute this rationale. Second, we showed that in the absence of the McrA peptide substrate, YcaO can hydrolyze ATP to ADP and Pi unproductively, which suggests a faster ATP hydrolysis than thioamide production (Dong et al., 2019). Here we provide the detailed protocols for both the kinetic assays.
Materials, Reagents and Equipment
Equipment
Eppendorf Centrifuge 5424 (Eppendorf, DE)
Cary 4000 UV-visible spectrophotometer (Agilent)
Flexar HPLC system (PerkinElmer) or equivalent
Materials
Micro cell quartz cuvette (80 μL, Agilent)
C18 column (Grace/Alltech, 4.6 × 250 cm, 5 μm particle size)
Reagents
Synthetase buffer: 50 mM Tris-HCl pH 7.5, 125 mM NaCl, 20 mM MgCl2, 5 mM DTT, 5 mM ATP
Purine nucleoside phosphorylase (Sigma Aldrich, Cat. No. 53113)
2-amino-6-mercapto-7-methylpurine ribonucleoside (MESG, Sigma Aldrich, Cat. No. A9546)
HPLC grade acetonitrile
7.1. Purine nucleoside phosphorylase (PNP)-based kinetic analysis
Timing: 3–5 h for each substrate
To obtain the kinetic parameters for the substrate peptide, prepare McrA peptide at various concentrations (0–500 μM) and let react with 1 μM of MjYcaO in the synthetase buffer).
To obtain the kinetic parameters for ATP, use fixed peptide concentration (500 μM) and variable concentrations of ATP (0–2 mM) (in synthetase buffer omitting ATP).
Initiate reactions via the addition of YcaO to a mixture of peptide substrate, 50 μM of MESG, 0.2 U of PNP, and 2 mM of Na2S in the synthetase buffer in the cuvettes used for absorbance measurement.
Mix the reaction components by gentle and thorough pipetting, followed by absorbance monitoring at 360 nm with a Cary 4000 UV-visible spectrophotometer with temperature maintained at 25 °C.
Calculate the initial rates of phosphate production based on the absorbance change at the initial linear phase and the extinction coefficient of the resulting purine analog (extinction coefficient: 11,000 M−1 cm−1).
Carry out the same reaction, measurement, and data analysis for two more times.
-
Conduct regression analysis by fitting the initial rates (in triplicates) and substrate concentrations into the Michalis-Menten model to obtain the kinetic parameters. Our reported analysis was done in OriginPro 9.1 (Origin Lab).
Notes:
The amount of PNP and MESG to be used should be experimentally determined on a case-by-case basis to ensure that neither reagent is supplied at a rate-limiting concentration. This is usually done by monitoring the rate of 2-amino-6-mercapto-7-methylpurine formation in the presence of a fixed concentration of YcaO (1 μM in this case), saturating concentrations of ATP and McrA peptide, and varying concentrations of PNP and MESG. High concentrations of PNP and MESG are recommended as a starting point.
Use pre-cleaned and dried cuvettes.
Small reaction volumes tend to cause errors. A volume equal to or larger than 100 μL is recommended.
We recommend using a 200 μL micropipette to mix the reaction components to avoid air bubble formation.
7.2. HPLC based kinetics analysis
Initiate reactions by adding 1 μM MjYcaO into a mixture of 2 mM Na2S, 5 mM ATP, and MjMcrA peptide of concentration varying from 0–600 μM in synthetase buffer.
Allow the reactions (carried out in triplicate) to proceed at 25 °C and quench a portion of the reaction at four different time points shortly after the initiation by adding one volume of acetonitrile and 2 volumes of dimethyl sulfoxide.
Remove the precipitate from quenched reactions via centrifugation (17,000 × g, 10 min, 25 °C). The soluble portion of the reactions should be stored in −80 °C before HPLC analysis.
Remove any insolubility from the reactions via centrifugation (17,000 × g, 10 min, 25 °C) directly prior to subjecting the supernatant to HPLC analysis with a C18 column (monitor the absorbance at 220 nm).
Acetonitrile (solution A) and 0.01% (v/v) formic acid (solution B) should be used as the mobile phase. A linear gradient of 23 to 65% acetonitrile over 10 minutes at 1 mL/min was used to separate the thioamide-containing peptide from the unmodified peptide. A typical chromatogram and the HPLC method are shown in Figure 11 with the retention time for the reactant and product being 6.4 min and 7.0 min, respectively.
Confirm the identities of the peaks by MALDI-TOF-MS analysis.
Determine the concentrations of thioamidated products based on the ratio of the area under the reactant and product peaks (absorbance at 220 nm).
The initial rates can be estimated by plotting thioamide concentration against reaction quench time and fitted into a linear regression model.
-
The resulting slopes (initial rates) should be plotted against the substrate concentrations and fitted into the Michaelis-Menten model. OriginPro 9.1 (Origin Lab) was used to obtain the steady state kinetic parameters.
Notes:
The thioamide product and unmodified peptide can be separated under acidic conditions, including using 0.1%, 0.5%, and 0.01% formic acid as solution B. A lower acid concentration (0.005% formic acid) was attempted as the mobile phase to further eliminate acid-induced thioamide hydrolysis, which, however, led to poor separation between the product and reactant.
Thioamides have an absorbance at 270 nm. We therefore chose the absorbance trace at 220 nm for quantitative analysis instead of 280 nm.
The HPLC method described here can be readily modified to an LC-MS based method.
Figure 11: HPLC-based kinetic analysis for the thioamidation of MjMcrA peptide.
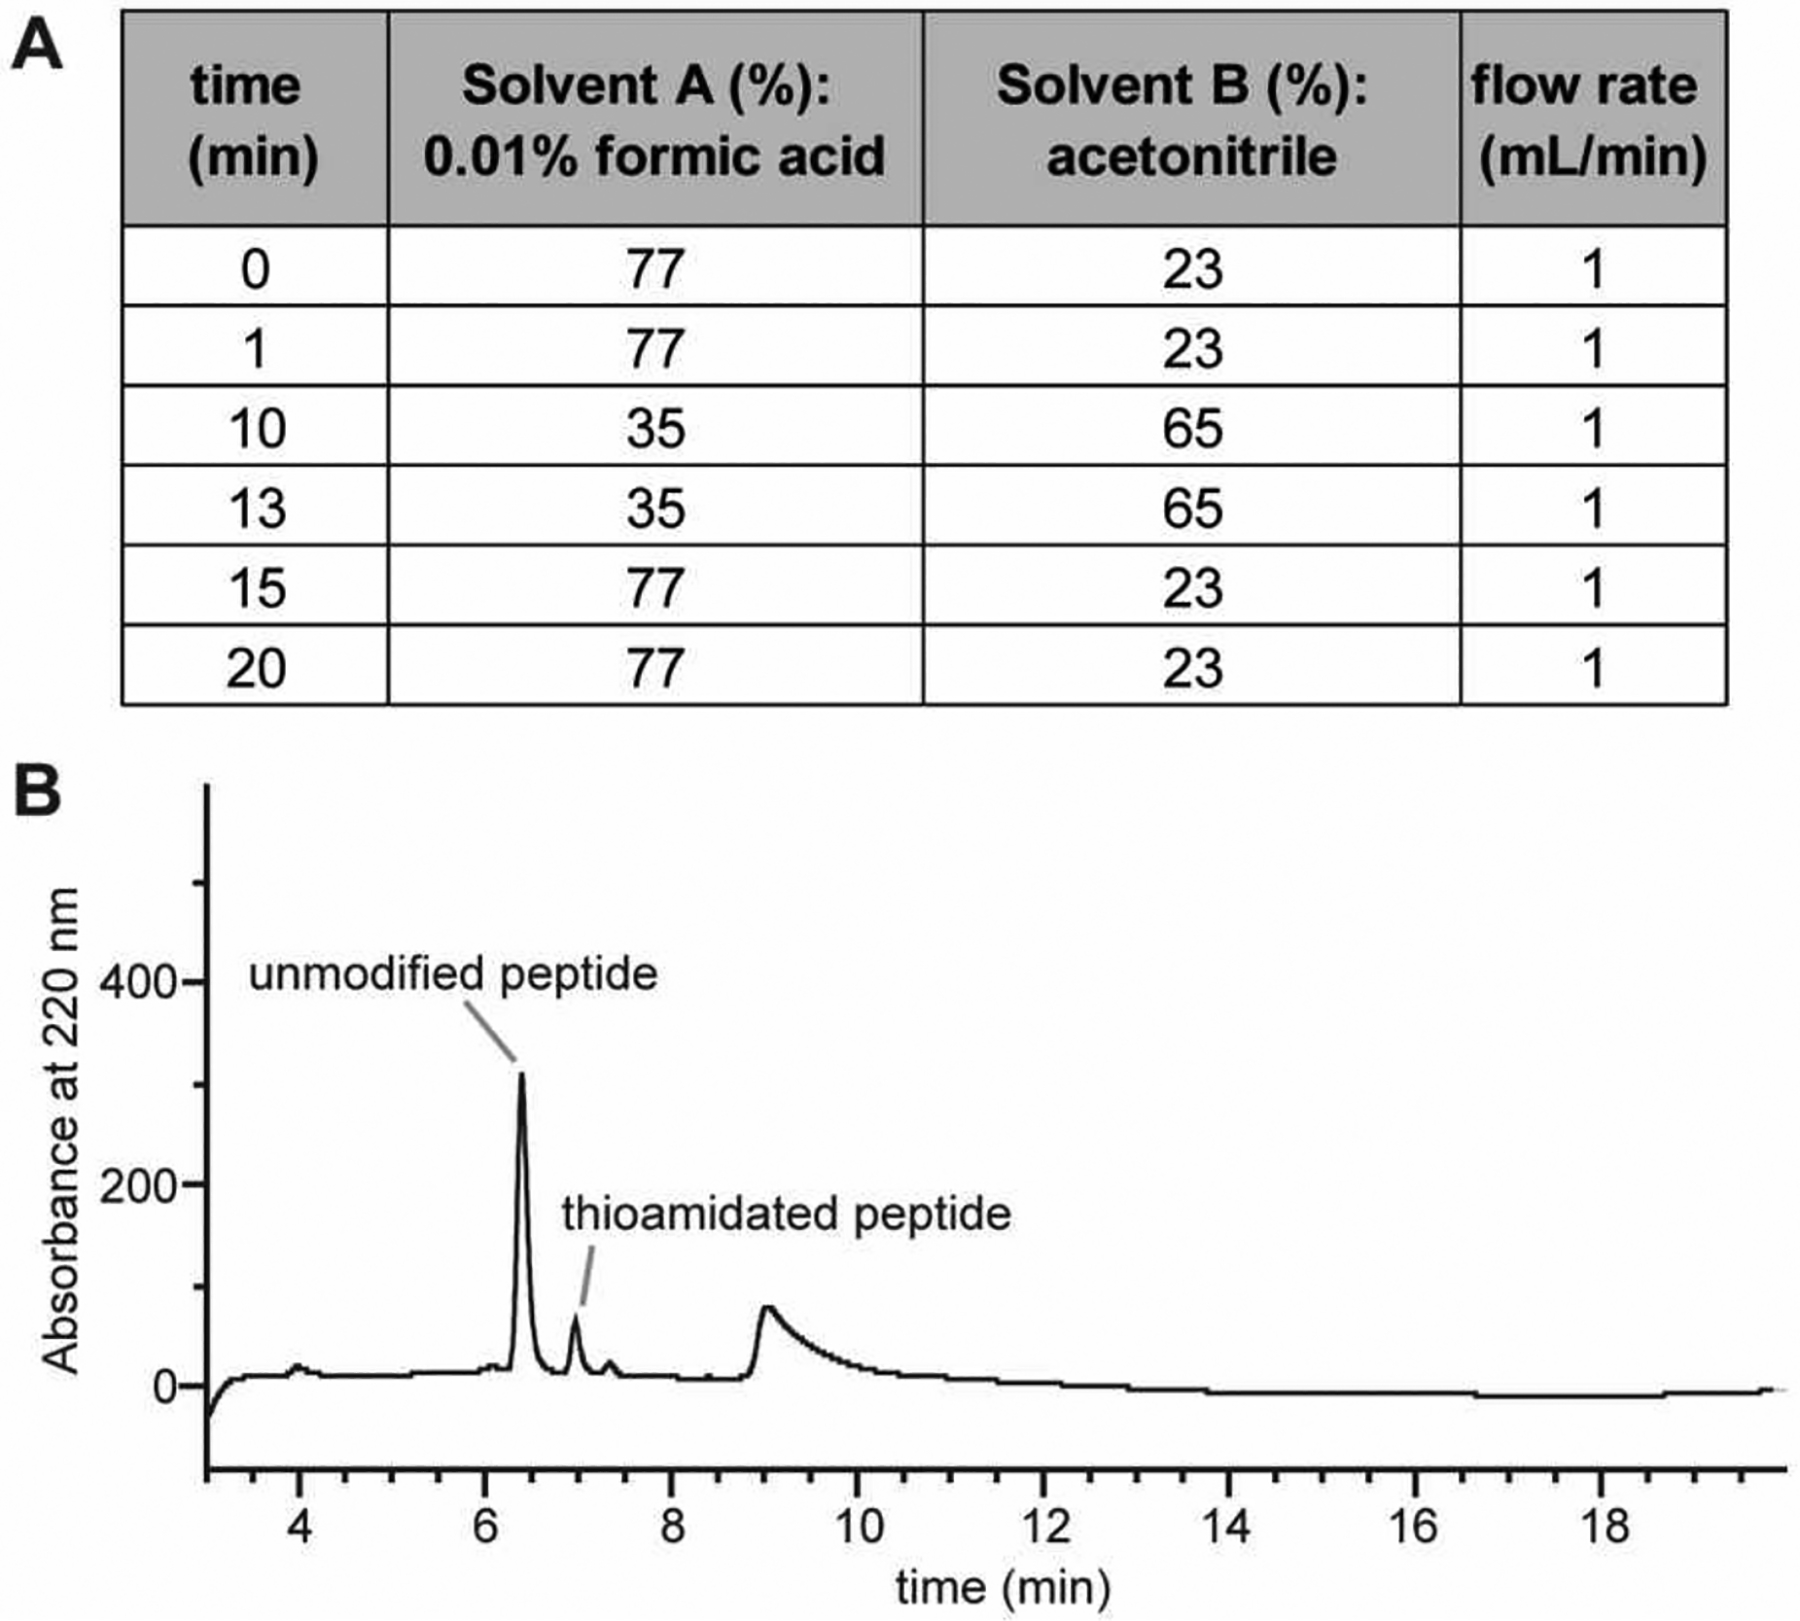
(A) HPLC analysis method with solvent gradient used. (B) A typical chromatogram with the unmodified peptide (retention time: 6.4 min) and thioamidated product (retention time: 7.0 min) labeled. The first 3 min of the run that contains a void peak was omitted for clarity.
8. Summary
In this chapter, we have described the methodologies for cloning, expression, and purification of the YcaO and TfuA proteins, as well as the corresponding peptide substrates from M. acetivorans and other methanogens. The detailed protocols for peptide backbone thioamidation using YcaO (and TfuA in some cases) and the product characterization by mass spectrometry are provided. In addition, we have also covered the procedures for characterizing variants of these proteins, studying peptide-protein interactions, identifying ATP hydrolysis products using NMR and HPLC, and comprehensive kinetics analysis using both direct and coupled assays. By enumerating the steps those were employed to characterize the YcaO-catalyzed thioamide formation, we hope that the methodology can be applied for the characterization of additional thioamide-containing natural products as well as allow a deeper investigation into the native biological functions of this important PTM in peptides and proteins. The methods presented in this chapter may also aid the engineering efforts to expand the function of the YcaO proteins. As the mechanism of enzymatic thioamidation being elucidated, a YcaO-based approach can be used to introduce thioamides onto different substrates and may lead to the development of chemo-enzymatic methods as well. Further, given the diverse chemical outcomes of the YcaO superfamily, it is plausible that other nucleophiles could also be recruited to participate in a YcaO-dependent peptide backbone modification.
Acknowledgements
This work was supported in part by IIT Dharwad Seed R&D and networking funds (SGNF, to N.M.) and National Institutes of Health Grant GM097142 (to D.A.M.).
Footnotes
Conflict of Interest Statement
The authors declare no conflict of interest.
References
- Burkhart BJ, Schwalen CJ, Mann G, Naismith JH, & Mitchell DA (2017). YcaO-dependent posttranslational amide activation: Biosynthesis, structure, and function. Chemical Reviews, 117, 5389–5456. [DOI] [PMC free article] [PubMed] [Google Scholar]
- Dong S-H, Liu A, Mahanta N, Mitchell DA, & Nair SK (2019). Mechanistic basis for ribosomal peptide backbone modifications. ACS Central Science, 5, 842–851. [DOI] [PMC free article] [PubMed] [Google Scholar]
- Dowling DP, Kung Y, Croft AK, Taghizadeh K, Kelly WL, Walsh CT, & Drennan CL (2016). Structural elements of an NRPS cyclization domain and its intermodule docking domain. Proceedings of the National Academy of Science of the United States of America, 113, 12432–12437. [DOI] [PMC free article] [PubMed] [Google Scholar]
- Dunbar KL, Dell M, Molloy EM, Kloss F, & Hertweck C (2019). Reconstitution of iterative thioamidation in closthioamide biosynthesis reveals tailoring strategy for nonribosomal peptide backbones. Angewandte Chemie International Edition, 131, 13148–13152. [DOI] [PMC free article] [PubMed] [Google Scholar]
- Dunbar KL, Melby JO, & Mitchell DA (2012). YcaO domains use ATP to activate amide backbones during peptide cyclodehydrations. Nature Chemical Biology, 8, 569–575. [DOI] [PMC free article] [PubMed] [Google Scholar]
- Dunbar KL, Tietz JI, Cox CL, Burkhart BJ, & Mitchell DA (2015). Identification of an auxiliary leader peptide-binding protein required for azoline formation in ribosomal natural products. Journal of the American Chemical Society, 137, 7672–7677. [DOI] [PMC free article] [PubMed] [Google Scholar]
- Ermler U, Grabarse W, Shima S, Goubeaud M, & Thauer RK (1997). Crystal structure of methyl-coenzyme M reductase: The key enzyme of biological methane formation. Science, 278, 1457–1462. [DOI] [PubMed] [Google Scholar]
- Frattaruolo L, Lacret R, Cappello AR, & Truman AW (2017). A genomics-based approach identifies a thioviridamide-like compound with selective anticancer activity. ACS Chemical Biology, 12, 2815–2822. [DOI] [PubMed] [Google Scholar]
- Izawa M, Kawasaki T, & Hayakawa Y (2013). Cloning and heterologous expression of the thioviridamide biosynthesis gene cluster from Streptomyces olivoviridis. Applied Environmental Microbiology, 79, 7110–7113. [DOI] [PMC free article] [PubMed] [Google Scholar]
- Jurgenson CT, Begley TP, & Ealick SE (2009). The structural and biochemical foundations of thiamin biosynthesis. Annual Review of Biochemistry, 78, 569–603. [DOI] [PMC free article] [PubMed] [Google Scholar]
- Kahnt J, Buchenau B, Mahlert F, Krüger M, Shima S, & Thauer RK (2007). Post-translational modifications in the active site region of methyl-coenzyme M reductase from methanogenic and methanotrophic archaea. The FEBS Journal, 274, 4913–4921. [DOI] [PubMed] [Google Scholar]
- Kenney GE, Dassama LMK, Pandelia M-E, Gizzi AS, Martinie RJ, Gao P, et al. (2018). The biosynthesis of methanobactin. Science, 359, 1411–1416. [DOI] [PMC free article] [PubMed] [Google Scholar]
- Kjaerulff L, Sikandar A, Zaburannyi N, Adam S, Herrmann J, Koehnke J, & Müller R (2017). Thioholgamides: Thioamide-containing cytotoxic RiPP natural products. ACS Chemical Biology, 12, 2837–2841. [DOI] [PubMed] [Google Scholar]
- Mahanta N, Liu A, Dong S, Nair SK, & Mitchell DA (2018). Enzymatic reconstitution of ribosomal peptide backbone thioamidation. Proceedings of the National Academy of Science of the United States of America, 115, 3030–3035. [DOI] [PMC free article] [PubMed] [Google Scholar]
- Mahanta N, Szantai-Kis DM, Petersson EJ, & Mitchell DA (2019). Biosynthesis and chemical applications of thioamides. ACS Chemical Biology, 14, 142–163. [DOI] [PMC free article] [PubMed] [Google Scholar]
- Moerke NJ (2009). Fluorescence polarization (FP) assays for monitoring peptide-protein or nucleic acid-protein binding. Current Protocols in Chemical Biology, 1, 1–15. [DOI] [PubMed] [Google Scholar]
- Montalbán-López M, Scott TA, Ramesh S, Rahman IR, Heel AJ van Viel JH, et al. (2021). New developments in RiPP discovery, enzymology and engineering. Natural Product Reports, 38, 130–239. [DOI] [PMC free article] [PubMed] [Google Scholar]
- Nayak DD, Liu A, Agrawal N, Rodriguez-Carerro R, Dong S-H, Mitchell DA, et al. (2020). Functional interactions between posttranslationally modified amino acids of methyl-coenzyme M reductase in Methanosarcina acetivorans. PLOS Biology, 18, e3000507. [DOI] [PMC free article] [PubMed] [Google Scholar]
- Nayak DD, Mahanta N, Mitchell DA, & Metcalf WW (2017). Post-translational thioamidation of methyl-coenzyme M reductase, a key enzyme in methanogenic and methanotrophic Archaea. eLife, 6, e29218. [DOI] [PMC free article] [PubMed] [Google Scholar]
- Santos-Aberturas J, Chandra G, Frattaruolo L, Lacret R, Pham TH, Vior NM, et al. (2019). Uncovering the unexplored diversity of thioamidated ribosomal peptides in Actinobacteria using the RiPPER genome mining tool. Nucleic Acids Research, 47, 4624–4637. [DOI] [PMC free article] [PubMed] [Google Scholar]
- Scheller S, Goenrich M, Boecher R, Thauer RK, & Jaun B (2010). The key nickel enzyme of methanogenesis catalyses the anaerobic oxidation of methane. Nature, 465, 606–608. [DOI] [PubMed] [Google Scholar]
- Schwalen CJ, Hudson GA, Kille B, & Mitchell DA (2018). Bioinformatic expansion and discovery of thiopeptide antibiotics. Journal of the American Chemical Society, 140, 9494–9501. [DOI] [PMC free article] [PubMed] [Google Scholar]
- Stoscheck CM (1990). Quantitation of protein. Methods in Enzymology, 182, 50–68. [DOI] [PubMed] [Google Scholar]
- Urbina HD, Silberg JJ, Hoff KG, & Vickery LE (2001). Transfer of sulfur from IscS to IscU during Fe/S cluster assembly. Journal of Biological Chemistry, 276, 44521–44526. [DOI] [PubMed] [Google Scholar]
- Wagner T, Kahnt J, Ermler U, & Shima S (2016). Didehydroaspartate modification in methyl-coenzyme M reductase catalyzing methane formation. Angewandte Chemie International Edition, 128, 10788–10791. [DOI] [PubMed] [Google Scholar]
- Watson ZL, Ward FR, Méheust R, Ad O, Schepartz A, Banfield JF, & Cate JH (2020). Structure of the bacterial ribosome at 2 Å resolution. eLife, 9, e60482. [DOI] [PMC free article] [PubMed] [Google Scholar]
- Webb MR (1992). A continuous spectrophotometric assay for inorganic phosphate and for measuring phosphate release kinetics in biological systems. Proceedings of the National Academy of Science of the United States of America, 89, 4884–4887. [DOI] [PMC free article] [PubMed] [Google Scholar]