

Abstract
Objective:
A behavioral economic approach to cannabis misuse emphasizes a crucial role of high drug demand (i.e., reinforcing value), which may be measured using a marijuana purchase task (MPT). The multiple indices from this measure have been associated with cannabis misuse, but somewhat inconsistently, possibly because of task variability across studies. Based on recent qualitative research, the current study implemented an optimized MPT to examine the underlying factor structure and the relationship between cannabis demand and both cannabis misuse and motivation to change.
Method:
Participants were two independent samples of emerging adults who reported cannabis use and heavy episodic drinking in the last month, one Canadian (n = 396) and the other American (n = 275). Both were assessed using an MPT, the Cannabis Use Disorder Identification Test (CUDIT), the Marijuana Adverse Consequences Questionnaire (MACQ), and readiness to change items.
Results:
Principal component analyses of the MPT indices revealed the same two-factor latent structure in both samples, interpreted as Amplitude (intensity, Omax, elasticity) and Persistence (breakpoint, Pmax). Regressions revealed that Amplitude was significantly associated with CUDIT and MACQ in both samples. In the Canadian sample, Persistence was also significantly associated with CUDIT and MACQ, and both factors were associated with motivation to change.
Conclusions:
The optimized MPT generated a two-factor latent structure that was parallel across samples, and the Amplitude factor was consistently associated with cannabis misuse. The current findings indicate the robust relevance of behavioral economic demand for cannabis in relation to cannabis misuse but suggest that links to motivation may be sample-specific.
Cannabis is one of the most commonly used substances in North America (Hasin et al., 2017; Rotermann, 2019), with 15.9% of Americans (Substance Abuse and Mental Health Services Administration, 2018) and 12.3% of Canadians reporting any use in the last year (Canadian Centre on Substance Use and Addiction, 2018). Cannabis misuse is a public health concern that affects society in diverse ways, including loss of productivity, increased health care costs, increased crime rates, and cannabis use disorder (Canadian Centre on Substance Use and Addiction, 2018; Volkow et al., 2014). Of particular concern is cannabis use among emerging adults (ages 17–25 years), who exhibit the highest prevalence (Rotermann, 2019) and for whom cannabis use has been linked to an increased risk of psychosocial problems, other substance misuse, and cognitive impairments (Brook et al., 2016; Gruber et al., 2012). Furthermore, because this developmental period is marked by active brain growth, emerging adults may be especially vulnerable to the effects of cannabis use (Chen et al., 2009).
One approach to understand cannabis misuse is through the lens of behavioral economics, which integrates concepts from psychology and microeconomics to understand the behavior-strengthening properties of psychoactive substances (Hursh et al., 2005; Murphy & MacKillop, 2006). One commonly used behavioral economic assessment is the hypothetical purchase task, which assesses how estimated substance consumption changes as a function of escalating price and thus characterizes demand for a substance (i.e., relative reinforcing value). More specifically, demand may be estimated by five conceptually related indices: intensity (i.e., highest level of consumption, typically as measured at $0 or other minimal unit price), Omax (i.e., output maximum or maximum expenditure across prices), Pmax (i.e., price maximum or price associated with maximum responding), breakpoint (i.e., the price at which consumption is suppressed to zero), and elasticity (i.e., overall sensitivity of consumption to increasing cost or rate of change; see Gilroy et al., 2020). Thus, demand curves characterize individual differences in the reinforcing value of a drug (Gilroy et al., 2020; Greenwald & Hursh, 2006; Hursh, 1980, 1984; Hursh & Roma, 2016; Jacobs & Bickel, 1999; Roma et al., 2016).
Alcohol and cigarette purchase tasks have been found to be robustly associated with substance involvement (Amlung et al., 2012; Gray et al., 2016). Of note, studies have shown a latent dimensional structure that underlies the five indices of demand. Generally, two underlying latent factors have been identified, described as Amplitude and Persistence (MacKillop et al., 2009). Amplitude is thought to represent the amount consumed and typically includes intensity and Omax, whereas Persistence is thought to represent sensitivity of consumption to escalating costs, typically including Pmax, breakpoint, and elasticity (MacKillop et al., 2009; Zvorsky et al., 2019), although the loadings have varied across studies (Aston et al., 2017; Bidwell et al., 2012; MacKillop et al., 2009).
A marijuana purchase task (MPT) was developed in 2014 for assessing cannabis demand (for a review, see Aston & Meshesha, 2020), and its associated indices are differentially associated with cannabis use and outcomes. In particular, Omax and intensity were associated with important cannabis-related characteristics, such as frequency or amount of cannabis use (Collins et al., 2014; Metrik et al., 2015; Strickland et al., 2017) and subjective craving (Aston et al., 2015; Metrik et al., 2016). Intensity was also associated with age at initiation of regular use (Aston et al., 2015), attentional bias for cannabis cues (Metrik et al., 2016), cannabis use disorder (Strickland et al., 2017), dependence symptoms (Aston et al., 2015), and driving after cannabis use (Patel & Amlung, 2019). Across studies, however, the relationships with remaining demand indices and cannabis involvement or misuse have been mixed (Aston et al., 2015; Collins et al., 2014; Hindocha et al., 2017).
One reason for these discrepancies could be that there is considerable heterogeneity in the methodology used to assess cannabis demand. These discrepancies include differences in the number of price points used and differences in the units in which cannabis was purchased. In particular, calculating cannabis demand is challenging because it is difficult to quantify an ideal unit of cannabis measurement. Extant MPT studies have variously used price per hit (Aston et al., 2015, 2016; Metrik et al., 2016), or price per joint (Collins et al., 2014), as the unit of consumption.
One consideration is that cannabis is typically purchased in units of weight (i.e., grams) and so using these units may be more ecologically valid when determining cannabis demand. Recently, two qualitative studies were undertaken with active non–treatment-seeking cannabis users to solicit input on the optimal assessment of cannabis demand (Aston et al., 2015). The participants made a number of recommendations to optimize the ecological validity of the measure, including purchase units as grams, specifying the typical quantity for the respondent, and using the participant's typical week as the estimation window. A modified version of the MPT employed the use of hypothetical grams purchased, instead of hits or joints (Aston et al., 2020). Using this modified version, it was found that the MPT demonstrated convergent validity as the demand metrics were associated with cannabis craving, age at initiation of regular use, and dependence (Aston et al., 2020).
A further consideration is to examine the relationship between cannabis demand and motivation to change, sometimes fractionated into readiness, importance, and confidence. Research has shown that the motivation to change substance use was important in predicting future behavior change (Bertholet et al., 2012; Hesse, 2006). Therefore, motivation to change has clinical utility insofar as it may provide targets for interventions. It allows clinicians to identify which skills for behavior change may be effective at different stages during the process of behavior change, i.e., precontemplation, contemplation, and action (Prochaska, 2008).
A last consideration is that cannabis use often does not occur alone. There is a high prevalence of cannabis and alcohol co-use (Agrawal et al., 2007). Comorbid alcohol and cannabis use is associated with riskier drinking patterns and increased cannabis-related problems (Hayaki et al., 2016), more harmful consequences (Green et al., 2016; Subbaraman & Kerr, 2015), higher impulsivity (Trull et al., 2016), increased risky driving (Subbaraman & Kerr, 2015), and increased occurrence of psychiatric disorders and symptom severity (Brunette et al., 2003). Furthermore, research suggests pharmacological interactions between the two, as evidenced by cross-tolerance (Hungund & Basavarajappa, 2004; Malinen & Hyytiä, 2008) and alterations in bioavailability (Lukas & Orozco, 2001). Because of co-occurrence, it is important and relevant to examine how misuse manifests in individuals who use both alcohol and cannabis.
The current study used a modified version of the MPT to examine cannabis demand in two samples of emerging adults reporting heavy episodic drinking. This population is particularly germane because concurrent use of alcohol and cannabis is prevalent among emerging adults (Terry-McElrath et al., 2013, 2017; Pape et al., 2009). Moreover, patterns of use among emerging adults tend to be more dynamic and contextually determined, which increases the clinical utility of indices that can measure fluctuating level of motivation to use cannabis. For these reasons, cannabis demand was assessed in samples from two cultural contexts (i.e., Hamilton, ON, Canada and Memphis, TN, USA). More specifically, in the current article, the first aim was to investigate whether an optimized MPT led to the same underlying factor structure as previously reported in the literature. The second aim was to examine how the resulting latent indicators of cannabis demand were related to cannabis misuse/severity, and indicators of motivation to change cannabis use. It was predicted from the alcohol purchase task, cigarette purchase task, and MPT literature that there would be a two-factor latent structure (Amplitude and Persistence) and that these factors would be related to aspects of substance involvement.
Method
Participants
All aspects of study procedures were approved by the respective university institutional review boards. Participants provided written informed consent, followed by in-person assessments. These data are from an ongoing longitudinal study: Behavioral Economic Trajectories of Alcohol Misuse. Participants were from two independent studies investigating alcohol misuse in emerging adults. One sample was recruited in Hamilton, ON (n = 396), and the other in Memphis, TN (n = 265). Although the samples are from independent studies, both cohorts had the following eligibility criteria in common: heavy episodic drinking (> 4/3 standard drinks for males/females; Butt et al., 2011) on 2 or more days in the past month; fluency in written English; and no current or past psychotic disorders.
The Canadian sample eligibility criteria also permitted only one instance of high-risk drinking in a typical month when the individual also reported at least monthly cannabis use (i.e., high-risk substance use; 8% of recruited sample). Participants in both studies were recruited using flyers and newspaper, online, and bus ads. In the Canadian sample, participants were required to be between ages 19.5 and 23, and in the American sample, participants were required to be between ages 21 and 24.9. Participants were only included in the current report if they reported cannabis use in the last month. The use of two independent samples from distinct geographic areas was intended to allow examination of similarities and differences across separate samples in Canada and the United States.
Sample descriptive statistics for both samples are presented in Table 1 and unsurprisingly, given the differences in eligibility criteria, differed in a number of ways. Compared with the Hamilton sample, participants in the Memphis sample were demographically older, more racially diverse, of lower income, and less likely to be enrolled in postsecondary education. In addition, Memphis participants reported heavier drinking and cannabis involvement. Collectively, the two samples can be understood as both reflecting emerging adults engaging in high-risk drinking and concurrent cannabis use, but with meaningful demographic and substance use differences between the two.
Table 1.
Descriptive statistics and frequencies of participants in the Canadian (n = 396) and American (n= 265) samples

| Characteristic | Canadian sample M (SD) or % | American sample M (SD) or % | t or χ2 | p |
|---|---|---|---|---|
| Age, M (SD) | 21.41 (1.19) | 22.57 (1.07) | 12.75 | <.001 |
| Sex, % male | 51.5% | 50.9% | 0.02 | .89 |
| Ethnicity | ||||
| % White/European | 69.2% | 43.4% | 43.62 | <.001 |
| % Black/African | 3.0% | 47.2% | 188.26 | <.001 |
| Student status, % student | 74.2% | 43.4% | 61.04 | <.001 |
| Median household income | $45,000– | $30,000– | ||
| 59,999 CAD | 44,999 USD | |||
| Years of education, M (SD) | 14.54 (1.85) | 14.63 (2.13)a | 0.52 | .60 |
| Drinks per week, M (SD) | 13.78 (10.98) | 20.36 (16.54) | 5.68 | <.001 |
| CUDIT, M (SD) | 8.97 (6.44) | 10.41 (6.28) | 2.85 | <.01 |
| MACQ, M (SD) | 9.08 (8.81) | 8.91 (7.35) | 0.27 | .79 |
| Importance cannabis change | 3.22 (2.76) | 3.68 (3.08) | 1.98 | .04 |
| Ready to change | 4.16 (2.84) | 4.01 (3.10) | 0.63 | .53 |
| Confidence in change | 8.37 (2.52) | 8.12 (2.89) | 1.14 | .25 |
Notes: CAD = Canadian dollars; USD = U.S. dollars; CUDIT = Cannabis Use Disorder Identification Test; MACQ = Marijuana Adverse Consequences Questionnaire.
n = 248.
Measures
The two studies used parallel measures to assess cannabis involvement and demand. An MPT is a behavioral economic measure designed to assess willingness to purchase and consume cannabis across escalating price levels (Aston et al., 2020). Respondents estimate the number of grams of cannabis they would consume in a typical week within the last month across a range of prices in hypothetical scenarios, i.e., “How many grams of marijuana would you consume if they were $1 per gram?” A total of 20 ascending price increments were used, as follows: $0, $1, $2, $4, $6, $8, $10, $12, $14, $16, $18, $20, $25, $30, $35, $40, $45, $50, $55, and $60. Participants were asked to assume that cannabis could not be shared, saved, or obtained from an alternate source (for extended descriptions, see the Supplementary Material, which appears as an online-only addendum to this article on the journal's website). In addition, they were asked to consider choices as though they had typical amounts of money and had not consumed any cannabis or other drug before performing the task. Marijuana was specified to be of comparable strength and quality to that the participant would generally consume. This task has been previously validated by Collins et al. (2014) and Aston et al. (2015).
The Marijuana Adverse Consequences Questionnaire (MACQ) is a measure of marijuana misuse (Simons et al., 2012). It is a 50-item self-report questionnaire in which each item is rated dichotomously (yes/no) to indicate whether marijuana-related problem(s) occurred in the last 4 months. The scale covers a broad range of associated consequences such as those associated with social-interpersonal functioning, impaired control, self-perception, self-care, risky behavior, academic occupational consequences, and physical dependence (Simons et al., 2012). The MACQ demonstrated excellent internal consistency (Cronbach's α was .93 in the Canadian sample and .90 in the American sample).
The Cannabis Use Disorders Identification Test (CUDIT) is a self-report measure developed to assess individual cannabis consumption and cannabis-related problems (Adamson et al., 2010). The CUDIT demonstrated good internal consistency (Cronbach's α was .80 in the Canadian sample and .70 in the American sample). Cannabis readiness rulers measured motivation to change (Maisto et al., 2011). Individuals indicate on a scale of 1 to 10 how important they think it is to change their cannabis use (1 = not important, 10 = very important), how ready they are to make a change (1 = not ready, 10 = trying to change), and how confident they are that they would be able to change their cannabis use (1 = not confident, 10 = very confident). Previous studies have reported adequate reliability and validity (Maisto et al., 2011). Finally, participants completed a comprehensive demographic questionnaire that assessed sex, ethnicity, education, income, and other descriptive characteristics.
Data analysis
Standard quality control procedures were followed for the MPT. Participants were removed from the analysis for bounce, trend, and reversal from zero violations per Stein et al. (2015). As a result of these analyses, four individuals were removed from the Canadian sample, and eight individuals were removed from the American sample. Furthermore, meaningful elasticity values cannot be calculated for individuals that respond to two or fewer price points; therefore, these individuals were removed from the data set. As a result of these analyses, 48 individuals were removed from the Canadian sample (final n = 396), and 46 individuals were removed from the American sample (final n = 265) for all indices.
Winsorization of outliers was performed at a price level, where outlier values were recoded as one unit greater than the previous outlier (in the case of the lowest outlier, it was recoded as one unit greater than the highest non-outlier value). For the MPT, the indices of intensity, Omax, Pmax, and breakpoint were generated using an observed values approach (Murphy & MacKillop, 2006), meaning that intensity was defined as consumption at minimum cost, Omax was defined as maximum expenditure (output) across prices, Pmax was defined as the price at which Omax was obtained, and breakpoint was defined as the first price that suppressed consumption to zero.
Elasticity (α) was derived using an exponentiated approach to Hursh & Silberberg's (2008) exponential demand equation (Koffarnus et al., 2015). Calculation of price elasticity was derived as follows: Q = Q0 × 10k(e^(-αQ0C) – 1), where Q = quantity consumed, Q0 = derived intensity, k = a constant across individuals that denotes the range of the dependent variable (grams) in log arithmetic units, α = elasticity or the rate constant determining the rate of decline in log consumption based on increases in price, and C = cost of the commodity (Koffarnus et al., 2015).
In the current study, k was tested at levels of 2, 3, and 4 to determine the greatest variance accounted for in the data by the equation. Outliers were also examined for intensity, Omax, Pmax (the price point at which Omax was reached), breakpoint, and elasticity (criterion z > ±3.99). Winsorization was repeated at the index level for Omax, Pmax, elasticity (α), and breakpoint, but outliers were recoded as .001 unit greater than the previous outlying value (in the case of the lowest outlier, it was recoded as .001 greater than the highest non-outlying value). In both samples, <1% of the data was Winsorized. The overall best-fitting k parameter was determined to be 4. Elasticity was log10 transformed to correct for positive skewness.
Principal component analyses with oblique (direct oblimin) rotation were used to reduce Omax, Pmax, breakpoint, intensity, and elasticity (log α) to latent components. The factor structure was determined by the examination of Eigenvalues > 1 and the scree plot (Kaiser, 1960). A factor loading of .50 on the pattern matrix was used as the criterion for determining if an item significantly loaded onto a given component (Kaiser, 1960). Hierarchical regressions were used to test whether each latent factor variable significantly predicted MACQ or CUDIT. Separate regressions were run for MACQ and CUDIT as dependent variables. Age, gender, income, student status, ethnicity, and number of drinks consumed per week were included in the statistical models as covariates in the initial step, and the components were entered in the second step.
Using an analytic approach similar to that used by Teeters et al. (2014), a dichotomous variable was created for race (most common race = 0, another race = 1) and university status (student = 0, nonstudent = 1). Bivariate correlations were conducted between the MPT latent variables and the motivation to change indices (importance, readiness, and confidence). Given the substantive differences between the samples, all analyses were conducted separately in Canadian and American samples. Group demand data were calculated by averaging participants’ Winsorized weekly cannabis consumption at each price point (Figure 1).
Figure 1.

Cannabis demand curves for mean (±SEM) weekly cannabis consumption from the Canadian sample (Panel A) and American sample (Panel B). Data are provided in conventional log–log units for proportionality. Zero price is replaced by 0.01 to permit logarithmic units.
Results
Principal component analyses
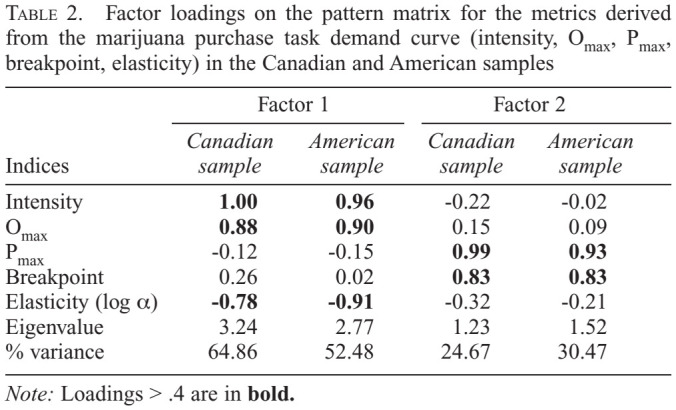
Table 2 represents factor loadings of the five MPT demand indices on each of the rotated factors. Using Eigenvalues greater than 1 and the scree plot, the principal component analysis indicated that a two-factor latent structure was the best solution in both the Canadian and American samples. The two-factor solution explained 89.5% of the total variance in the Canadian sample and 83.0% in the American sample. The first factor accounted for 64.9% of variance in the Canadian sample as well as 52.5% of the variance in the American sample and included three MPT indices: elasticity (log α), Omax, and intensity. The second factor accounted for 24.7% of the variance in the Canadian sample as well as 30.5% of the variance in the American sample and included two MPT indices: breakpoint and Pmax. The correlation between the two factors was r = .33, p < .001 in the Canadian sample and r = .15, p < .05 in the American sample. Of note, the factor loadings for intensity was 1.00, but when variables are correlated and an oblique rotation is used (i.e., direct oblimin in this case), component loadings can be 1 or larger (Jöreskog, 1999).
Table 2.
Factor loadings on the pattern matrix for the metrics derived from the marijuana purchase task demand curve (intensity, Omax, Pmax, breakpoint, elasticity) in the Canadian and American samples
| Indices | Factor 1 | Factor 2 | ||
|---|---|---|---|---|
| Canadian sample | American sample | Canadian sample | American sample | |
| Intensity | 1.00 | 0.96 | −0.22 | −0.02 |
| Omax | 0.88 | 0.90 | 0.15 | 0.09 |
| Pmax | −0.12 | −0.15 | 0.99 | 0.93 |
| Breakpoint | 0.26 | 0.02 | 0.83 | 0.83 |
| Elasticity (log α) | −0.78 | −0.91 | −0.32 | −0.21 |
| Eigenvalue | 3.24 | 2.77 | 1.23 | 1.52 |
| % variance | 64.86 | 52.48 | 24.67 | 30.47 |
Note: Loadings > .4 are in bold.
Cannabis demand and cannabis misuse
For descriptive purposes, the cannabis demand curves are in Figure 1. Table 3 presents the multiple regression results for the MPT latent variables in relation to CUDIT score. Factor 1 (intensity, Omax, and elasticity) predicted CUDIT in both the American and Canadian samples. Factor 2 (Pmax and breakpoint) predicted CUDIT only in the Canadian sample. The variance inflation factor was used to examine multicollinearity between the variables; all values were lower than 1.5, therefore indicating that there was low risk of multicollinearity.
Table 3.
Multiple regression of the marijuana purchase task indices in relation to the Cannabis Use Disorder Identification Test

| Variable | B | SE | β | t | p | VIF |
|---|---|---|---|---|---|---|
| Canadian sample | ||||||
| Age | −0.26 | 0.24 | −.05 | 1.07 | .29 | 1.12 |
| Sex | -1.20 | 0.56 | −.09 | 2.16 | <.05 | 1.06 |
| Income | −0.16 | 0.09 | −.08 | 1.71 | .09 | 1.11 |
| Student status | 0.72 | 0.60 | .05 | 1.21 | .23 | 1.05 |
| Ethnicity | −0.01 | 0.67 | −.00 | 0.03 | .99 | 1.18 |
| Drinks per week | 0.01 | 0.03 | .02 | 0.33 | .74 | 1.13 |
| Amplitude (Factor 1) | 3.03 | 0.31 | .47 | 9.84 | <.001 | 1.30 |
| Persistence (Factor 2) | 0.91 | 0.29 | .14 | 3.14 | <.01 | 1.14 |
| American sample | ||||||
| Age | −0.39 | 0.34 | −.07 | 1.15 | .25 | 1.08 |
| Sex | −0.54 | 0.74 | −.04 | 0.72 | .47 | 1.13 |
| Income | −0.13 | 0.16 | −.05 | 0.79 | .43 | 1.14 |
| Ethnicity | −0.64 | 0.74 | −.05 | 0.87 | .39 | 1.10 |
| Student status | −0.41 | 0.77 | −.03 | 0.53 | .60 | 1.21 |
| Drinks per week | 0.00 | 0.02 | .01 | 0.12 | .90 | 1.12 |
| Amplitude (Factor 1) | 2.52 | 0.39 | .40 | 6.51 | <.001 | 1.22 |
| Persistence (Factor 2) | 0.61 | 0.37 | .10 | 1.65 | .10 | 1.10 |
Notes: VIF = variance inflation factor. Bold indicates statistical significance.
Table 4 presents the multiple regression results for the MPT latent variables for the MACQ. Factor 1 (intensity, Omax, and elasticity) predicted MACQ in both the American and Canadian samples. Factor 2 (Pmax and breakpoint) predicted MACQ only in the Canadian sample. The variance inflation factor was used to examine multicollinearity between the variables; all values were lower than 1.5, therefore indicating that there was low risk of multicollinearity.
Table 4.
Multiple regression of the marijuana purchase task indices in relation to the Marijuana Adverse Consequences Questionnaire

| Variable | B | SE | β | t | p | VIF |
|---|---|---|---|---|---|---|
| Canadian sample | ||||||
| Age | −0.43 | 0.36 | −.06 | 1.21 | .23 | 1.12 |
| Sex | −0.63 | 0.82 | −.04 | 0.76 | .45 | 1.06 |
| Income | −0.07 | 0.14 | −.02 | 0.50 | .62 | 1.11 |
| Student status | 2.42 | 0.89 | .13 | 2.74 | .01 | 1.17 |
| Ethnicity | −0.66 | 0.99 | −.03 | 0.67 | .50 | 1.05 |
| Drinks per week | 0.08 | 0.04 | .09 | 1.95 | .05 | 1.13 |
| Amplitude (Factor 1) | 3.08 | 0.46 | .35 | 6.72 | <.001 | 1.29 |
| Persistence (Factor 2) | 1.02 | 0.43 | .12 | 2.40 | <.05 | 1.13 |
| American sample | ||||||
| Age | −0.32 | 0.43 | −.05 | 0.73 | .47 | 1.08 |
| Sex | 0.55 | 0.95 | .04 | 0.58 | .57 | 1.13 |
| Income | 0.03 | 0.20 | .01 | 0.14 | .89 | 1.14 |
| Ethnicity | −0.67 | 0.94 | −.05 | 0.71 | .48 | 1.10 |
| Student status | 1.39 | 0.98 | .10 | 1.42 | .16 | 1.21 |
| Drinks per week | −0.01 | 0.03 | −.02 | 0.25 | .81 | 1.12 |
| Amplitude (Factor 1) | 1.54 | 0.49 | .21 | 3.12 | <.001 | 1.22 |
| Persistence (Factor 2) | 0.75 | 0.47 | .10 | 1.60 | .11 | 1.10 |
Notes: VIF = variance inflation factor. Bold indicates statistical significance.
Zero-order correlation coefficients between the individual demand indices and cannabis variables are given for completeness in the Supplementary Materials.
Cannabis demand and motivation for change
Table 5 represents bivariate correlations between the motivation to change cannabis use and MPT latent factors. How important individuals believed it was to change cannabis use was significantly associated with both Factors 1 and 2 in the Canadian sample. How ready individuals were to change cannabis use was significantly associated with Factor 1 in the Canadian and American samples. How confident individuals were that they could change cannabis use was significantly associated with Factor 1 in the Canadian and American samples and with Factor 2 in the Canadian sample. Zeroorder correlation coefficients between the individual demand indices and cannabis variables are given for completeness in the Supplementary Materials.
Table 5.
Bivariate correlations between the motivation to change cannabis use and latent factors

| Variable | Amplitude (Factor 1) | Persistence (Factor 2) | ||
|---|---|---|---|---|
| Canadian sample | American sample | Canadian sample | American sample | |
| How important do you think it is to change? | .27** | .05 | .17** | .10 |
| How ready are you to change? | .11* | −.10 | −.01 | −.03 |
| How confident are you that you could change? | −.27** | −.10 | −.19* | −.02 |
p < .05;
p <.01.
Discussion
The current study used a behavioral economic approach to examine the relationship between the reinforcing value of cannabis (as measured by an optimized MPT), cannabis misuse, and motivation to change cannabis use. An important finding was that the same underlying latent factor structure for cannabis demand was identified in the Canadian and American samples. The first latent factor included Omax (maximum expenditure), intensity (cannabis consumption at $0 cost), and elasticity (sensitivity of consumption to price). The second latent factor included Pmax (price associated with maximum responding) and breakpoint (where consumption is suppressed to zero). The correlation between the two factors was positive and medium in effect size, suggesting the two were moderately related to each other. Similar to previous research, these two latent factors accounted for nearly all of the variance. Also similar to previous research, intensity and Omax were included together in a latent factor and likewise so were Pmax and breakpoint (Bidwell et al., 2012; MacKillop et al., 2009; O’Connor et al., 2016). In this sense, the current loadings are compatible with previous interpretations, namely Amplitude (i.e., how much the individual would consume or spend) and Persistence (i.e., extent to which an individual will not be deterred by cost), respectively (MacKillop et al., 2009).
However, there are notable differences from previous studies in the current findings. A novel finding was that Amplitude also included elasticity, whereas historically it has loaded on (and is more semantically compatible with) Persistence. There are multiple possible explanations for this. One possibility is that analytic differences drove the differences in the results. Specifically, the current study used an exponentiated curve equation (Koffarnus et al., 2015), adapted from an earlier single parameter exponential demand curve equation (Hursh & Silberberg, 2008) to calculate elasticity. In contrast, previous studies that found elasticity loaded on Persistence calculated it using two parameter models (Hursh et al., 1988) that make it qualitatively different mathematically. In other words, it may be that the single-parameter exponential derivation generates an estimate of elasticity that is more closely related to the start of the demand curve (intensity) and volume of expenditure (Omax) than the point at which it becomes sensitive to price changes (Pmax) or its terminus, the price at which consumption is zero (breakpoint).
It is also possible that the latent factors in the current study manifested differently because of sample or task characteristics. With regard to sample characteristics, the participants in these samples are best characterized as risky cannabis users based on their CUDIT and MACQ scores, not predominantly individuals with cannabis use disorder, and it may be that elasticity corresponds with intensity and Omax at this level of severity. With regard to task characteristics, it is possible the price structure may lend itself to elasticity estimates that tend to correlate with intensity and Omax. These are of course necessarily speculations, but they may warrant consideration in future investigations.
Last, there is increasing discussion of the influence of the constant, k, which sets a limit on the range of possible elasticity values. Gilroy et al. (2020) discuss the mathematical implications this has for relationships between elasticity, maximum responding (Omax), and price at which maximum responding is reached (Pmax). More specifically, the relationship between elasticity and Pmax is unintentionally weakened where the constant k exists below the recommended lower limits. That being said, the current study evaluated three different k constants, selected the one that optimized overall model fit, and that value is appropriate given the range of values under consideration, making it unlikely to have imposed problematical constraints that would have affected the factor structure. Taken together, the study validates the twofactor latent structure in the purchase task in general (Aston et al., 2017; Bidwell et al., 2012) but suggests that the evolving methods in the field may also influence its expression.
A second important finding was that Amplitude explained a significant amount of variance in CUDIT and MACQ scores in both the Canadian and American samples. Persistence also explained a significant amount of variance in CUDIT and MACQ, but only in the Canadian sample. An examination of beta weights suggests that Amplitude was particularly sensitive to individual differences in cannabis severity and misuse relative to Persistence. These results are consistent with previous findings that Omax and intensity show the most robust associations with alcohol and drug use severity (González-Roz et al., 2019; Kiselica et al., 2016). Furthermore, the lack of association for Persistence in the American sample may possibly be explained by reduced power in the smaller sample. This is partially supported by the observation that the beta weights for Persistence in the American sample (.10) are similar to those observed in the Canadian sample for Persistence (0.12–0.14).
A third notable finding was that Amplitude was more strongly associated with the motivation to change cannabis use than Persistence. More specifically, higher scores on Amplitude and Persistence were associated with increased perceived importance in changing cannabis use and inversely associated with confidence in behavior change in the Canadian sample. An increase in readiness to change was associated with higher scores on only the Amplitude factor in the Canadian sample. There were no relationships between the factors and motivation to change cannabis use in the American sample. Importantly, these differences between samples were not a result of differences in sample means on the motivation to change variables (Table 1).
These inconsistent associations may also suggest that the link between demand and motivation to change is more sample specific. It is possible that demographic differences, such as age and income, or substance involvement level (the American sample reported heavier drinking, more cannabis use, and higher cannabis demand), affected motivation to change. Alternatively, since the Canadian sample is primarily a student sample, there may be greater cognitive and academic consequences, hence why demand was more related to motivation to change in this sample. Similar to findings with cannabis severity and misuse, Amplitude was consistently, and to a greater extent, more sensitive to individual differences in the motivation to change cannabis use. As the motivation to change substance use is important in predicting future behavior change (Bertholet et al., 2012; Hesse, 2006), these findings may be relevant to the sensitivity of treatment interventions, although this is necessarily speculative.
These results must be situated in the context of several methodological considerations. First, as noted above, there were systematic differences in the design of the purchase task used (i.e., grams of cannabis, number of price points used) compared with previous studies, which may have influenced the results, including the underlying factor structure. This difference in task design was deliberate and would be expected to allow for greater resolution and more accurate curve-fitting results (Kaplan et al., 2018), but nonetheless restricts the comparability to previous findings. Second, all choices were for hypothetical cannabis. This is mitigated by previous laboratory studies indicating close correspondence for hypothetical and actual outcomes (Amlung & Mac-Killop, 2015; Amlung et al., 2012), but it is nonetheless a consideration. Last, because of the cross-sectional nature of the study, causality cannot be inferred from higher cannabis reinforcing value to cannabis misuse or vice versa.
An important future direction is examining these relationships longitudinally to identify if elevated cannabis demand drives misuse, whether it is itself an expression of cannabis misuse, or, perhaps most likely, whether it is a recursive etiological process, forecasting increases and commensurately increasing itself over time in a vicious cycle. In other words, initial cannabis use (i.e., experimental phase) gives rise to subsequent use and its progression (or lack thereof), and demand is theoretically operative as greater initial reinforcing value putatively leads to subsequent use and trajectories of progression, including progression to clinically significant levels (e.g., cannabis use disorder). Over time, however, persistent use is also expected to increase the reinforcing value of cannabis itself because of processes such as tolerance and incentive sensitization. Thus, cannabis demand is theoretically implicated both as determinant of use and, over time, as a consequence of use.
Despite these considerations, there were several strengths of the study. Despite the substantive differences between the samples, parallel findings in several cases increased the robustness of the results and the strength of the conclusions. Next, to our knowledge, this is the first study to examine the relationship of underlying factor structure to cannabis misuse and motivation to change. Despite the variability across samples, these findings suggest that cannabis demand may ultimately be useful clinically, suggesting that individuals who are less sensitive to increases in price (elasticity) may require more involved treatment interventions. In fact, demand indices have shown to predict treatment intervention response for both alcohol and tobacco (MacKillop & Murphy, 2007; MacKillop et al., 2016). Last, the use of emerging adults who were heavy episodic drinkers was a strength because it extends the purchase task literature and supports their use in diverse substance-using populations.
However, the use of a heavy episodic drinking population may limit the study's generalizability to the general population of cannabis users, although polysubstance use of alcohol and cannabis is increasingly prevalent (Yurasek et al., 2017). Among individuals with cannabis use disorder, there is an increased likelihood for development of alcohol use disorder (Agosti et al., 2002; Agrawal et al., 2007). Co-use is also associated with an increased risk of impaired driving (Li et al., 2012), psychiatric comorbidity (Midanik et al., 2007), more severe clinical course (Staiger et al., 2013), and more poor prognoses (Subbaraman, 2016). Therefore, examining a substance's reinforcing value in light of co-use becomes relevant and important.
In sum, the current findings provide further evidence that cannabis demand has a binary factor structure and that the latent factors have differential relationships to cannabis misuse and the motivation to change cannabis use. In the current study, the findings implicate Omax, intensity, and elasticity—the constituents of Amplitude—as sensitive indicators of cannabis involvement. Furthermore, the current set of findings supports the utility of the MPT in detecting individual differences among diverse samples, in this case heavy episodic drinkers. From a clinical perspective, analysis of individual demand curves may be informative in designing interventions around individuals displaying high cannabis reinforcement and their responses on readiness to change. Collectively, the current findings are supportive of a modified MPT in a behavioral economic approach to cannabis misuse. As an important future direction, it would be important to examine these relationships over time.
Acknowledgments
The authors are grateful for the contributions of Jane DeJesus, Jessica Gillard, Kyra Farrelly, Riana Lachhman, Allison Wallace, and Dr. Ashley Dennhardt.
Footnotes
James MacKillop is a principal in BEAM Diagnostics Inc, but no BEAM products were used in the study reported. No other authors have declarations. This work was partially funded by the Canadian Institutes of Health Research, the National Institutes of Health, and the Peter Boris Chair in Addictions Research.
References
- Adamson S. J., Kay-Lambkin F. J., Baker A. L., Lewin T. J., Thornton L., Kelly B. J., Sellman J. D. An improved brief measure of cannabis misuse: The Cannabis Use Disorders Identification TestRevised (CUDIT-R) Drug and Alcohol Dependence. 2010;110:137–143. doi: 10.1016/j.drugalcdep.2010.02.017. doi:10.1016/j.drugalcdep.2010.02.017. [DOI] [PubMed] [Google Scholar]
- Agosti V., Nunes E., Levin F. Rates of psychiatric comorbidity among U.S. residents with lifetime cannabis dependence. American Journal of Drug and Alcohol Abuse. 2002;28:643–652. doi: 10.1081/ada-120015873. doi:10.1081/ADA-120015873. [DOI] [PubMed] [Google Scholar]
- Agrawal A., Lynskey M. T., Madden P. A. F., Bucholz K. K., Heath A. C. A latent class analysis of illicit drug abuse/dependence. Results from the National Epidemiological Survey on Alcohol and Related Conditions. Addiction. 2007;102:94–104. doi: 10.1111/j.1360-0443.2006.01630.x. doi:10.1111/j.1360-0443.2006.01630.x. [DOI] [PubMed] [Google Scholar]
- Amlung M., MacKillop J. Further evidence of close correspondence for alcohol demand decision making for hypothetical and incentivized rewards. Behavioural Processes. 2015;113:187–191. doi: 10.1016/j.beproc.2015.02.012. doi:10.1016/j.beproc.2015.02.012. [DOI] [PMC free article] [PubMed] [Google Scholar]
- Amlung M. T., Acker J., Stojek M. K., Murphy J. G., MacKillop J. Is talk “cheap”? An initial investigation of the equivalence of alcohol purchase task performance for hypothetical and actual rewards. Alcoholism: Clinical and Experimental Research. 2012;36:716–724. doi: 10.1111/j.1530-0277.2011.01656.x. doi:10.1111/j.1530-0277.2011.01656.x. [DOI] [PMC free article] [PubMed] [Google Scholar]
- Aston E. R., Farris S. G., MacKillop J., Metrik J. Latent factor structure of a behavioral economic marijuana demand curve. Psychopharmacology. 2017;234:2421–2429. doi: 10.1007/s00213-017-4633-6. doi:10.1007/s00213-017-4633-6. [DOI] [PMC free article] [PubMed] [Google Scholar]
- Aston E. R., Meshesha L. Z. Assessing cannabis demand: A comprehensive review of the marijuana purchase task. Neurotherapeutics. 2020;17:87–99. doi: 10.1007/s13311-019-00819-z. doi:10.1007/s13311-019-00819-z. [DOI] [PMC free article] [PubMed] [Google Scholar]
- Aston E. R., Metrik J., Amlung M., Kahler C. W., MacKillop J. Interrelationships between marijuana demand and discounting of delayed rewards: Convergence in behavioral economic methods. Drug and Alcohol Dependence. 2016;169:141–147. doi: 10.1016/j.drugalcdep.2016.10.014. doi:10.1016/j.drugalcdep.2016.10.014. [DOI] [PMC free article] [PubMed] [Google Scholar]
- Aston E. R., Metrik J., MacKillop J. Further validation of a marijuana purchase task. Drug and Alcohol Dependence. 2015;152:32–38. doi: 10.1016/j.drugalcdep.2015.04.025. doi:10.1016/j.drugalcdep.2015.04.025. [DOI] [PMC free article] [PubMed] [Google Scholar]
- Aston E. R., Metrik J., Rosen R. K., Swift R., MacKillop J. Refining the marijuana purchase task: Using qualitative methods to inform measure development. Experimental and Clinical Psychopharmacology. Advance online publication. 2020 doi: 10.1037/pha0000355. doi:10.1037/pha0000355. [DOI] [PMC free article] [PubMed] [Google Scholar]
- Bertholet N., Gaume J., Faouzi M., Gmel G., Daeppen J.-B. Predictive value of readiness, importance, and confidence in ability to change drinking and smoking. BMC Public Health. 2012;12 doi: 10.1186/1471-2458-12-708. Article number 708. doi:10.1186/1471-2458-12-708. [DOI] [PMC free article] [PubMed] [Google Scholar]
- Bidwell L. C., MacKillop J., Murphy J. G., Tidey J. W., Colby S. M. Latent factor structure of a behavioral economic cigarette demand curve in adolescent smokers. Addictive Behaviors. 2012;37:1257–1263. doi: 10.1016/j.addbeh.2012.06.009. doi:10.1016/j.addbeh.2012.06.009. [DOI] [PMC free article] [PubMed] [Google Scholar]
- Brook J. S., Zhang C., Leukefeld C. G., Brook D. W. Marijuana use from adolescence to adulthood: Developmental trajectories and their outcomes. Social Psychiatry and Psychiatric Epidemiology. 2016;51:1405–1415. doi: 10.1007/s00127-016-1229-0. doi:10.1007/s00127-016-1229-0. [DOI] [PMC free article] [PubMed] [Google Scholar]
- Brunette M. F., Noordsy D. L., Xie H., Drake R. E. Benzodiazepine use and abuse among patients with severe mental illness and cooccurring substance use disorders. Psychiatric Services. 2003;54:1395–1401. doi: 10.1176/appi.ps.54.10.1395. doi:10.1176/appi.ps.54.10.1395. [DOI] [PubMed] [Google Scholar]
- Butt P., Beirness D., Gliksman L., Paradis C., Stockwell T. Ottawa, ON: Canadian Centre on Substance Use and Addiction; 2011. Alcohol and health in Canada: A summary of evidence and guidelines for low-risk drinking. Retrieved from https://www.ccsa.ca/alcohol-and-health-canada-summary-evidence-and-guidelines-low-risk-drinking. [Google Scholar]
- Canadian Centre on Substance Use and Addiction. Cannabis (Canadian Drug Summary). 2018 Retrieved from https://www.ccsa.ca/cannabis-canadian-drug-summary.
- Chen C. Y., Storr C. L., Anthony J. C. Early-onset drug use and risk for drug dependence problems. Addictive Behaviors. 2009;34:319–322. doi: 10.1016/j.addbeh.2008.10.021. doi:10.1016/j.addbeh.2008.10.021. [DOI] [PMC free article] [PubMed] [Google Scholar]
- Collins R. L., Vincent P. C., Yu J., Liu L., Epstein L. H. A behavioral economic approach to assessing demand for marijuana. Experimental and Clinical Psychopharmacology. 2014;22:211–221. doi: 10.1037/a0035318. doi:10.1037/a0035318. [DOI] [PMC free article] [PubMed] [Google Scholar]
- Collins S. E., Logan D. E., Neighbors C. Which came first: The readiness or the change? Longitudinal relationships between readiness to change and drinking among college drinkers. Addiction. 2010;105:1899–1909. doi: 10.1111/j.1360-0443.2010.03064.x. doi:10.1111/j.1360-0443.2010.03064.x. [DOI] [PMC free article] [PubMed] [Google Scholar]
- Gilroy S. P., Kaplan B. A., Reed D. D. Interpretation(s) of elasticity in operant demand. Journal of the Experimental Analysis of Behavior. 2020;114:106–115. doi: 10.1002/jeab.610. doi:10.1002/jeab.610. [DOI] [PubMed] [Google Scholar]
- González-Roz A., Jackson J., Murphy C., Rohsenow D. J., MacKillop J. Behavioral economic tobacco demand in relation to cigarette consumption and nicotine dependence: A meta-analysis of cross-sectional relationships. Addiction. 2019;114:1926–1940. doi: 10.1111/add.14736. doi.org/10.1111/add.14736. [DOI] [PMC free article] [PubMed] [Google Scholar]
- Gray J. C., Amlung M. T., Palmer A. A., MacKillop J. Syntax for calculation of discounting indices from the monetary choice questionnaire and probability discounting questionnaire. Journal of the Experimental Analysis of Behavior. 2016;106:156–163. doi: 10.1002/jeab.221. doi:10.1002/jeab.221. [DOI] [PMC free article] [PubMed] [Google Scholar]
- Green K. M., Musci R. J., Johnson R. M., Matson P. A., Reboussin B. A., Ialongo N. S. Outcomes associated with adolescent marijuana and alcohol use among urban young adults: A prospective study. Addictive Behaviors. 2016;53:155–160. doi: 10.1016/j.addbeh.2015.10.014. doi:10.1016/j.addbeh.2015.10.014. [DOI] [PMC free article] [PubMed] [Google Scholar]
- Greenwald M. K., Hursh S. R. Behavioral economic analysis of opioid consumption in heroin-dependent individuals: Effects of unit price and pre-session drug supply. Drug and Alcohol Dependence. 2006;85:35–48. doi: 10.1016/j.drugalcdep.2006.03.007. doi:10.1016/j.drugalcdep.2006.03.007. [DOI] [PubMed] [Google Scholar]
- Gruber S. A., Sagar K. A., Dahlgren M. K., Racine M., Lukas S. E. Age of onset of marijuana use and executive function. Psychology of Addictive Behaviors. 2012;26:496–506. doi: 10.1037/a0026269. doi:10.1037/a0026269. [DOI] [PMC free article] [PubMed] [Google Scholar]
- Hasin D. S., Sarvet A. L., Cerdá M., Keyes K. M., Stohl M., Galea S., Wall M. M. US adult illicit cannabis use, cannabis use disorder, and medical marijuana laws: 1991–1992 to 2012-2013. JAMA Psychiatry. 2017;74:579–588. doi: 10.1001/jamapsychiatry.2017.0724. doi:10.1001/jamapsychiatry.2017.0724. [DOI] [PMC free article] [PubMed] [Google Scholar]
- Hayaki J., Anderson B. J., Stein M. D. Dual cannabis and alcohol use disorders in young adults: Problems magnified. Substance Abuse. 2016;37:579–583. doi: 10.1080/08897077.2016.1176613. doi:10.1080/08897077.2016.1176613. [DOI] [PMC free article] [PubMed] [Google Scholar]
- Hesse M. The Readiness Ruler as a measure of readiness to change poly-drug use in drug abusers. Harm Reduction Journal. 2006;3 doi: 10.1186/1477-7517-3-3. Article number 3. doi:10.1186/1477-7517-3-3. [DOI] [PMC free article] [PubMed] [Google Scholar]
- Hindocha C., Lawn W., Freeman T. P., Curran H. V. Individual and combined effects of cannabis and tobacco on drug reward processing in non-dependent users. Psychopharmacology. 2017;234:3153–3163. doi: 10.1007/s00213-017-4698-2. doi:10.1007/s00213-017-4698-2. [DOI] [PMC free article] [PubMed] [Google Scholar]
- Hungund B. L., Basavarajappa B. S. Role of endocannabinoids and cannabinoid CB1 receptors in alcohol-related behaviors. Annals of the New York Academy of Sciences. 2004;1025:515–527. doi: 10.1196/annals.1316.064. doi:10.1196/annals.1316.064. [DOI] [PubMed] [Google Scholar]
- Hursh S. R. Economic concepts for the analysis of behavior. Journal of the Experimental Analysis of Behavior. 1980;34:219–238. doi: 10.1901/jeab.1980.34-219. doi:10.1901/jeab.1980.34-219. [DOI] [PMC free article] [PubMed] [Google Scholar]
- Hursh S. R. Behavioral economics. Journal of the Experimental Analysis of Behavior. 1984;42:435–452. doi: 10.1901/jeab.1984.42-435. doi:10.1901/jeab.1984.42-435. [DOI] [PMC free article] [PubMed] [Google Scholar]
- Hursh S. R., Galuska C. M., Winger G., Woods J. H. The economics of drug abuse: A quantitative assessment of drug demand. Molecular Interventions. 2005;5:20–28. doi: 10.1124/mi.5.1.6. doi:10.1124/mi.5.1.6. [DOI] [PubMed] [Google Scholar]
- Hursh S. R., Raslear T. G., Shurtleff D., Bauman R., Simmons L. A cost-benefit analysis of demand for food. Journal of the Experimental Analysis of Behavior. 1988;50:419–440. doi: 10.1901/jeab.1988.50-419. doi:10.1901/jeab.1988.50-419. [DOI] [PMC free article] [PubMed] [Google Scholar]
- Hursh S. R., Roma P. G. Behavioral economics and the analysis of consumption and choice. Managerial and Decision Economics. 2016;37:224–238. doi:10.1002/mde.2724. [Google Scholar]
- Hursh S. R., Silberberg A. Economic demand and essential value. Psychological Review. 2008;115:186–198. doi: 10.1037/0033-295X.115.1.186. doi:10.1037/0033-295X.115.1.186. [DOI] [PubMed] [Google Scholar]
- Jacobs E. A., Bickel W. K. Modeling drug consumption in the clinic using simulation procedures: Demand for heroin and cigarettes in opioid-dependent outpatients. Experimental and Clinical Psychopharmacology. 1999;7:412–426. doi: 10.1037//1064-1297.7.4.412. doi:10.1037/1064-1297.7.4.412. [DOI] [PubMed] [Google Scholar]
- Jöreskog K. G. How large can a standardized coefficient be? 1999 Retrieved from http://www.statmodel.com/download/Joreskog.pdf.
- Kaiser H. F. The application of electronic computers to factor analysis. Educational and Psychological Measurement. 1960;20:141–151. doi:10.1177/001316446002000116. [Google Scholar]
- Kaplan B. A., Foster R. N. S., Reed D. D., Amlung M., Murphy J. G., MacKillop J. Understanding alcohol motivation using the alcohol purchase task: A methodological systematic review. Drug and Alcohol Dependence. 2018;191:117–140. doi: 10.1016/j.drugalcdep.2018.06.029. doi:10.1016/j.drugalcdep.2018.06.029. [DOI] [PubMed] [Google Scholar]
- Kiselica A. M., Webber T. A., Bornovalova M. A. Validity of the alcohol purchase task: A meta-analysis. Addiction. 2016;111:806–816. doi: 10.1111/add.13254. doi:10.1111/add.13254. [DOI] [PubMed] [Google Scholar]
- Koffarnus M. N., Franck C. T., Stein J. S., Bickel W. K. A modified exponential behavioral economic demand model to better describe consumption data. Experimental and Clinical Psychopharmacology. 2015;23:504–512. doi: 10.1037/pha0000045. doi:10.1037/pha0000045. [DOI] [PMC free article] [PubMed] [Google Scholar]
- Li M. C., Brady J. E., DiMaggio C. J., Lusardi A. R., Tzong K. Y., Li G. Marijuana use and motor vehicle crashes. Epidemiologic Reviews. 2012;34:65–72. doi: 10.1093/epirev/mxr017. doi:10.1093/epirev/mxr017. [DOI] [PMC free article] [PubMed] [Google Scholar]
- Lukas S. E., Orozco S. Ethanol increases plasma (9)-tetrahydrocannabinol (THC) levels and subjective effects after marihuana smoking in human volunteers. Drug and Alcohol Dependence. 2001;64:143–149. doi: 10.1016/s0376-8716(01)00118-1. doi:10.1016/S0376-8716(01)00118-1. [DOI] [PubMed] [Google Scholar]
- MacKillop J., Murphy J. G. A behavioral economic measure of demand for alcohol predicts brief intervention outcomes. Drug and Alcohol Dependence. 2007;89:227–233. doi: 10.1016/j.drugalcdep.2007.01.002. doi:10.1016/j.drugalcdep.2007.01.002. [DOI] [PubMed] [Google Scholar]
- MacKillop J., Murphy C. M., Martin R. A., Stojek M., Tidey J. W., Colby S. M., Rohsenow D. J. Predictive validity of a cigarette purchase task in a randomized controlled trial of contingent vouchers for smoking in individuals with substance use disorders. Nicotine & Tobacco Research. 2016;18:531–537. doi: 10.1093/ntr/ntv233. doi:10.1093/ntr/ntv233. [DOI] [PMC free article] [PubMed] [Google Scholar]
- MacKillop J., Murphy J. G., Tidey J. W., Kahler C. W., Ray L. A., Bickel W. K. Latent structure of facets of alcohol reinforcement from a behavioral economic demand curve. Psychopharmacology. 2009;203:33–40. doi: 10.1007/s00213-008-1367-5. doi:10.1007/s00213-008-1367-5. [DOI] [PMC free article] [PubMed] [Google Scholar]
- Maisto S. A., Krenek M., Chung T., Martin C. S., Clark D., Cornelius J. Comparison of the concurrent and predictive validity of three measures of readiness to change marijuana use in a clinical sample of adolescents. Journal of Studies on Alcohol and Drugs. 2011;72:592–601. doi: 10.15288/jsad.2011.72.592. doi:10.15288/jsad.2011.72.592. [DOI] [PMC free article] [PubMed] [Google Scholar]
- Malinen H., Hyytiä P. Ethanol self-administration is regulated by CB1 receptors in the nucleus accumbens and ventral tegmental area in alcohol-preferring AA rats. Alcoholism: Clinical and Experimental Research. 2008;32:1976–1983. doi: 10.1111/j.1530-0277.2008.00786.x. doi:10.1111/j.1530-0277.2008.00786.x. [DOI] [PubMed] [Google Scholar]
- Metrik J., Aston E. R., Kahler C. W., Rohsenow D. J., McGeary J. E., Knopik V. S. Marijuana's acute effects on cognitive bias for affective and marijuana cues. Experimental and Clinical Psychopharmacology. 2015;23:339–350. doi: 10.1037/pha0000030. doi:10.1037/pha0000030. [DOI] [PMC free article] [PubMed] [Google Scholar]
- Metrik J., Aston E. R., Kahler C. W., Rohsenow D. J., McGeary J. E., Knopik V. S., MacKillop J. Cue-elicited increases in incentive salience for marijuana: Craving, demand, and attentional bias. Drug and Alcohol Dependence. 2016;167:82–88. doi: 10.1016/j.drugalcdep.2016.07.027. doi:10.1016/j.drugalcdep.2016.07.027. [DOI] [PMC free article] [PubMed] [Google Scholar]
- Midanik L. T., Tam T. W., Weisner C. Concurrent and simultaneous drug and alcohol use: Results of the 2000 National Alcohol Survey. Drug and Alcohol Dependence. 2007;90:72–80. doi: 10.1016/j.drugalcdep.2007.02.024. doi:10.1016/j.drugalcdep.2007.02.024. [DOI] [PMC free article] [PubMed] [Google Scholar]
- Murphy J. G., MacKillop J. Relative reinforcing efficacy of alcohol among college student drinkers. Experimental and Clinical Psychopharmacology. 2006;14:219–227. doi: 10.1037/1064-1297.14.2.219. doi:10.1037/1064-1297.14.2.219. [DOI] [PubMed] [Google Scholar]
- O’Connor R. J., Heckman B. W., Adkison S. E., Rees V. W., Hatsukami D. K., Bickel W. K., Cummings K. M. Persistence and amplitude of cigarette demand in relation to quit intentions and attempts. Psychopharmacology. 2016;233:2365–2371. doi: 10.1007/s00213-016-4286-x. doi:10.1007/s00213-016-4286-x. [DOI] [PMC free article] [PubMed] [Google Scholar]
- Pape H., Rossow I., Storvoll E. E. Under double influence: Assessment of simultaneous alcohol and cannabis use in general youth populations. Drug and Alcohol Dependence. 2009;101:69–73. doi: 10.1016/j.drugalcdep.2008.11.002. doi:10.1016/j.drugalcdep.2008.11.002. [DOI] [PubMed] [Google Scholar]
- Patel H., Amlung M. Elevated cannabis demand is associated with driving after cannabis use in a crowd-sourced sample of adults. Experimental and Clinical Psychopharmacology. 2019;27:109–114. doi: 10.1037/pha0000240. doi:10.1037/pha0000240. [DOI] [PubMed] [Google Scholar]
- Prochaska J. O. Decision making in the transtheoretical model of behavior change. Medical Decision Making. 2008;28:845–849. doi: 10.1177/0272989X08327068. doi:10.1177/0272989X08327068. [DOI] [PubMed] [Google Scholar]
- Roma P. G., Hursh S. R., Hudja S. Hypothetical purchase task questionnaires for behavioral economic assessments of value and motivation. Managerial and Decision Economics. 2016;37:306–323. doi:10.1002/mde.2718. [Google Scholar]
- Rotermann M. Analysis of trends in the prevalence of cannabis use and related metrics in Canada. Health Reports. 2019;30:3–13. doi: 10.25318/82-003-x201900600001-eng. doi:10.25318/82-003-x201900600001-eng. [DOI] [PubMed] [Google Scholar]
- Simons J. S., Dvorak R. D., Merrill J. E., Read J. P. Dimensions and severity of marijuana consequences: Development and validation of the Marijuana Consequences Questionnaire (MACQ) Addictive Behaviors. 2012;37:613–621. doi: 10.1016/j.addbeh.2012.01.008. doi:10.1016/j.addbeh.2012.01.008. [DOI] [PMC free article] [PubMed] [Google Scholar]
- Staiger P. K., Richardson B., Long C. M., Carr V., Marlatt G. A. Overlooked and underestimated? Problematic alcohol use in clients recovering from drug dependence. Addiction. 2013;108:1188–1193. doi: 10.1111/j.1360-0443.2012.04075.x. doi:10.1111/j.1360-0443.2012.04075.x. [DOI] [PubMed] [Google Scholar]
- Stein J. S., Koffarnus M. N., Snider S. E., Quisenberry A. J., Bickel W. K. Identification and management of nonsystematic purchase task data: Toward best practice. Experimental and Clinical Psychopharmacology. 2015;23:377–386. doi: 10.1037/pha0000020. doi:10.1037/pha0000020. [DOI] [PMC free article] [PubMed] [Google Scholar]
- Strickland J. C., Lile J. A., Stoops W. W. Unique prediction of cannabis use severity and behaviors by delay discounting and behavioral economic demand. Behavioural Processes. 2017;140:33–40. doi: 10.1016/j.beproc.2017.03.017. doi:10.1016/j.beproc.2017.03.017. [DOI] [PMC free article] [PubMed] [Google Scholar]
- Subbaraman M. S. Substitution and complementarity of alcohol and cannabis: A review of the literature. Substance Use & Misuse. 2016;51:1399–1414. doi: 10.3109/10826084.2016.1170145. doi:10.3109/10826084.2016.1170145. [DOI] [PMC free article] [PubMed] [Google Scholar]
- Subbaraman M. S., Kerr W. C. Simultaneous versus concurrent use of alcohol and cannabis in the National Alcohol Survey. Alcoholism: Clinical and Experimental Research. 2015;39:872–879. doi: 10.1111/acer.12698. doi:10.1111/acer.12698. [DOI] [PMC free article] [PubMed] [Google Scholar]
- Substance Abuse and Mental Health Services Administration. 2018 2017 NSDUH Annual National Report | CBHSQ Data. Retrieved from https://www.samhsa.gov/data/report/2017-nsduh-annual-national-report.
- Teeters J. B., Pickover A. M., Dennhardt A. A., Martens M. P., Murphy J. G. Elevated alcohol demand is associated with driving after drinking among college student binge drinkers. Alcoholism: Clinical and Experimental Research. 2014;38:2066–2072. doi: 10.1111/acer.12448. doi:10.1111/acer.12448. [DOI] [PubMed] [Google Scholar]
- Terry-McElrath Y. M., O’Malley P. M., Johnston L. D. Simultaneous alcohol and marijuana use among U.S. high school seniors from 1976 to 2011: Trends, reasons, and situations. Drug and Alcohol Dependence. 2013;133:71–79. doi: 10.1016/j.drugalcdep.2013.05.031. doi:10.1016/j.drugalcdep.2013.05.031. [DOI] [PMC free article] [PubMed] [Google Scholar]
- Terry-McElrath Y. M., O’Malley P. M., Johnston L. D., Bray B. C., Patrick M. E., Schulenberg J. E. Longitudinal patterns of marijuana use across ages 18–50 in a US national sample: A descriptive examination of predictors and health correlates of repeated measures latent class membership. Drug and Alcohol Dependence. 2017;171:70–83. doi: 10.1016/j.drugalcdep.2016.11.021. doi:10.1016/j.drugalcdep.2016.11.021. [DOI] [PMC free article] [PubMed] [Google Scholar]
- Trull T. J., Wycoff A. M., Lane S. P., Carpenter R. W., Brown W. C. Cannabis and alcohol use, affect and impulsivity in psychiatric out-patients’ daily lives. Addiction. 2016;111:2052–2059. doi: 10.1111/add.13471. doi:10.1111/add.13471. [DOI] [PMC free article] [PubMed] [Google Scholar]
- Volkow N. D., Baler R. D., Compton W. M., Weiss S. R. B. Adverse health effects of marijuana use. The New England Journal of Medicine. 2014;370:2219–2227. doi: 10.1056/NEJMra1402309. doi:10.1056/NEJMra1402309. [DOI] [PMC free article] [PubMed] [Google Scholar]
- Yurasek A. M., Aston E. R., Metrik J. Co-use of alcohol and cannabis: A review. Current Addiction Reports. 2017;4:184–193. doi: 10.1007/s40429-017-0149-8. doi:10.1007/s40429-017-0149-8. [DOI] [PMC free article] [PubMed] [Google Scholar]
- Zvorsky I., Nighbor T. D., Kurti A. N., DeSarno M., Naudé G., Reed D. D., Higgins S. T. Sensitivity of hypothetical purchase task indices when studying substance use: A systematic literature review. Preventive Medicine. 2019;128:105789. doi: 10.1016/j.ypmed.2019.105789. doi:10.1016/j.ypmed.2019.105789. [DOI] [PMC free article] [PubMed] [Google Scholar]