Abstract
Here we describe a simple method to measure larval muscle contraction and locomotion behavior. The method enables the user to acquire data, without the necessity of using expensive equipment ( Rotstein et al., 2018 ). To measure contraction and locomotion behaviour, single larvae are positioned at the center of a humidified Petri dish. Larval movement is recorded over time using the movie function of a consumer digital camera. Subsequently, videos are analyzed using ImageJ ( Rueden et al., 2017 ) for distance measurements and counting of contractions. Data are represented as box or scatter plots using GraphPad Prism (©GraphPad Software).
Keywords: Locomotion, Video analysis, Drosophila melanogaster, Crawling, Muscle contraction
Background
It is well known that despite other factors, the composition of the surrounding extracellular matrix (ECM) is of great relevance for proper organ functionality. Changes in its composition can ultimately lead to organ malfunction or failure. Using the muscles of third instar wandering larvae as a model, we can assess the influence of the concentration of single ECM proteins on meshwork flexibility or strength with larval locomotion behavior as a readout. In general, this is also possible for first or second instar larvae, but we decided to use wandering third instar larvae due to their large body size. For precise aging of Drosophila larvae, we refer to the descriptions given by Demerec (1950).
A wide range of methods for measuring Drosophila melanogaster larvae crawling has arisen in recent years. Techniques such as FIM2c ( Risse et al., 2017 ) enable the user to study locomotion in a detailed manner; however, they require a specialized set of equipment. The simple test described herein allows the recording of differences in crawling speed and muscle contractibility with tools that can most likely be found in every laboratory or students classroom. The method is based on a protocol published by Nichols et al. (2012) . However, instead of using agar-filled plates, we conducted our experiments in humidified, empty Petri dishes. Thereby, we eliminate the problem of larvae digging into the agar, which can negatively influence the measurement of Z-direction crawling, leading to a loss of information.
Materials and Reagents
Polystyrene Petri dish 92 x 16 mm with ventilation cams (SARSTEDT, catalog number: 82.1473.001)
Paintbrush, Marabu Universal round No. 1 or comparable (Marabu, catalog number: 4007751346186)
Graph paper (0.2 cm2 grids) (LANDRÉ, catalog number: 100050441 or comparable)
Third instar wandering larvae of respective strains (e.g., w1118, BL3605)
Tap water
Equipment
QuickMistTM Spray bottle (Dynamo, catalog number: 605144)
Stereomicroscope (ZEISS, model: Stemi 2000-C) with an attached light source (SCHOTT, model: KL 200 LED)
Canon EOS 1000D (Canon, model: EOS 1000D) (or similar camera with attachable microscope tube and video function. Alternatively, any digital camera with capability to focus objects in the distance range of 5-10 cm and video function is suitable. A tripod or reproduction stand should be at hand)
Software
FIJI 2.0.0 ( Schindelin et al., 2012 ) or ImageJ 2.0.0 ( Rueden et al., 2017 )
GraphPad Prism 5 (©GraphPad Software) or comparable software with a scatter plot or box plot tool (The R Project for Statistical Computing, R Core Team (2013))
Procedure
Place the empty Petri dish on a sheet of graph paper under a stereomicroscope.
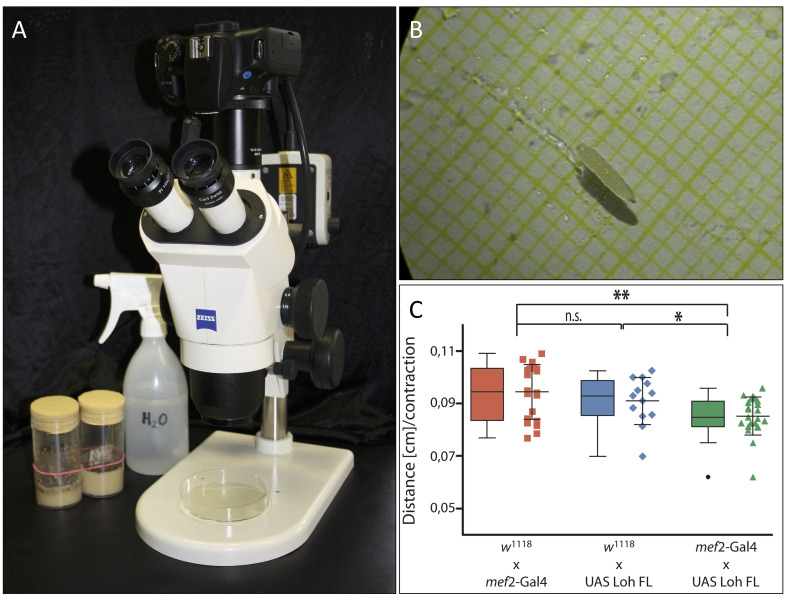
Attach the camera to the stereomicroscope and adjust all settings so that the Petri dish is in focus on the camera (Figure 1A).
Sprinkle the Petri dish surface with tap water from the spray bottle to hinder larvae from sticking to the dry surface and beginning pupation. A very thin film of water is sufficient. Avoid flooding the Petri dish with water.
Transfer a third instar larva from its vial to the middle of the Petri dish using a wet paintbrush (Figure 1B).
Start the video and continue filming until the larva has crawled for at least 10 sec straight without tumbling, stopping or turning (see Video 1). This does not always occur right away. Using a wet paintbrush, you may have to move the larva back into focus from time to time. If the larva crawls for a shorter time period, it may not reach the maximum continuous speed and therefore all measurements of shorter time periods should be discarded.
Repeat until you reached the desired n.
Figure 1. Experimental setup and data representation.
A. Experimental setup. Camecoora attached to the stereomicroscope with the Petri dish placed underneath. B. Third instar larva in humidified Petri dish. The underlying graph paper is clearly visible. C. Graphical output of acquired data made via GraphPad Prism (©GraphPad Software).
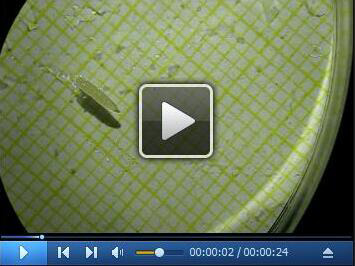
Video 1. Video of a wildtypic third instar larva.

The video depicts a successful recording of a wildtypic third instar larva crawling straight forward without turning, tumbling or stopping for more than 10 sec.
Data analysis
Open recorded videos with FIJI or ImageJ ( Rueden et al., 2017 ) and note first and last second of a 10 s time frame in which the larva crawled in a straight line.
Mark the end of the larva at the beginning and end of the 10 sec window.
Calculate the crawling distance using the visible graph paper.
Count the number of body contractions within the same time frame.
By dividing the crawled distance by the number of contractions you calculate the distance per contraction for the individual animal.
Import all calculated values into GraphPad Prism and use the scatter plot or box plot tool to visualize them graphically. This type of graph best illustrates which data sets are within or above/below average (Figure 1C).
Notes
Only collect animals of the same age (e.g., third instar wandering larvae that already left the fly food crawling upwards within the vial) for better reproducibility between individual animals. Furthermore, it is important that the fly vials are not overpopulated, as larvae tend to be smaller in overcrowded vials due to food competition.
Please also note that illumination of the stereomicroscope, depending on the light source, will produce heat and potentially cause evaporation of the tap water in the Petri dish. Therefore, you may have to replenish the water film within the Petri dish during the experiment. Experiments were conducted at room temperature. Keep in mind that temperature differences may impact crawling behavior and all experiments should, therefore, be performed under similar conditions. The use of a camera attached to a stereomicroscope is recommended because it also allows measuring locomotion of first or second instar larvae more easily than standard macro equipment.
Acknowledgments
We would like to thank Mareike Panz, Benjamin Hallier, Ronja Schiemann and Heiko Harten for initial experiments with this method. We also thank Caldwell et al. (2003) and Nichols et al. (2012) who published an earlier version of this method and the SFB 944 for funding. Stocks obtained from the Bloomington Drosophila Stock Center (NIH P40OD018537) were used in this study. All authors declare no conflicting or competing interests.
Citation
Readers should cite both the Bio-protocol article and the original research article where this protocol was used.
References
- 1. Caldwell J. C., Miller M. M., Wing S., Soll D. R. and Eberl D. F.(2003). Dynamic analysis of larval locomotion in Drosophila chordotonal organ mutants . Proc Natl Acad Sci U S A 100(26): 16053-16058. [DOI] [PMC free article] [PubMed] [Google Scholar]
- 2. Demerec M.(1950). Biology of Drosophila. Wiley& Sons, Inc. New York. [Google Scholar]
- 3. Nichols C. D., Becnel J. and Pandey U. B.(2012). Methods to assay Drosophila behavior . J Vis Exp(61): 3795. [DOI] [PMC free article] [PubMed] [Google Scholar]
- 4. R Core Team(2013). R: A language and environment for statistical computing. R Foundation for Statistical Computing, Vienna, Austria.
- 5. Risse B., Otto N., Berh D., Xiaoyi J., Kiel M. and Klambt C.(2017). FIM2c: Multicolor, multipurpose imaging system to manipulate and analyze animal behavior. IEEE Trans Biomed Eng 64(3): 610-620. [DOI] [PubMed] [Google Scholar]
- 6. Rotstein B., Post Y., Reinhardt M., Lammers K., Buhr A., Heinisch J. J., Meyer H. and Paululat A.(2018). Distinct domains in the matricellular protein Lonely heart are crucial for cardiac extracellular matrix formation and heart function in Drosophila . J Biol Chem 293(20), pp.7864-7879. [DOI] [PMC free article] [PubMed] [Google Scholar]
- 7. Rueden C. T., Schindelin J., Hiner M. C., DeZonia B. E., Walter A. E., Arena E. T. and Eliceiri K. W.(2017). ImageJ2: ImageJ for the next generation of scientific image data. BMC Bioinformatics 18(1): 529. [DOI] [PMC free article] [PubMed] [Google Scholar]
- 8. Schindelin J., Arganda-Carreras I., Frise E., Kaynig V., Longair M., Pietzsch T., Preibisch S., Rueden C., Saalfeld S., Schmid B., Tinevez J. Y., White D. J., Hartenstein V., Eliceiri K., Tomancak P. and Cardona A.(2012). Fiji: an open-source platform for biological-image analysis. Nat Methods 9(7): 676-682. [DOI] [PMC free article] [PubMed] [Google Scholar]


