Abstract
This is a protocol for quantitative determination of storage and total carbohydrates in algae and cyanobacteria. The protocol is simple, fast and sensitive and it requires only few standard chemicals. Great advantage of this protocol is that both storage and total saccharides can be determined in the cellular pellets that were already used for chlorophyll and carotenoids quantification. Since it is recommended to perform the pigments measurement in triplicates, each pigment analysis can generate samples for both total saccharide and glycogen/starch content quantification.
The protocol was applied for quantification of both storage and total carbohydrates in cyanobacteria Synechocystis sp. PCC 6803, Cyanothece sp. ATCC 51142 and Cyanobacterium sp. IPPAS B-1200. It was also applied for estimation of storage polysaccharides in Galdieria (IPPAS P-500, IPPAS P-507, IPPAS P-508, IPPAS P-513), Cyanidium caldarium IPPAS P-510, in green algae Chlorella sp. IPPAS C-1 and C-1210, Parachlorella kessleri IPPAS C-9, Nannochloris sp. C-1509, Coelastrella sp. IPPAS H-626, Haematococcus sp. IPPAS H-629 and H-239, and in Eustigmatos sp. IPPAS H-242 and IPPAS C-70.
Keywords: Sugars, Carbohydrates, Polysaccharides, Colorimetry, Spectrophotometry, Synechocystis, Chlorella, Haematococcus
Background
Carbohydrates play a number of roles in the metabolism of algae and cyanobacteria. As nicely summarized by Raven and Beardall (Raven and Beardall, 2003), carbohydrates represent major sink of intermediates in carbon reduction/oxidation pathways (photosynthesis and photorespiration), they provide skeletons required for growth (e.g., for amino-acid or cell wall biosynthesis), they represent sources of ATP and reducing equivalents (through respiration pathways), they serve as compatible solutes, they are essential for maintaining cellular turgor (by securing rigid structure of the cell wall) and they can scavenge free radicals. Storage polysaccharides (of which the main forms in algae and cyanobacteria are starch and glycogen) that serve as both energy and carbon source, buffer the disproportion between the carbohydrates production and consumption rates, and allow for active metabolism (e.g., nitrogen fixation) in the dark periods.
Carbohydrates are routinely analyzed in many life science laboratories. The saccharides content can be quantified by a wide range of chemical (e.g., chromatographic), biochemical (e.g., gravimetric, colorimetric, enzymatic) or physical (e.g., polarimetry) methods. The estimation of storage carbohydrates as described in this protocol represents a combination of starch/glycogen purification according to the previous studies ( Schneegurt et al., 1994 ; Bandyopadhyay et al., 2010 ; Sinetova et al., 2012 ), starch/glycogen decomposition in acidic environment and free glucose determination by the classical phenol-sulfuric acid method ( Dubois et al., 1956 ; Masuko et al., 2005 ). Total carbohydrates estimation consists of simple resuspension of the cellular pellet (after extraction of chlorophyll and carotenoids) in phenol solution and hydrolyzation of cellular saccharides by sulfuric acid.
The advantages of this protocol are simplicity, sensitivity and quickness. The carbohydrates/glycogen/starch estimation requires only several standard reagents, which makes this protocol much simpler and cheaper when compared to protocols that include enzymatic cleavage of glycogen (De Porcellinis et al., 2017 ; Khan et al., 2018 ), enzymatic determination of free glucose ( Bandyopadhyay et al., 2010 ; Sinetova et al., 2012 ; Khan et al., 2018 ) or extensive amounts of chemicals ( Khan et al., 2018 ). Another advantage of this protocol is that only 1 ml of diluted culture suspension is needed for the analysis (for further details see Note 1) which is significantly lower amount than required in other protocols (De Porcellinis et al., 2017 ). Additionally, saccharides/glycogen/starch measurement can be performed on the same samples that were originally used for determination of chlorophyll and carotenoids content ( Sinetova et al., 2012 ).
On the other hand, this protocol is not as specific for determination of storage polysaccharides as the enzymatic assays (De Porcellinis et al., 2017 ) since glycogen or starch are distinguished only partially from other cellular polysaccharides (e.g., from polysaccharides of the cell wall). Another limitation is using D-glucose as a calibration standard since various carbohydrates that are present in the cells differ in the absorption spectra ( Dubois et al., 1956 ; Masuko et al., 2005 ). Nevertheless, even with these limitations, this cheap, simple and fast protocol is suitable for rough estimation of carbohydrates content in algae and cyanobacteria.
Materials and Reagents
Safe-lock tubes 1.5 ml SafeSeal (SARSTEDT, catalog number: 72.706.400)
Rotilabo® Sealing clips for the safe-lock tubes tubes (Carl Roth, catalog number: N217.1)
Holders for the safe-lock tubes (VWR, catalog number: 30128-282)
96-well microplates (type P) with the original lids (Cole-Parmer, catalog numbers: EW-07903-80 and EW-07903-86)
-
Pipette tips
Standard tips: 20-200 μl, 100-1,000 μl (Mettler-Toledo International, catalog numbers: 17001118 and 17001129)
Tips with filters: 20-200 μl (Mettler-Toledo International, catalog number: 17014963)
Reservoir for a multichannel pipette 60 ml (BrandTech Scientific, catalog number: 703459)
Aluminum foil (optional)
Cyanobacterial/algae culture
Methanol ≥ 99.9% (Alfa Aesar, catalog number: 41467.K7)
Phenol (Sigma-Aldrich, catalog number: P1037)
Potassium hydroxide p.a. (Ing. Petr Švec - PENTA, catalog number: 15520-31000)
Ethanol 96% (Merck, catalog number: 1590102500)
Sulfuric acid 96% (Ing. Petr Švec - PENTA, catalog number: 20370-11000)
D-glucose (Sigma-Aldrich, catalog number: G8270)
Distilled/double deionized water
Sodium hydroxide (Ing. Petr Švec - PENTA, catalog number: 15760-31000)
Hydrochloric acid (Ing. Petr Švec - PENTA, catalog number: 19360-11000)
Glucose calibration series (see Recipes)
Equipment
-
Pipettes
20-200 μl (Mettler-Toledo International, catalog number: 17014391)
100-1,000 μl (Mettler-Toledo International, catalog number: 17014382)
Multichannel pipette 20-200 μl (Mettler-Toledo International, catalog number: 17013805)
Fridge 4 °C, freezer -20 °C (LIEBHERR, model: LCexv 4010, catalog number: 9005382197172), optionally -80 °C (RevcoTM ExF -86 °C Upright Ultra-Low Temperature Freezer, Thermo Fisher Scientific, catalog number: EXF24086V)
Fume hood (MERCI, model: M 1500, catalog number: 2D100110200001)
Refrigerated centrifuge (Sigma Laborzentrifugen, model: Sigma 1-16K, catalog number: 10030)
Vacuum Concentrator (Eppendorf, model: Concentrator plus, catalog number: 5305000100)
Analytical balances with an accuracy of 10 μg (Sartorius, catalog number: SECURA225D-1OBR)
Microplate spectrophotometer (Thermo Fisher Scientific, model: MultiskanTM GO, catalog number: 51119300)
Procedure
-
Harvesting biomass
Harvest 1 ml of cyanobacterial culture suspension of OD730 0.1-0.5 (Note 1).
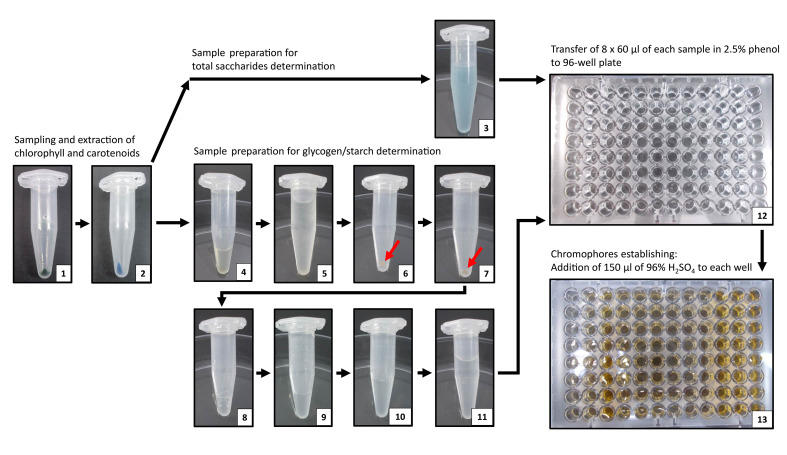
Centrifuge the cells at 15,000 × g, laboratory temperature for 5 min and thoroughly discard the supernatant (Figure 1.1).
For long-term storage, keep the samples at -80 °C and thaw on ice before further analysis.
-
Extracting chlorophyll and carotenoids from the cells (Note 2)
Add 1 ml of methanol, precooled to 4 °C.
Homogenize the sample by gentle pipetting up and down.
In case of pigments quantification, cover the samples with aluminum foil.
Extract pigments from the cells by allowing the samples to sit at 4 °C in the dark for 20 min.
Centrifuge the samples at 15,000 × g, 4 °C for 5 min and visually check pellet; it should be bluish (or purple) with no green color. If the pellet is green, repeat Steps B3-B4.
Thoroughly discard all methanol supernatant by pipette (Figure 1.2). Keep the pellets for further analysis of total saccharides or starch/glycogen.
Optionally, measure the concentration of chlorophyll and carotenoids in the methanol supernatant using a spectrophotometer according to Zavřel et al. (2015a) .
For long-term storage, keep the pellets without chlorophyll and carotenoids at -80 °C and thaw on ice before further analysis.
-
Preparing samples for determination of total cellular saccharides
Sample the culture and extract chlorophyll and carotenoids from the cells as described in Procedure A and B.
Add 500 μl of distilled water to each safe-lock tube with cellular pellet and mix well with a pipette.
Move to the fume hood.
Prepare 5% phenol (w/w) by dissolving 1 g of phenol in 19 ml of distilled water.
Add 500 μl of 5% phenol to each safe-lock tube with cellular pellet and 500 μl of distilled water and mix well with a pipette (Figure 1.3).
Keep the samples at laboratory temperature for 15 min (phenol will penetrate to the cells).
Transfer 8 x 60 μl of each sample to the 96-well plate with a pipette according to the scheme in Figure 2 (positions A4-H12, each sample will have 8 technical replicates, Figure 1.12 and 1.13). In case of evaluating more than 9 samples, use an additional 96-well plate (Note 3).
Continue with Procedure E.
-
Preparing samples for starch/glycogen content determination
Sample the culture and extract chlorophyll and carotenoids from the cells as described in the Procedure A and B.
Prepare 30% KOH (w/w) by diluting 6 g of potassium hydroxide in 14 ml of distilled water.
After thawing the cellular pellets on ice, add 400 μl of 30% KOH to each safe lock tube with cellular pellets and mix well with a pipette.
Seal the safe-lock tubes with the sealing clips (Note 4).
Incubate the samples at 95 °C for 90 min to remove free glucose and other alkali-sensitive saccharides (Evans, 1942; Whistler and BeMiller, 1958) (Figure 1.4).
Cool down the samples at laboratory temperature for 10 min.
Add 1.2 ml of ethanol precooled to 4 °C and mix well with a pipette (Figure 1.5).
Store the samples overnight at -20 °C (Note 5).
Centrifuge the samples at 4 °C, 20,000 × g for 60 min.
Discard ethanol and keep the pellet for further analysis (Note 6, Figure 1.6).
Dry the remaining ethanol under vacuum at 60 °C for 60 min (Figure 1.7).
Add 100 μl of 1 N HCl to the dry pellet and mix well with a pipette (Figure 1.8).
Seal the safe-lock tubes with the sealing clips (Note 4).
Incubate the samples at 95 °C for 30 min to hydrolyze starch/glycogen.
Cool down the samples at laboratory temperature for 10 min.
Add 100 μl of 1 N NaOH and mix well with a pipette to neutralize 1 N HCl (Figure 1.9).
Add 300 μl of distilled water and mix well with a pipette (Figure 1.10).
Centrifuge at 15,000 × g at laboratory temperature for 10 min and transfer 500 μl of supernatant to a new safe-lock tube. Discard the safe-lock tube with pellet.
Move to the fume hood.
Add 500 μl of 5% phenol to each safe-lock tube with supernatant and mix well with a pipette (Figure 1.11).
Keep the samples at laboratory temperature for 15 min (phenol will react with glucose).
Transfer 8 x 60 μl of each sample to the 96-well plate with a pipette according to the scheme in Figure 1 (positions A4-H12, each sample will have 8 technical replicates, Figure 1.12 and 1.13). In case of evaluating more than 9 samples, use additional 96-well plate (Note 3).
-
Preparing glucose calibration curve
Prepare 6 x 500 μl of glucose calibration solutions (D-glucose: 25-500 μg ml-1) according to Table 1.
Move to the fume hood.
Add 500 μl of 5% phenol solution to each tube with calibration solution and mix well with a pipette.
Keep the tubes at laboratory temperature for 15 min (phenol will react with glucose)
Transfer 4 x 60 μl of each glucose calibration solution to the 96-well plate with a pipette according to the scheme in Figure 1 (positions A1-H3, each calibration point will have 4 technical replicates) (Note 3, Figure 1.12 and 1.13).
-
Spectrophotometric determination of saccharides content
Pour 20 ml of 96% sulfuric acid to the reservoir for a multichannel pipette.
Add 150 μl of 96% sulfuric acid to each well with the calibration solution or the sample using a multichannel pipette and mix well by pipetting up and down several times (Note 7).
Cover the 96-well plate with the plastic lid.
Incubate the samples at laboratory temperature for 5 min (Note 8).
-
Measure the carbohydrates concentration by a microplate spectrophotometer:
Remove the plate lid.
Measure the absorbance of each sample at 490 nm (Note 9).
Recalculate the concentration of carbohydrates based on D-glucose calibration (Figure 3).
Figure 1. Individual steps of total carbohydrates and glycogen determination in Synechocystis sp. PCC 6803.
The protocol begins with cells harvesting and centrifugation (1) and extraction of chlorophyll a and carotenoids to methanol (2). For total saccharides determination, the pellet is resuspended in 500 μl of distilled water and 500 μl of 5% phenol (3). For glycogen determination, the pellet is resuspended in 400 μl of 30% KOH (4), and the samples are incubated for 60 min at 95 °C to remove free glucose. After incubation, 1.2 ml of precooled ethanol is added (5) for overnight glycogen precipitation at -20 °C. After precipitation, samples are intensively centrifuged for 60 min, ethanol is discarded, pellet (6) is dried for 60 min under vacuum at 60 °C (7), and glycogen is hydrolyzed to glucose in 100 μl of 1 N HCl (8) at 95 °C. After hydrolysis, the samples are neutralized by addition of 100 μl of 1 N NaOH (9), diluted with 300 μl of distilled water (10) and mixed with 500 μl of 5% phenol (11). For quantification of free glucose, 8 x 60 μl of each sample is transferred to 96-well plate according to scheme in Figure 2 (12), and 150 μl of 96% sulfuric acid is added to each well for chromophores establishing (13). Cellular pellets after intensive centrifugation in ethanol (6) and drying (7) are marked by red arrows. The blue color of sample in step (3), originating in phycobiliproteins, does not influence the spectrophotometric quantification of total carbohydrates content.
Figure 2. Schematic organization of the 96-well plate for measurement of total saccharides and starch/glycogen content.
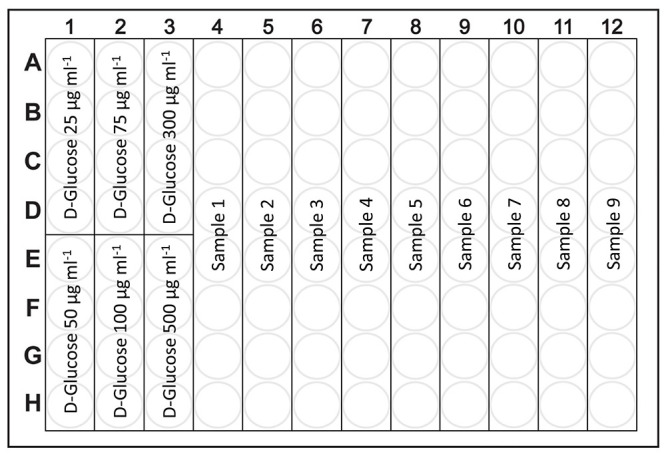
The first 24 wells (A1-H3) are designated for 6 points of glucose calibration (each calibration point will have 4 technical replicates), the remaining 72 wells (A4-H12) are designated for 9 samples (each sample will have 8 technical replicates).
Table 1. Preparation of calibration series of D-glucose in distilled water.
| Eppendorf tube | Glucose solution | Distilled | Glucose concentration |
| number | 500 μg ml-1 [μl] | water [μl] | [μg ml-1] |
| 1 | 25 | 475 | 25 |
| 2 | 50 | 450 | 50 |
| 3 | 75 | 425 | 75 |
| 4 | 100 | 400 | 100 |
| 5 | 300 | 200 | 300 |
| 6 | 500 | 0 | 500 |
Figure 3. Representative calibration of D-glucose (dissolved in distilled water) mixed with 5% phenol and 96% sulfuric acid, measured at 490 nm according to this protocol.

Each calibration point represents the average of 4 technical replicates, the error bars represent standard deviations. The dotted line represents linear fit of the measured points calculated by the least squares method. The linear regression equation (y = αx + β) represents calibration equation slope (α) and intercept (β). The R2 coefficient was calculated by the least squares method.
Data analysis
The protocol provides 8 technical replicates of each sample and 4 technical replicates of each calibration solution. For reproducibility, it is strongly recommended to measure each sample at least in biological triplicates that should originate from independent experiments.
To determine the total carbohydrates and/or starch/glycogen concentration in the samples, the final absorbance at 490 nm (A490) should fit to the linear absorbance range of the spectrophotometer (Note 10). For the microplate spectrophotometer (MultiskanTM GO, Thermo Scientific), this linear absorbance range is 0.1-3.0. The final A490 of each sample should also fit to the range of the calibration curve. For glucose concentration 25-500 μg ml-1 as represented in Figure 3, this A490 range is 0.2-2.3.
Carbohydrates determination:
Calculate slope (α) and intercept (β) coefficients of the linear regression model (y = αx + β) from the calibration data (representative calibration curve is shown in Figure 3) and use these coefficients to calculate carbohydrates concentration in every sample and replicate according to equation (1) (Note 11):
| (1) |
In case of using lower or higher volumes of algae/cyanobacteria suspension than 1 ml (Step A1), and/or in case of diluting the samples by lower or higher volumes of distilled water than 500 μl (Step C2) or 300 μl (Step D17), and/or in case of adding lower or higher volumes of 5% phenol than 500 μl (Steps C5 and D20), calculate the final carbohydrates concentration according to the equation (2):
| (2) |
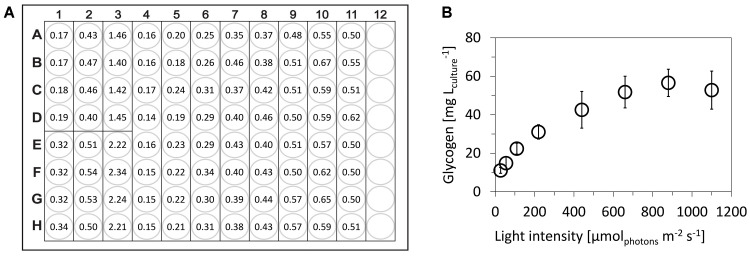
Representative results of glycogen content in Synechocystis sp. PCC 6803 that was cultivated under wide range of light intensities and sampled in exponential growth phase is shown in Figure 4.
Figure 4. Determination of glycogen content in cyanobacterium Synechocystis sp. PCC 6803.
A. Representative measurement (raw data) of A490 within single 96-well plate, following scheme from Figure 2: A1-H3: six points of glucose calibration (25-500 μg ml-1), A4-H11: eight independent samples of Synechocystis cells that were cultivated under 27.5-1,100 μmolphotons m-2 sec-1 of red light. B. Final glycogen content in Synechocystis cells: the open circles represent averages from five independent experiments, the error bars represent standard deviations. Synechocystis was cultivated in a flat-panel photobioreactor ( Nedbal et al., 2008 ) in a quasi-continuous cultivation regime under growth saturated conditions as described previously ( Zavřel et al., 2015b ). Glycogen was measured within five independent 96-well plates. The wells filled only with water (blanks, not used in this particular case) have A490 around 0.06.
Notes
The amount of cell suspension required for analysis can vary with the culture density. Sample volume of 1 ml is optimized for cultures of Synechocystis sp. PCC 6803 with cell density approximately 1-2 x 10⁷ cells ml-1. Such dense cultures of Synechocystis sp. PCC 6803 contain approximately 5-100 mg of both glycogen and total saccharides per liter culture. With diluted cultures, it is recommended to harvest bigger culture volume. On the contrary, for dense cultures lower sample volume is recommended–with high cellular densities, some pigments can remain in the cells after the methanol extraction, which can affect spectrophotometric quantification of total saccharides or starch/glycogen.
This step should be omitted for eukaryotic algae, since pigment extraction by methanol without mechanic disruption of the robust cell walls is usually ineffective. For eukaryotic algae, pigments can be removed by overnight incubation of cellular pellets in ethanol, as described in Steps D7-D10.
In case of analyzing more than 9 samples, perform the calibration for each single 96-well plate to secure identical conditions for both calibration solutions and samples.
Sealing the safe-lock tubes with the sealing clips is critical since without this treatment the tubes will open during incubation at 95 °C and the samples will burst out.
The precipitated starch/glycogen can be stored in ethanol at -20 °C for up to several months.
The color of the precipitated starch/glycogen pellet can be ranging between yellow/brown and transparent. If the pellet is transparent, it is recommended to keep 100-200 μl of ethanol in the safe-lock tubes in order to avoid discarding of precipitated starch/glycogen together with ethanol (Step D10).
Use pipette tips with filters to protect the pipette from the sulfuric acid aerosols. The reaction of 96% sulfuric acid with the samples releases significant amount of heat. It is therefore critical to pipette slowly to avoid spurting out of the final mixture from the wells. It is recommended to mix the phenol solution with sulfuric acid using the multichannel pipette for at least 8 times to secure reproducible conditions for all technical replicates and for all samples.
The samples can be incubated for up to 40 min without significant loss of the final mixture color (Figure 5).
Absorption maximum of mixture of D-glucose (dissolved in distilled water), 5% phenol and 96% sulfuric acid is at 490 nm (Figure 6).
In case A490 (the final carbohydrates concentration) is too high to fit to the linear absorbance range of the spectrophotometer, it is necessary to dilute the samples with 5% phenol (and equal amount of distilled water) before the chromophores establishing, i.e., before Step F2. Diluting the samples after chromophores establishing (after Step F2) can lead to incorrect spectrophotometric quantification of saccharides content.
In case of starch concentration evaluation, divide the final value by factor 0.9, since the ratio of molar mass of starch (C6H10O5) and glucose (C6H12O6) is 0.9. For the representative calibration curve as shown in Figure 3, the carbohydrates concentration in the samples will be calculated as: carbohydrates [μg ml-1] = (A490-0.0727)/0.0045.
Figure 5. Kinetics of reaction of D-glucose (dissolved in distilled water), 5% phenol and 96% sulfuric acid color in time, as measured by decrease of A490 signal.
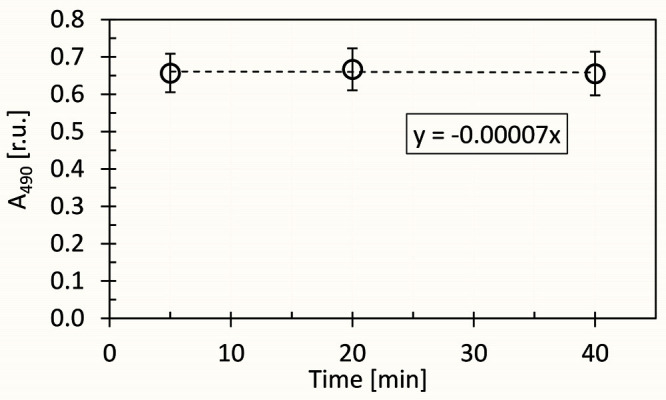
The dashed line represents linear fit of the measured points, calculated by the least squares method. The A490 slope (α) was calculated from the linear regression equation: y = αx.
Figure 6. Spectrum of mixture of D-glucose (dissolved in distilled water), 5% phenol and 96% sulfuric acid as prepared according to this protocol.
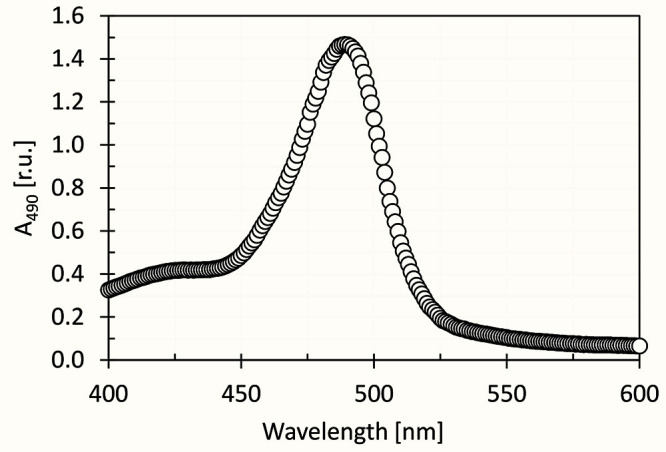
The peak maximum is at 490 nm.
Recipes
-
Glucose calibration series
Prepare 500 μg ml-1 D-glucose (w/w) by dissolving 5 mg of D-glucose in 9.995 ml of distilled water
Dilute the 500 μg ml-1 D-glucose solution by distilled water into 6 safe-lock tubes according to Table 1
Acknowledgments
The protocol was adopted from publication: Phenotypic characterization of Synechocystis sp. PCC 6803 substrains reveals differences in sensitivity to abiotic stress ( Zavřel et al., 2017 ). T. Z., J. Č. and P. O. were supported by the Ministry of Education, Youth and Sports of the Czech Republic within the National Sustainability Program I (NPU I), grant number LO1415. J. Č. was also supported by GA ČR, Grant number 15-17367S. Access to instruments and other facilities was supported by the Czech research infrastructure for systems biology C4SYS (project No. LM2015055). M. A. S. was supported by a grant from the Russian Science Foundation (No. 14-14-00904). The authors declare no conflicts of interest.
Citation
Readers should cite both the Bio-protocol article and the original research article where this protocol was used.
References
- 1. Bandyopadhyay A., Stockel J., Min H., Sherman L. A. and Pakrasi H. B.(2010). High rates of photobiological H2 production by a cyanobacterium under aerobic conditions. Nat Commun 1: 139. [DOI] [PubMed] [Google Scholar]
- 2. De Porcellinis A., Frigaard N. U. and Sakuragi Y.(2017). Determination of the glycogen content in cyanobacteria. J Vis Exp (125). [DOI] [PMC free article] [PubMed] [Google Scholar]
- 3. Dubois M., Gilles K. A., Ton J. K. H., Rebers P. A. and Smith F.(1956). Colorimetric method for determination of sugars and related substances. Anal Chem 28: 350-356. [Google Scholar]
- 4. Evans W. L.(1942). Some less familiar aspects of carbohydrate chemistry. Chem Rev 31: 537-560. [Google Scholar]
- 5. Khan M. R., Wang Y., Afrin S., He L. and Ma G.(2018). Glycogen and extracellular glucose estimation from cyanobacteria Synechocystis sp. PCC 6803 . Bio-Protocol 8(9): e2826. [DOI] [PMC free article] [PubMed] [Google Scholar]
- 6. Masuko T., Minami A., Iwasaki N., Majima T., Nishimura S. and Lee Y. C.(2005). Carbohydrate analysis by a phenol-sulfuric acid method in microplate format. Anal Biochem 339(1): 69-72. [DOI] [PubMed] [Google Scholar]
- 7. Nedbal L., Trtílek M., Červený J., Komárek O. and Pakrasi H. B.(2008). A photobioreactor system for precision cultivation of photoautotrophic microorganisms and for high-content analysis of suspension dynamics. Biotechnol Bioeng 100(5): 902-10. [DOI] [PubMed] [Google Scholar]
- 8. Raven J. A. and Beardall J.(2003). Carbohydrate metabolism and respiration in algae. In: Larkum, A. W. D., Douglas, S. E. and Raven, J. A.(Eds). Photosynthesis in Algae, Advances in Photosynthesis and Respiration. Springer Netherlands, Dordrecht, pp: 205-224. [Google Scholar]
- 9. Schneegurt M. A., Sherman D. M., Nayar S. and Sherman L. A.(1994). Oscillating behavior of carbohydrate granule formation and dinitrogen fixation in the cyanobacterium Cyanothece sp. strain ATCC 51142 . J Bacteriol 176(6): 1586-1597. [DOI] [PMC free article] [PubMed] [Google Scholar]
- 10. Sinetova M. A., Červený J., Zavřel T. and Nedbal L.(2012). On the dynamics and constraints of batch culture growth of the cyanobacterium Cyanothece sp. ATCC 51142 . J Biotechnol 162(1): 148-155. [DOI] [PubMed] [Google Scholar]
- 11. Whistler R. L. and Bemiller J. N.(1958). Alkaline degradation of polysaccharides. Adv Carbohydr Chem 13: 289-329. [DOI] [PubMed] [Google Scholar]
- 12. Zavřel T., Očenášová P. and Červený J.(2017). Phenotypic characterization of Synechocystis sp. PCC 6803 substrains reveals differences in sensitivity to abiotic stress . PLoS One 12(12): e0189130. [DOI] [PMC free article] [PubMed] [Google Scholar]
- 13. Zavřel T., Sinetova M. A., Búzová D., Literáková P. and Červený J.(2015). Characterization of a model cyanobacterium Synechocystis sp: PCC 6803 autotrophic growth in a flat-panel photobioreactor . Eng Life Sci 15(1): 122-132. [Google Scholar]
- 14. Zavřel T., Sinetova M. A. and Červený J.(2015). Measurement of chlorophyll a and carotenoids concentration in cyanobacteria. Bio-protocol 5(9): e1467. [Google Scholar]


