Abstract
The literature provides many works that focused on cell nuclei segmentation in histological images. However, automatic segmentation of bone canals is still a less explored field. In this sense, this paper presents a method for automatic segmentation approach to assist specialists in the analysis of the bone vascular network. We evaluated the method on an image set through sensitivity, specificity and accuracy metrics and the Dice coefficient. We compared the results with other automatic segmentation methods (neighborhood valley emphasis (NVE), valley emphasis (VE) and Otsu). Results show that our approach is proved to be more efficient than comparable methods and a feasible alternative to analyze the bone vascular network.
Keywords: Image segmentation, Bone vascular network, Bone canal, Mathematical morphology, Artifact removal
Introduction
The study of tissue samples from the human body and how these tissues are organized in organs is known as histology. The process of visual microscopic analysis of how a particular disease affects a set of cells and tissues is called histopathology [1]. Specialists consider “gold standard” the study of histological images as it helps the identification of anomalies in tissues, which can generate dysfunctions in the biological system from which the tissue was extracted. It also helps to predict the risk of evolution of certain diseases, such as cancer [2]. Tissue irregularities may originate from several diseases or by intensive treatments, such as radiotherapy, which is used to treat several types of cancer. Radiotherapy, for example, can degenerate the bone vascular network and the osteocytes of the tissue exposed to this treatment, causing reduction in bone metabolism [3].
Important information can be obtained from cell and tissue analysis with applications in diagnostic and prognostic. Usually, these analyses are performed manually from a sequence of histological images. However, many times this analysis is financial and temporal expensive due to a series of factors: large number of images, quantity and size of artifacts, complexity and irregular aspects of the majority of the cells. Additionally, manual analysis is subject to expert’s intellectual fatigue and the inaccuracy of the analysis. The use of digital histological images (i.e., the digitization of material visualized by microscopes) made possible the use of image processing techniques to aid the diagnosis. In recent years, the increasing in computing power, the falling of image acquisition costs, and the development of new pattern recognition techniques have made computer-assisted diagnostics (CAD) increasingly important [4]. In this sense, image processing techniques for microscopic imaging can significantly improve the efficacy and accuracy of the diagnostic and has aroused interest in the current literature [5].
The study of modifications in the bone matrix can reveal important properties of vascular canals in response to environmental conditions. For example, Rabelo et al. [6] evaluated the effects of zoledronic acid on the cortical bone canals and the osteocyte organization in relation to the bone channels. Costa et al. [7] modelled the bone structure as a complex network to quantify channel distribution network in mammals bones. In this sense, the automatic and precise identification of bone canals is a key step in the study of bone organization.
In order to visualize the cellular structures in a microscopy, it is first necessary to stain the analyzed tissue to highlight regions of interest (e.g., nuclei, cytoplasm, membranes, etc.). The combination of Hematoxylin and Eosin (H&E) represents the most commonly used dyes. While Hematoxylin is responsible for coloring in dark blue the cell nuclei, Eosin pigments other cellular structures in red/pink [8]. The literature presents many methods of nuclear segmentation in histological images of Hematoxylin and Eosin (H&E). In [9] the authors propose a non-supervised algorithm to segment nuclei of histopathological images of breast cancer stained with H&E. The authors use fast radial symmetry transform (FRST) [10] to mark the local minimums and Watershed to segment each nuclei. Then, shape features are used to confirm whether the segmented region of the image is a real nucleus or not. The work in [11] proposes an automatic segmentation algorithm to detect micro-characteristics in bone structures of bovine. To accomplish that, the authors used a pulse-coupled neural network (PCNN) optimized by a particle swarm algorithm (PSO). The work in [12] proposes an unsupervised segmentation method for the nuclear structures in leukocyte. The authors used deconvolution to separate the stained components of the image and the neighborhood valley emphasis method to select the regions of interest. In [13] the authors propose the use of morphological and non-morphological features to classify nuclei of lymphoma images.
In this paper we present an automatic segmentation method to detect bone vascular network in histological images stained with H&E. Our goal is to improve the detection of bone canals, as well as artifacts and other anomalies, a research field barely explored. In addition, we must emphasize that even in a controlled and expert care environment, some imperfections may occur in the collected images, thus compromising the segmentation process. Among these imperfections we can mention: blurring, nonuniform luminosity, image distortion, low contrast, and objects with different tonality and tears in the histological tissue.
The remaining of the paper is organized as follows: Section 2 describes the image acquisition process and image processing techniques used. Section 3 describes the process of removing artifacts external and internal to the bone matrix, bone canal segmentation algorithm and the post-processing scheme used to refine the results. In Section 4 we present and discuss the obtained results, while Section 5 concludes the paper.
Material and Methods
Image Acquisition
We used a Rattus norvegicus rat of the Wistar lineage with . In the left leg of the animal, we applied an ionizing radiation at a dose of 30Gy (as in [14, 15]) using the 6MeV Linear Electron Accelerator (Varian 600-C©Varian Medical Systems Inc. Palo Alto, California/USA—located at UFTM, Universidade Federal do Triângulo Mineiro). We used the right leg as control, but it was not included in this work. The animal was sacrificed 30 days after irradiation, and the femurs were removed and fixed in formaldehyde 10%, buffered, and demineralized in EDTA 4.13%. We embedded the diaphysis in paraffin and obtained serial histological sections of about 5 micrometers thick stained in Hematoxylin and Eosin (H&E). All procedures to obtain this material were performed according to the standards of the Brazilian College of Animal Experimentation (COBEA), with approval of the Ethics Committee on the Use of Animals from Federal University of Uberlândia (CEUA-UFU) - Protocol 060/09.
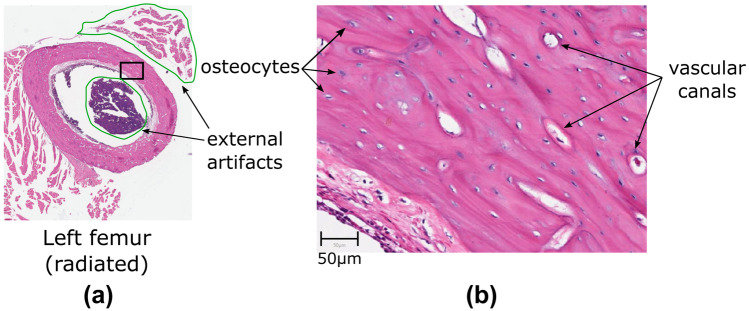
In this study we analyzed 100 histological sections from left femur. We used a ScanScope AT Turbo® Scanner (Leica Biosystems, Nussloch, Germany) to scan the images with an effective magnification of 20. Figure 1 shows one sample image for the radiated femur. The obtained images are of high resolution. For example, the size of the image in Fig. 1(a) is 7,9409,051 pixels, and the pixel width and height are 0.502 . In this resolution, it is possible identify the vascular canals and the osteocytes (Fig. 1(b)). In the figure it is also indicated the external artifacts of the bone matrix that should be removed from the analysis.
Fig. 1.
(a) A sample image from the radiated bone tissue. (b) Amplification of the marked rectangular area in (a) showing examples of the vascular canals (white and purple holes inside bone matrix), the osteocytes (small white and purple holes) and the external artifacts (regions delimited by a green contour)
Mathematical Morphology
Mathematical morphology is a set of tools to process, analyze and extract geometrical structures from binary images [16]. Based on set theory, it enables us to study objects in an image using a pre-defined shape called structuring element. Next, we describe some basic operations.
Dilation: it combines an image A and a structuring element B to increase the area of the objects in A, and their union, as described in Equation 1. This process may result in the union of objects.
| 1 |
Erosion: it combines an image A and a structuring element B to reduce the area of the objects in A, thus eliminating some of them, as described in Equation 2.
| 2 |
Opening: it is obtained by computing an erosion, followed by a dilation, of A using B, as described in Equation 3. This operation removes small objects, break narrow isthmus and eliminate fine protrusions.
| 3 |
Closing: it is obtained by computing an dilation, followed by a erosion, of A using B, as described in Equation 4. This operation eliminates small holes and fill cracks in the image’s contour.
| 4 |
Convex hull: given an image object A, the convex hull of A is the smallest convex set that contains all points of the object A.
L*a*b color space
Most image acquisition devices work with the RGB color space as it expresses satisfactorily the captured scene. However, this color space is not convenient for humans, as it does not reproduce how humans interpret the luminance and the chrominance of the color. To work around this problem, the International Commission on Illumination (CIE) in 1976 defined the CIE L*a*b*, a perceptually uniform color space with respect to human color vision [17]. This space expresses color as three numerical values: , and , where represents the amount of lightness and and represent, respectively, the green-red and blue-yellow components of the color.
Given a color in XYZ color space, we compute component with respect to a given white point (, , ) as
| 5 |
where
| 6 |
with . Chrominance components, and , are computed as
| 7 |
Otsu Method
One of the most popular automatic segmentation approaches for grayscale images is the Otsu method [18]. The algorithm considers that a given image is composed of two classes of pixels (foreground and background pixels), thus resulting in a bi-modal histogram. The method uses the image histogram to find an optimal threshold that minimizes the classification errors between the two classes of pixels. To accomplish that, Otsu method minimizes the combined intra-class variance of the two classes of pixels, so that the inter-class variance is maximal.
Region Growing Segmentation
Region growing is a segmentation technique that aims to cluster image’s pixels into different regions [17]. Basically, this method starts with a few selected pixels, called “seeds”, and add the neighboring pixels to these seeds in order to compose a region. This method adds a pixel to a region according to the pixel’s similarity to that region, which is measured by its properties (e.g., color). If the difference between the properties of a pixel and a region is smaller than a threshold T, the pixel is added to that region.
In this paper, instead of pixels, we consider each object obtained in previous segmentation processes as a region to grow. The growth is guided by the RGB values of the pixels, where these values are normalized to the interval [0, 1]. The whole process is described as follows:
Compute the average RGB values of all pixels in the RGB image that belong to a binary object;
Perform a morphological dilation of the objects using a circle of radius ;
Compute the average RGB values of each binary object;
For each object, compute the Euclidean distance of its average RGB values to the average of the RGB values previously computed for the whole image;
If all distances are smaller than or equal to a threshold T, the current dilation is incorporated to the binary object and the process is repeated; Otherwise, the dilation is discard and the process ends.
Additionally, after each dilation process, we verify if the amount of pixels composing the objects in the image exceeds 15% of the total of pixels in the image. In that case, the threshold value is decreased by 0.01 and the process of region growing is performed again. We added this latter condition to the method to avoid that the dilation process incorporate regions that are not of interest to the analysis. In this work, we used an initial threshold value .
K-means Clustering
Data clustering is a well-known problem in machine learning. Its main objective is to separate unlabeled data in groups, so that samples in a group are similar to each other, but not to other groups. Over the years, many and different methods for data clustering have been proposed. Among these, k-means method plays an important role due to its simplicity and efficacy for many clustering problems [19–23].
Given a set of n observations and k as the number of clusters, k-means algorithm associates each observation to the cluster with the closest centroid. To accomplish that, given an initial set of k centroids, the algorithm uses iterative refinements to improve the final data clustering. At each step, each centroid is moved to the average of the observations associated to its cluster. Then, the observations are again grouped into k clusters. This process provides small adjustments in the centroid of each group, thus moving it to a better position, which results in a better separation of the observations. Formally, k-means aims to find
| 8 |
where are observations, are the clusters and is the centroid of a cluster .
Proposed Approach
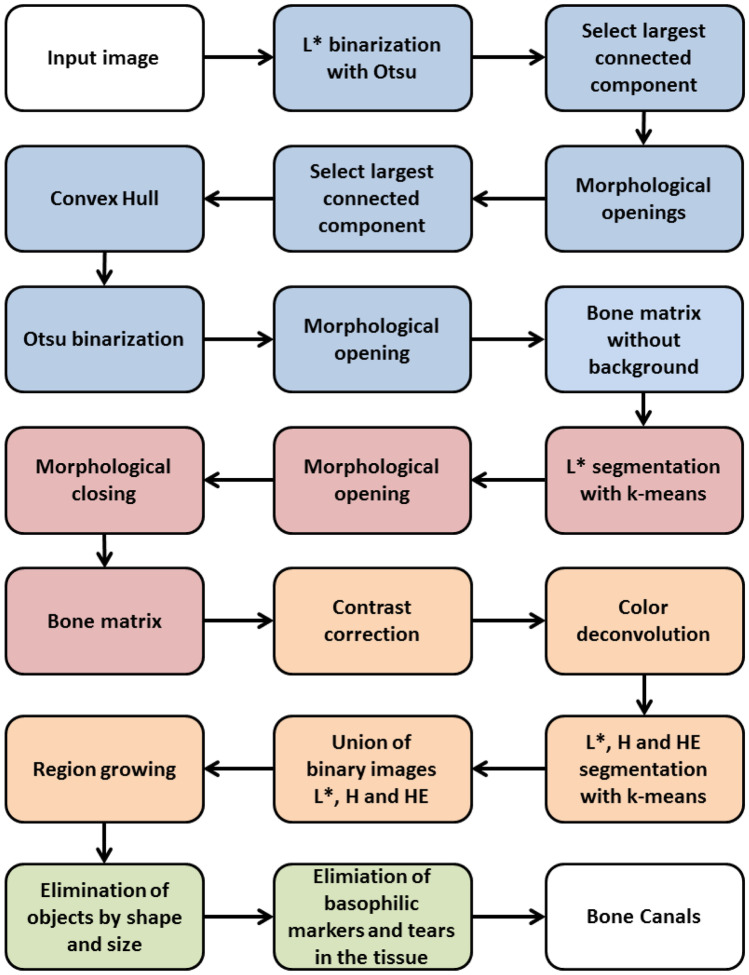
In this section we describe the sequence of steps to detect and segment the bone canals present in a histological images. Given an input image, we apply a series of operation to remove artifacts that are external to the bone matrix. In the sequence, we remove all artifacts that are internal to the bone matrix. This results in an image containing only the bone matrix. We apply our proposed algorithm to detect and segment the bone canals present in the bone matrix. Since more objects are present in the bone matrix (e.g., osteocyte) and may be detected as a bone canal, we apply a post-processing step to ensure the quality of the bone canal detected. Figure 2 displays the flow chart of the method.
Fig. 2.
Flowchart of the proposed method. In blue: elimination of artifacts external to the bone matrix; in red: elimination of artifacts internal to the bone matrix; in orange: bone canal segmentation; in green: elimination of false bone canals
These parameters used on our approach were empirically chosen as the ones that provided the best results for the images evaluated. We must emphasize that the same set of parameters were used in all images and that we did not perform individual fine tuning of parameters.
Removing Artifacts External to the Bone Matrix
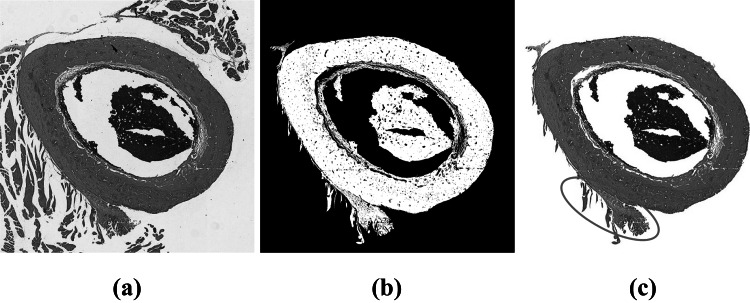
To remove the artifacts that are external to the bone matrix, we first converted the image from RGB to CIE 1976 L*a*b color space. Then, we applied the Otsu method at the channel to extract objects present in the image’s background. From the resulting binary image, we removed all connected components (8-connected object), except the largest. At this point, the image is composed by the bone matrix and some external artifacts that are connected to it. Figure 3 shows the results of this first processing step.
Fig. 3.
Otsu segmentation of the largest component: (a) Original image; (b) largest connected component of the image; (c) resulting image. The ellipse in red highlights the most difficult part to remove in the image. This part was later removed with a series of morphological openings with different structuring elements
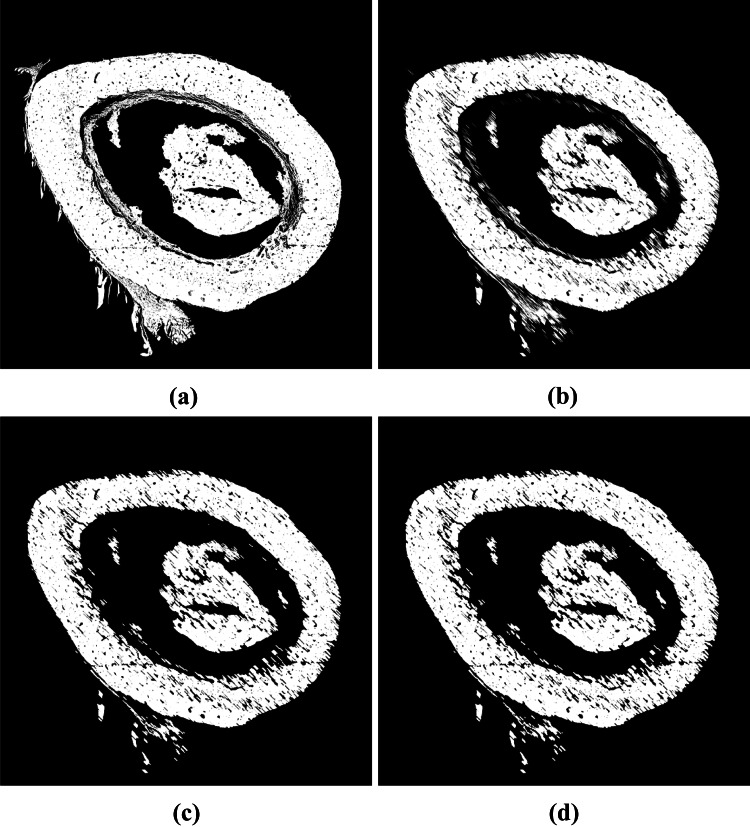
Even though the bone matrix is the largest connected component, to segment this object is not a trivial task. Some external objects may be connected to it, thus impairing the final segmentation, as highlighted in Fig. 3. To improve the segmentation and to remove the remaining protrusions in the image, we applied three morphological openings with different structuring elements. First, we used a line with 100 pixels length and 135 degrees of slope as structuring element. Then, we used a rectangle with 10 pixels height and 20 pixels width. The combination of these two morphological openings is essential to remove the protrusion highlighted in Fig. 3(b). In order to eliminate other protrusions present in the bone matrix, the last morphological opening used a disc with radius of pixels as structuring element. It worth notice that the parameters and the order of the three opening operations were empirically define through experimentation. Figure 4 shows the result of each opening operation.
Fig. 4.
Resulting images from the application of morphological openings using different structuring element: (a) Original image; (b) line with 100 pixels length and 135 degrees of slope; (c) rectangle with 10 pixels height and 20 pixels width; (d) disc with radius of pixels
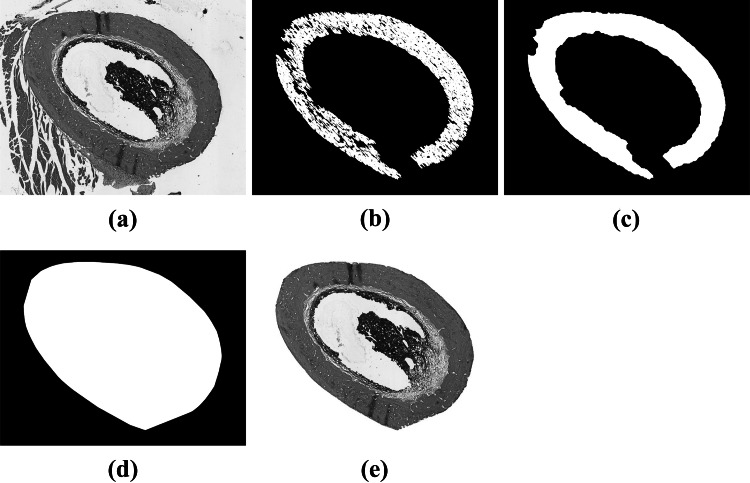
After applying the morphological openings, we selected the largest connected component. This enabled us to remove all objects that are external to the bone matrix. However, part of the bone matrix was also removed. Still, most of its silhouette remained. We found out experimentally that by applying a morphological closing with a disc of radius pixels we were able to connect all the extremities of the object of interest. At this point, we were able to remove all irrelevant artifacts outside the bone matrix. Nevertheless, the closing operation was not capable to restore the original shape of the bone matrix. To accomplish that, we computed the convex hull of the bone matrix and used it as a mask to select the bone matrix (and all artifacts in its internal area) from the original image. Figure 5 shows the binary images computed at each step of this operation.
Fig. 5.
Binary images obtained after each processing step: (a) Original image; (b) image after 3 morphological openings; (c) image after morphological closing; (d) convex hull; (e) resulting image
The contour of bone matrix is characterized by the presence of small irregularities. However, after computing the convex hull, most of these irregularities disappeared. This happened because part of the background was selected as belonging to the bone matrix. Since bone canals are predominantly white, this background could disturb the future segmentation steps and analysis. Thus, to restore its original shape we used Otsu method over the region defined by the convex hull. Next, we applied a morphological opening using a circle of radius in the binary image resulted from Otsu to disconnect small objects attached by the convex hull. Then, we selected the largest object as the bone matrix and filled its holes. Figure 6 shows an example of this operation.
Fig. 6.
(a) Image cropping after the application of convex hull. The region highlighted shows some background selected as part of the bone matrix; (b) image after using Otsu to remove the remaining background
Removing Artifacts Internal to the Bone Matrix
After removing the artifacts that are external to the bone matrix, it is necessary to remove internal objects. Most of the artifacts are dyed with hematoxylin, while the bone matrix is predominantly dyed by eosin, i.e., the tonality of the artifacts within the bone matrix is darker than the bone matrix itself. As a result, the input image has white background, the bone matrix is pink and the unwanted artifacts present a dark purple color. Therefore, image brightness could be used to remove the internal artifacts.
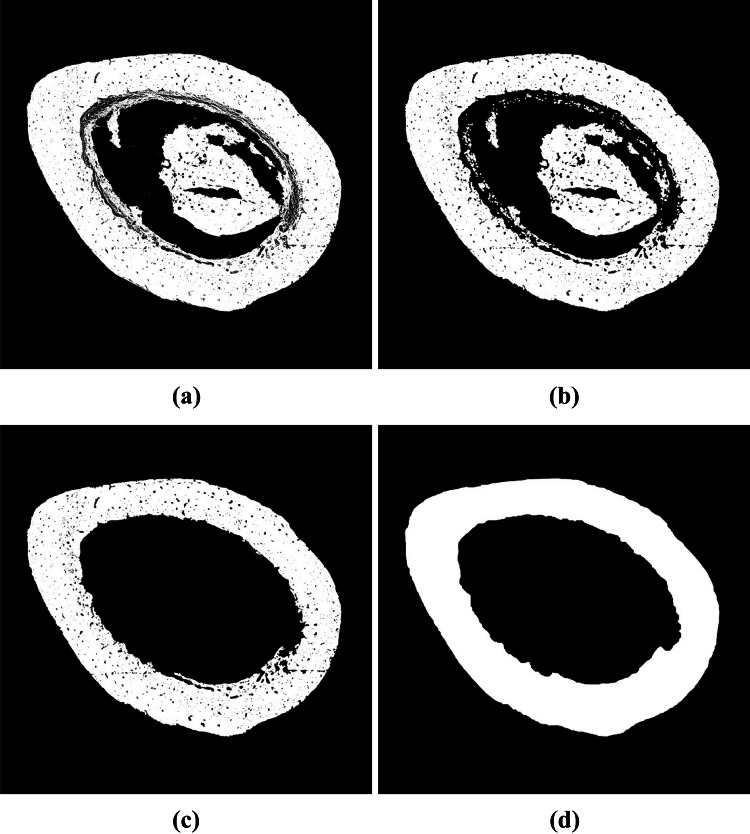
Since we have 3 predominant colors, we applied k-means algorithm with over the channel from CIE 1976 L*a*b* as it is specific for brightness. Then, we selected the image pixels in the cluster whose centroid was the second closest to the white color to compose a binary mask. Over this mask we applied a morphological opening using a disk of radius and selected the largest connected component (8-connected object). To this component we applied a morphological closing using a disk of radius . This last step ensures that the bone matrix doesn’t have any hole in its shape. These operations and their respective parameters were empirically defined through experimentation. Figure 7 shows each step of the processing of removing artifacts that are internal to the bone matrix.
Fig. 7.
Removing artifacts that are internal to the bone matrix: (a) Binary mask computed using k-means (); (b) result of a morphological opening using a disc of radius 15 pixels; (c) largest connected component; (d) result after applying a morphological closing using a disc of radius
Bone Canal Segmentation
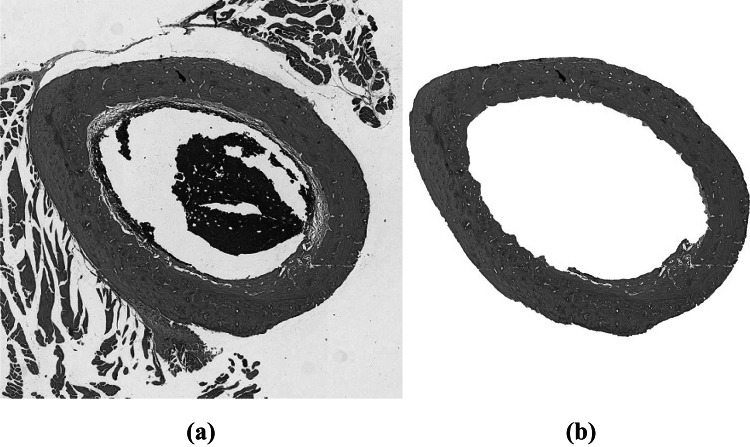
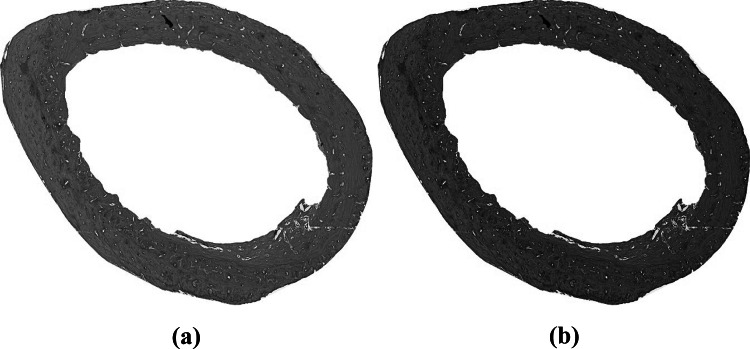
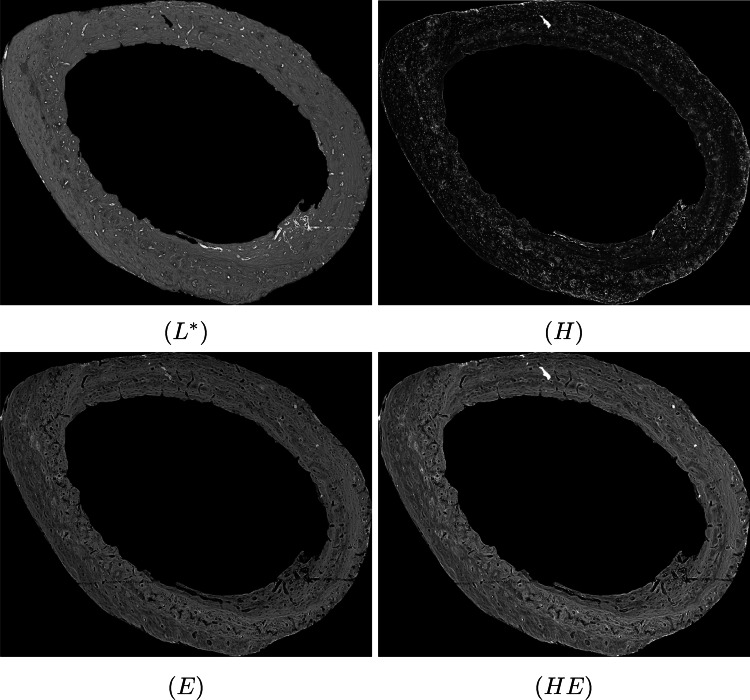
After removing artifacts that are internal and external to the bone matrix, we obtained an image with only the bone matrix, as shown in Fig. 8. In order to reduce the variations in image characteristics and to improve the patterns of biological tissues, we applied a contrast correction to the bone matrix, as described in [24]. Figure 9 shows the result of this correction. We converted the image from RGB to CIE 1976 L*a*b* and selected the channel, which highlights white regions of the image. We also applied color deconvolution to the RGB image, thus resulting in three other gray-scale images: (i) H image, which highlights regions dyed with hematoxylin; (ii) E image, which highlights regions dyed with eosin and (iii) HE image, which highlights hematoxylin and eosin interference. Figure 10 shows an example of the four images (, H, E and HE) computed.
Fig. 8.
(a) Original image; (b) bone matrix without artifacts in the internal and external areas
Fig. 9.
(a) Original image; (b) image after contrast correction
Fig. 10.
Example of the four images (, H, E and HE) computed from Fig. 9(b)
We selected , H and HE images and applied k-means algorithm to each one. Then, for each image we computed a binary image by selecting the pixels in the cluster whose centroid was the closest to the white color (255). To accomplish this task, we used due to the large variation of brightness in each image. Smaller values of k would group regions of different brightness into a single one, thus compromising the segmentation of bone canals.
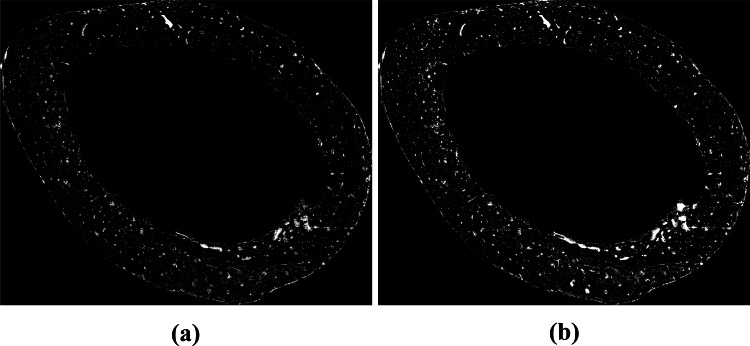
After computing the binary images, we created a single binary image containing all the white pixels of the three binary images. In this image we applied the region growing algorithm, as described in Section 2.5. The result of this image union operation and the region growing algorithm are shown in Fig. 11. We used this resulting image as input for the post-processing phase.
Fig. 11.
(a) Union of , H and HE binary images; (b) image achieved after the execution of the region growing algorithm
Post-processing
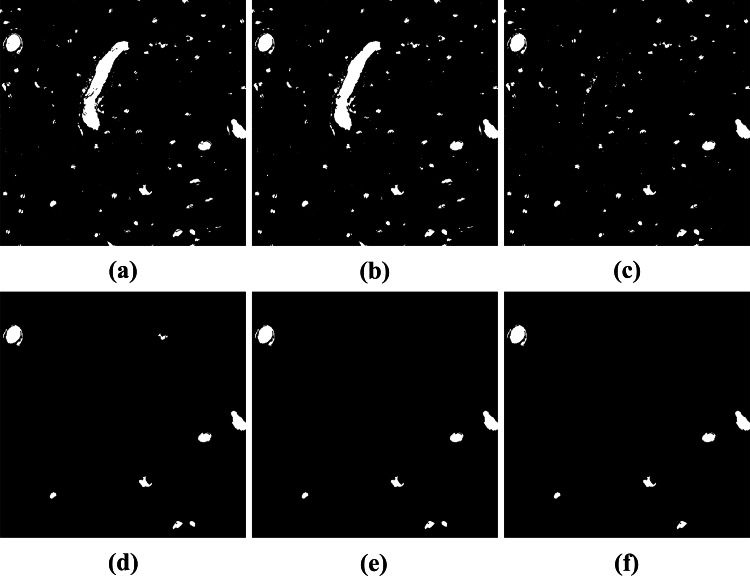
After segmentation, some post-processing tasks were necessary to ensure the quality of the bone canal detected. For example, some objects may present holes, so the first step was to fill all holes in the objects detected. Then, we removed all non-circular objects. This was accomplished by deleting all objects with elongation greater than 30. We also removed objects whose area was smaller than 500 pixels and larger than 20,000 pixels.
Finally, we compared the post-processed image with the three binary images computed using k-means (, H and HE) in Section 3.3. We removed objects from the post-processed image that do not have segmented pixels of the . These objects are basophilic markers from the H or HE images, i.e., they are not bone canals. We also removed objects of the post-processed image that do not have segmented pixels from the H or HE images. These objects are tears in the tissue, i.e., there is no presence of hematoxylin. Figure 12 shows the results of each post-processing step.
Fig. 12.
Post-processing results: (a) Result of the segmentation phase; (b) filling holes; (c) removal of non-circular objects; (d) removal of small and large objects; (e) removal of objects that have no participation of segmented pixels of the image; (f) removal of objects that have no participation of segmented pixels of the H or HE image
Results and Discussion
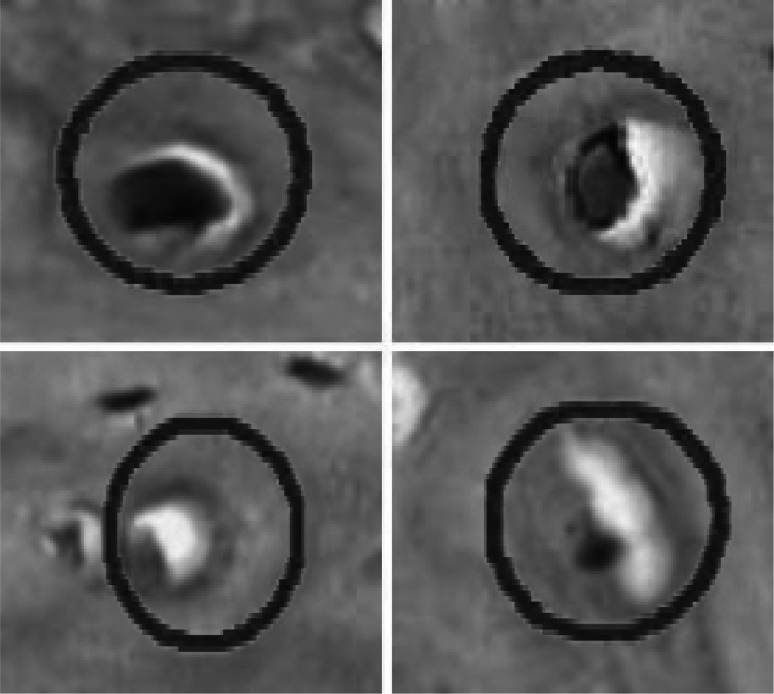
To assess the quality of the segmentation achieved by our proposed method, we compared our detected bone canals with the markings provided and reviewed by experts with background in odontology and with large experience in bone structure analysis. Unfortunately, bone canals segmented by the expert did not follow exactly the shape of each object, as their first interest was only on the location of the objects. So, these images contain circles marking the location of each object, as illustrated in Fig. 13. Since these markings do not follow the natural shape of bone canals, the segmentation provided by an expert would be very different from the segmentation obtained using our approach. Thus, to properly compare our segmentation with the one provided by the expert we considered the work of [9], where it was stated that if an object marked by the expert was at less 20% contained within the object segmented by the proposed method, then it would be considered as a structure correctly segmented by the method.
Fig. 13.
Markings of bone canals provided by an expert
Firstly, we evaluated the sensitivity (Se), specificity (Sp) and accuracy (Ac) between the expert’s segmented image and our segmentation. These metrics are defined by Equations 9, 10, 11, respectively, and they are based on the classification of the segmented pixels in four categories: true positives (TP), pixels marked as objects in both images; true negatives (TN), pixels marked as background in both images; false positives (FP), pixels marked as background by the expert but as object by our approach; and false negatives (FN), pixels marked as object by the expert but as background by our approach:
| 9 |
| 10 |
| 11 |
We also evaluated our proposed method by computing the Dice coefficient. This method computes a measure of similarity between two objects based on the intersection of the objects, as described in Equation 12:
| 12 |
where A and B are the images compared and D, , is the similarity value computed. The closer the value of D is to 1, the more similar the images A and B are.
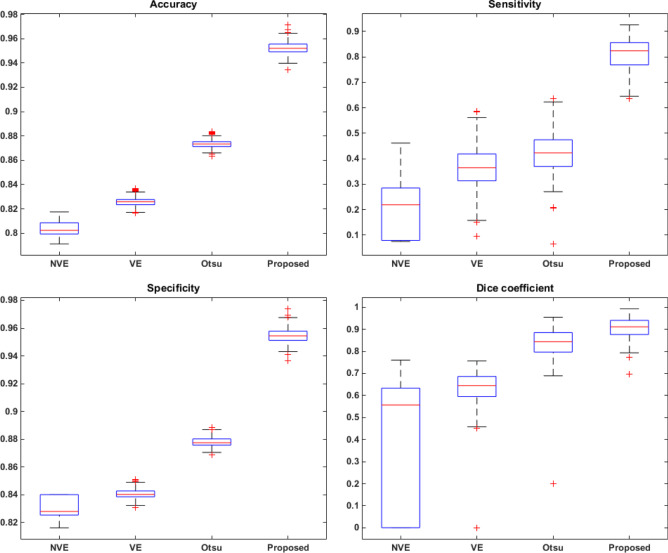
To improve our comparison, we compared the results from our approach with the ones from three histogram based segmentation approaches: Otsu [18], valley emphasis (VE) [25] and neighborhood valley emphasis (NVE) [26]. For this comparison, we applied these techniques on the images obtained after removing the internal and external artifacts, i.e., in the image containing only the bone matrix. Moreover, we discarded color information and used only the luminance of the image. Figure 14 shows the results computed for each method in the form of a box plot graph.
Fig. 14.
Results achieved for accuracy (Ac), sensitivity (Se), specificity (Sp) and Dice coefficient for the proposed and compared approaches
Results shows that the proposed method outperforms all compared approaches for all measurements considered. In well-defined images (i.e., images without uneven illumination, without colors variations and without rips in the tissue) the proposed method is able to detect the bone canals extremely well, thus achieving results similar to the expert. It is also worth noting that Otsu’s method [18] obtained the second best results, while more recent approaches that aim to improve Otsu’s method (valley emphasis (VE) [25] and neighborhood valley emphasis (NVE) [26]) performs poorly for some images, thus compromising the result of the method.
We must also emphasize the sensitivity rate obtained by each method. The sensitivity measures the amount of true positives in relation to the total pixels considered region of interest by the expert. It represents the efficiency of the method in identifying the pixels that correspond to the bone canals. Although this is usually the metric with the lowest value, our approach was able to achieve a high value for sensitivity, far above the compared automatic thresholding methods, by avoiding false positives results. However, this result is obtained by giving up the segmentation of some true positives, a drawback that we aim to improve in a future work. Despite all this, results demonstrate the robustness of the method and its ability to assist in the analysis of the bone vascular network.
Conclusion
Bone canals are complex structures of the bone tissue. This complexity is due to the fact that it has basophilic structures in its interior (stained by hematoxylin) and a white coloration outline. Due this complexity, simple automated segmentation methods would not be able to separate every region of interest. As a solution we proposed a segmentation approach aiming the segmentation of the basophilic parts and later the white coloration outline. Our approach was capable to identify the morphological characteristics of each component and to select the regions of interest in the image. This resulted in segmentation extremely satisfactory and in accordance with the expectations of the expert. As a strong point, our approach avoids false positives results. However, this is achieved by missing some true positives during the segmentation. Such drawback is still subject of research and it can be improved in future work, thus improving the robustness of the proposed method.
Acknowledgements
André R. Backes gratefully acknowledges the financial support of CNPq (Grant #301715/2018-1). The authors also thank FAPEMIG (Foundation to the Support of Research in Minas Gerais) and the School of Medicine of the Federal University of Triângulo Mineiro (UFTM) for providing support in the ionizing radiation procedures. This study was financed in part by the Coordenação de Aperfeiçoamento de Pessoal de Nível Superior - Brazil (CAPES) - Finance Code 001.
Footnotes
Publisher’s Note
Springer Nature remains neutral with regard to jurisdictional claims in published maps and institutional affiliations.
References
- 1.Ross M, Kaye G, Pawlina W: Histology: A Text and Atlas with Cell and Molecular Biology. Online access: Lippincott LWW Health Library: Integrated Basic Sciences Collection. Lippincott Williams & Wilkins, 2003
- 2.Baik J, Ye Q, Zhang L, Poh C, Rosin M, Macaulay C, Guillaud M. Automated classification of oral premalignant lesions using image cytometry and random forests-based algorithms. Cell Oncol. 2014;37:193–202. doi: 10.1007/s13402-014-0172-x. [DOI] [PubMed] [Google Scholar]
- 3.Rabelo GD, Beletti ME, Dechichi P. Histological analysis of the alterations on cortical bone channels network after radiotherapy: A rabbit study. MICROSCOPY RESEARCH AND TECHNIQUE. 2010;73:1015–1018. doi: 10.1002/jemt.20826. [DOI] [PubMed] [Google Scholar]
- 4.Cui Y, Zhang G, Liu Z, Xiong Z, Hu J: A deep learning algorithm for one-step contour aware nuclei segmentation of histopathological images. CoRR, 2018 https://arxiv.org/abs/1803.02786 [DOI] [PubMed]
- 5.Xing F, Xie Y, Su H, Liu F, Yang L. Deep learning in microscopy image analysis: A survey. IEEE Transactions on Neural Networks and Learning Systems. 2017;29(10):1–19. doi: 10.1109/TNNLS.2017.2766168. [DOI] [PubMed] [Google Scholar]
- 6.Rabelo GD, Travençolo BAN, Oliveira MA, Beletti ME, Gallottini M, de Silveira FRX: Changes in cortical bone channels network and osteocyte organization after the use of zoledronic acid. Arch Endocrin Metabol 59(6):507–514,2015 [DOI] [PubMed]
- 7.da Fontoura Costa L, Viana MP, Beletti ME: Complex channel networks of bone structure. Appl Phys Lett 88(3):033903,2006
- 8.Irshad H, Veillard A, Roux L, Racoceanu D. Methods for nuclei detection, segmentation and classification in digital histopathology: A review current status and future potential. IEEE Reviews in Biomedical Engineering. 2014;7:97–114. doi: 10.1109/RBME.2013.2295804. [DOI] [PubMed] [Google Scholar]
- 9.Veta M, van Diest PJ, Kornegoor R, Huisman A, Viergever MA, JPW: Pluim1 Automatic nuclei segmentation in h&e stained breast cancer histopathology images. PLOS ONE, 8(7),2013. [DOI] [PMC free article] [PubMed]
- 10.Loy G, Zelinsky A: Fast radial symmetry for detecting points of interest. IEEE Trans Patt Anal Mach Intell, 25(8), 2003
- 11.Hage IS, Hamade RF. Segmentation of histology slides of cortical bone using pulse coupledneural networks optimized by particle-swarm optimization. Computerized Medical Imaging and Graphics. 2013;37(7–8):466–474. doi: 10.1016/j.compmedimag.2013.08.003. [DOI] [PubMed] [Google Scholar]
- 12.Tosta TAA, de Abreu AF, Travençolo BAN, de Nascimento MZ, Neves LA: Unsupervised segmentation of leukocytes images using thresholding neighborhood valley-emphasis. In 2015 IEEE 28th Int Symp Comp-Based Med Sys, pages 93–94,2015
- 13.do Nascimento MZ, Martins AS, Tosta TAA, Neves LA: Lymphoma images analysis using morphological and non-morphological descriptors for classification. Comp Meth Prog Biomed 163:65-77,2018 [DOI] [PubMed]
- 14.Doğan GE, Halici Z, Karakus E, Erdemci B, Alsaran A, Cinar I. Dose-dependent effect of radiation on resorbable blast material titanium implants: an experimental study in rabbits. Acta Odontologica Scandinavica. 2017;76(2):130–134. doi: 10.1080/00016357.2017.1392601. [DOI] [PubMed] [Google Scholar]
- 15.Li JY, Pow EHN, Zheng LW, Ma L, Kwong DLW, Cheung LK. Dose-dependent effect of radiation on titanium implants: a quantitative study in rabbits. Clinical Oral Implants Research. 2013;25(2):260–265. doi: 10.1111/clr.12116. [DOI] [PubMed] [Google Scholar]
- 16.Vincent L: Morphological grayscale reconstruction: Definition, efficient algorithm and applications in image analysis. IEEE Conf Comp Vis Patt Recogn, pages 633–635,1992
- 17.Gonzalez RC, Woods RC: Processamento Digital de Imagens. Pearson, 3 edition, 2010
- 18.Otsu N: A threshold selection method from gray-level histograms. IEEE Trans Sys, Man, and Cybernetics, SMC-9(1):62–66,1979
- 19.Chen TW, Chen YL, Chien SY: Fast image segmentation based on k-means clustering with histograms in hsv color space. IEEE 10th Workshop on Multimedia Signal Processing, pages 322–325,2008
- 20.Dhanachandra N, Manglem K, Chanu YJ. Image segmentation using k-means clustering algorithm and subtractive clustering algorithm. International Multi-Conference on Information Processing. 2015;54:764–771. [Google Scholar]
- 21.Duda RO, Hart PE, Stork DG: Pattern Classification. Wiley, 2 edition, 2012.
- 22.Kanungo T, Mount DM, Netanyahu NS, Piatko CD, Silverman R, Wu AY. An efficient k-means clustering algorithm: Analysis and implementation. IEEE Transactions on Pattern Analysis and Machine Intelligence. 2002;24(7):881–892. doi: 10.1109/TPAMI.2002.1017616. [DOI] [Google Scholar]
- 23.Likasa A, Vlassisb N, Verbeekb J: The global k-means clustering algorithm. J Patt Recogn Soc, pages 451–461,2003.
- 24.Wang CW, Ka SM, Chen A: Robust image registration of biological microscopic images. Nature - Sci Rep, 2014 [DOI] [PMC free article] [PubMed]
- 25.Ng H-F. Automatic thresholding for defect detection. Pattern Recognition Letters - Elsevier. 2006;27:1644–1649. doi: 10.1016/j.patrec.2006.03.009. [DOI] [Google Scholar]
- 26.Fan J-L, Lei B. A modified valley-emphasis method for automatic thresholding. Pattern Recognition Letters. 2012;33(6):703–708. doi: 10.1016/j.patrec.2011.12.009. [DOI] [Google Scholar]


