

Abstract
The heterogeneity of schizophrenia has defied efforts to derive reproducible and definitive anatomical maps of structural brain changes associated with the disorder. We aimed to map deviations from normative ranges of brain structure for individual patients and evaluate whether the loci of individual deviations recapitulated group-average brain maps of schizophrenia pathology. For each of 48 white matter tracts and 68 cortical regions, normative percentiles of variation in fractional anisotropy (FA) and cortical thickness (CT) were established using diffusion-weighted and structural MRI from healthy adults (n = 195). Individuals with schizophrenia (n = 322) were classified as either within the normative range for healthy individuals of the same age and sex (5–95% percentiles), infra-normal (<5% percentile) or supra-normal (>95% percentile). Repeating this classification for each tract and region yielded a deviation map for each individual. Compared to the healthy comparison group, the schizophrenia group showed widespread reductions in FA and CT, involving virtually all white matter tracts and cortical regions. Paradoxically, however, no more than 15–20% of patients deviated from the normative range for any single tract or region. Furthermore, 79% of patients showed infra-normal deviations for at least one locus (healthy individuals: 59 ± 2%, p < 0.001). Thus, while infra-normal deviations were common among patients, their anatomical loci were highly inconsistent between individuals. Higher polygenic risk for schizophrenia associated with a greater number of regions with infra-normal deviations in CT (r = −0.17, p = 0.006). We conclude that anatomical loci of schizophrenia-related changes are highly heterogeneous across individuals to the extent that group-consensus pathological maps are not representative of most individual patients. Normative modeling can aid in parsing schizophrenia heterogeneity and guiding personalized interventions.
Introduction
Schizophrenia is associated with profound changes in brain structure, including altered cortical morphology [1–4], subcortical volume loss [5], and white matter alterations [6–9] leading to structural connectopathies [10–16]. Despite numerous cross-sectional and longitudinal investigations, the heterogeneity of schizophrenia has defied attempts to derive reproducible and definitive brain maps of the precise anatomical loci of these structural changes. Indeed, unequivocally confirming or refuting the involvement of any particular cortical region or white matter fascicle in the pathophysiology of schizophrenia remains challenging.
Brain changes associated with schizophrenia are conventionally defined by case-control differences, which are representative of the cohort at large and predicated on the notion of an archetypal patient. However, extensive regional heterogeneity of schizophrenia-related changes in brain structure calls this notion to question [17–22]. In the presence of significant individual heterogeneity, neuroanatomical maps of the “average patient” inferred from case-control differences might not necessarily be representative of any particular patient [23]. New paradigms may therefore be needed to explain and better model individual variation in pathological loci [22].
Building on recent normative models focused on gray matter volume (GMV) [23], the current study used normative modeling to investigate individual deviations from normative ranges of variation in measures of white and gray matter structure derived from a large, multi-site, schizophrenia cohort. In particular, we aimed to evaluate the extent to which regional loci of individual deviations conformed with conventional group-average anatomical maps of schizophrenia pathology. We also explored potential genetic and clinical drivers of such deviations.
To this end, we investigated schizophrenia-related changes in two measures of brain structure derived from magnetic resonance images (MRI) acquired at five scanner sites. Cortical thickness (CT) was measured to index changes in gray matter comprising the cortical sheet, while fractional anisotropy (FA) provided a broad measure of axonal health in white matter [24]. These measures were chosen because they can be reliably measured at the individual level [25], they have been extensively investigated across the lifespan in schizophrenia [26, 27], and case-control differences in FA and CT have recently been mega- and meta-analyzed as part of consortia-driven initiatives [3, 6]. These meta-analyses establish a neuropathological profile that is associated with significantly lower FA and CT across virtually the entire brain, yet it is unclear whether this profile of profound abnormality is truly representative of individual patients.
Here, we developed normative models of FA and CT across the lifespan using harmonized MRI data from healthy adults (18–65 years) participating in the Australian Schizophrenia Research Bank [28]. This established normative ranges of variation in these measures, represented as functions of age and sex. Individual deviations from the normative range were then determined for more than 300 adults with schizophrenia. Consistent with CT and measures of brain volume [20, 23], we hypothesized that white matter loci deviating from the normative range for FA would vary markedly among individuals and these deviations would relate to interindividual variation in polygenic risk for schizophrenia. This study provides new insights into the neurobiological heterogeneity of schizophrenia and its genetic basis, and quantifies the extent of discrepancy between individual patients and group-consensus representations of brain changes.
Materials and methods
This study was approved by the Melbourne Health Human Research Ethics Committee (Project ID: 2010.250). All participants provided written informed consent for the analysis of their data. Supplementary Fig. 1 provides a schematic of the overall methodology.
Participants
Participants comprising the Australian Schizophrenia Research Bank [28] with structural and diffusion-weighted MRI, genetic data, and symptom severity ratings were considered eligible. After excluding participants due to MRI artifacts, a total of 517 individuals remained for further analyses, comprising 322 (223 males) individuals diagnosed with schizophrenia or schizoaffective disorder and 195 (97 males) healthy comparison individuals. Participants were recruited from five sites in Australia, with all sites implementing exactly the same recruitment procedures, as described in detail elsewhere [28]. Exclusion criteria included any neurological disorder, history of brain trauma followed by a long period of amnesia (>24 h), intellectual disability (full-scale IQ < 70), current drug or alcohol dependence, as well as electroconvulsive therapy in the past 6 months. Statistical methods were not used to predetermine sample size. Demographic information and basic clinical characteristics are shown in Supplementary Table 1.
Clinical and cognitive assessments
Individuals with schizophrenia completed assessments of clinical status (DIP), symptom severity (SANS), current IQ (WASI) and cognitive performance (RBANS, COWAT), as described in Supplementary Material. Independent component analysis was used to parse 82 of the assessment scales into four latent dimensions characterizing interindividual variation in: (i) cognitive performance, and the severity of (ii) hallucinations, (iii) depressive symptoms, and (iv) negative symptoms (Supplementary Fig. 2). Candidate ICA models ranging from 3 to 20 components were evaluated and the four-component model was deemed optimal (Supplementary Material).
MRI acquisition and processing
Structural and diffusion-weighted MRI of brain anatomy were acquired using Siemens Avanto MRI scanners located in Melbourne, Sydney, Brisbane, Perth and Newcastle. The same acquisition sequence was used at all sites. Structural T1-weighted images were acquired using an optimized MP-RAGE sequence (voxel resolution: 1 mm3 isotropic, TR: 1980 ms, TE: 4.3 ms). Diffusion-weighted images for 64 non-collinear gradient directions were acquired using spin-echo echo-planar imaging (b value: 1000 s/mm2, voxel resolution: 2.4 mm3 isotropic, TR: 8400 ms, TE: 88 ms). Participants showing gross artifacts, cerebellar cropping and/or significant head motion were excluded, following protocols established as part of a prior study in this cohort [11].
Harmonization
An individual traveled to all five sites and was scanned at each site to quantify gross inter-site differences. A Siemens MRI phantom was also scanned at each site to enable inter-site calibration. This calibration was done prior the data collection to help minimize the inter-site variability caused by the scanner. In addition, in this study, the diffusion-weighted images were retrospectively harmonized to alleviate possible nonlinear site-related differences. We followed a robust harmonization procedure developed in our previous work [29]. Specifically, a reference site was selected (Brisbane), with age and sex-matched healthy controls from each remaining site (Supplementary Table 1). These healthy control subsets were used to compute a nonlinear mapping of the diffusion MRI signals between the reference site and each remaining target site, based on features of rotation invariant spherical harmonics [29]. This mapping was then used to update the diffusion-weighted images for each remaining individual.
Fractional anisotropy
Fractional anisotropy (FA) images were computed from the diffusion-weighted MRI data using FSL 5.11 (www.fsl.fmrib.ox.ac.uk). Six individuals with schizophrenia were excluded due to artifacts (movement, ghosting and/or signal dropout), yielding the final sample described above. Eddy current-induced distortions and head motion in the diffusion-weighted MRI data were corrected using the eddy tool in FSL. FA images were then computed for each voxel by independently fitting a single tensor to the corrected data using least squares regression, modeling only an anisotropic compartment (single compartment). FA images were normalized to Montreal Neurological Institute standard space using the ANTs package [30]. An established reference FA image was used as the normalization target [31]. FA was averaged overall voxels comprising each of the 48 white matter tracts delineated within the ICBM-DTI-81 white matter atlas [32]. Hence, each individual was characterized by a tract-averaged FA value for each of 48 distinct white matter tracts.
Cortical thickness
Structural images were processed using Freesurfer 6.0 [25]. Preprocessing included motion correction, intensity normalization, non-brain tissue removal, and spatial normalization to Talairach-like space. The preprocessed images were segmented into gray matter, white matter, and cerebrospinal fluid, after which white matter and gray matter (pial) surfaces were reconstructed. The reconstructed surfaces were not manually edited. Cortical thickness was estimated for each surface vertex based on the distance separating the gray and white matter surfaces. Cortical thickness was averaged overall vertices comprising each of the 68 cortical regions of the Desikan-Killiany atlas [33, 34].
Normative modeling
Quantile regression [35, 36] was used to determine percentile curves for each cortical region and each white matter tract. Whereas conventional regression aims to predict the mean of a response variable (e.g., CT or FA), given certain explanatory variables (e.g., age and sex), quantile regression aims to predict percentiles of interest, such as the median (50th percentile). This enabled statistical operationalization of a normative range of variation in terms of percentiles expressed as a function of age and sex.
For each white matter tract, the following quantile regression model was fitted using only the healthy comparison individuals to infer percentiles for tract-averaged FA:
For the healthy participant with index i, sexi encodes the participant’s sex (male: 0, female: 1), agei is the participant’s age, and Ci encapsulates nuisance confounds, including acquisition site. Under this model, β0 is the estimated FA for a male of age A, β1 is the between-sex difference in FA at age A, β2 is the rate at which FA changes per year at age A, while β3 and β4 model the sex-by-age interaction and nonlinear age effects, respectively. The sex-by-age interaction (β3) and the nonlinear age-squared term (β4) were only included when justified by the Bayesian information criteria. The variable A can be chosen to make inference specific to a particular age. In practice, A was set to the average age of the healthy control group. The same quantile regression model was also fitted to infer percentiles for average CT in each cortical region.
We specifically estimated the 50th (median), 5th, and 95th percentiles using an established approach [36]. Bootstrapping was used to estimate confidence intervals for each percentile. Figure 1 shows estimated percentile curves for a representative cortical region and white matter tract, where confidence intervals widen for age intervals comprising fewer individuals.
Fig. 1. Percentile curves for an example cortical region and white matter tract.
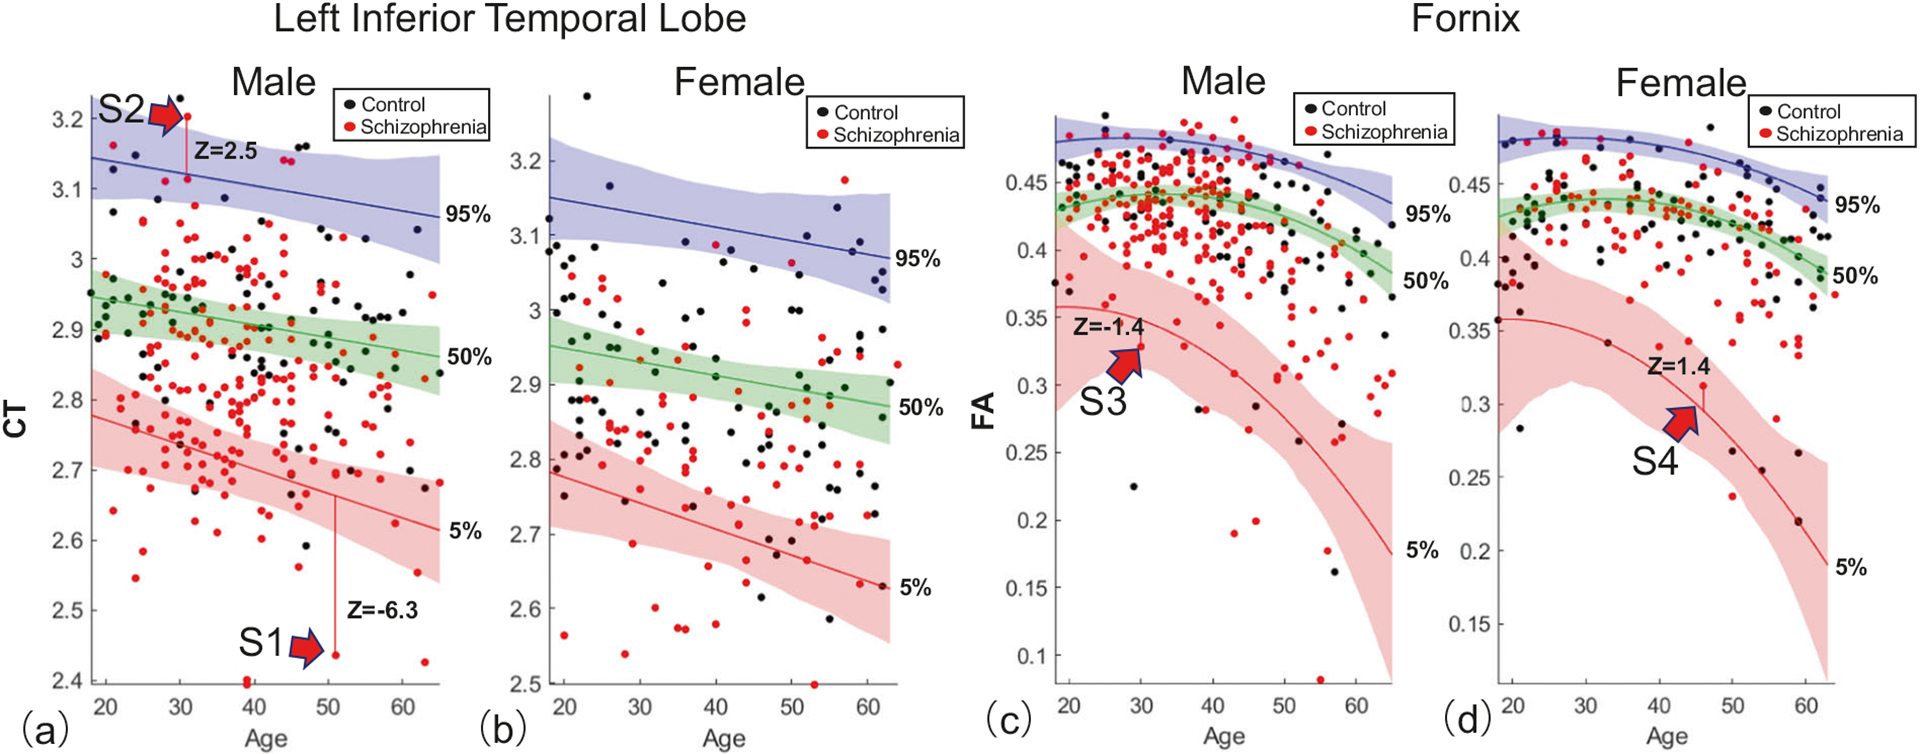
The 5th (red curve), 50th (green), and 95th (blue) percentiles quantify the range of variation among 195 healthy individuals (black dots) in the cortical thickness (CT) of the inferior temporal lobe, as a function of age (horizontal axis) and sex (a, male; b, female). The measurement unit of CT is millimeters and age is quantified in years. Shading indicates 95% confidence intervals, estimated with bootstrapping (n = 1000). c, d are comparable to (a, b) but represent tract-averaged fractional anisotropy (FA) in the fornix. Unlike (a, b), inclusion of the age-squared term in the quantile regression model was justified by the Bayesian Information Criterion, resulting in nonlinear percentile curves. Individuals with schizophrenia (red dots) were not used to fit the percentiles curves. Deviations from the 5th and 95th percentiles are shown for four individuals with schizophrenia and quantified with z scores. Individuals with a z score below −1.96 for the 5th percentile were categorized as infra-normal (e.g., S1), while those with a z score exceeding 1.96 for the 95th percentile were called supra-normal (S2). Individuals denoted S3 and S4 were deemed to reside within the normative range of variation for healthy adults of the same age and sex.
Individual deviations from normative ranges: infra- and supra-normal
For each cortical region and white matter tract, individuals with schizophrenia were positioned on the normative percentile charts (red dots, Fig. 1) and then categorized as either: (i) within the normative range of variation for healthy adults of the same age and sex, labeled as normal (e.g., S3, S4, Fig. 1); (ii) significantly exceeding the normative range, labeled as supra-normal (S2); or, (iii) significantly below the normative range, labeled as infra-normal (S1). This mutually exclusive classification was guided by z scores quantifying individual deviation from the 5th and 95th percentiles. Standard deviations for z scores were derived from the bootstrapped confidence intervals. Supra-normal was operationalized as any individual who exceeded the 95% confidence interval for the 95th percentile (i.e., z95 > 1.96), and infra-normal was operationalized as any individual who was below the 5% confidence interval for the 5th percentile (i.e., z5 < −1.96).
Each individual with schizophrenia was represented with a cortical deviation map in which regions and tracts were numerically encoded with either +1 (supra-normal), 0 (normal) or −1 (infra-normal; Supplementary Fig. 1a, b). The average of this numerical encoding across all loci provided a whole-brain summary measure called the average abnormality index (AAI), which quantified the overall extent of individual deviation. Individuals with a positive (negative) AAI were predominantly characterized by higher (lower) FA and/or CT than expected given their age and sex. An AAI of zero indicated no deviations, or an equal number of supra- and infra-normal deviations.
Genotyping and polygenic risk score
Genotyping was performed on peripheral blood samples using the Illumina Human610-Quad BeadChip, yielding 620,901 common single-nucleotide polymorphism (SNP) markers. Genotype imputation was performed using Minimac3 [37], with the 1000 Genomes Project Phase III integrated release version 5 for European populations serving as the reference. Further details pertaining to imputation in this cohort are described in detail elsewhere [38]. A polygenic risk score (PRS) was computed for each individual based on 112 of 128 SNPs previously found to meet genome-wide significance for an association with schizophrenia [39]. The 16 SNPs excluded from the PRS calculation were either missing in more than 20% of individuals or did not satisfy imputation quality control [38]. For each SNP, the number of risk alleles was multiplied by the logarithm of the odds ratio. The resulting multiplicands were then summed to yield the PRS. Previously reported odds ratios were used [39].
Results
Group differences
Before establishing normative models of FA and CT, we first tested for significant group-level differences between the schizophrenia and healthy comparison group using conventional case-control inference, as described in Supplementary Material. Consistent with previous studies of this cohort [4, 10, 11], significant group-level differences in FA and CT were widespread and evident for the majority of white matter tracts (40 of 48, 83%, Fig. 2a) and cortical regions (60 of 68, 88%, Fig. 2b), respectively. For all significant tests (FDR < 5%), FA and CT were lower in the schizophrenia group compared to the healthy comparison group, with effect sizes varying among regions.
Fig. 2. Deviation from normative ranges for measures of brain structure in individuals with schizophrenia.
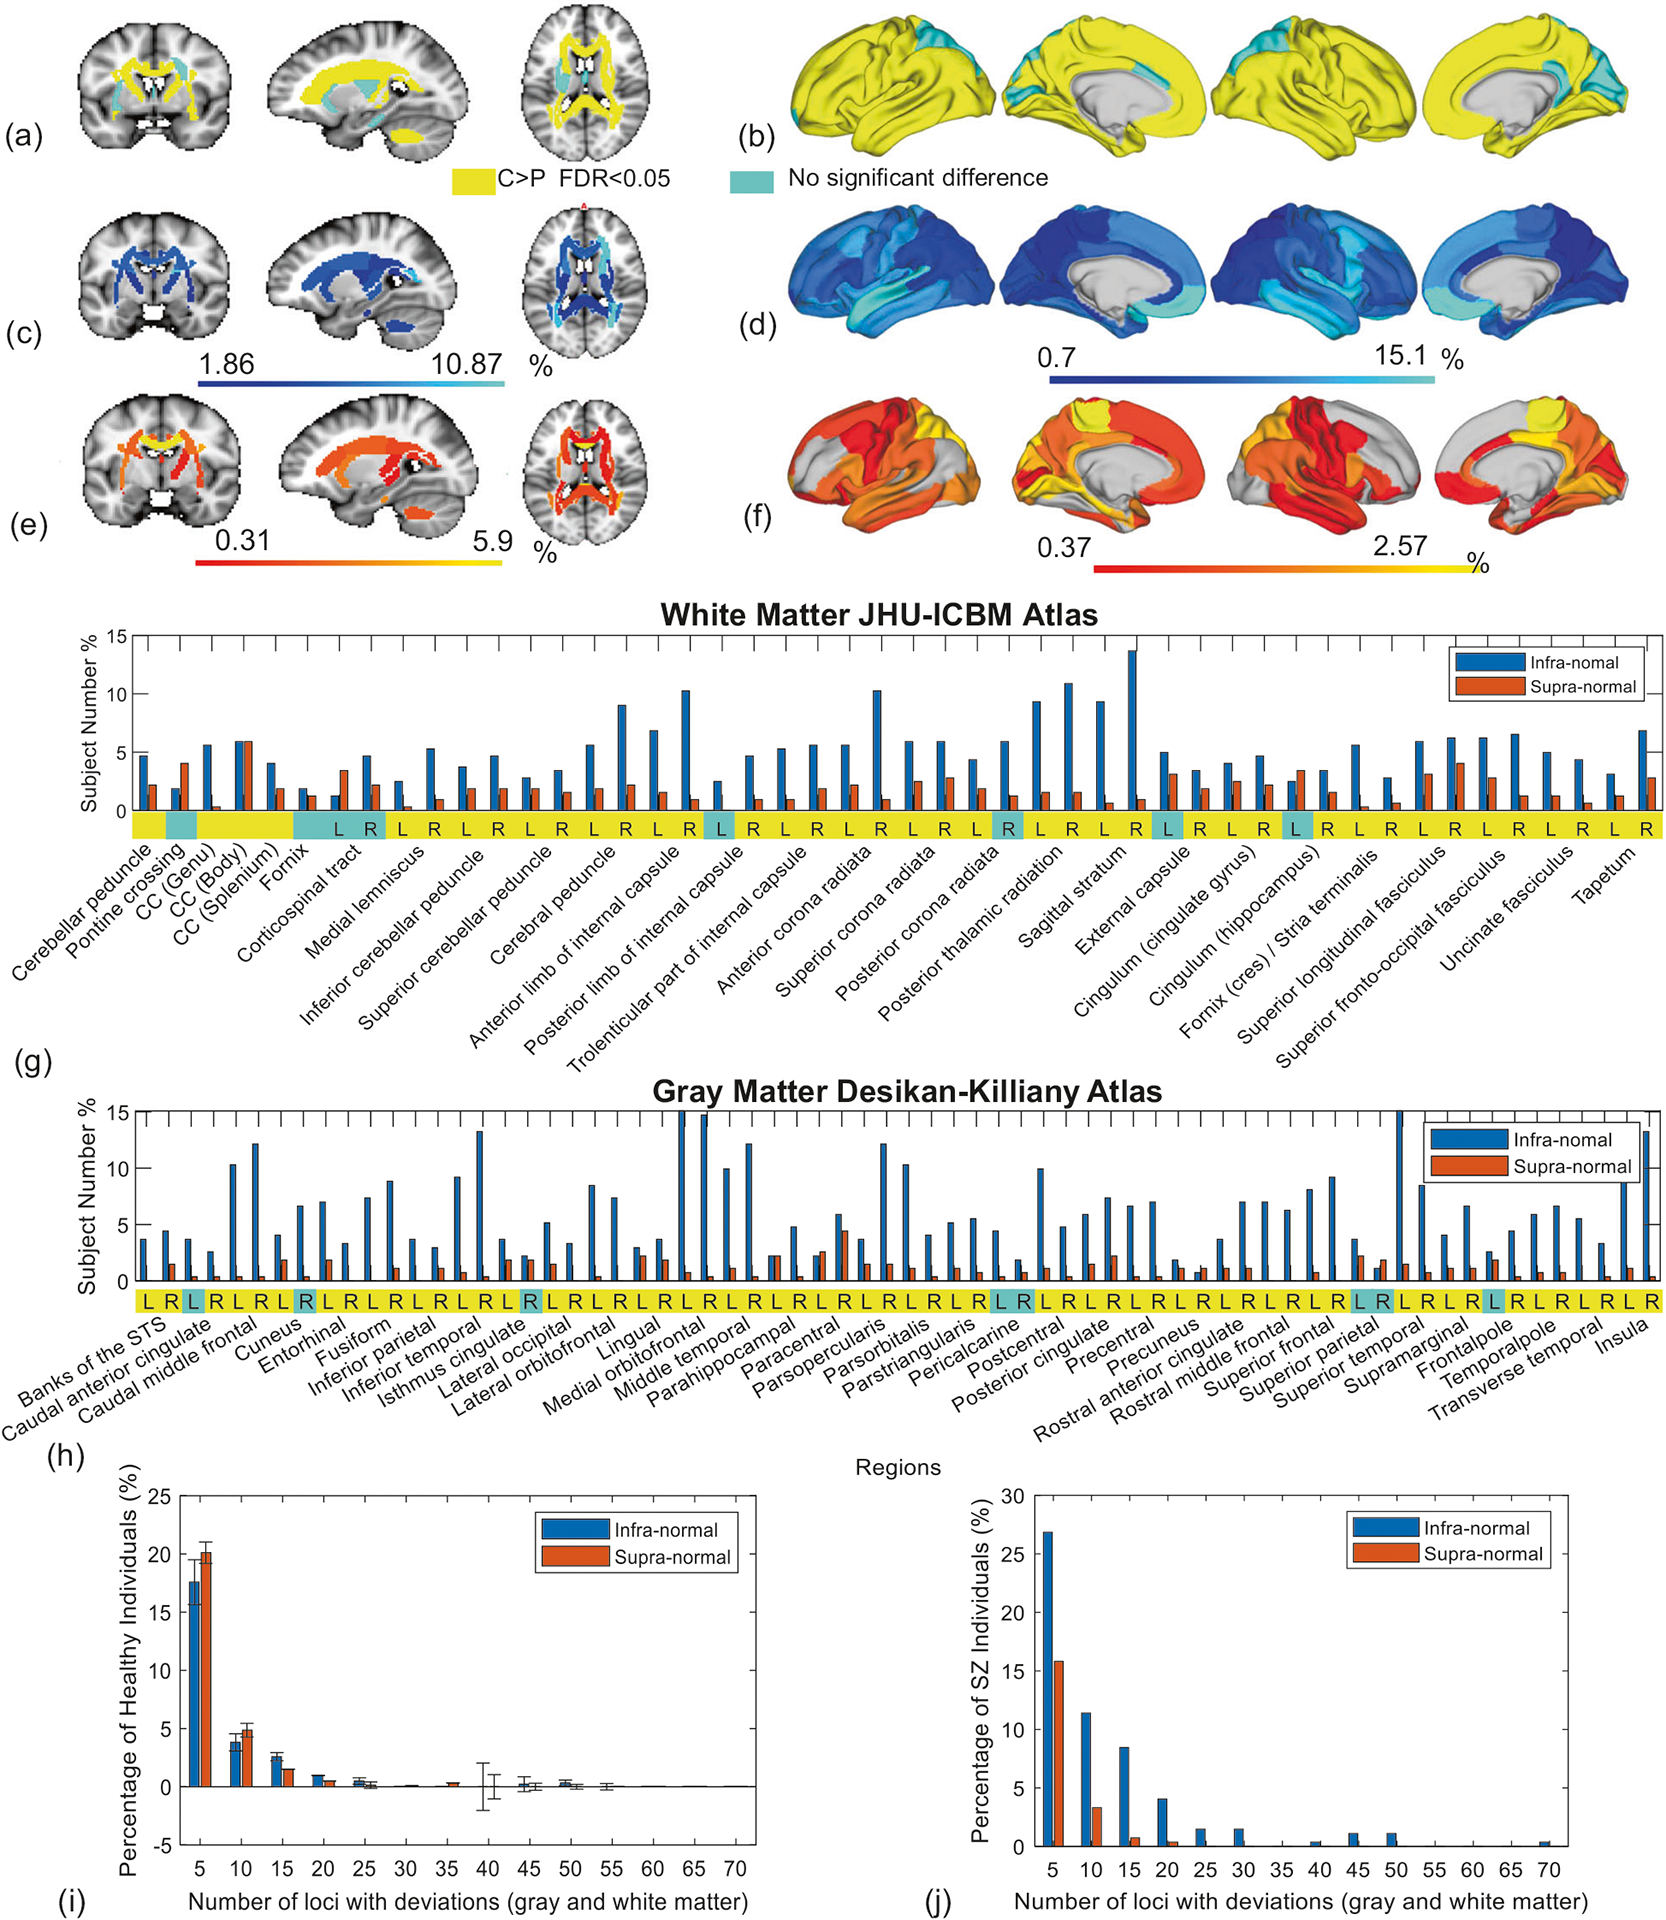
Case-control group-average differences in (a) fractional anisotropy (FA) shown as three representative brain slices and (b) cortical thickness (CT) rendered onto the cortical surface. At the group level, FA and CT were significantly lower in the schizophrenia group, compared to the healthy comparison group, for tracts and regions colored in yellow. False discovery rate (FDR) controlled at 5% across the set of 48 tracts and 68 regions. Left cortical surface is shown on the left. c–f Each region and tract for each individual with schizophrenia was classified as either infra-normal (<5% percentile, cool colors), supra-normal (>95% percentile, warm colors) or within the normative range of healthy adults of the same age and sex. Brain slices and cortical renderings show the percentage of individuals with infra-normal (c, d) and supra-normal (e, f) FA and CT. g, h Bar plots show percentage of individuals deviating from the normative range for each white matter tract (g) and cortical region (h) (blue: infra-normal, red: supra-normal). Yellow (cyan) stripes indicate (no) significant group-level differences (FDR < 5%). i, j Bar plots show the distribution of the total number of regions and tracts per individual with infra-normal (blue bar) and supra-normal (red) deviations from the normative model. Separate bar plots are shown for the healthy comparison individuals (i) and individuals with schizophrenia (j). Error bars denote 95% confidence intervals, as derived from cross-validation. CC corpus callosum, L left, R right.
Individual deviation from normative range
Having found widespread group-level differences in FA and CT, we next sought to use normative modeling to establish the extent to which these differences characterized individual patients. To this end, normative ranges of variation in FA and CT for each tract and region, respectively, were established based on the healthy comparison individuals (n = 195) and operationalized as the range between the 5 and 95% percentiles for a given age and sex (see Materials and Methods).
First, we established the validity of the normative ranges. To this end, percentile curves were fitted using a randomly selected subset of healthy individuals (n = 175, training set) and the proportion of remaining healthy individuals residing within the 5–95% percentiles (normative range) was enumerated (n = 20, test set). This was repeated for 20 randomly selected test-training subsets, using a tenfold cross-validation framework. For all cortical regions and white matter tracts, more than 90% of the healthy individuals in each test set resided within the normative range (Supplementary Fig. 3), confirming that the normative models were not predicting an excessive number of deviations (i.e., no fewer than 90% of healthy individuals should reside within the normative range defined by 5–95% percentiles).
Having established validity in the normative model, we next positioned each patient within the normative range for healthy adults of the same age and sex. Each region and tract for each patient was classified as either infra-normal (<5% percentile, Fig. 2c, d), supra-normal (>95% percentile, Fig. 2e, f) or within the normative range. In contrast to the group-level differences (Fig. 2a, b), which portray a disorder characterized by widespread reductions in FA and CT, the majority of individuals with schizophrenia were within the normative range established for each tract and region.
In particular, no more than 17% of patients deviated from the normative range for any single white matter tract. In other words, for any particular tract, 83% of patients were within the tract’s normative range. Similarly, no more than 18% of patients deviated from the normative range for any single cortical region. Infra-normal deviations in CT were most commonly located in temporal and ventromedial prefrontal cortices (Fig. 2d), although only 10–15% of patients showed significant deviations in these regions. Supra-normal deviations in CT were most common in the paracentral lobule (3% of individuals, Fig. 2f). In terms of FA, infra-normal deviations were relatively diffuse (Fig. 2c), while supra-normal deviations were most commonly located in the genu of the corpus callosum (6% of individuals, Fig. 2e).
It could be argued that relatively few patients deviated from the normative range for any single tract or region because the normative range was too inclusive (5–95%). This argument could be refuted on the basis that infra-normal deviations for at least one tract or region were evident in 79% of patients, whereas this was the case for only 59 ± 2% of healthy individuals (p < 0.001, Fig. 2i, j). Note that while the probability of an infra-normal deviation at any given locus was 5% (or less) for a healthy individual, this probability accumulated across all 48 tracts and 68 cortical regions, and thus the probability of a deviation for at least one locus was substantially >5%. Interestingly, supra-normal deviations for at least one locus were evident in 46% of patients, significantly lower than the 61 ± 3% of healthy individuals (p < 0.001, Fig. 2i, j).
Collectively, these findings suggest that while reductions in FA and CT are indeed a core neuropathological feature that is evident in most individuals with schizophrenia, the specific white matter tracts and cortical regions affected by these reductions vary markedly between individual patients.
To exemplify the marked heterogeneity among individuals in the anatomical loci of significant deviations from the normative range, Fig. 3 shows FA and CT deviation maps for two particular individuals of the same age and sex. In particular, regional maps of the raw FA and CT measures are shown (top row), together with percentiles (middle) and significant deviations from the 5–95% percentiles (bottom). While the raw CT maps are relatively consistent between the two individuals, no overlap is evident in the loci showing significant deviations from the normative range and the percentile maps show little spatial correspondence. Similar observations are evident for FA.
Fig. 3. Loci of deviations from the normative range for two individuals with schizophrenia.
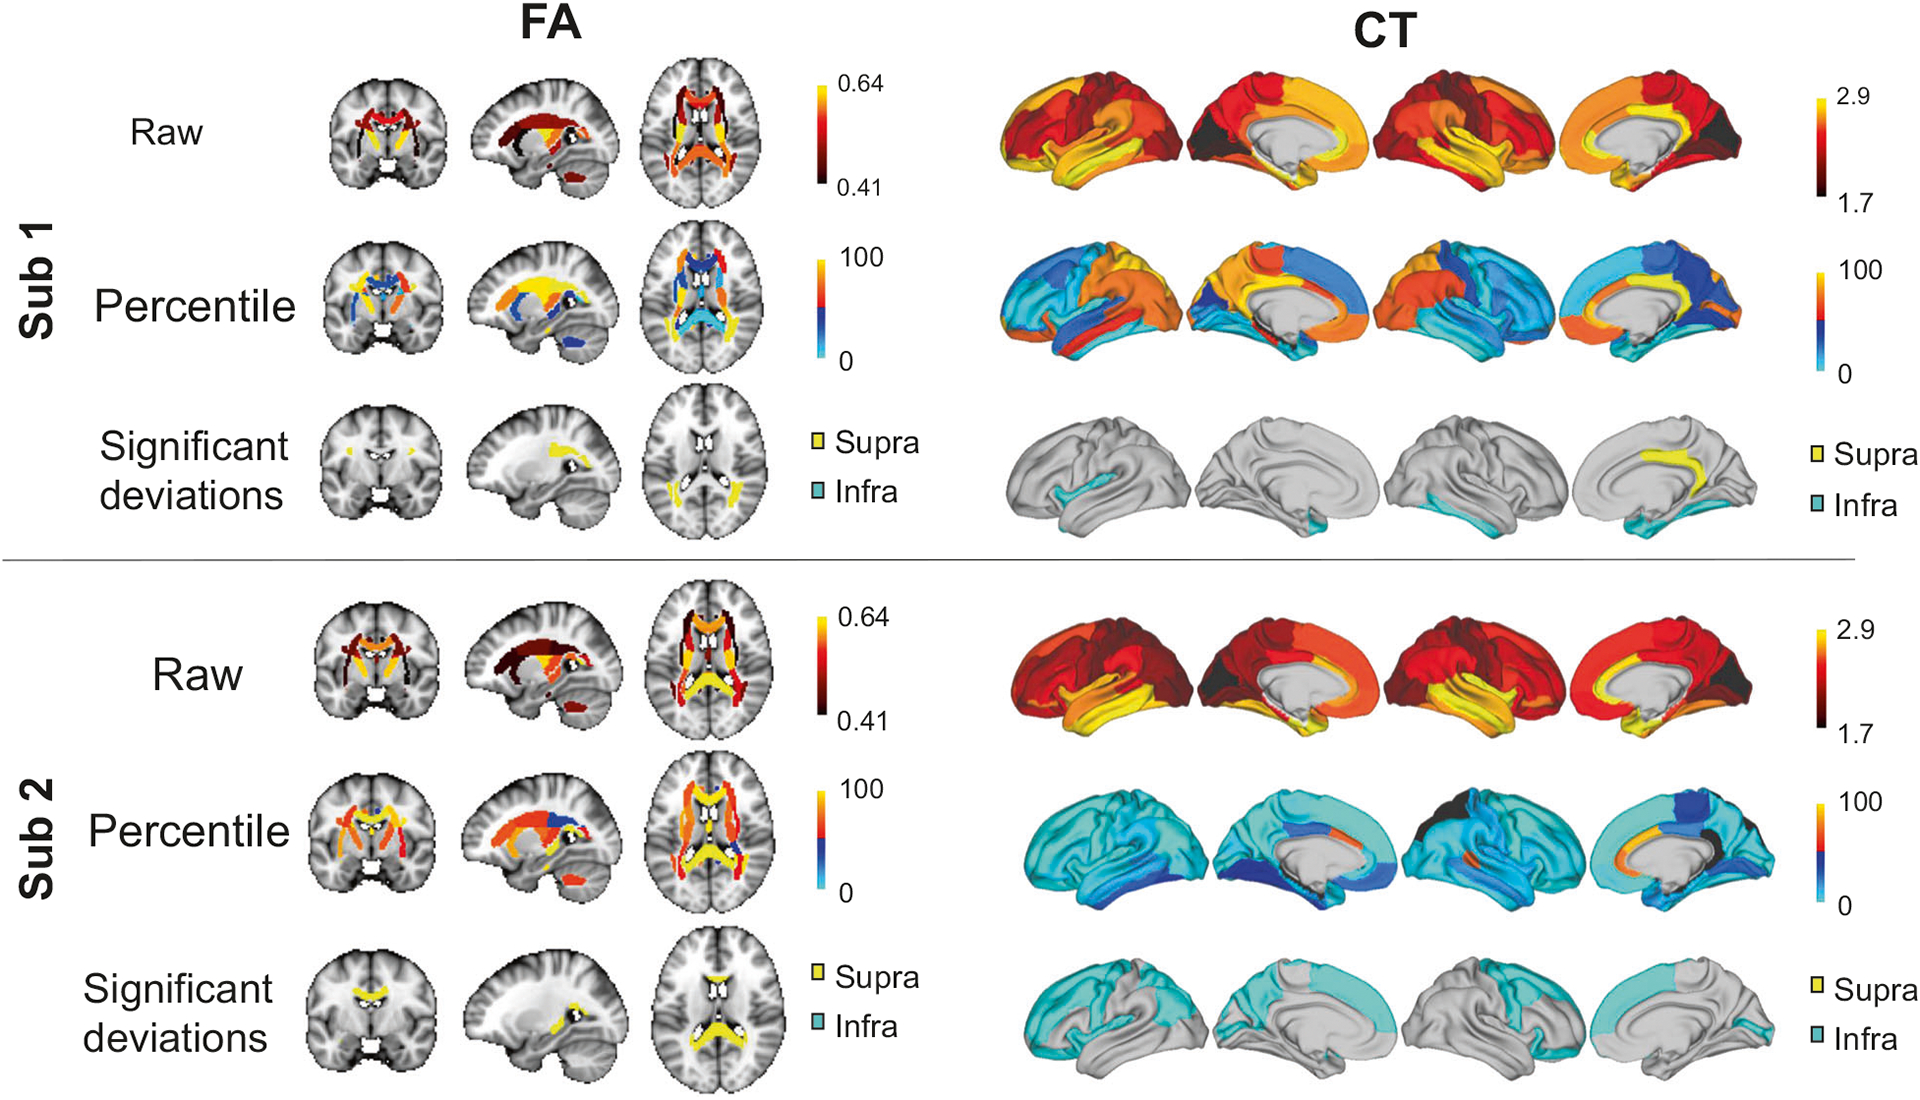
For two females with schizophrenia aged 37 years (Sub 1, Sub 2), fractional anisotropy (FA) is shown as three representative brain slices (left) and cortical thickness (CT) is rendered onto the cortical surface (right). Raw FA and CT maps are shown (top row), together with percentiles (middle row) and significant deviations from the normative range (bottom row) for healthy adults of the same age and sex. Infra- and supra-normal deviations are colored in cyan and yellow, respectively. Gray-colored regions are within the normative range (5–95% percentiles). Percentiles are expressed as percentages, CT is measured in millimeters and FA is a unitless measure.
Associations with polygenic risk
Next, we tested whether PRS for schizophrenia related to individual deviations from the normative range for FA and CT, as summarized by the AAI index (see Materials and Methods). PRS was significantly correlated with the AAI (r = −0.13, n = 322, p = 0.033) and the AAI based on CT alone (r = −0.17, n = 322, p = 0.006), but not with the AAI based on FA alone (p > 0.05, Supplementary Fig. 4). The correlation was negative, meaning that a greater genetic risk for schizophrenia was associated with a greater number of cortical regions with CT measurements falling below the normative range. Supplementary analyses revealed that individual variation in PRS was not significantly correlated with raw measurements of FA and CT averaged over the cortex or all tracts, respectively. Although the variance explained in PRS by the AAI was modest (1.8–3%), these associations suggest that individual deviations are more strongly controlled by schizophrenia risk genes than the raw measures per se.
The AAI is a whole-brain summary index, and as such did not provide insight into which specific tracts or regions most influenced the relation between the AAI and PRS. Therefore, canonical correlation analysis (CCA) was used to determine which tracts and regions were most influential to the association with PRS (Supplementary Material). Deviation scores for all tracts and regions comprised one side of the CCA, while PRS comprised the other side. CCA identified a significant mode of association between PRS and the deviation scores (r = 0.69, n = 322, p = 0.044, 5000 permutations, Fig. 4). Infra-normal CT deviations in temporal regions were the strongest predictors of genetic risk (Fig. 4e).
Fig. 4. Association between polygenic risk for schizophrenia and individual deviations from the normative range for measures of brain structure.
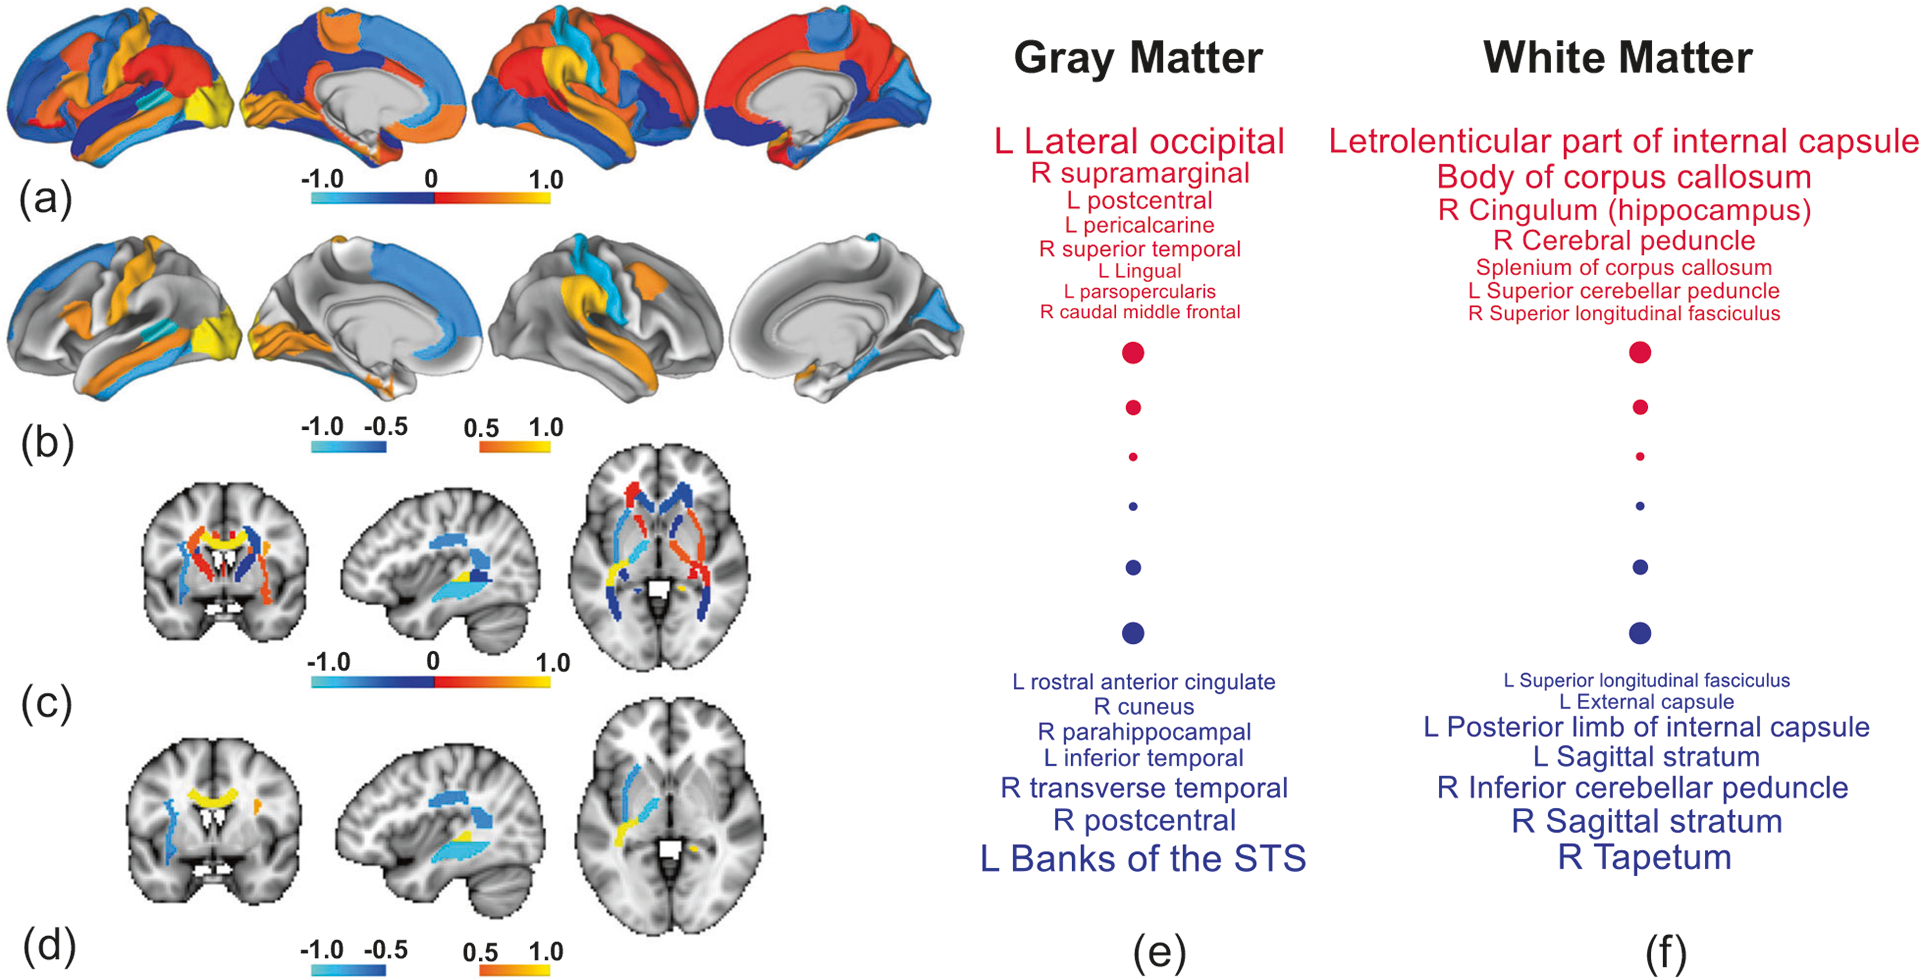
Canonical correlation analysis (CCA) identified a significant association between polygenic risk scores (PRS) and a combination of deviation scores from 48 white matter tracts and 68 cortical regions. a Regional CCA weights (canonical coefficients) rendered onto the cortical surface. Weights are normalized to aid visualization. Higher positive weights (warm colors) indicate cortical regions for which supra-normal deviations in cortical thickness (CT) associate with higher genetic risk, whereas negative weights (cool colors) indicate regions for which infra-normal deviations relate to higher risk. Left cortical surface is shown on the left. b Same as (a) but thresholded to suppress weights with an absolute value below 0.5. c, d Same as (a, b) but for fractional anisotropy. e, f Cortical regions (e) and white matter tracts (f) ranked according to CCA weight. Positive and negative weights are shown in red and blue font, respectively. Font size increases linearly with the absolute value of weight, and thus regions and tracts shown in larger font contribute most to the association. The smallest weights by absolute value are not shown. R right hemisphere, L left hemisphere, STS superior temporal sulcus.
Associations with symptom severity and cognition
The AAI was not significantly correlated with any of the four latent dimensions (cognitive performance, hallucinations, depressive symptoms, and negative symptoms; all p > 0.05, Supplementary Fig. 2). However, CCA performed as part of supplementary analyses identified a marginally significant mode of association between the four dimensions and the deviation scores for each tract and region (r = 0.75, n = 322, p = 0.048, 5000 permutations; Supplementary Fig. 5).
Reproducibility between acquisition sites
Control analyses were undertaken to evaluate the reproducibility between acquisition sites (Brisbane, Sydney, Melbourne, Perth, Newcastle) in the cortical maps expressing the percentage of individuals with infra-normal deviations (Fig. 2c, d). To this end, infra-normal maps were computed independently for each site and the spatial correlation across cortical regions in the percentage of individuals with infra-normal deviations was evaluated using the Pearson correlation coefficient. Infra-normal CT maps were significantly correlated between all 11 pairs of sites (r = 0.25–0.6, p < 0.05), except for the Sydney-Newcastle pair (Supplementary Fig. 6). Infra-normal FA maps were significantly correlated for all pairs, except for pairs involving Perth and Sydney (Supplementary Fig. 7). Cohort sizes were smallest for Perth (n = 37) and Newcastle (n = 17), potentially explaining the lower reproducibility for these two sites.
Supplementary analyses
In supplementary analyses, we found that interindividual variation in the AAI computed for CT was significantly associated with the AAI computed for FA (r = 0.26, p < 0.001; Supplementary Fig. 8). This indicates that individuals deviating from the normative range for white matter tracts were also likely to deviate for gray matter regions, suggesting a link between gray and white matter pathology. Furthermore, deviations in CT were reproduced using a higher resolution atlas (Supplementary Fig. 9a–d) and interindividual variation in the AAI for CT was highly correlated between the two atlases (Supplementary Fig. 9e). This establishes the robustness of the analyses. To complement the CCA-based multivariate analysis of symptom severity and deviation scores, each individual item of the DIP was separately tested for an association with the deviation scores for each white and gray matter region. After controlling the false discovery rate at 5%, DIP items relating to hallucinations, delusions, and depression were found to associate with CT deviations in frontal and temporal regions (Supplementary Table 2). The AAI did not associate with interindividual variation in absolute (r = −0.031, p = 0.6) and relative (r = −0.049, p = 0.41) head motion estimates in diffusion MRI, suggesting that deviations from the normative range were not attributable to motion. We found that current IQ was significantly associated with the AAI for CT (r = 0.16, p = 0.008), but not with the AAI for FA (r = 0.08, p = 0.2). Given that schizophrenia is associated with pervasive cognitive deficits, it is difficult to differentiate the effect of IQ on deviations from the disorder per se.
Discussion
In this study, we showed that across a large cohort of individuals with schizophrenia, there is vast heterogeneity in the anatomical loci of white and gray matter abnormalities. In particular, while patients exceeded the normative ranges established for FA for a significantly greater number of tracts than the healthy comparison individuals, no single tract was found for which the majority of patients deviated from the normative range. We also found comparable levels of heterogeneity in CT, confirming recent findings of normative modeling in gray matter [23].
While gray and white matter abnormalities are indeed a core neuropathological feature of schizophrenia, our findings suggest that the anatomical loci affected by these abnormalities differ vastly across individuals to the extent that group-average maps of schizophrenia pathology do not accurately resemble individual patients. Neatly pinning down schizophrenia-related changes in FA and CT to distinct white matter tracts and circumscribed cortical regions will most likely be unattainable with conventional case-control inferential paradigms applied to the current broad diagnostic construct.
Some of the largest neuroimaging meta-analyses performed to date, based on thousands of individuals with schizophrenia, have yielded a neuropathological profile of a disorder associated with profound structural brain changes, significantly affecting virtually all cortical regions [3], subcortical volumes [5], and white matter fascicles [6], albeit with varying effects sizes. While this provides an accurate group-level characterization, our findings suggest that such profound and widespread abnormalities are not representative of most individuals with schizophrenia.
As a diagnostic construct, schizophrenia can be conceptualized as encompassing multiple putative subtypes [40] or dimensions [41], each of which is characterized by a unique neuropathological profile [42]. Pooling individuals from each subtype and testing for case-control differences in the pooled cohort is likely to yield group-average anatomical maps of schizophrenia pathology that are diffuse, widespread, and implicate some combination of the distinct loci associated with each subtype. One way forward may, therefore, be to stratify individuals into relatively homogeneous subtypes using clinical or biological criteria, and then map cortical deviations for each subtype. However, attempts to parse the heterogeneity of schizophrenia into subtypes or simpler component disorders that cut across conventional diagnostic boundaries have not yielded widely used biological subtypes [43]. An alternative hypothesis is that while pathological loci appear sporadically distributed across the cortical surface, their distribution might be explained by underlying latent factors, such as network connectivity [4, 44].
Our work accords with the recent study of Wolfers et al. (2018), although some key differences warrant discussion. While these authors did not investigate FA, their normative modeling of volumetric measures of brain structure indicate even less consistency in the loci of deviations than that found here. In particular, they found very few loci for which more than 2% of patients deviated from the normative ranges for gray and white matter volume. These authors used a more inclusive normative range (i.e., |z| < 2.6), potentially explaining the lower consistency compared to the current study, since fewer deviations manifest overall as the normative range is widened, resulting in fewer opportunities for deviations to overlap. Nevertheless, the deviation maps for GMV presented by Wolfers et al. broadly recapitulate those for CT reported here (Fig. 2d), with infra-normal deviations in both CT and GMV most numerous in the frontal and temporal cortices.
We found that a higher polygenic loading for schizophrenia related to a greater number of loci with infra-normal deviations, particularly infra-normal deviations in CT located within the frontal and temporal cortices. This accords with previous studies reporting that higher genetic risk associates with global CT reductions [45], particularly in frontal and temporal cortices, but not with a measure of brain heterogeneity [20]. In the current study, the association did not remain significant when deviations in CT were substituted for raw CT measurements. This potentially suggests that deviations from a normative range of variation may be directly influenced by risk alleles, rather than these alleles exerting their influence on an individual’s sensitivity to environmental factors.
Several limitations require consideration. First, MRI data are inherently noisy and individual measurements are particularly susceptible to the effects of noise and imaging artifacts. Some individual deviations could have been spurious and owing to noise. To minimize this risk: (i) exactly the same acquisition sequence and model of MRI scanner was used at all sites; (ii) reproducible and robust measures of brain structure were used; (iii) all measures were averaged over relatively large numbers of voxels and surface vertices to enhance signal-to-noise ratios; and, (iv) images not satisfying quality control criteria were excluded. Second, while data harmonization was performed to minimize inter-site differences in FA, deviation maps were not reproduced for the two smallest sites (Newcastle, Perth). In contrast, deviation maps in CT were consistent between virtually all sites, and thus harmonization was not performed on the structural MRI images. Third, normative ranges were operationalized subjectively (5–95% percentiles) and further work is required to determine the minimum thresholds for a deviation to have a clinically meaningful impact. Increasing the size of the normative sample would also assist with refining the normative ranges and their confidence intervals, although this may present harmonization challenges inherent to alleviating scanner differences introduced through the addition of new cohorts. An advantage of the current sample is that MRI was acquired using the same acquisition protocol for all participants. Fourth, individual variation in medication status, age of onset, and illness duration could potentially contribute to heterogeneity. Fifth, while quantile regression is robust, computationally efficient, statistically unbiased, requires minimal assumptions about the data and enables straightforward evaluation of model fit [36], alternative normative modeling techniques, moving averages and machine learning should be considered in the future to establish normative ranges in larger samples [17]. Alternatively, the concept of FA potholes [22] could be applied to characterize white matter abnormalities that do not spatially overlap. Finally, the diffusion-weighted MRI data were acquired on 1.5 Tesla scanners using a single-shell acquisition sequence, potentially limiting the ability to investigate more specific microstructural properties other than those from conventional anisotropy measures. Note that previous analyses conducted in a subset of the cohort studied here found that extracellular free water [46] was not significantly elevated in the schizophrenia group [47]. Therefore, we focused on mapping conventional anisotropy measures from the diffusion tensor, given this prior evidence and to ensure that the normative models developed would be applicable and relevant to recent meta- and mega-analyses of white matter microstructure in schizophrenia [6].
Conclusions
We found that the loci of schizophrenia-related changes in white matter microstructure and CT differ vastly between patients. For this reason, group-consensus brain maps of schizophrenia pathology derived from conventional case-control paradigms might not provide an accurate picture of individual patients. Case-control studies tend to suggest that structural brain changes are more widespread and diffuse than what is truly the case for many individuals with schizophrenia. Our work calls to question the viability of ongoing endeavors to derive group-average network and cortical maps of schizophrenia pathology. Normative models provide one way forward to unravel neuropathological heterogeneity and potentially facilitate personalized medicine in neuropsychiatry. Individual deviation maps could be used to identify personalized targets for neural stimulation therapies [48], enable patient-centered approaches to selection of antipsychotic drugs [49] and delineate putative subtypes [50].
Supplementary Material
Acknowledgements
This study used samples and data from the Australian Schizophrenia Research Bank (ASRB), funded by a National Health and Medical Research Council (NHMRC) Enabling Grant (386500; CIs & ASRB Manager: Carr V, Schall U, Scott R, Jablensky A, Mowry B, Michie P, Catts S, Henskens F, Pantelis C, Loughland C), and the Pratt Foundation, Ramsay Health Care, the Viertel Charitable Foundation, and the Schizophrenia Research Institute, using an infrastructure grant from the NSW Ministry of Health. Individual funding support: JL supported by NHMRC Project Grant (ID: APP1142801). MDB (ID: APP1175754) and VC (ID: APP1177370) supported by NHMRC Emerging Leadership Investigator Grants. RC supported by NHMRC Project Grant (ID: APP1103252) and ARC DECRA Fellowship. LC supported by NHMRC Project Grants (ID: APP1099082 and APP1138711). PK supported by Adrian & Simone Frutiger Foundation. OP supported by NIH: R01MH108574. YT supported by NHMRC Project Grant (ID: APP1142801). LS (ID: APP1140764), CP (ID: APP1105825), FC (ID: APP1117724) and AZ (ID: APP1136649) supported by NHMRC Research Fellowships.
Footnotes
Supplementary information The online version of this article (https://doi.org/10.1038/s41380-020-00882-5) contains supplementary material, which is available to authorized users.
Data availability
Genetic, clinical, neuropsychological and brain imaging data can be accessed from the Australian Schizophrenia Research Bank (ASRB), subject to approval of the ASRB Access Committee. Further details are available online (https://www.neura.edu.au/discovery-portal/asrb/).
Code availability
The Matlab function quantreg was used to perform quantile regression with bootstrapping confidence intervals. This code is publicly accessible.
Conflict of interest The authors declare that they have no conflict of interest.
References
- 1.Kuperberg GR, Broome MR, McGuire PK, David AS, Eddy M, Ozawa F, et al. Regionally localized thinning of the cerebral cortex in schizophrenia. Arch Gen Psychiatry. 2003;60:878–88. [DOI] [PubMed] [Google Scholar]
- 2.Pantelis C, Yucel M, Wood SJ, Velakoulis D, Sun D, Berger G, et al. Structural brain imaging evidence for multiple pathological processes at different stages of brain development in schizophrenia. Schizophr Bull. 2005;31:672–96. [DOI] [PubMed] [Google Scholar]
- 3.van Erp TGM, Walton E, Hibar DP, Schmaal L, Jiang W, Glahn DC, et al. Cortical Brain Abnormalities in 4474 Individuals With Schizophrenia and 5098 Control Subjects via the Enhancing Neuro Imaging Genetics Through Meta Analysis (ENIGMA) Consortium. Biol Psychiatry. 2018;84:644–54. [DOI] [PMC free article] [PubMed] [Google Scholar]
- 4.Wannan CMJ, Cropley VL, Chakravarty MM, Bousman C, Ganella EP, Bruggemann JM, et al. Evidence for network-based cortical thickness reductions in schizophrenia. Am J Psychiatry. 2019;176:552–63. [DOI] [PubMed] [Google Scholar]
- 5.van Erp TG, Hibar DP, Rasmussen JM, Glahn DC, Pearlson GD, Andreassen OA, et al. Subcortical brain volume abnormalities in 2028 individuals with schizophrenia and 2540 healthy controls via the ENIGMA consortium. Mol Psychiatry. 2016;21:547–53. [DOI] [PMC free article] [PubMed] [Google Scholar]
- 6.Kelly S, Jahanshad N, Zalesky A, Kochunov P, Agartz I, Alloza C, et al. Widespread white matter microstructural differences in schizophrenia across 4322 individuals: results from the ENIGMA Schizophrenia DTI Working Group. Mol Psychiatry. 2018;23:1261–9. [DOI] [PMC free article] [PubMed] [Google Scholar]
- 7.Ellison-Wright I, Bullmore E. Meta-analysis of diffusion tensor imaging studies in schizophrenia. Schizophr Res. 2009;108:3–10. [DOI] [PubMed] [Google Scholar]
- 8.Cetin-Karayumak S, Di Biase MA, Chunga N, Reid B, Somes N, Lyall AE, et al. White matter abnormalities across the lifespan of schizophrenia: a harmonized multi-site diffusion MRI study. Mol Psychiatry. 2019. https://pubmed.ncbi.nlm.nih.gov/31511636/. [DOI] [PMC free article] [PubMed] [Google Scholar]
- 9.Kubicki M, McCarley R, Westin CF, Park HJ, Maier S, Kikinis R, et al. A review of diffusion tensor imaging studies in schizophrenia. J Psychiatr Res. 2007;41:15–30. [DOI] [PMC free article] [PubMed] [Google Scholar]
- 10.Di Biase MA, Cropley VL, Cocchi L, Fornito A, Calamante F, Ganella EP, et al. Linking cortical and connectional pathology in schizophrenia. Schizophr Bull. 2019;45:911–23. [DOI] [PMC free article] [PubMed] [Google Scholar]
- 11.Klauser P, Baker ST, Cropley VL, Bousman C, Fornito A, Cocchi L, et al. White matter disruptions in schizophrenia are spatially widespread and topologically converge on brain network hubs. Schizophr Bull. 2017;43:425–35. [DOI] [PMC free article] [PubMed] [Google Scholar]
- 12.Zalesky A, Fornito A, Seal ML, Cocchi L, Westin CF, Bullmore ET, et al. Disrupted axonal fiber connectivity in schizophrenia. Biol Psychiatry. 2011;69:80–89. [DOI] [PMC free article] [PubMed] [Google Scholar]
- 13.van den Heuvel MP, Fornito A. Brain networks in schizophrenia. Neuropsychol Rev. 2014;24:32–48. [DOI] [PubMed] [Google Scholar]
- 14.Collin G, Kahn RS, de Reus MA, Cahn W, van den Heuvel MP. Impaired rich club connectivity in unaffected siblings of schizophrenia patients. Schizophr Bull. 2014;40:438–48. [DOI] [PMC free article] [PubMed] [Google Scholar]
- 15.Oestreich LK, Pasternak O, Shenton ME, Kubicki M, Gong X, McCarthy-Jones S, et al. Abnormal white matter microstructure and increased extracellular free-water in the cingulum bundle associated with delusions in chronic schizophrenia. Neuroimage Clin. 2017;12:405–14. [DOI] [PMC free article] [PubMed] [Google Scholar]
- 16.Zalesky A, Fornito A, Bullmore ET. Network-based statistic: identifying differences in brain networks. Neuroimage 2010;53:1197–207. [DOI] [PubMed] [Google Scholar]
- 17.Marquand AF, Kia SM, Zabihi M, Wolfers T, Buitelaar JK, Beckmann CF. Conceptualizing mental disorders as deviations from normative functioning. Mol Psychiatry. 2019;24:1415–24. [DOI] [PMC free article] [PubMed] [Google Scholar]
- 18.Meyer-Lindenberg A From maps to mechanisms through neuroimaging of schizophrenia. Nature. 2010;468:194–202. [DOI] [PubMed] [Google Scholar]
- 19.Jablensky A. The diagnostic concept of schizophrenia: its history, evolution, and future prospects. Dialogues Clin Neurosci. 2010;12:271–87. [DOI] [PMC free article] [PubMed] [Google Scholar]
- 20.Alnaes D, Kaufmann T, van der Meer D, Cordova-Palomera A, Rokicki J, Moberget T, et al. Brain heterogeneity in schizophrenia and its association with polygenic risk. JAMA Psychiatry. 2019;76:739–48. [DOI] [PMC free article] [PubMed] [Google Scholar]
- 21.Brugger SP, Howes OD. Heterogeneity and homogeneity of regional brain structure in schizophrenia: a Meta-analysis. JAMA Psychiatry. 2017;74:1104–11. [DOI] [PMC free article] [PubMed] [Google Scholar]
- 22.White T, Schmidt M, Karatekin C. White matter ‘potholes’ in early-onset schizophrenia: a new approach to evaluate white matter microstructure using diffusion tensor imaging. Psychiatry Res. 2009;174:110–5. [DOI] [PMC free article] [PubMed] [Google Scholar]
- 23.Wolfers T, Doan NT, Kaufmann T, Alnaes D, Moberget T, Agartz I, et al. Mapping the heterogeneous phenotype of schizophrenia and bipolar disorder using normative models. JAMA Psychiatry. 2018;75:1146–55. [DOI] [PMC free article] [PubMed] [Google Scholar]
- 24.Beaulieu C The basis of anisotropic water diffusion in the nervous system - a technical review. NMR Biomed. 2002;15:435–55. [DOI] [PubMed] [Google Scholar]
- 25.Fischl B, Dale AM. Measuring the thickness of the human cerebral cortex from magnetic resonance images. Proc Natl Acad Sci USA. 2000;97:11050–5. [DOI] [PMC free article] [PubMed] [Google Scholar]
- 26.Kochunov P, Glahn DC, Lancaster J, Thompson PM, Kochunov V, Rogers B, et al. Fractional anisotropy of cerebral white matter and thickness of cortical gray matter across the lifespan. Neuroimage. 2011;58:41–49. [DOI] [PMC free article] [PubMed] [Google Scholar]
- 27.Cropley VL, Klauser P, Lenroot RK, Bruggemann J, Sundram S, Bousman C, et al. Accelerated gray and white matter deterioration with age in schizophrenia. Am J Psychiatry. 2017;174:286–95. [DOI] [PubMed] [Google Scholar]
- 28.Loughland C, Draganic D, McCabe K, Richards J, Nasir A, Allen J, et al. Australian Schizophrenia Research Bank: a database of comprehensive clinical, endophenotypic and genetic data for aetiological studies of schizophrenia. Aust N Z J Psychiatry. 2010;44:1029–35. [DOI] [PubMed] [Google Scholar]
- 29.Cetin Karayumak S, Bouix S, Ning L, James A, Crow T, Shenton M, et al. Retrospective harmonization of multi-site diffusion MRI data acquired with different acquisition parameters. Neuroimage. 2019;184:180–200. [DOI] [PMC free article] [PubMed] [Google Scholar]
- 30.Avants BB, Tustison NJ, Song G, Cook PA, Klein A, Gee JC. A reproducible evaluation of ANTs similarity metric performance in brain image registration. Neuroimage. 2011;54:2033–44. [DOI] [PMC free article] [PubMed] [Google Scholar]
- 31.Jahanshad N, Kochunov PV, Sprooten E, Mandl RC, Nichols TE, Almasy L, et al. Multi-site genetic analysis of diffusion images and voxelwise heritability analysis: a pilot project of the ENIGMA-DTI working group. Neuroimage. 2013;81:455–69. [DOI] [PMC free article] [PubMed] [Google Scholar]
- 32.Mori S, Oishi K, Jiang H, Jiang L, Li X, Akhter K, et al. Stereotaxic white matter atlas based on diffusion tensor imaging in an ICBM template. Neuroimage. 2008;40:570–82. [DOI] [PMC free article] [PubMed] [Google Scholar]
- 33.Desikan RS, Segonne F, Fischl B, Quinn BT, Dickerson BC, Blacker D, et al. An automated labeling system for subdividing the human cerebral cortex on MRI scans into gyral based regions of interest. Neuroimage. 2006;31:968–80. [DOI] [PubMed] [Google Scholar]
- 34.Fischl B, Salat DH, Busa E, Albert M, Dieterich M, Haselgrove C, et al. Whole brain segmentation: automated labeling of neuroanatomical structures in the human brain. Neuron. 2002;33:341–55. [DOI] [PubMed] [Google Scholar]
- 35.Huizinga W, Poot DHJ, Vernooij MW, Roshchupkin GV, Bron EE, Ikram MA, et al. A spatio-temporal reference model of the aging brain. Neuroimage. 2018;169:11–22. [DOI] [PubMed] [Google Scholar]
- 36.Koenker R. Qunatile Regression. New York: Cambridge University Press; 2005. [Google Scholar]
- 37.Das S, Forer L, Schonherr S, Sidore C, Locke AE, Kwong A, et al. Next-generation genotype imputation service and methods. Nat Genet. 2016;48:1284–7. [DOI] [PMC free article] [PubMed] [Google Scholar]
- 38.Liu X, Low SK, Atkins JR, Wu JQ, Reay WR, Cairns HM, et al. Wnt receptor gene FZD1 was associated with schizophrenia in genome-wide SNP analysis of the Australian Schizophrenia Research Bank cohort. Aust N Z J Psychiatry. 2019;4867419885443. [DOI] [PubMed] [Google Scholar]
- 39.Ripke S, Neale BM, Corvin A, Walters JT, Farh KH, Holmans PA. Biological insights from 108 schizophrenia-associated genetic loci. Nature. 2014;511:421–7. [DOI] [PMC free article] [PubMed] [Google Scholar]
- 40.Dwyer DB, Cabral C, Kambeitz-Ilankovic L, Sanfelici R, Kambeitz J, Calhoun V, et al. Brain subtyping enhances the neuroanatomical discrimination of schizophrenia. Schizophr Bull. 2018;44:1060–9. [DOI] [PMC free article] [PubMed] [Google Scholar]
- 41.Insel T, Cuthbert B, Garvey M, Heinssen R, Pine DS, Quinn K, et al. Research domain criteria (RDoC): toward a new classification framework for research on mental disorders. Am J Psychiatry. 2010;167:748–51. [DOI] [PubMed] [Google Scholar]
- 42.Zhang T, Koutsouleris N, Meisenzahl E, Davatzikos C. Heterogeneity of structural brain changes in subtypes of schizophrenia revealed using magnetic resonance imaging pattern analysis. Schizophr Bull. 2015;41:74–84. [DOI] [PMC free article] [PubMed] [Google Scholar]
- 43.Jablensky A Subtyping schizophrenia: implications for genetic research. Mol Psychiatry. 2006;11:815–36. [DOI] [PubMed] [Google Scholar]
- 44.Shafiei G, Markello RD, Makowski C, Talpalaru A, Kirschner M, Devenyi G, et al. Spatial patterning of tissue volume loss in schizophrenia reflects brain network architecture. Biological Psychiatry. 2020;87:727–35. [DOI] [PubMed] [Google Scholar]
- 45.Neilson E, Bois C, Gibson J, Duff B, Watson A, Roberts N, et al. Effects of environmental risks and polygenic loading for schizophrenia on cortical thickness. Schizophr Res. 2017;184:128–36. [DOI] [PubMed] [Google Scholar]
- 46.Pasternak O, Sochen N, Gur Y, Intrator N, Assaf Y. Free water elimination and mapping from diffusion MRI. Magn Reson Med. 2009;62:717–30. [DOI] [PubMed] [Google Scholar]
- 47.Oestreich LKL, Lyall AE, Pasternak O, Kikinis Z, Newell DT, Savadjiev P, et al. Characterizing white matter changes in chronic schizophrenia: a free-water imaging multi-site study. Schizophr Res. 2017;189:153–61. [DOI] [PMC free article] [PubMed] [Google Scholar]
- 48.Cocchi L, Zalesky A. Personalized transcranial magnetic stimulation in psychiatry. Biol Psychiatry Cogn Neurosci Neuroimaging. 2018;3:731–41. [DOI] [PubMed] [Google Scholar]
- 49.Lee BS, McIntyre RS, Gentle JE, Park NS, Chiriboga DA, Lee Y, et al. A computational algorithm for personalized medicine in schizophrenia. Schizophr Res. 2018;192:131–6. [DOI] [PubMed] [Google Scholar]
- 50.Marquand AF, Rezek I, Buitelaar J, Beckmann CF. Understanding heterogeneity in clinical cohorts using normative models: beyond case-control studies. Biol Psychiatry. 2016;80:552–61. [DOI] [PMC free article] [PubMed] [Google Scholar]
Associated Data
This section collects any data citations, data availability statements, or supplementary materials included in this article.