

Abstract
Despite longstanding appreciation of gene expression heterogeneity in isogenic bacterial populations, affordable and scalable technologies for studying single bacterial cells have been limited. While single-cell RNA sequencing (scRNA-seq) has revolutionized studies of transcriptional heterogeneity in diverse eukaryotic systems1–13, application of scRNA-seq to prokaryotes has been hindered by their extremely low mRNA abundance14–16, lack of mRNA polyadenylation, and thick cell walls17. Here, we present Prokaryotic Expression-profiling by Tagging RNA In Situ and sequencing (PETRI-seq), a low-cost, high-throughput, prokaryotic scRNA-seq pipeline that overcomes these technical obstacles. PETRI-seq uses in situ combinatorial indexing11,12,18 to barcode transcripts from tens of thousands of cells in a single experiment. PETRI-seq captures single cell transcriptomes of Gram-negative and Gram-positive bacteria with high purity and low bias, with median capture rates >200 mRNAs/cell for exponentially growing E. coli. These characteristics enable robust discrimination of cell-states corresponding to different phases of growth. When applied to wild-type S. aureus, PETRI-seq revealed a rare sub-population of cells undergoing prophage induction. We anticipate broad utility of PETRI-seq in defining single-cell states and their dynamics in complex microbial communities.
Main
Recent developments in high-throughput single-cell RNA sequencing (scRNA-seq) technology have enabled rapid characterization of cellular diversity within complex eukaryotic tissues1–13. Despite these advances, comparable tools for bacteria have lagged behind due to numerous technical challenges (Supplementary Fig. 1). Current massively parallel eukaryotic scRNA-seq methods typically require custom microfluidics to co-encapsulate a single cell with a uniquely barcoded bead in a compartment, often a droplet5,6,8 or microwell4,7. These approaches rely on two key properties of many eukaryotic cells, specifically that they are easily lysed with detergent to release their RNA and that their poly-adenylated mRNAs can be effectively captured by beads coated with poly(dT) primers. Adaptation of these approaches for bacteria is thwarted by the presence of thick prokaryotic cell wall17, which makes lysis challenging, and the lack of poly-adenylated mRNAs for effective capture. Given these considerations, we identified in situ combinatorial indexing18 as an alternative basis upon which to develop high-throughput prokaryotic scRNA-seq. Two conceptually similar eukaryotic methods, single-cell combinatorial indexing RNA sequencing (sci-RNA-seq)11,13 and split-pool ligation-based transcriptome sequencing (SPLiT-seq)12, rely on cells as compartments for barcoding, which abrogates the need for cell lysis in droplets or microwells. These methods are also amenable to reverse transcription (RT) with random hexamers instead of poly(dT) primers12. With just pipetting steps and no complex instruments, individual transcriptomes of hundreds of thousands of fixed cells are uniquely labeled by multiple rounds of splitting, barcoding, and pooling in microplates.
Here, we present Prokaryotic Expression-profiling by Tagging RNA In situ and sequencing (PETRI-seq), a high-throughput, affordable, and easy-to-perform scRNA-seq method capable of profiling the gene expression states of tens of thousands of wild type Gram-positive (S. aureus USA300) and Gram-negative (E. coli MG1655) cells. PETRI-seq (Fig. 1) consists of three experimental components: cell preparation, split-pool barcoding, and library preparation, which are detailed in Extended Data Fig. 1a-c and Methods. Cells grown in liquid culture were briefly pelleted before overnight fixation with 4% formaldehyde. We confirmed that centrifugation and fixation did not alter the bulk transcriptome (Extended Data Fig. 2a-c). Cells were next resuspended in 50% ethanol, which has been used previously for prokaryotic in situ PCR as a storage solution19, though we have yet to test cellular and RNA integrity after long-term storage. Ethanol did not significantly change the cDNA yield from in situ RT (Extended Data Fig. 2d). Lysozyme for E. coli (Extended Data Fig. 2e), or lysostaphin for S. aureus, was subsequently added to permeabilize cells for in situ RT. Cells were next treated with DNase to remove background genomic DNA. We confirmed in situ DNase activity by qPCR (Extended Data Fig. 2f) and verified DNase inactivation (Extended Data Fig. 2g,h). DNase treatment did not significantly alter the bulk transcriptome (Extended Data Fig. 2i) or RNA integrity (Extended Data Fig. 2j). Before proceeding to RT, cells were imaged to confirm they were intact (Extended Data Fig. 2k) and counted.
Figure 1: Overview of PETRI-seq.
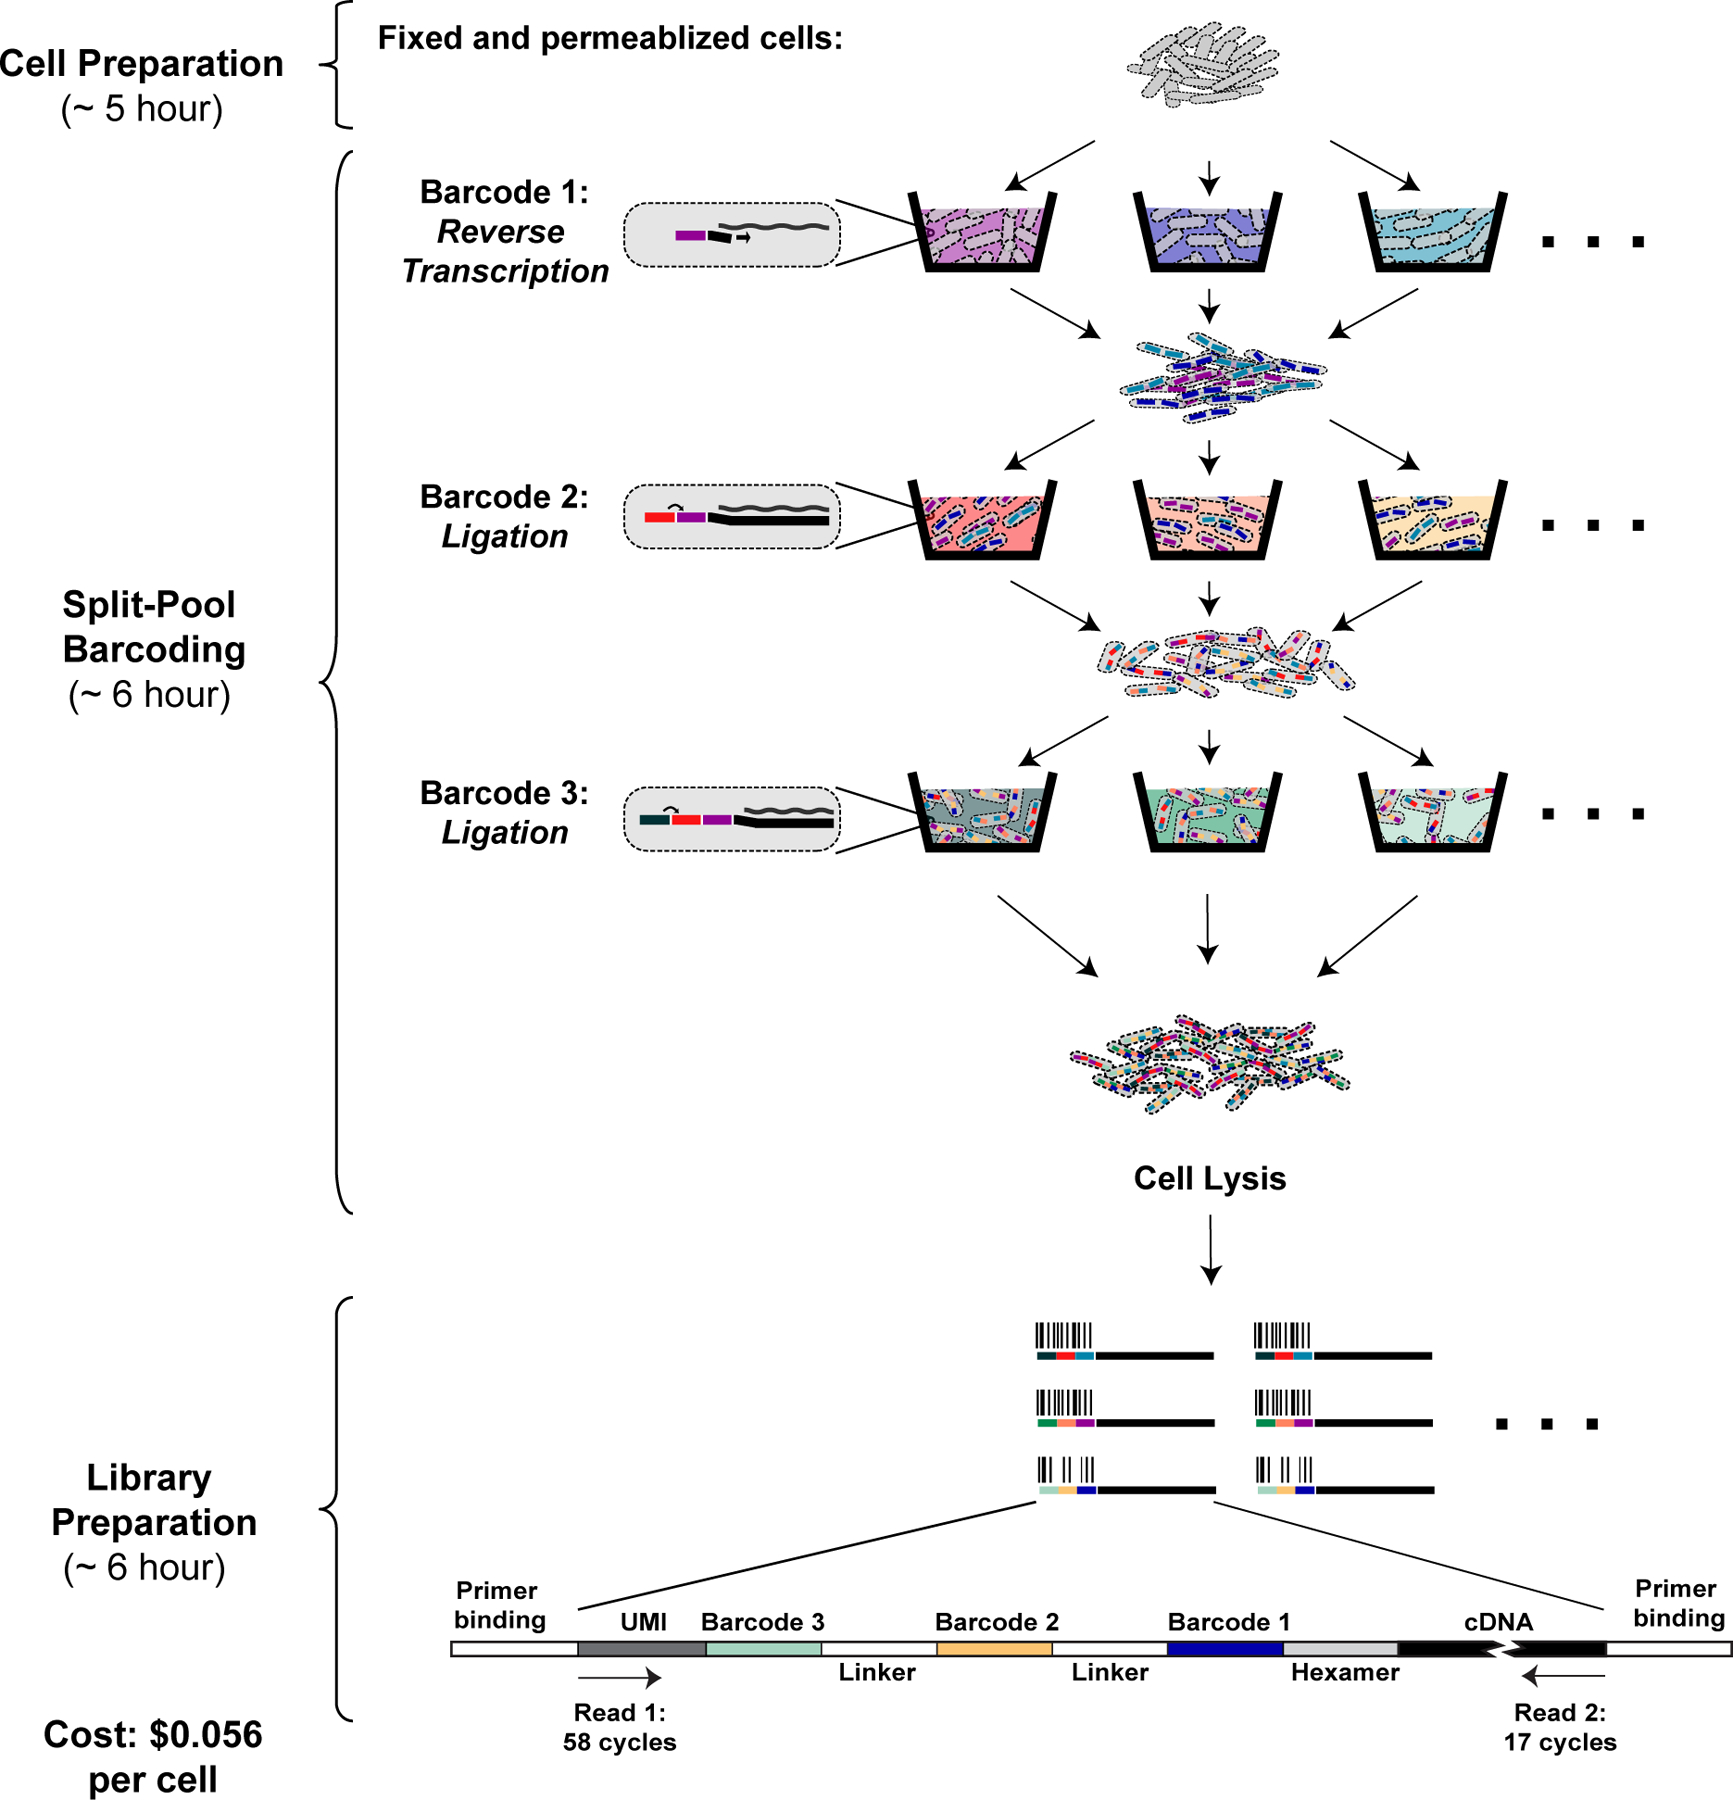
PETRI-seq includes three parts: cell preparation, split-pool barcoding, and library preparation. In cell preparation, cells are prepared for in situ reactions by fixation (formaldehyde) and permeabilization (lysozyme/lysostaphin). During split-pool barcoding, cells are split across 96-well plates three times for three rounds of barcoding by reverse transcription and two ligations. After barcoding, cells are lysed to release cDNA, which is subsequently prepared for paired-end Illumina sequencing. Each cDNA fragment in the library includes a unique molecular identifier (UMI) and 3 barcodes, which are all sequenced in Read 1. The UMI is a sequence of 7 degenerate nucleotides that can distinguish unique transcripts from PCR duplicates. The 3 barcodes comprise a barcode combination (BC), which allows reads to be grouped by their cell of origin. In Read 2, the cDNA is sequenced.
In the next stage, we performed split-pool barcoding. Cells were distributed across a microplate for RT with barcoded random hexamers specific to each well. After RT, cells were pooled and redistributed across new microplates for two rounds of barcoding by ligation to the cDNA. We reduced the length of the overhang for each ligation relative to the eukaryotic protocol12 without compromising ligation efficiency (Extended Data Fig. 2l). This allowed us to perform 75 cycles of sequencing instead of 150, thereby reducing sequencing cost by ~50% (Supplementary Table 1B). After three rounds of barcoding, cells contained cDNA labeled with one of nearly one million possible three-barcode combinations (BCs). We counted and lysed ~10,000 cells for library preparation. The number of cells was chosen to ensure a low multiplet frequency, which is the percent of non-empty BCs containing more than one cell20. For 10,000 cells, the expected multiplet frequency based on a Poisson distribution is 0.56%.
Finally, cDNA was prepared for Illumina sequencing. We used AMPure XP beads to purify cDNA from cell lysates (Extended Data Fig. 2m). AMPure purification is faster and less costly (Supplementary Table 1C) than primer biotinylation and streptavidin purification used previously in SPLiT-seq12. Next, to make double-stranded cDNA, we compared second-strand synthesis21 and limited-cycle PCR after template switching2. The former had a significantly higher yield (Extended Data Fig. 2n,o). We then performed tagmentation followed by PCR using the transposon-inserted sequence and the overhang upstream of the third barcode as primer sequences, thereby preventing amplification of any undigested genomic DNA. The libraries were sequenced and analyzed using the pipeline detailed in Extended Data Fig. 1d-g and Methods to generate a count matrix of operons by BC. We then set a threshold based on total UMIs (unique molecular identifiers)22 per BC to distinguish cells from background (Extended Data Fig. 1h,i).
To demonstrate the ability of PETRI-seq to capture transcriptomes of single cells, we performed a species-mixing experiment involving three populations of cells in exponential phase: GFP- and RFP-expressing E. coli and wild type S. aureus (Fig. 2a). From 14,975 sequenced BCs, we observed that BCs were highly species-specific with 99.8% clearly assigned to one species (Fig. 2b). We calculated an overall multiplet frequency of 1.5% after accounting for multiplets of the same species and non-equal representation of the two species20. Though this frequency exceeds the Poisson expectation of 0.85%, it is comparable to contemporary eukaryotic methods8,13. Furthermore, within the E. coli population, BCs were highly strain-specific with 98.7% of plasmid-containing cells assigned to a single population (GFP- or RFP-expressing) (Fig. 2c). While multiplet frequency is the probability of multiple cells travelling together during barcoding either by physical interaction or by chance, additional factors, such as barcoded free molecules released by occasional cell lysis, may compromise single-cell purity. This type of intercellular contamination has been described for eukaryotic scRNA-seq23,24. To assess the contamination rate (the probability that a UMI in a single cell is derived from other cells) for PETRI-seq, we first excluded species-mixed multiplets and then found that BCs assigned as E. coli included a mean of 0.23% S. aureus UMIs (Extended Data Fig. 3a, right), while BCs assigned as S. aureus also included a mean of 0.23% E. coli UMIs (Extended Data Fig. 3b, right). After correcting for alignment ambiguities (Extended Data Fig. 3e,f,i,j) and relative representation of the two species in the library, we calculated that 0.19–0.36% of UMIs in a PETRI-seq transcriptome were likely derived from other cells.
Figure 2: PETRI-seq captures transcriptomes of single E. coli and S. aureus cells with high purity and low bias.
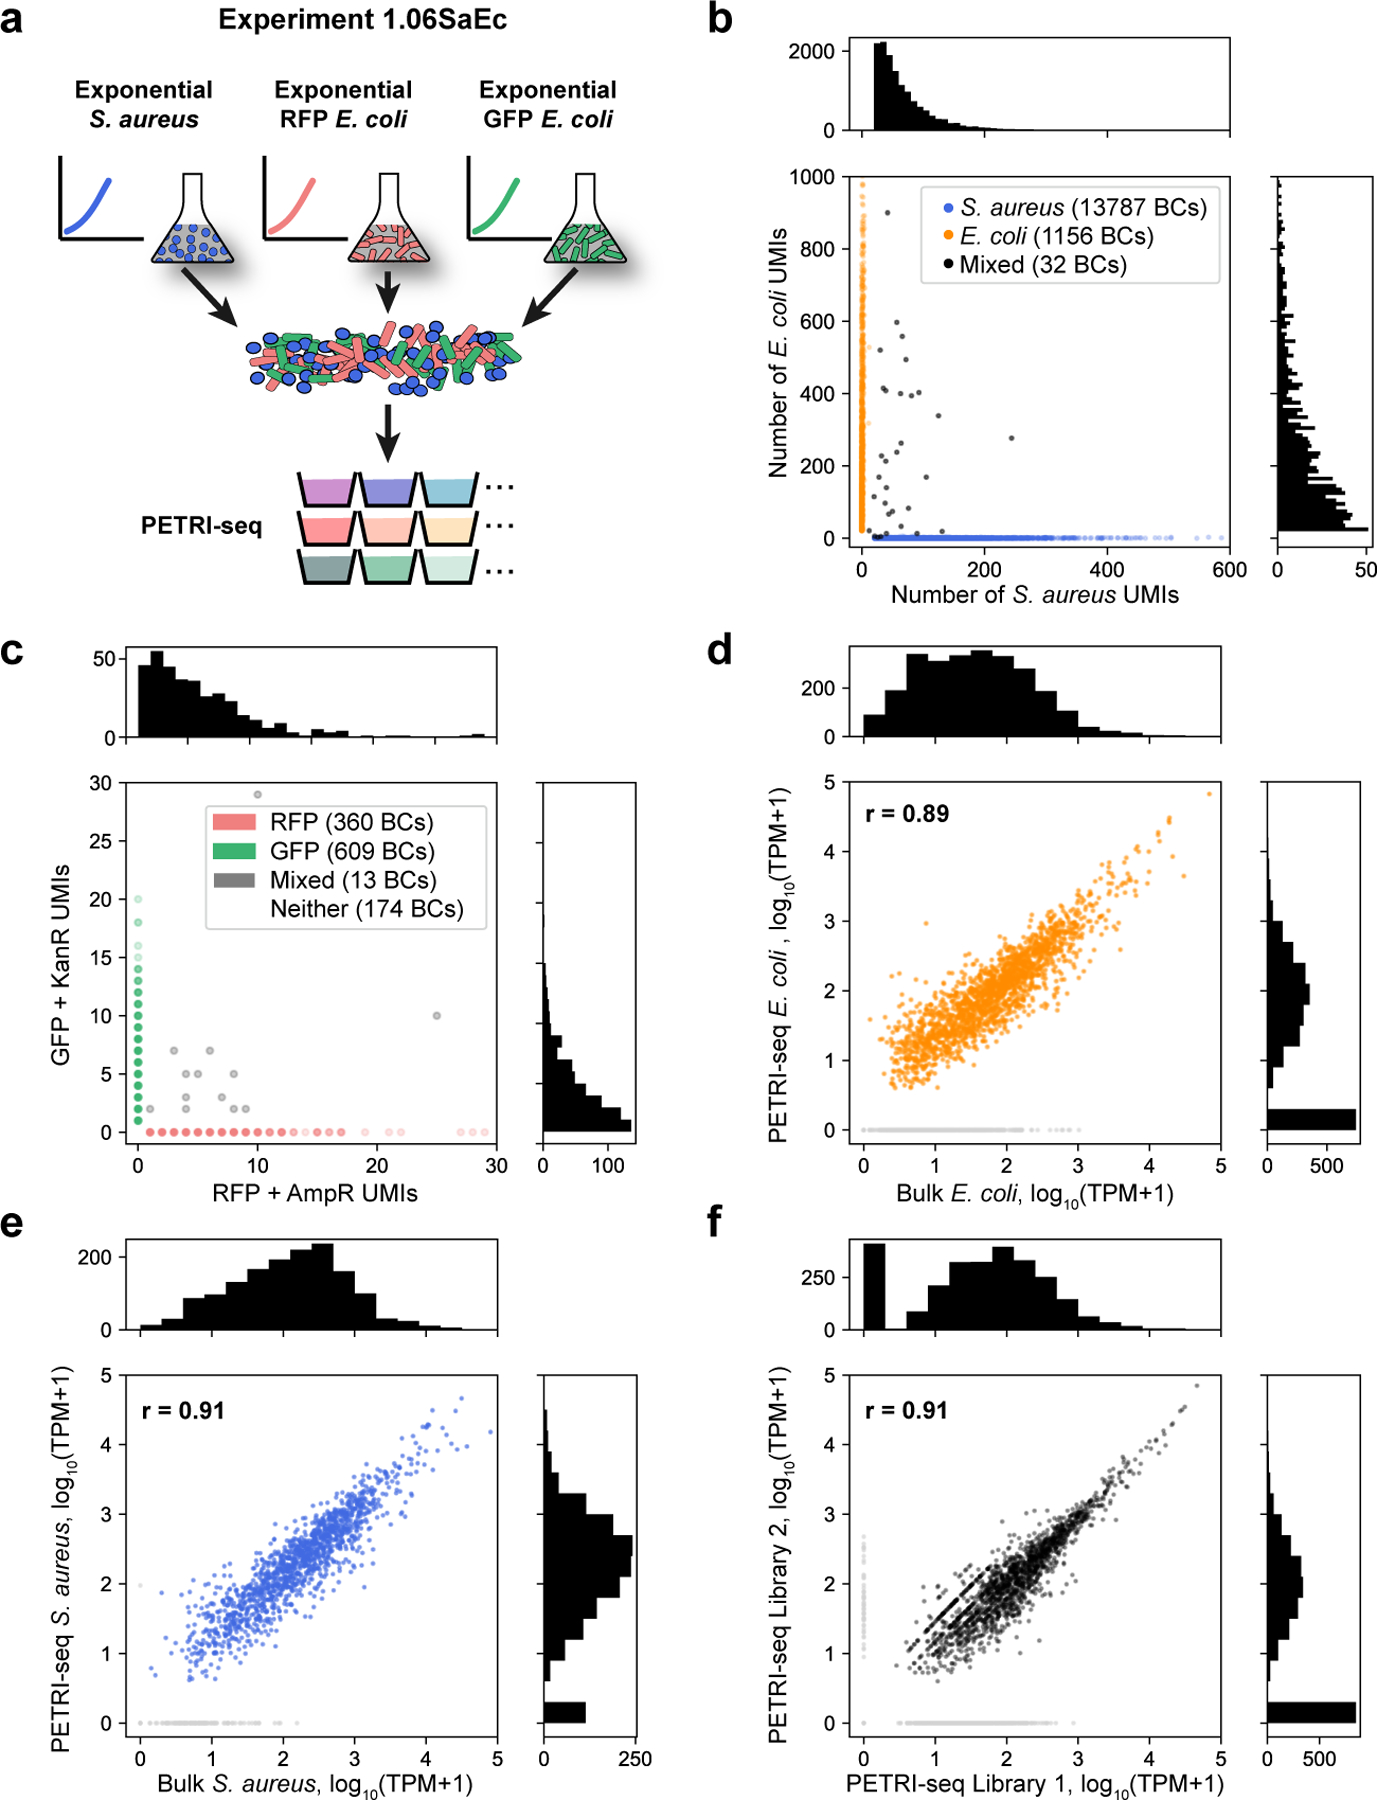
(a) Schematic of species-mixing experiment (1.06SaEc). Exponential S. aureus and E. coli cells were grown separately, then mixed for PETRI-seq after cell preparation. E. coli cells included two populations; exponential RFP-expressing E. coli and exponential GFP-expressing E. coli were grown separately, then mixed for cell preparation and PETRI-seq. (b) Species mixing plot for E. coli and S. aureus based on total UMIs per BC, including rRNA. BCs were assigned to a single species if more than 90% of UMIs mapped to that species and fewer than 20 UMIs mapped to the other species. Histograms (top, right) show the number of S. aureus or E. coli cells (respectively) with the corresponding number of total UMIs. BCs with fewer than 20 total UMIs were omitted. The multiplet frequency is 1.5%. (c) Quantification of BC collisions within the E. coli population by plasmid mRNAs. Cells without plasmid genes (“Neither”) are omitted. BCs were assigned to a single cell type when greater than 90% of plasmid UMIs matched a single plasmid. Histograms (top, right) show the number of RFP BCs or GFP BCs, respectively, with the corresponding number of plasmid UMIs. (d) Correlation between mRNA abundances from PETRI-seq vs. a bulk library prepared from fixed E. coli cells. The Pearson correlation coefficient (r) was calculated for 1,873 out of 2,617 total operons, excluding those with zero counts in either library (grey points). If all operons are included, r = 0.78. (e) Correlation between mRNA abundances from PETRI-seq vs. a bulk library prepared from fixed S. aureus cells. Pearson’s r was calculated for 1,395 out of 1,510 total operons, excluding those with zero counts in either library (grey points). If all operons are included, r = 0.89. (f) Correlation between two biological replicate libraries of exponential GFP-expressing E. coli prepared by PETRI-seq. Pearson’s r was calculated for 1,714 out of 2,617 total operons, excluding those with zero counts in either library (grey points). If all operons are included, r = 0.78. For all correlations (e,f,g), PETRI-seq TPM was calculated from UMIs, and bulk TPM was calculated from reads.
Performing molecular reactions inside of cells raises the possibility that RNA capture could be biased by specific cellular contexts. Prior results in eukaryotic cells revealed a capture bias against rRNAs during in situ RT12, which is mildly recapitulated in our data (Extended Data Fig. 4a,b). For exponential E. coli, 15% of sense PETRI-seq UMIs mapped to mRNA (Extended Data Fig. 4a, pie chart), while only 5% of bulk sense reads mapped to mRNA (Extended Data Fig. 4c, pie chart). Despite the capture bias against rRNA, we observed strong correlations between combined single-cell transcriptomes from PETRI-seq and bulk cDNA libraries prepared by standard RT for both E. coli and S. aureus (Fig. 2d,e). We also observed that reads mapped across the entire length of operons with minor bias against the 3’ end (Supplementary Fig. 2a), which is, at least, partially expected from our library preparation protocol (Supplementary Fig. 2b). Our single-cell transcriptomes were reproducible, as shown by the strong correlation between the aggregated transcriptomes of GFP-expressing E. coli cells from two independent libraries (Fig. 2f).
Having confirmed that PETRI-seq captured transcriptomes of single cells with high purity and low bias, we next sought to determine its capacity to distinguish between cells in different growth states. In Experiment 1.10, we mixed E. coli cells in two growth phases to create a population resembling naturally arising transcriptional heterogeneity. The mixed population consisted of GFP-expressing exponential and aTc-induced RFP-expressing stationary E. coli (Fig. 3a). We applied unsupervised dimensionality reduction (principal component analysis – PCA25) to visualize the low-dimensional structure underlying the diversity of transcriptional states. For the PCA, we considered only cells containing at least 15 mRNAs to avoid spurious effects from cells with extremely low mRNA content (Extended Data Fig. 1j,k). Without considering plasmid genes, we observed robust separation of two populations along PC1. We then used the plasmid genes to classify these populations as RFP-containing stationary and GFP-containing exponential cells (Fig. 3b, bottom). 98.5% of all plasmid-containing cells were on the expected side of an empirically chosen threshold line, and the threshold line predicted RFP cells with a 98.59% true positive rate (TPR) to the left of the line and GFP cells with a 98.53% TPR to the right. Of the 7,387 cells analyzed, 61% did not contain any plasmid transcripts, so their growth states were at first ambiguous (grey points in PCA). However, using the PC1 threshold, we predicted that 92.2% of these were stationary cells. Over-representation of stationary cells in the ambiguous population was not surprising as plasmid expression in stationary cells was generally lower than in exponential cells. Importantly, separation of the two transcriptional states was similarly robust in another biological replicate (Extended Data Fig. 5a) or when operon counts were normalized using sctransform26, an alternative method (Extended Data Fig. 5b). Finally, we investigated expression patterns for operons and gene ontology (GO) terms and found many expected trends related to the transition from exponential growth to stationary phase (Fig. 3b, Extended Data Fig. 5c). For example, rpoS, the stationary phase sigma-factor27, and dps, a DNA-binding protein highly expressed in stationary phase28, were upregulated along PC1, as expected in the direction of stationary cells (Fig. 3b, top). Consistent with induction of the stringent response29, stationary cells showed a large-scale reduction in ribosomal protein expression as well as an increase in expression of amino acid biosynthetic operons (Fig. 3b, middle).
Figure 3: Principal component analysis distinguishes exponential and stationary single E. coli cells by mRNA expression patterns.
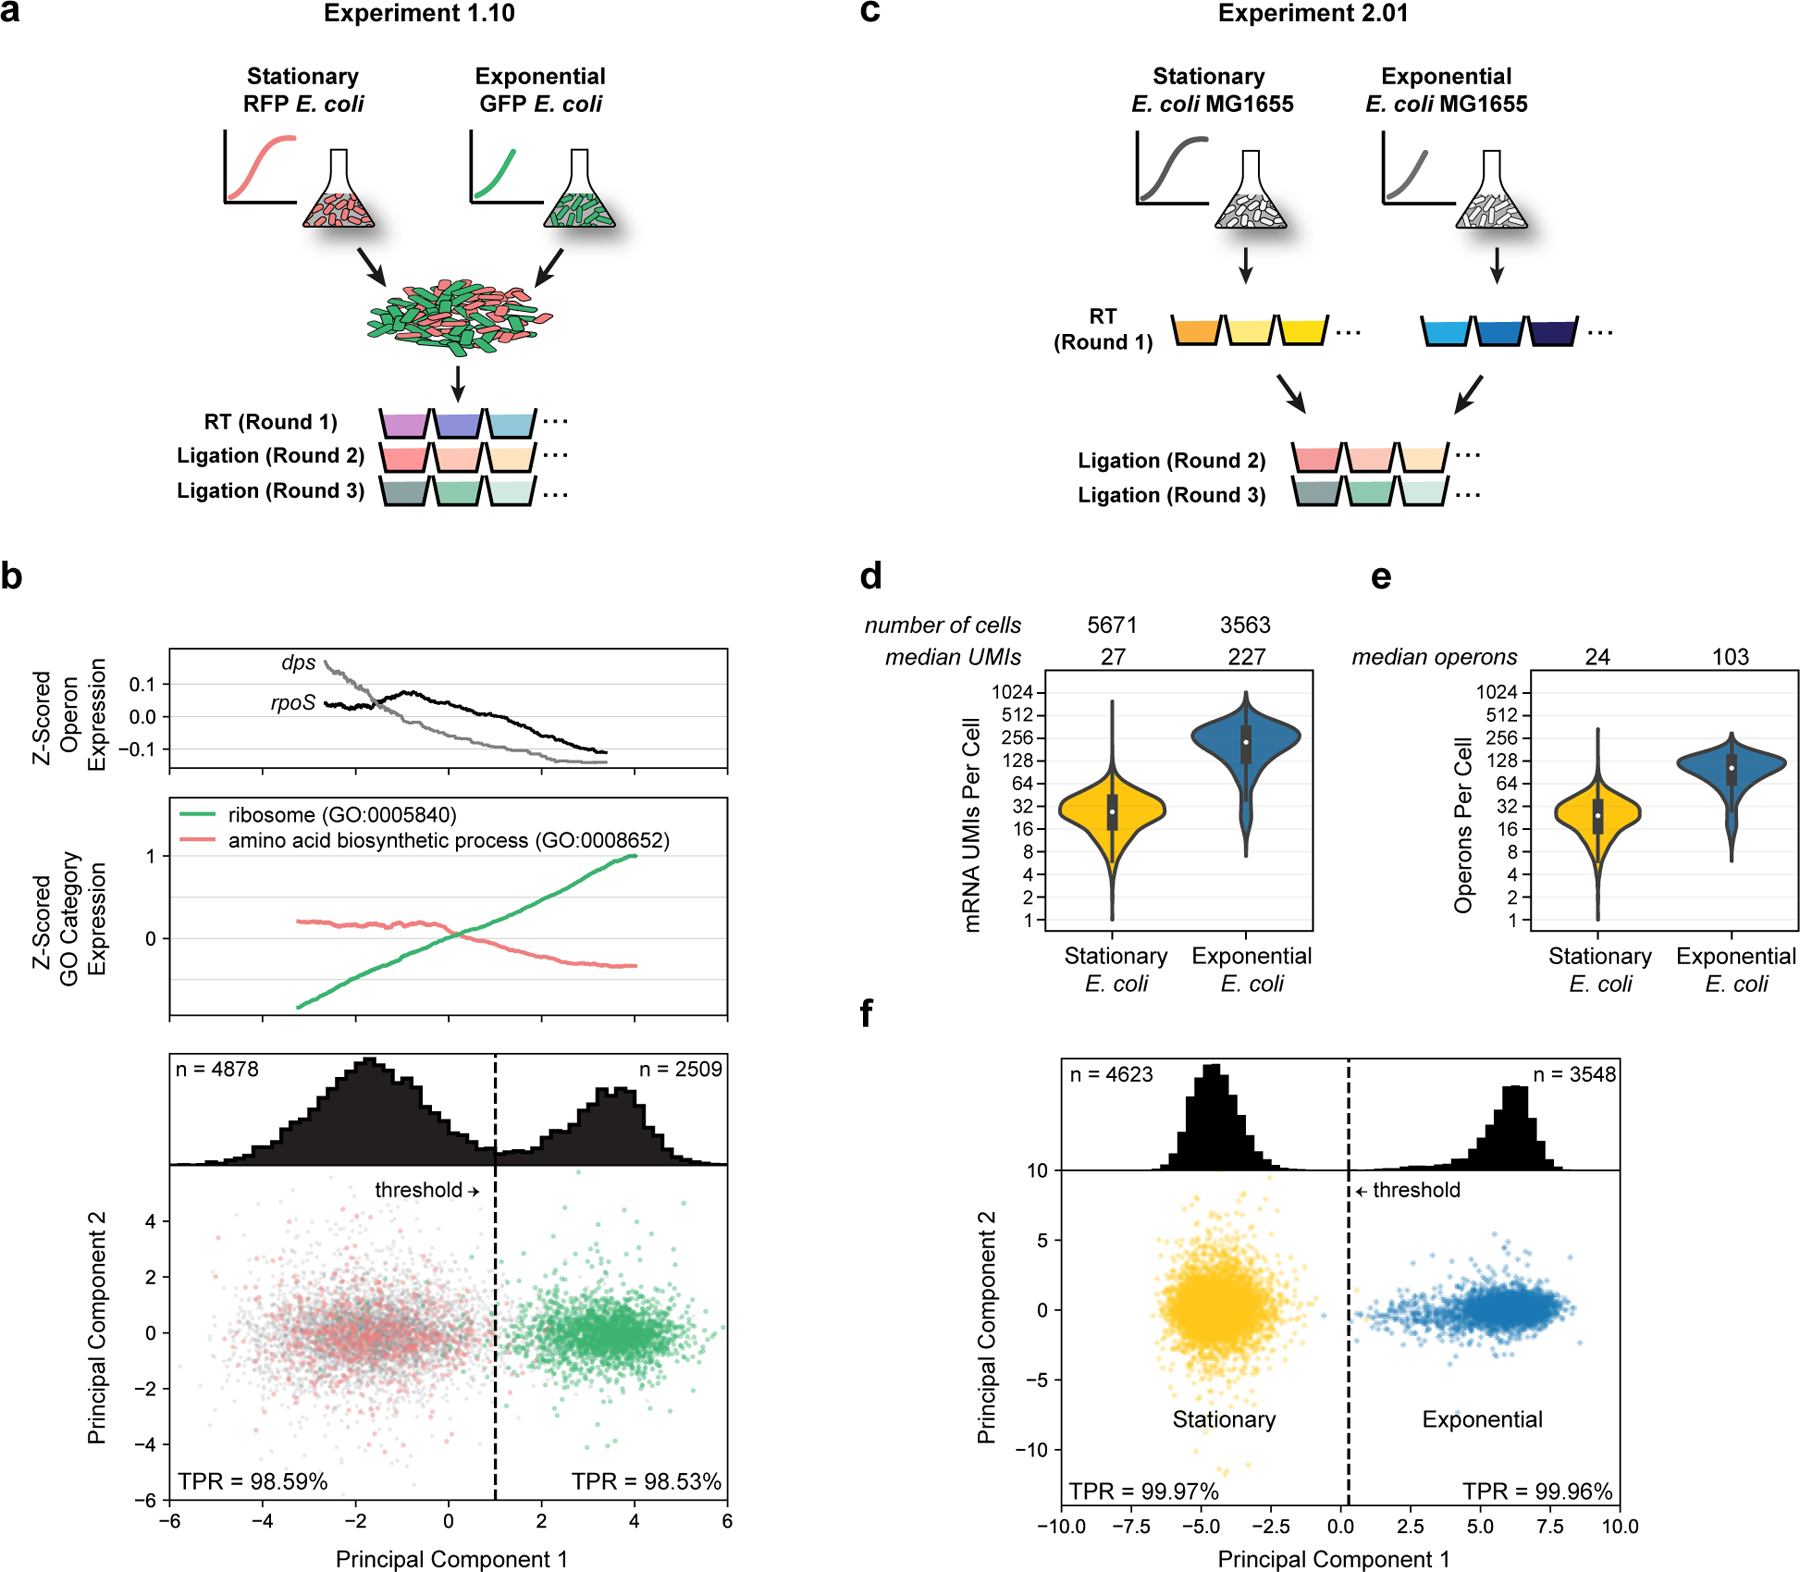
(a) Schematic of Experiment 1.10. Stationary RFP-expressing E. coli and exponential GFP-expressing E. coli were grown separately, then mixed for cell preparation and PETRI-seq. (b) Bottom: PCA of cells from Experiment 1.10. RFP-expressing cells are shown in red and GFP-expressing cells in green. Grey points indicate ambiguous cells (no plasmid UMIs). True positive rate (TPR, see methods) was calculated for RFP cells to the left of the threshold line (PC1 = 1.0) and GFP cells to the right of the threshold line. The TPR refers to the probability that a given cell to the left or right of the threshold is RFP-expressing or GFP-expressing, respectively. Distribution of all cells across PC1 (including ambiguous) is shown above. 7,387 cells are included (4,878 below threshold and 2,509 above). Middle: Expression of GO terms associated with exponential to stationary transition. The moving average (size=1,200 cells) of the z-scored expression of operons within the GO term is shown. Expression was z-score transformed for each gene and then for each GO term. Both GO terms are significantly correlated with PC1 prior to calculating moving averages (Spearman rank, p<10−70). Top: Expression of genes involved in exponential to stationary transition along PC1. The moving average (size=2,400 cell) of the z-scored operon expression is shown. Both operons are significantly correlated with PC1 prior to calculating moving averages (Spearman rank, dps: p=10−29, rpoS: p=0.003, FDR<0.01). (c) Schematic of Experiment 2.01. Exponential wild-type E. coli and stationary wild-type E. coli were prepared independently and barcoded separately during round 1 (RT). Exponential S. aureus cells (not shown) were prepared independently and combined with both cell types prior to RT for downstream quantification of multiplet frequency and intercellular contamination. (d) Distributions of mRNA UMIs captured per stationary or exponential cell in Experiment 2.01. (e) Distributions of operons per stationary or exponential E. coli cell in Experiment 2.01. Cell numbers are the same as (d). Boxplots within violins in (d,e) show interquartile range (black box) and median (white circle). (f) PCA of exponential and stationary cells (Experiment 2.01). Distribution of all cells across PC1 is shown above. Threshold line at PC1 = 0.28 results in TPR of 99.97% (stationary, left) or 99.96% (exponential, right). 8,171 cells are included (4,623 below threshold and 3,548 above).
We sought to further improve mRNA capture and evaluate the power of PETRI-seq to distinguish different transcriptional states. To this end, we barcoded exponential and stationary E. coli cells separately during RT before pooling them for subsequent steps in Experiment 2.01 (Fig. 3c). First, by further permeabilizing cells with detergent before ligation and using a higher concentration of ligation primers (Extended Data Fig. 6a-d), we substantially improved the capture in Experiment 2.01 relative to previous experiments (Extended Data Fig. 4d-f; Extended Data Fig. 5a,d). Specifically, Experiment 2.01 captured a median of 227 and 27 mRNA UMIs per exponential and stationary E. coli cell, respectively (Fig. 3d), which corresponded to a median of 103 or 24 operons represented per cell (Fig. 3e). Previous studies have similarly found fewer RNAs in stationary relative to exponential E. coli cells30. Based on estimates that single exponentially-growing E. coli cells contain 2,000–8,000 mRNAs14–16, we estimate our capture rate to be roughly 2.5–10%. For S. aureus, we captured a median of 43 mRNA UMIs per cell (Extended Data Fig. 6e). S. aureus cells may contain fewer mRNAs than E. coli cells, possibly due to their smaller cell size and genome31, though technical differences may affect capture. Importantly, we confirmed that optimized PETRI-seq continued to capture single cells with high purity (Extended Data Fig. 7), comparable to eukaryotic scRNA-seq techniques23,24, and robustly discriminate single E. coli cells by growth state (Fig. 3f). Comparison of the sub-populations in Experiments 1.10 and 2.01 corroborated the single-cell purity of PETRI-seq (Extended Data Fig. 8).
Given ~20–200 mRNA UMIs captured per average bacterial cell, we anticipate that future PETRI-seq studies will benefit from aggregation of similar cells in order to define consensus states for sub-populations within heterogenous communities. As a demonstration, we generated consensus transcriptomes by aggregating the expression counts from varying numbers of single cells at either exponential (Extended Data Fig. 9a,b) or stationary phase (Extended Data Fig. 9c,d). As expected, correlations with independently prepared bulk libraries from cells in the same growth state increased as more cells were included. Notably, the correlations were stronger and increasing at a greater rate for single-cell/bulk libraries of cells in the same state (Extended Data Fig. 9b,d), indicating that the aggregated single cells were asymptotically approaching a transcriptome reflecting their growth state.
A key advantage of scRNA-seq over bulk methods is the capacity to characterize rare sub-populations exhibiting distinct gene expression programs. We applied PCA to 6,663 S. aureus single-cell transcriptomes generated by PETRI-seq and detected a small sub-population diverging from the rest of the population along PC1 (Extended Data Fig. 10a, red points). The eight operons most highly correlated with PC1 were lytic genes of prophage ϕSA3usa (Extended Data Fig. 10b,c)32,33, indicating that PC1 might be capturing rare prophage induction in the S. aureus culture. Within the small sub-population, 3 cells exhibited dramatic upregulation of phage lytic transcripts reaching roughly 80% of these single-cell transcriptomes (Extended Data Fig. 10d). The remaining 25 cells contained fewer than 10% phage transcripts. In further analysis of the heterogeneity in gene expression across the entire S. aureus population, we found that for most operons, transcriptional noise14 () inversely scaled with mean expression () and followed a Poisson expectation () (Extended Data Fig. 10e), as was described in other single cell studies34,35. SAUSA300_1933–1925, a phage lytic operon encoding putative phage tail and structural genes, clearly diverged and exhibited higher noise than expected from the mean (Extended Data Fig. 10e), which recapitulated its hypervariability in expression as found by PCA. Similar analysis in E. coli discovered candidate operons displaying high transcriptional noise (Extended Data Fig. 10f,g) that warrant independent validation by methods such as smFISH34,36. One of these, fimAICDFGH, encoding type I fimbriae, is known to exhibit population-level phase-variable expression due to promoter inversion37. As such, PETRI-seq can detect rare cells occupying distinct transcriptional states and genes displaying high transcriptional heterogeneity within a population.
With a straightforward experimental pipeline requiring no advanced equipment and a per-cell cost of 5.6 cents, PETRI-seq is an efficient and affordable (Supplementary Table 1) method for high-throughput single-cell RNA sequencing of bacterial populations. We sequenced ~30,000 E. coli and S. aureus cells with high single-cell purity and found that aggregated transcriptomes from single cells were well-correlated with bulk RNA-seq libraries. PETRI-seq assigned >98% of single cells within isogenic E. coli populations to their correct growth phases (i.e. stationary or exponential). Moreover, the high throughput capacity of PETRI-seq was vital for detecting a rare sub-population undergoing prophage induction in 0.04% of S. aureus cells. This has important clinical implications, as prophage induction is intimately linked to bacterial pathogenesis38,39.
Optimization of mRNA capture and library preparation (see “Future directions for optimization” in Methods) is likely to further improve the sensitivity of PETRI-seq and decrease its cost. Following our initial deposit of an earlier version of this manuscript on biorXiv40, and during its formal review, Kuchina and colleagues deposited a manuscript on biorXiv41 reporting a conceptually similar split-pool based bacterial scRNA-seq method in which in situ polyadenylation was utilized to capture mRNAs. It will be of great interest to compare these methods and further improve the performance of PETRI-seq. We anticipate that PETRI-seq will be a highly useful tool with broad applications such as characterization of rare, clinically important populations (e.g., persisters42,43) and high-resolution capture of native microbial communities, including unculturable components, a major challenge in microbiology44.
Methods
Experimental Methods
Bacterial Strains and Growth Conditions
E. coli MG1655 was routinely grown in MOPS EZ Rich defined medium (M2105, Teknova, Hollister, CA). Plasmid pBbE2A-RFP was a gift from Jay Keasling45 (Addgene plasmid # 35322). RFP was induced with 20 nM anhydrotetracycline hydrochloride (233131000, Acros Organics, Geel, Belgium). GFP was expressed from plasmid prplN-GFP46. Plasmid-containing MG1655 cells were grown in appropriate antibiotics (50 μg/mL kanamycin, 100 μg/mL carbenicillin). S. aureus USA30032 was routinely grown in trypticase soy broth (TSB) medium (211825, BD, Franklin Lakes, NJ). All bacterial strains were grown at 37°C and shaken at 300 rpm.
Custom Primers Used in this Study
All single-tube primers are shown in Supplementary Table 2. All primer sequences for 96-well split-pool barcoding are shown in Supplementary Table 3. Primers were purchased from Integrated DNA Technologies (IDT, Coralville, IA).
Preparation of Annealed Ligation Oligos
The ligation primers used in Rounds 2 and 3 ligation reactions (Fig.1) were prepared by annealing barcode oligos to specific linker oligos (SB83, SB80). In Experiment 2.01, our most optimized version of PETRI-seq, we used 4× more annealed ligation primers relative to earlier versions. Hence, the quantity of reagents provided hereafter will be for the “4× protocol” (i.e. Experiment 2.01), while quantity of reagents for “1× protocol” will be provided in italics in parenthesis.
Round 2 barcode oligos (Supplementary Table 3) were diluted to 100 μM (20 μM). Round 3 barcode oligos were diluted to 70 μM (20 μM). Linker oligo SB83 was diluted to 100 μM (20 μM). Linker oligo SB80 was diluted to 70 μM (20 μM). To anneal Round 2 barcode oligos to linker oligos, a 96-well PCR plate (AB0600, Thermo Scientific) was prepared by adding 3.52 (4.4) μL of diluted SB83, 2.64 (0.8) μL water, and 3.84 (4.8) μL of each Round 2 barcode oligo to each well. To anneal Round 3 barcode oligos, a 96-well PCR plate was prepared by adding 6.6 (4.4) μL of diluted SB80, 7.2 (4.8) μL of each Round 3 barcode oligo, and 0 (0.8) μL water (i.e. water only added for “1×” protocol) to each well. Oligos were annealed by heating the plate to 95°C for 3 minutes then decreasing the temperature to 20°C at a ramp speed of −0.1°C/second.
Oligos SB84 and SB81 were also annealed (to form an intramolecular hairpin) prior to blocking by heating 50 μL or 80 μL, respectively, of each 400 (100) μM oligo to 94°C and slowly reducing the temperature to 25°C.
Cell Preparation for PETRI-Seq
For sequencing and qPCR measurements, cells were grown overnight then diluted into fresh media (1:100 for S. aureus, E. coli MG1655, and E. coli MG1655 harboring prplN-GFP, 1:50 for E. coli MG1655 harboring pBbE2A-RFP) with inducer and antibiotics when applicable. For exponential cells, E. coli and S. aureus cultures were grown for approximately 2 hours until reaching an OD600 of 0.4 or 0.9, respectively. Exponential E. coli cells were used for all qPCR optimization experiments. For stationary cells, E. coli MG1655 cells harboring pBbE2A-RFP were grown an additional 3 hours until the culture reached an OD600 of ~4 (Experiment 1.06: OD600 = 4, Experiment 1.10: OD600 = 3.68). For E. coli MG1655 stationary cells, E. coli cells were diluted 1:100 and grown for ~3.75 hours to OD600 ~4 (Experiment 2.01: OD = 3.87). Different cell types grown separately were then mixed as described below.
For the combined exponential E. coli library (Experiment 1.06SaEc), 3.5 mL of exponential GFP E. coli was combined with 3.5 mL of exponential RFP E. coli. The S. aureus library was prepared separately from 7 mL of exponential cells. For the libraries of exponential GFP E. coli combined with stationary RFP E. coli (Experiments 1.06 and 1.10), 3 mL of exponential GFP cells was added to ~300 μL of stationary RFP cells. For Experiment 2.01, 7 mL of exponential wild-type E. coli and 7 mL of stationary wild-type were independently fixed. Before fixation, cells were pelleted at 5,525×g (Allegra 25R centrifuge, Beckman Coulter) for 2 minutes at 4°C. Spent media was removed, and cells were resuspended in 7 mL of ice-cold 4% formaldehyde (F8775, Millipore Sigma, St. Louis, MO) in PBS (P0195, Teknova). This suspension was rotated at 4°C for 16 hours on a Labquake Shaker (415110, Thermo Scientific).
The next day, fixed cells were centrifuged at 5,525×g (Allegra 25R centrifuge, Beckman Coulter) for 10 minutes at 4°C. The supernatant was removed, and the pellet was resuspended in 7 mL PBS supplemented with 0.01 U/μL SUPERase In RNase Inhibitor (AM2696, Invitrogen, Carlsbad, CA), hereafter referred to as PBS-RI. Cells were centrifuged again at 5,525×g for 10 minutes at 4°C then resuspended in 700 μL PBS-RI. Subsequent centrifugations for cell preparation were all carried out at 7,000×g (5415D centrifuge, Eppendorf) for 8–10 minutes at 4°C. Cells were centrifuged, then resuspended in 700 μL 50% ethanol (2716, Decon Labs, King of Prussia, PA) in PBS-RI. Cells were next washed twice with 700 μL PBS-RI, then resuspended in 105 μL of 100 μg/mL lysozyme (90082, Thermo Scientific, Waltham, MA) or 40 μg/mL lysostaphin (LSPN-50, AMBI, Lawrence, NY) in TEL-RI (100 mM Tris pH 8.0 [AM9856, Invitrogen], 50 mM EDTA [AM9261, Invitrogen], 0.1 U/μL SUPERase In RNase inhibitor [10× more than in PBS-RI]). Cells were permeabilized for 15 minutes at room temperature (~23°C). After permeabilization, cells were centrifuged then washed with 175 μL PBS-RI then resuspended in 175 μL PBS-RI. 100 μL was taken for subsequent steps and centrifuged, while the remaining 75 μL was discarded. Cells were resuspended in 40 μL DNase-RI buffer (4.4 μL 10× reaction buffer, 0.2 μL SUPERase In RNase inhibitor, 35.4 μL water). 4 μL of DNase I (AMPD1, Millipore Sigma) was added, and cells were incubated at room temperature for 30 minutes. To inactivate the DNase I, 4 μL of Stop Solution was added, and cells were heated to 50°C for 10 minutes with shaking at 500 rpm (Multi-Therm, Benchmark Scientific, Sayreville, NJ). 50°C, instead of 70°C, was used to avoid cell lysis. After DNase inactivation, cells were pelleted, washed twice with 100 μL PBS-RI, then resuspended in 100 μL 0.5× PBS-RI. Cells were counted using a hemocytometer (DHC-S02, INCYTO, Chungnam-do, Korea).
Split-Pool Barcoding for PETRI-Seq
For RT, Round 1 primers (Supplementary Table 3) were diluted to 10 μM then 2 μL of each primer was aliquoted across a 96-well PCR plate. A reaction mix was prepared for RT with 240 μL 5× RT buffer, 24 μL dNTPs (N0447L, NEB, Ipswich, MA), 12 μL SUPERase In RNase Inhibitor, and 24 μL Maxima H Minus Reverse Transcriptase (EP0753, Thermo Scientific). 3 * 107 cells were added to this mix. For species-mixed libraries, E. coli and S. aureus cells were combined at this point. Water was added to bring the volume of the reaction mix to 960 μL. 8 μL of the reaction mix was added to each well of the 96-well plate already containing RT primers, making the final volume in each well 10 μL. The plate was sealed and incubated as follows: 50°C for 10 minutes, 8°C for 12 seconds, 15°C for 45 seconds, 20°C for 45 seconds, 30°C for 30 seconds, 42°C for 6 minutes, 50°C for 16 minutes, 4°C hold.
After RT, the 96 reactions were pooled into one tube. At this point, detergent was added to the pooled cells for Experiment 2.01, our most optimized version of PETRI-seq. Specifically, 5% Tween-20 was diluted 125× to a final concentration of 0.04%. We measured the volume of the pooled cells to determine this exact volume. Cells were then incubated on ice for 3 minutes, then PBS-RI was added to bring the final concentration of Tween-20 to 0.01% (i.e. add 2508 μL to 836 μL sample, splitting the samples into multiple Eppendorf tubes for centrifugation). Cells were then centrifuged at 10,000×g for 20 minutes at 4°C. The supernatant was removed. For experiments without detergent, cells were centrifuged (10,000×g, 20 minutes, 4°C) immediately after pooling. Without detergent, a cell pellet was not visible after this centrifugation, but with detergent a cell pellet was visible.
For the Round 2 ligation, cells were then resuspended in 600 μL 1× T4 ligase buffer (M0202L, NEB). The following additional reagents were added to make a master mix: 7.5 μL water, 37.5 μL 10× T4 ligase buffer, 16.7 μL SUPERase In RNase Inhibitor, 5.6 μL BSA (B14, Thermo Scientific), and 27.9 μL T4 ligase, making the final volume 695.2 μL. 5.76 μL of this mix was added to each well of a 96-well plate containing 2.24 μL of annealed Round 2 ligation oligos (see “Preparation of Annealed Ligation Oligos”) for a final volume of 8 μL. Ligations were carried out for 30 minutes at 37°C. After this incubation, 2 μL of blocking mix (37.5 μL 400 μM SB84 (100 μM for “1×” protocol), 37.5 μL 400 μM SB85 (100 μM for “1×” protocol), 25 μL 10× T4 ligase buffer, 150 μL water) was added to each well, and reactions were incubated for an additional 30 minutes at 37°C. Cells were then pooled into a single tube.
The following reagents were added to the pooled cells for Round 3 barcoding for Experiment 2.01 (most optimized protocol): 46 μL 10× T4 ligase buffer, 12.65 μL T4 ligase, and 115 μL water. 8.51 μL of this mix was added to each well of a 96-well plate containing 3.49 μL annealed Round 3 ligation oligos (see “Preparation of Annealed Ligation Oligos”).
Alternatively, for “1× protocol”, the following reagents were added to the pooled cells: 15.6 μL water, 48 μL 10× T4 ligase buffer, and 13.2 μL T4 ligase. 8.64 μL of this mix was added to each well of a 96-well plate containing 3.36 μL of annealed Round 3 ligation primers (see “Preparation of Annealed Ligation Oligos”).
The plate was incubated for 30 minutes at 37°C. After ligation, 10 μL of Round 3 blocking mix (72 μL 400 μM SB81 (100 μM for “1×” protocol), 72 μL 400 μM SB82 (100 μM for “1×” protocol), 120 μL 10× T4 ligase buffer, 336 μL water, 600 μL 0.5 M EDTA) was added to each well. Cells were then pooled into a single tube. When detergent was used (most optimized protocol, i.e., Experiment 2.01), Tween-20 was added to a final concentration of 0.01%. With or without detergent, cells were then centrifuged at 7,000×g for 10 minutes at 4°C. When including detergent, cells were resuspended in 500 μL TEL-RI + 0.01% Tween-20. Without detergent, cells were resuspended in 50 μL TEL-RI (because cell retention is very poor in large volumes without detergent). At this stage, additional washing may be advantageous to reduce any contamination from ambient cDNA (Extended Data Fig. 3, Extended Data Fig. 7), though we have yet to test this. This suspension was centrifuged at 7000×g for an additional 10 minutes at 4°C, the supernatant was removed, and the cells were resuspended in 30 μL TEL-RI. Cells were counted using a hemocytometer. Aliquots of ~10,000 cells were taken and diluted in 50 μL lysis buffer (50 mM Tris pH 8.0, 25 mM EDTA, 200 mM NaCl [AM9759, Invitrogen]). 5 μL of 20 mg/mL proteinase K (AM2548, Invitrogen) was added to the cells in lysis buffer. Cells were lysed for 1 hour at 55°C with shaking at 750 rpm (Multi-Therm). Lysates were stored at −80°C.
Library Preparation for PETRI-Seq
Library preparation steps following cell lysis and prior to PCR amplification should be performed with care. This is because without amplification, every barcoded cDNA molecule that originates from a single cell is non-recoverable if lost. In other words, any loss of cDNA results in a reduction in total UMI capture per cell.
Lysates were purified with AMPure XP beads (A63881, Beckman Coulter, Brea, CA) at a 1.8× ratio (~99 μL). cDNA was eluted in 20 μL water. 14 μL water, 4 μL NEBNext Second Strand Synthesis Reaction Buffer, and 2 μL NEBNext Second Strand Synthesis Enzyme Mix (E6111S, NEB) were added to the purified cDNA. This reaction (40 μL) was incubated at 16°C for 2.5 hours. The resulting double-stranded cDNA (dscDNA) was purified with AMPure XP beads at a 1.8× ratio (~72 μL). dscDNA was eluted in 20 μL water and used immediately for tagmentation or stored at −20°C.
dscDNA was tagmented and amplified using the Nextera XT DNA Library Preparation Kit (FC-131–1096, Illumina, San Diego, CA). The manufacturer’s protocol was followed with the following modified reagent volumes and primers: 25 μL TD, 20 μL cDNA, 5 μL ATM, 12.5 μL NT, 2.5 μL N70× (Nextera Index Kit v2 Set A, TG-131–2001, Illumina), 2.5 μL i50× (E7600S, NEB), 20 μL water, 37.5 μL NPM. Libraries were amplified for 8 cycles according to the manufacturer’s protocol. After 8 cycles, 5 μL was removed, added to a qPCR mix (0.275 μL EvaGreen [31000, Biotium, Fremont, CA], 0.11 μL ROX Low Reference Dye [KK4602, Kapa Biosystems, Wilmington, MA], 0.115 μL water), and further cycled on a qPCR machine. qPCR amplification was used to determine the exponential phase of amplification, which occurred after 11 cycles for Experiments 1.06SaEc and 1.10 and after 8 cycles for Experiment 2.01. The remaining PCR (not removed for qPCR) was thermocycled an additional 11 or 8 cycles, resulting in a total of 19 or 16 PCR cycles. Products were purified with AMPure XP beads at a 1× ratio and eluted in 30 μL water. The concentration of the library was measured using the Qubit dsDNA HS Assay Kit (Q32854, Invitrogen) and the Agilent Bioanalyzer High Sensitivity DNA kit (5067–4626, Agilent, Santa Clara, CA). Though we used a 1× ratio of AMPure beads for the libraries presented here, we note that, after sequencing, a significant fraction of molecules were too short to be assigned to a BC and/or aligned to the genome (Supplementary Table 4). A lower ratio of AMPure beads or an additional round of purification might be helpful to reduce the abundance of these wasted reads.
Libraries were sequenced for 75 cycles with the NextSeq 500/550 High Output Kit v2.5 (20024906, Illumina). Cycles were allocated as follows: 58 cycles read 1 (UMI and barcodes), 17 cycles read 2 (cDNA), 8 cycles index 1, 8 cycles index 2.
Modifications Tested to Optimize PETRI-Seq
To test fixing cells immediately from cultures without centrifugation, ice-cold 5% formaldehyde in PBS was added directly to cells in spent media to bring the final concentration of formaldehyde to 4%. Cell preparation with no lysozyme or no DNase was carried out by simply omitting the enzyme and using water to replace that volume.
Template switching was carried out by adding 2.5 μL 100 μM SB14, 20 μL Maxima H Minus 5× Buffer, 10 μL dNTPs, 2.5 μL SUPERase In RNase Inhibitor, 2 μL Maxima H Minus Reverse Transcriptase, 3 μL water, and 20 μL betaine (J77507VCR, Thermo Scientific) to 40 μL of AMPure purified lysate. SB14 was heated to 72°C for 5 minutes prior to combining the above reagents. The reaction was incubated at 42°C for 90 minutes then heat inactivated at 85°C for 5 minutes. The reaction was purified with AMPure XP beads at a 1.8× ratio and eluted in 30 μL. The purified cDNA was then amplified by setting up the following PCR: 10 μL 5× PrimeSTAR GXL Buffer, 0.1 μL 10 μM SB86, 0.1 μL 10 μM SB15, 1 μL PrimeSTAR GXL Polymerase (R050B, Takara Bio, Kusatsu, Japan), 1 μL dNTPs, and 8 μL water. The reaction was heated to 98°C for 1 minute and then thermocycled 10 times (98°C 10 seconds, 60°C 15 seconds, 68°C 6 minutes). The products were purified by AMPure XP beads at a 1.8× ratio and eluted in 30 μL. The DNA concentration was measured using the Qubit dsDNA HS Assay Kit, and tagmentation was performed according to the manufacturer’s protocol using the appropriate primers (described above for standard PETRI-seq).
For library “1.06SaEc-replicate” (Supplementary Table 4), we included an “RT clean-up” step as part of library preparation. RT clean-up was carried out in the same way as template switching, but SB14 (TSO) was not added. After incubating the reaction at 42°C for 90 minutes then heat inactivating at 85°C for 5 minutes, reaction components were added for second strand synthesis (70 μL water, 20 μL NEB second strand buffer, 10 μL NEB second strand enzyme). Second strand synthesis was carried out as described and the double-stranded cDNA was used as input for tagmentation. While “RT clean-up” resulted in a broader size distribution on the bioanalyzer after tagmentation (not shown), it did not change the yield of PETRI-seq and thus was not used for other libraries.
For Experiment 1.08 (Supplementary Table 4), we included a longer RT (~2 hours) using the following thermocycling protocol: 50°C 10 min, 10×: 8°C 12s, 15°C 45s, 20°C 45s, 25°C 5 min, 42°C 1 min, 50°C 2 min.
qPCR Quantification After In Situ DNase or In Situ RT
For qPCR quantification after in situ RT, cells were counted prior to RT, and then the in situ RT reaction described above (scaled to one 50 μL reaction) was set up with equal cell numbers for each condition and technical replicate. A random hexamer (SB94) or a gene-specific primer (SB10) was used as an RT primer. After RT, cells were centrifuged at 7,000×g for 10 minutes then washed in 50 μL PBS-RI. After one wash, cells were resuspended in 50 μL lysis buffer, and 5 μL of proteinase K was added. Cells were lysed for 1 hour at 55°C with shaking at 750rpm. For qPCR quantification after in situ DNase treatment, cells were washed twice after DNase treatment, as described for PETRI-seq cell preparation, then lysed.
Unpurified lysates were diluted 50× (except for ethanol vs. no ethanol, which were diluted 10×) in water and heated to 95°C for 10 minutes to inactivate proteinase K. Diluted lysates were then used directly in qPCR with either Kapa 2× MasterMix Universal (KK4602, Kapa Biosystems) or Power SYBR Green Master Mix (4368706, Applied Biosystems, Foster City, CA). For quantification of genomic DNA after DNase treatment or quantification of cDNA after RT with random hexamers, qPCR primers SB5 and SB6 were used, and relative abundances were calculated based on an experimentally determined amplification efficiency of 88%, which corresponded to an amplification factor of 1.88. Relative abundance thus referred to 1.88−ΔCt, where ΔCt was the difference between the Ct value of each sample and a calibrator Ct. For RT with the gene-specific primer, qPCR primers SB12 and SB13 were used, as SB12 anneals to the gene-specific primer (SB10). The experimentally determined amplification factor for these primers was 1.73. To quantify cDNA yield, the abundance of a matched sample with no RT (processed equivalently but RT enzyme omitted) was subtracted from each measurement. All replicates were technical replicates, which were treated independently during and after the condition tested.
qPCR Quantification of Ligation Efficiency
To test barcode ligation with a 16-base linker relative to a 30-base linker, approximately 1 μg of purified RNA (bulk) was used for RT with either SB110 or SB114 (used as a positive control). RT was carried out as described for in situ RT, scaled to 50 μL. cDNA was then purified with AMPure XP beads. SB113, the primer to be ligated, was annealed either to SB111 (30 bases) or SB83 (16 bases). 2.24 μL of the annealed primers was then used in a 10 μL ligation reaction. The products were purified with AMPure XP beads. To quantify the proportion of ligated product, qPCR was performed with SB86 and SB13, which amplifies only the ligated product, as SB86 anneals to the ligated overhang, or SB115 and SB13, which amplifies all RT product, as SB115 anneals to the RT primer overhang. ΔΔCt was calculated for the two primer sets with RT product from SB114 as a reference [ΔΔCt = ΔCt(experimental, ligated) - ΔCt(control, SB114 RT), ΔCt = Ct(SB86,SB13) - Ct(SB115,SB13)]. SB114 includes primer sites for both SB86 and SB115, so it mimics ligation with 100% efficiency.
Test of DNase Inactivation by Incubating Cells with Exogenous DNA
After DNase treatment, inactivation, and two PBS-RI washes (described above), cells were resuspended in 20 μL PBS-RI. 6 μL was removed and added to 1 μL DNase reaction buffer, 1 μL water, and 2 μL of a 775 bp PCR product (800 ng). As a control, 1 μL DNase I was added instead of 1 μL water. The reactions were incubated for 1 hour, after which 1 μL of stop solution was added. The cells were centrifuged for 10 minutes at 7,000×g. The supernatants were then heated to 70C for 10 minutes to inactivate DNase. 5 μL of each reaction was run on a gel.
Bulk Library Preparation
For preparation of bulk samples from fixed cells (shown in Fig. 2d,e, Extended Data Fig. 9), 25 μL (~107 cells) was taken after PETRI-seq cell preparation and just prior to in situ RT. These cells were centrifuged and resuspended in 50 μL lysis buffer supplemented with 5 μL proteinase K. Cells were lysed at 55°C for 1 hour with shaking at 750 rpm (Multi-Therm). RNA was then purified from lysates with the Norgen Total RNA Purification Plus Kit (48300, Norgen Biotek, Ontario, Canada). 300 μL buffer RL was added to the lysate before proceeding to the total RNA purification protocol. Alternatively, the standard bulk RNA sample (Extended Data Fig. 2b,c) was prepared by centrifuging a cell culture at 5,525×g for 2 minutes at 4°C then resuspending cells in 1mL of PBS-RNAprotect (333 μL RNAprotect Bacteria Reagent [76506, Qiagen, Hilden, Germany], 666 μL PBS). For immediate RNA stabilization by RNAprotect (Extended Data Fig. 2b), 2 mL of RNAprotect was immediately added to 1 mL of exponential E. coli cells. For immediate RNA stabilization by flash freezing (Extended Data Fig. 2b), 330 μL 60% glycerol was added to 1 mL exponential E. coli cells, and cells were flash frozen in ethanol and dry ice (<1 minute). Frozen cells were put at −80°C overnight, then thawed, spun down and re-suspended in PBS-RI. For all three protocols, after resuspending cells in RNAprotect or PBS-RI, cells were then pelleted again, and RNA was prepared with the Norgen Total RNA Purification Plus Kit according to the manufacturer’s instructions for Gram-negative bacteria.
Purified RNA from either protocol was treated with DNase I in a 50 μL reaction consisting of 2–5 μg RNA, 5 μL DNase Reaction Buffer, 5 μL DNase, and water. Reactions were incubated at room temperature for 30–40 minutes. Reactions were purified by adding 300 μL buffer RL and proceeding according to the Norgen total RNA purification protocol. Total RNA was depleted of rRNA using the Gram-Negative Ribo-Zero rRNA Removal Kit (MRZGN126, Illumina), purified by ethanol precipitation, and resuspended in 10 μL water. For RT, 6 μL RNA was combined with 4 μL Maxima H Minus 5× Buffer, 2 μL dNTPs, 0.5 μL SUPERase In RNase Inhibitor, 1 μL SB94, 0.5 μL Maxima H Minus Reverse Transcriptase, 4 μL betaine, and 2 μL water. The reaction was thermocycled as follows: 50°C for 10 minutes, 8°C for 12 seconds, 15°C for 45 seconds, 20°C for 45 seconds, 30°C for 30 seconds, 42°C for 6 minutes, 50°C for 16 minutes, 85°C 5 minutes, 4°C hold. For second strand synthesis, 14 μL water, 4 μL NEBNext Second Strand Synthesis Reaction Buffer, and 2 μL NEBNext Second Strand Synthesis Enzyme Mix were added directly to the RT mix. This reaction was incubated at 16°C for 2.5 hours. Double-stranded cDNA was purified with AMPure XP beads at a 1.8× ratio (~72 μL beads) and eluted in 30 μL water. Purified cDNA was used for tagmentation with the Nextera XT kit according to the manufacturer’s protocol. Bulk libraries were purified twice with AMPure XP beads at a 0.9× ratio. The resulting libraries were quantified and sequenced as described for PETRI-seq libraries above.
Growth Curves
Overnight cultures were grown as described above and then diluted 1:100 into 1 mL EZ Rich Defined Media with or without 20 nM aTc. Antibiotics were added for plasmid-containing strains. For each condition, 100 μL of diluted cells were aliquoted into 4 wells of a 96-well plate. The plate was incubated at 37°C with shaking on the plate reader (Synergy Mx, Biotek, Winooski, VT). OD600, GFP, and RFP were measured every 10 minutes.
Computational Methods
Barcode Demultiplexing, Cell Selection and Alignment
Cutadapt47 was used to trim low-quality read 1 and read 2 sequences with phred score below ten. Umi_tools48 was used in paired-end mode to extract the seven base UMI sequence from the beginning of read 1. Read pairs were then grouped based on their three barcode sequences using the cutadapt demultiplex feature. FASTQ files were first demultiplexed by barcode 3, requiring that matching sequences were anchored at the beginning of the read, overlapped at 21 positions (“--overlap 21”, including downstream linker [GGTCCTTGGCTTCGC]), and had no more than 1 mismatch relative to the barcode assignment (-e 0.05). As part of demultiplexing, the barcode and linker sequence were trimmed in read 1. For barcode 2, cutadapt was used to locate barcode sequences with the expected downstream linker, allowing no more than 1 mismatch (-e 0.05 --overlap 20) and requiring the barcode at the beginning of the read. The barcode and linker sequences were trimmed. Next, reads were demultiplexed by barcode 1, requiring the barcode at the beginning of the read and allowing 1 mismatch but no indels. The final output after demultiplexing was a set of read 1 and read 2 FASTQ files where each file corresponded to a three-barcode combination (BC). The “knee” method5 was used to identify BCs for further processing. Briefly, each BC was sorted by descending total number of reads, and then the cumulative fraction of reads for each BC was plotted. Because the yield per BC could be better assessed later after collapsing reads to UMIs, an inclusive threshold was used at this stage to select BCs for downstream processing, which allowed for more precise cell selection after downstream processing (Extended Data Fig. 1f). Cutadapt was then used to trim and discard read 2 sequences containing barcode 1 or the linker sequence. Note that at this point all necessary information was contained in the read 2 FASTQ files, so further processing did not consider the read 1 files. Next, cDNA sequences were aligned to reference genomes using the backtrack algorithm in the Burrows-Wheeler Alignment tool, bwa49, allowing a maximum edit distance of 1 for assigned alignments.
Annotating Features and Grouping PCR Duplicates by Shared UMI
FeatureCounts50 was used to annotate operons based on the alignment position. Operon sequences were obtained from RegulonDB51 and ProOpDB52 for E. coli and S. aureus, respectively. Because featureCounts uses an “XT” sam file tag for annotation, the bwa “XT” tag was first removed from all sam files using a python script. The resulting bam files after featureCounts were used as input for the group function of umi_tools with the “--per-gene” option in directional mode48. The directional algorithm is a network-based method that identifies clusters of connected UMI sequences to group as single UMIs. The result was a set of bam files with UMI sequences corrected based on probable errors from sequencing or amplification. A python script was used to collapse reads to UMIs. Reads with the same BC, error corrected UMI, and operon assignment were grouped into a single count. With 47 possible UMIs, we confirmed that the expected rate of UMI collisions (different molecules with the same UMI) was low by implementing a correction based on the Poisson expectation of collisions53. As this correction had a negligible effect, we did not include it for other analysis. Reads mapping to multiple optimal positions were omitted except rRNA alignments for which multiple alignments were expected. The distribution of number of reads per UMI for all UMI-BC-operon combinations was plotted to establish a threshold below which UMIs were excluded (Extended Data Fig. 1g). Filtered UMIs were used to generate an operon by BC count matrix. Anti-sense transcripts were removed. BCs with fewer than a threshold of total UMIs were then removed (Extended Data Fig. 1j,i and Extended Data Fig. 6h,i). GNU Parallel54 was used to execute many of the above processes more efficiently.
Bulk Sequencing Libraries
For bulk sequencing libraries, only read 2 was used for alignment in order to mimic single-cell methods. Bulk sequencing libraries were pre-processed to remove adapters using cutadapt47. Trimmomatic55 was then used to remove leading or trailing bases below quality phred33 quality 3 and discard reads shorter than 14 bases. Surviving reads were aligned using the backtrack algorithm in bwa 49 with a maximum edit distance of 1. Reads with more than one optimal alignment position were removed. FeatureCounts50 was used to generate a matrix of operon counts for the bulk libraries. To compare single-cell libraries generated by PETRI-seq to bulk samples, the UMI counts for a given set of BCs (e.g. GFP-expressing E. coli) were summed for all operons. A count matrix was then generated as described for bulk libraries. To calculate TPM, raw counts were divided by the length of the operon in kilobases. Then, each length-adjusted count was divided by the sum of all adjusted counts divided by 1 million.
Calculating Multiplet Frequency
The multiplet frequency was defined as the fraction of non-empty BCs corresponding to more than one cell. To calculate the predicted multiplet frequency, the proportion of predicted BCs with 0 cells was calculated based on a Poisson process: , the proportion of BCs with 1 cell was calculated: , the proportion with greater than 0 cells was calculated: , and the proportion with greater than 1 cell was calculated: . Finally, the multiplet frequency was calculated: . λ was the fraction of cells relative to total possible BCs – for example, . The experimental multiplet frequency was computed from the species-mixing experiment as described for populations with unequal representation of two species20.
Principal Component Analysis (PCA)
rRNA and all plasmid genes (RFP, GFP, AmpR, KanR, tetR) were first removed from the count matrix. Operons with 5 or fewer total counts in the library were also removed. Cells with fewer than 15 mRNAs were removed (Extended Data Fig. 1j,k). Total operon counts for each cell were normalized by dividing each count by the total number of counts for that cell then multiplying the resulting value by the geometric mean13 of the total mRNA counts for each cell. The scaled values were then log transformed after adding a pseudocount to each. For each operon, expression values were scaled to z-scores56. Principal components were computed using scikit-learn in python.
To normalize counts using sctransform in Seurat26, first rRNA and all plasmid genes were removed from the count matrix. Operons with 10 or fewer total counts, and cells with fewer than 15 mRNAs were also removed. A Seurat object was created in R from the resulting matrix, and sctransform was applied. The resulting scaled counts were used as input for PCA.
True positive rate (TPR) was calculated as follows, using red cells to the left of a threshold line as an example: , where = number of red cells left of threshold, = total number of red cells, = number of green cells left of threshold, = total number of green cells.
Computing Moving Averages of Gene Expression Along PC1
Using a custom Python script, the cells in the normalized, log-transformed, z-scored gene matrix were sorted by PC1. The rolling function in the pandas package was then used to compute rolling averages of the size indicated for each figure. Win_type was set to “None”. The corresponding PC1 coordinate was the moving average of the PC1 values. Moving averages for GO terms were computed as described, except the z-scored sum of z-scored counts for all operons in the GO term was used to calculate the moving average instead of expression from a single operon. In cases where multiple genes from the same operon were included in a GO term, only one gene was included. Significance of expression trends was determined by the Spearman rank correlation between the operon or GO term expression and PC1, prior to calculating a moving average. FDR was determined by the Benjamini-Hochberg procedure57.
Computing Operon Noise
Noise was defined as , where is standard deviation and is mean. Noise and mean were calculated for all operons with at least 5 raw counts (UMIs) in the dataset (either S. aureus or E. coli). Count matrices were normalized by cell and multiplied by the geometric mean of total UMIs per cell in the library (but not log-transformed) before computing noise and mean. Operons with mean expression < 0.002 after normalization were excluded. To calculate a p-value for the divergence of SAUSA300_1933–1925 (Extended Data Fig. 10e) or candidate hyper-variable E. coli operons (Extended Data Fig. 10f), a line was fit to the log-scaled noise vs log-scaled mean of the data. The residuals of the experimental data to the best-fit line were calculated and z-scored. The p-value was determined based on a normal distribution of the z-scored residuals. For the E. coli dataset, cells with BC2 #22, 49, or 69 were removed because in rare cases these barcodes misaligned to an operon, resulting in the appearance of hyper-variability in gene expression.
Future directions for optimization
We anticipate that the following modifications would further improve the final mRNA capture of PETRI-seq. During the library preparation step of PETRI-seq, subjecting double-stranded cDNA to conventional tagmentation with both N5 and N7 adaptors (Illumina Nextera XT) incurs a 2-fold loss of mRNA capture. This is because only one of the adaptors (N7 in our case) could be subsequently amplified, leading to the loss of all molecules tagmented by N5. Thus, modified tagmentation using a single adaptor (N7 only), as demonstrated before13, could prevent this 2-fold loss.
Second, capture may be improved by further increasing primer and enzyme concentrations during the ligation steps and/or using a hairpin ligation13 instead of an inter-molecular linker. For instance, increasing the concentration of Round 3 ligation oligos by 4-fold alone increased mRNA capture by 2.7-fold in both exponential and stationary E. coli cells (Extended Data Fig. 6a). Our preliminary results also indicate that adding polyethylene glycol (PEG) to the third round of ligation increases capture by 30% (not shown).
Given that rRNAs comprise >95% of total RNA species in many bacteria, we reason that rRNA depletion could vastly improve mRNA capture and sequencing efficiency. We propose four such strategies here. First, rRNA degradation through hybridization has been demonstrated for bulk RNA sample preparations58, in which rRNAs are hybridized with a comprehensive set of short complementary DNA oligos, followed by RNase H treatment. Second, mRNA capture might be improved by designing RT primers with sequences biased against rRNA59, thereby directing reagents preferentially toward mRNA. Third, in situ 5’-phosphate-dependent exonuclease treatment could be used to preferentially degrade processed RNAs, the majority of these being rRNAs60, prior to RT. While these three strategies aim to deplete rRNAs in situ, the fourth strategy is applied during library preparation. Specifically, abundance-based normalization by melting and rehybridization of the double-stranded cDNA library followed by duplex-specific nuclease treatment61 can be used to deplete dsDNAs encoding rRNAs. In developing these rRNA depletion strategies, it will be important to ensure that the depletion is specific by comparing the depleted and non-depleted transcriptomes.
In addition to optimizing the mRNA capture rate, further reduction in cost and time will improve the PETRI-seq workflow. We have preliminary results indicating that DNase treatment may not be necessary (not shown). However, we have not yet determined if omitting the DNase buffer incubation or heat inactivation would alter cell permeability. Without DNase treatment, cell preparation time would be reduced by ~1.5 hours.
Finally, we have shown that in Experiment 2.01, ~1–5% of UMIs within a single-cell transcriptome are likely derived from other cells (Extended Data Fig. 7d). This cross-contamination, which may be the result of ambient cDNA released from cells during or after barcoding, might be reduced by more thorough cell washing prior to lysis. Cross-contamination may also be reduced by preparing lysates with fewer cells, thereby reducing the likelihood of barcode collisions with ambient cDNA (or other cells). PCR may also be a source of cross-contamination through chimera formation or priming by residual barcodes. This type of contamination may be reduced by thorough washing prior to lysis (to remove free barcodes) or by optimizing the parameters of the PCR. Computationally, we also showed that a more stringent alignment reduces the level of apparent cross-contamination resulting from incorrect alignment (Extended Data Fig. 3e,f), but more stringent alignment results in a decrease in captured UMIs per cell (Extended Data Fig. 3c,d,g,h). Future studies could use longer reads (i.e., 150-cycle Illumina Nextseq) to eliminate ambiguities in alignment without sacrificing capture rate.
Extended Data
Extended Data Fig. 1. Experimental and computational pipelines for PETRI-seq.
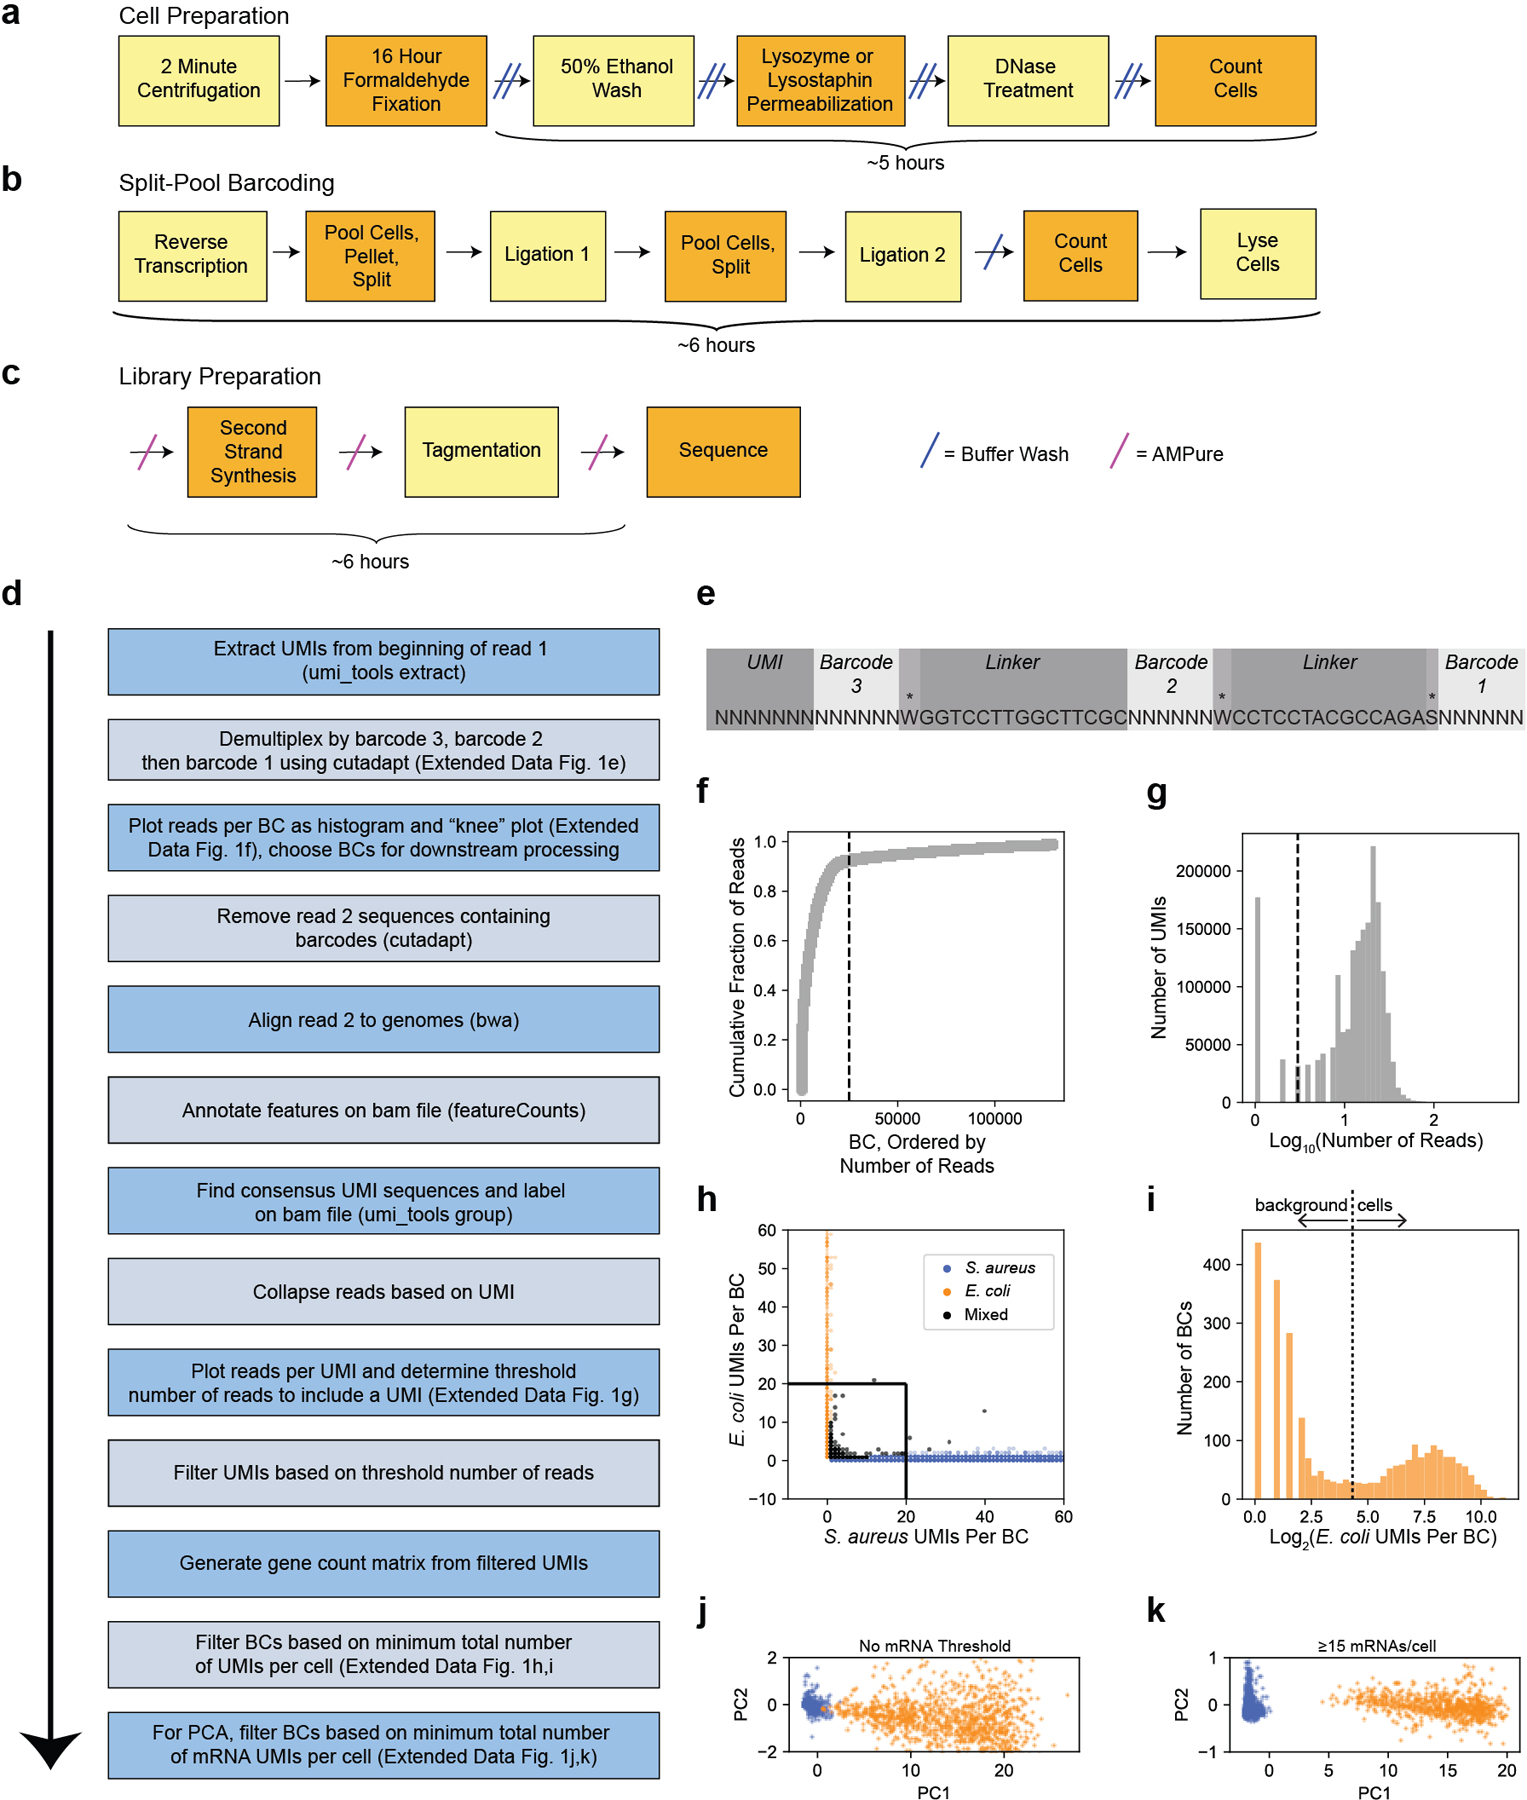
(a,b,c) Experimental pipeline for PETRI-seq. PETRI-seq libraries can be prepared in just 2.5 days. (a) Detailed schematic of steps for cell preparation, which is started at the end of day 1 and finished on day 2. (b) Detailed schematic of steps for split-pool barcoding, which is entirely done on day 2. (c) Detailed schematic of steps for library preparation, which can be completed (up to sequencing) on day 3 (or later, if preferred). (d) Computational pipeline for PETRI-seq analysis after sequencing. (e) Structure of contig elements in read 1 after Illumina sequencing of PETRI-seq. To reduce the length of the sequence, barcodes overlap by one base (indicated by asterisk) with the adjacent linker sequence. (f) Representative “knee plot” used to select BCs for further analysis. The threshold line at 25,000 BCs is inclusive to facilitate additional filtering after collapsing PCR duplicates to UMIs. (g) Representative histogram of reads per UMI. A threshold line was set for each library. For this library, only UMIs with more than 3 reads were kept for downstream analysis. Threshold line at log10(3). (h) Species mixing plot with all BCs containing >0 UMIs for library 1.06SaEc. BCs with fewer than 20 UMIs per cell were removed from further analysis. Line segments at x=20 and y=20. (i) Distribution of E. coli BCs from species mixing plot in (h). BCs above the threshold line were used for further analysis and considered single E. coli cells. Threshold line at log2(20). (j,k) PCAs of E. coli (orange) and S. aureus (blue) BCs from library 1.06SaEc. For calculation of principal components, rRNA operons were omitted and counts were normalized and scaled as described in methods. In (j), all S. aureus and E. coli BCs with greater than 20 total UMIs and greater than 0 mRNAs are included (13,786 S. aureus, 1,153 E. coli). In (k), only BCs with greater than or equal to 15 mRNA UMIs are included (6,683 S. aureus, 800 E. coli). For 100% of S. aureus BCs, PC1<0.05, and for 100% of E. coli BCs, PC1>4.
Extended Data Fig. 2. Development and preliminary optimization of PETRI-seq.
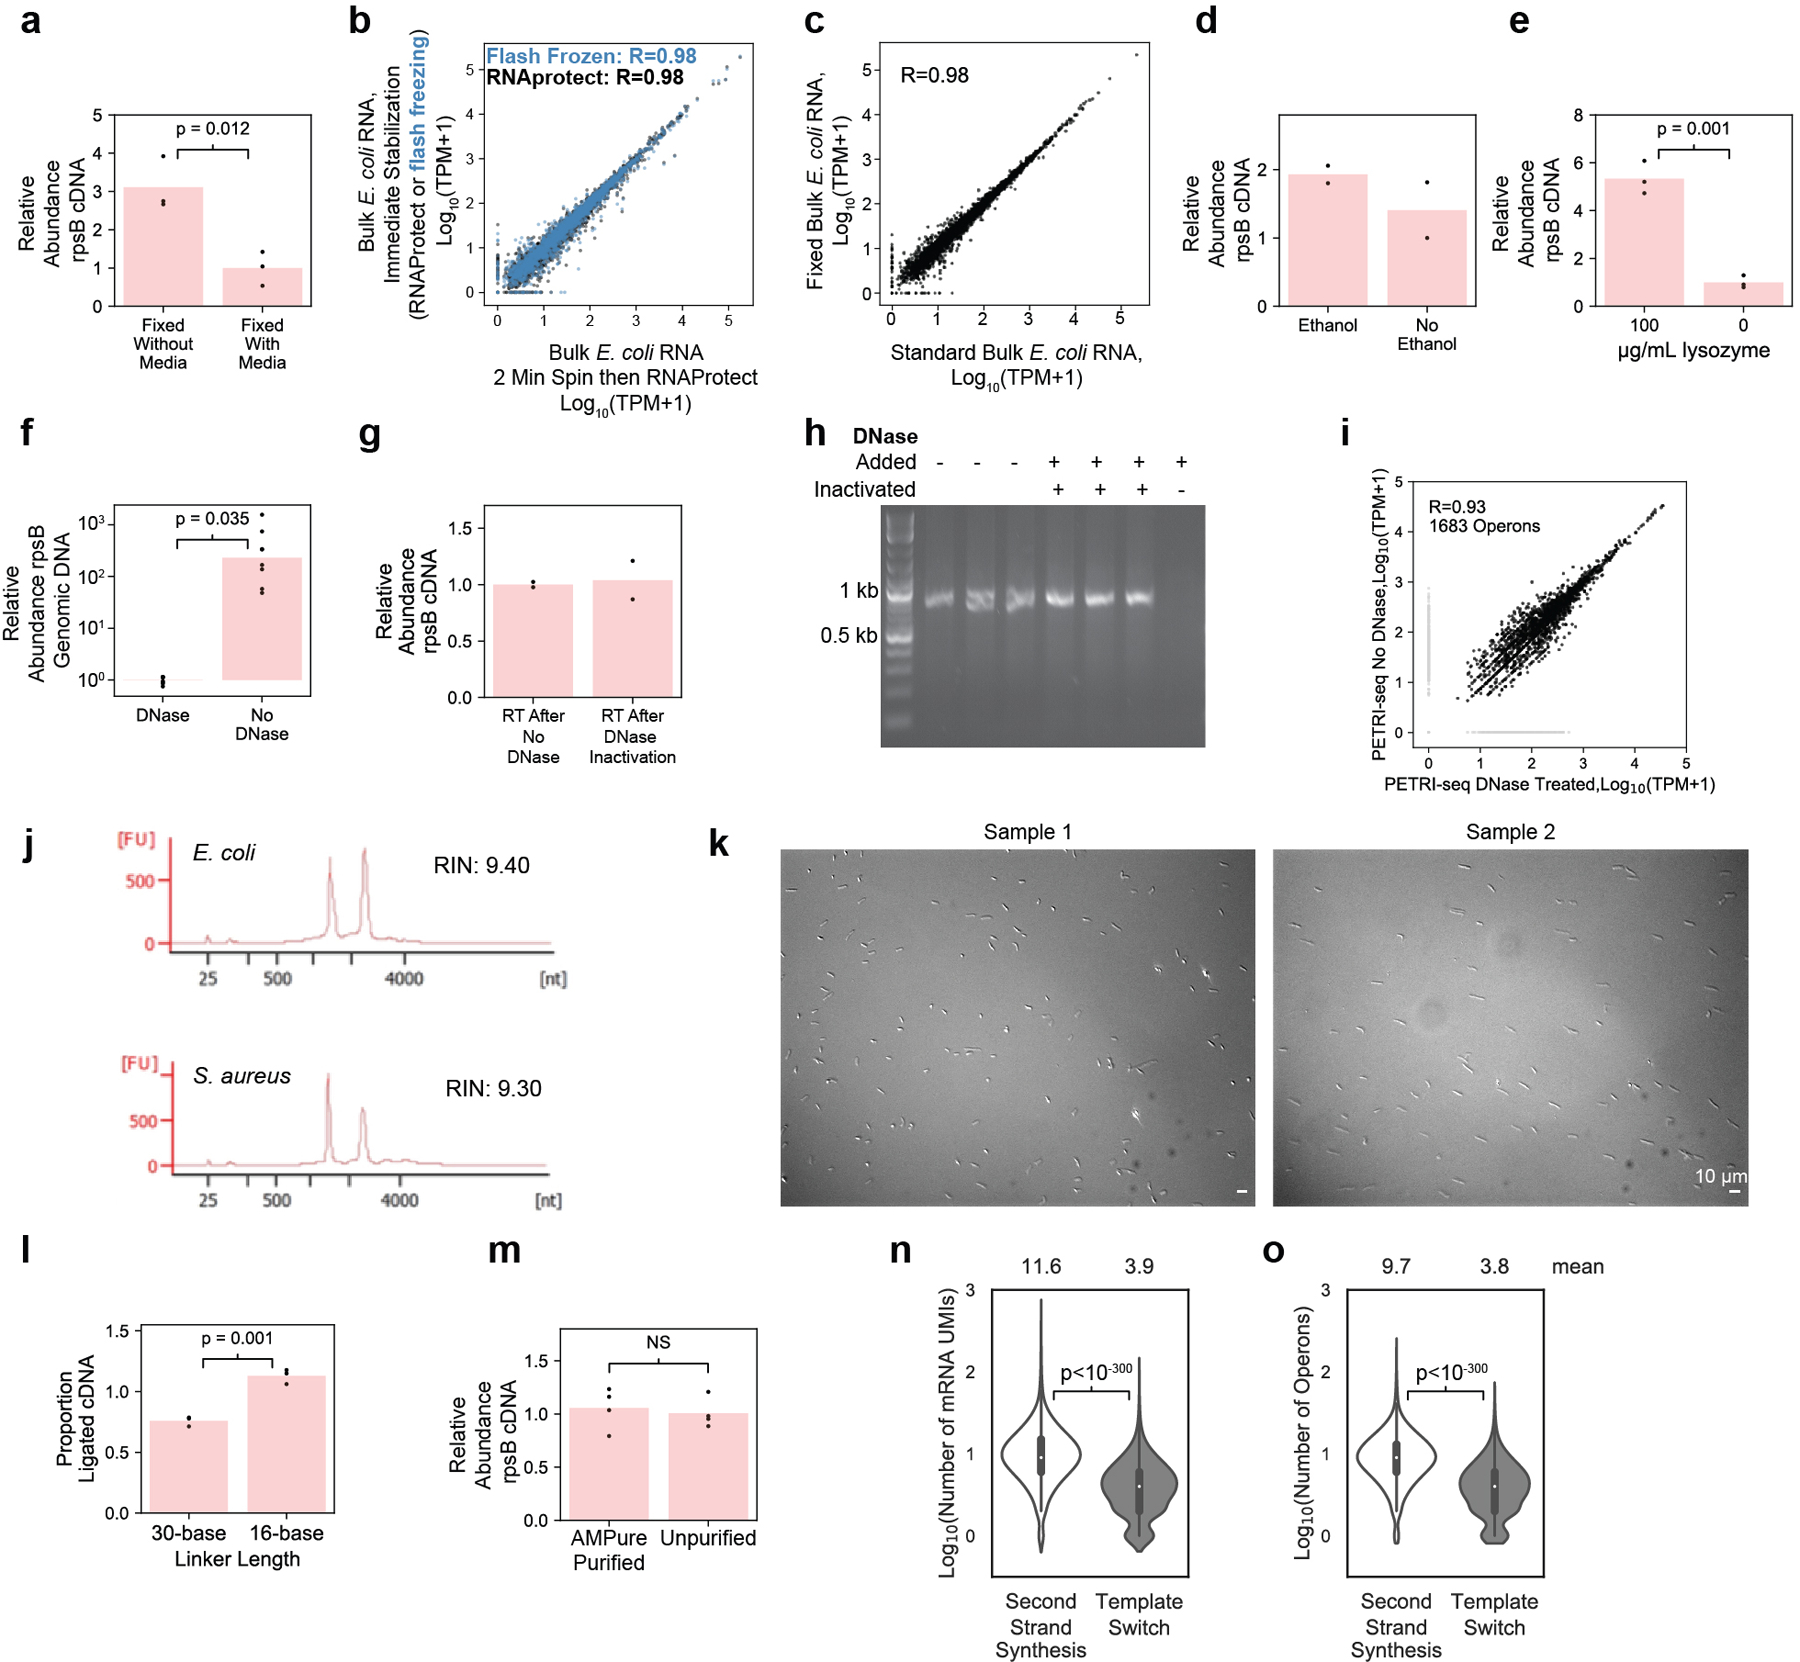
(a) qPCR after in situ RT with random hexamers shows higher yield of rpsB cDNA from fixation without media (pelleting before) than fixation with media (formaldehyde added to culture) [n=3 technically independent samples (dots), p=0.012, 2-sided t-test]. Bars show mean abundance. (b) Transcriptome stabilized by RNAprotect after 2-minute spin was highly correlated with transcriptomes stabilized immediately by either RNAprotect or flash freezing. Pearson’s r is reported. (c) RNA purified from E. coli cells after 16-hour 4% formaldehyde fixation (“Fixed Bulk”) was highly correlated with non-fixed RNA (“Standard Bulk”). 2,617 operons included. Pearson’s r is reported. (d) qPCR after in situ RT with rpsB-specific primer (SB10) showed similar yield when cells were resuspended in 50% ethanol (n=2 technically independent samples). (e) qPCR after in situ RT with random hexamers shows improved yield of rpsB cDNA after lysozyme treatment (n=3 technically independent samples [dots], p=0.001, 2-sided t-test). Bars show mean abundance. (f) qPCR after DNase treatment or incubation with only DNase buffer confirmed in situ DNase treatment efficacy (n=8 technically independent samples [dots], p=0.035, 2-sided t-test). Bars show mean abundance. (g) qPCR after in situ RT with rpsB-specific primer (SB10) confirmed DNase inactivation, as yield was unchanged (n=2 technically independent samples [dots]). Bars show mean proportion. (h) Gel of 775-bp PCR fragment after 1-hour incubation with DNase-treated cells confirmed DNase inactivation. Right-most lane: DNase was directly added to PCR product. Experiment conducted one time. (i) Aggregated PETRI-seq UMIs from DNase-treated and untreated libraries were highly correlated. Pearson’s r reported. (j) Bioanalyzer traces of RNA purified after in situ DNase treatment and cell lysis (methods). (k) Imaging after E. coli cell preparation. Images for all libraries looked similar (n=8). (l) qPCR after bulk RT and ligation (methods) confirmed effective ligation with a 16-base linker. Minor increase (1.5×) in ligation efficiency was detected (p=0.001, n=3 technically independent samples [dots], 2-sided t-test). Bars show mean proportion. (m) qPCR after in situ RT showed cDNA retention after AMPure purification (n=4 technically independent samples, p=0.69, 2-sided t-test). Bars show mean abundance. (n,o) Second-strand synthesis yielded more mRNAs and operons per cell (p < 10−300, 2-sided Mann-Whitney U) than template switching. 10,000 BCs are included from unoptimized PETRI-seq (Experiment 1.08). Boxplots within violins show interquartile range (black box) and median (white circle).
Extended Data Fig. 3. Quantification of intercellular contamination using E. coli and S. aureus cells.
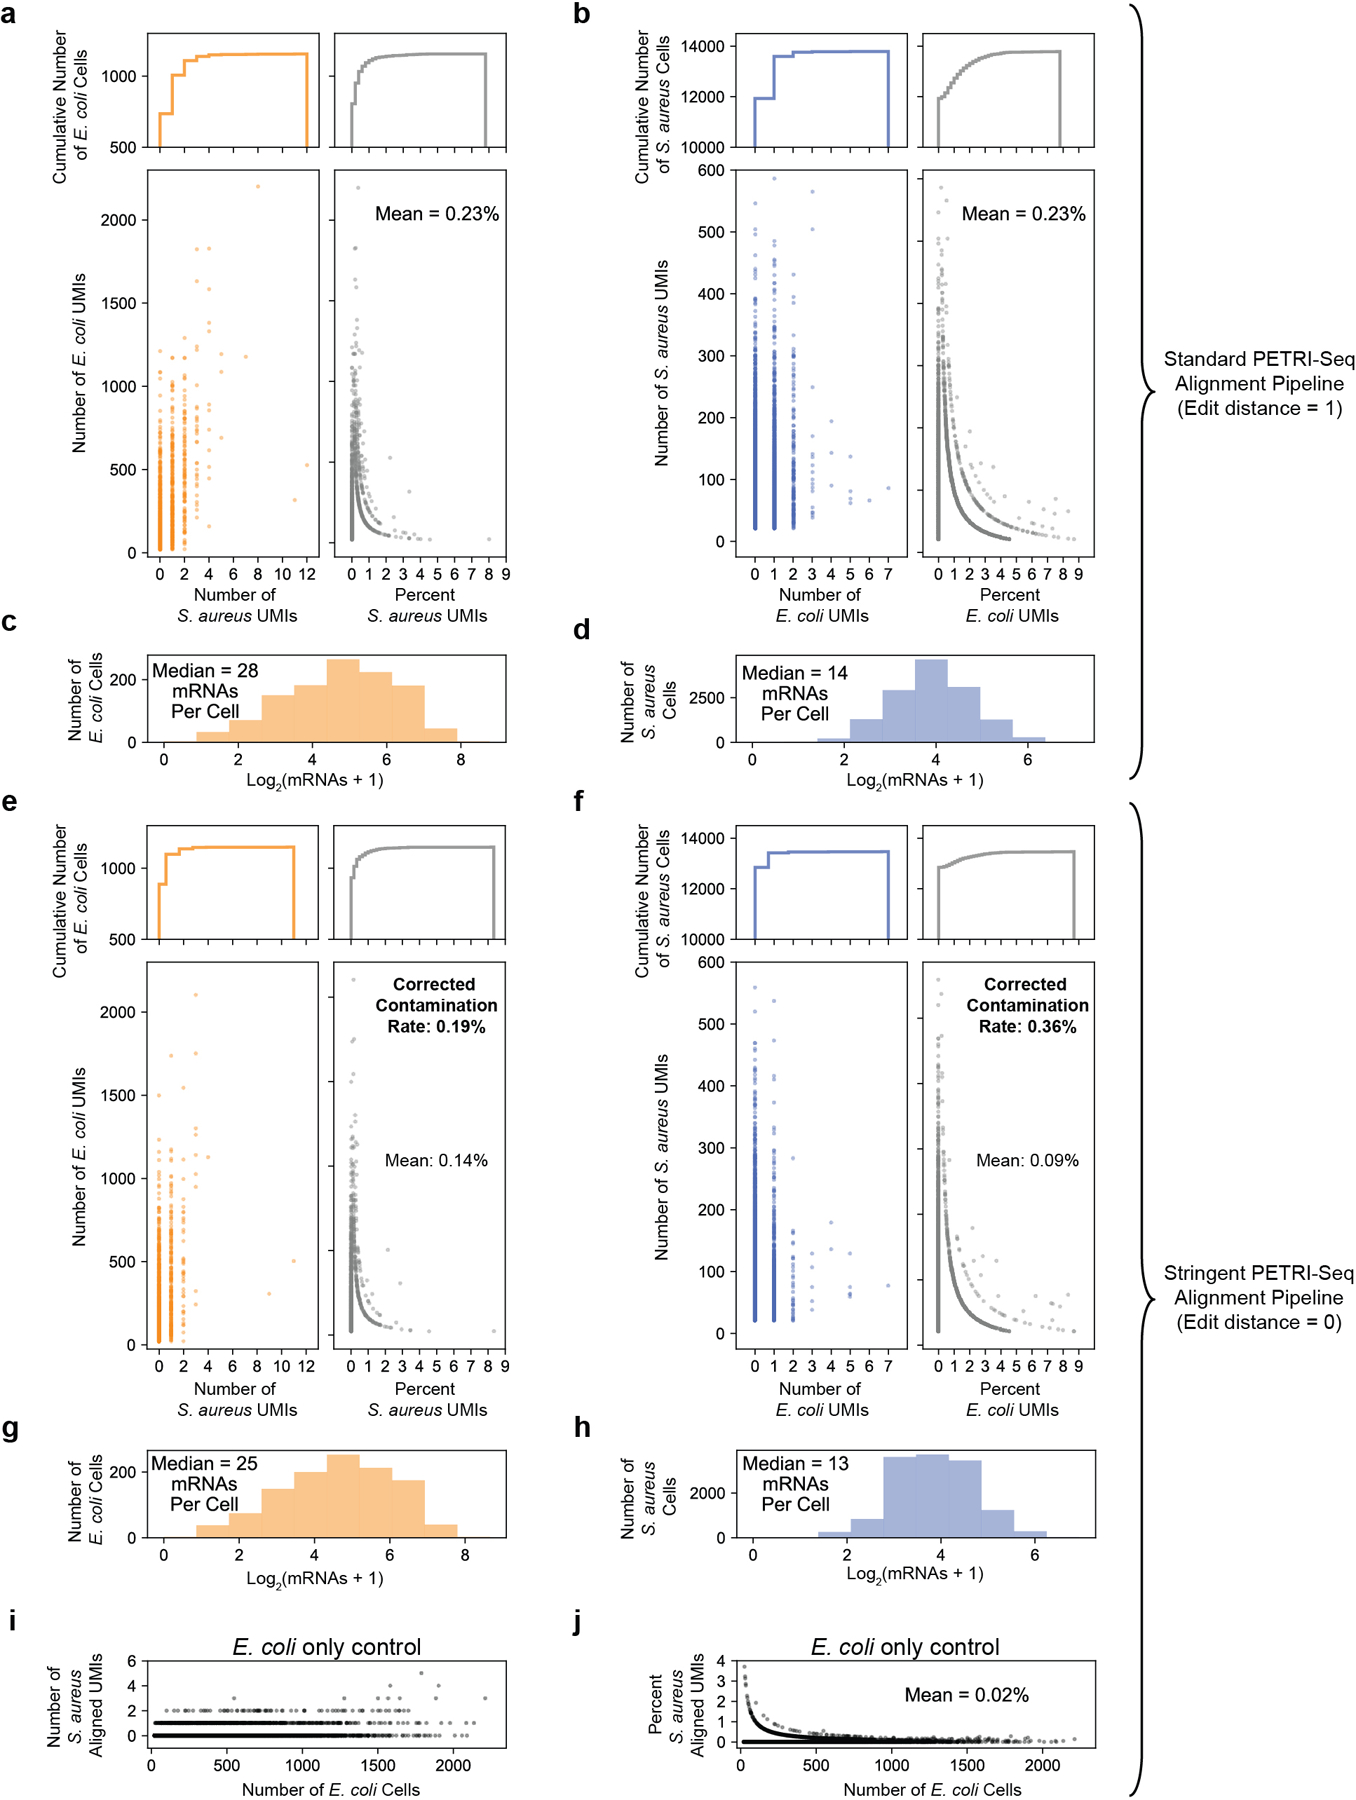
After defining single E. coli and S. aureus cells (Fig. 2b, Experiment 1.06SaEc), we examined levels of cross-contamination within single cells. Similar analysis for Experiment 2.01 is shown in Extended Data Fig. 7c,d. (a) Quantification of S. aureus-aligned UMIs assigned to E. coli cells after standard PETRI-seq alignment (edit distance ≤1). Reads mapping equally well to both species are discarded. Bottom: Scatterplots of E. coli UMIs vs. absolute (left) or percent (right) S. aureus UMIs assigned to each E. coli cell. Top: Cumulative distributions corresponding to scatterplots. (b) Quantification of E. coli-aligned UMIs assigned to S. aureus cells after standard alignment. Bottom: Scatterplots of S. aureus UMIs vs absolute (left) or percent (right) E. coli UMIs assigned to each S. aureus cell. Top: Cumulative distributions corresponding to scatterplots. (c) mRNAs per E. coli cell in (a). (d) mRNAs per S. aureus cell in (B). (e,f) Same analysis as (a,b) but using more stringent alignment (edit distance = 0) to better understand source of contamination. (g) mRNAs per E. coli cell in (E). (h) mRNAs per S. aureus cell in (F). (i,j) To further understand the impact of alignment on apparent cross-contamination, we used stringent alignment to map UMIs for a library of only E. coli (Experiment 1.10). Total UMIs (i) or percent of UMIs (j) assigned to S. aureus were determined after stringent alignment for a PETRI-seq library prepared with only E. coli. S. aureus UMIs are computational artifacts. E. coli cells include a mean of 0.02% S. aureus aligned UMIs, indicating that the majority of interspecies contamination observed in (e) is not caused by incorrect alignment. To quantify contamination, we needed to correct percentages of inter-species alignment based on species abundance in the library (25% of UMIs aligned to E. coli, 75% S. aureus) to predict the percent of UMIs in a given single-cell derived from any other cell (whether or not the same species). We predict a “corrected contamination rate”, or percent of UMIs in a single-cell transcriptome derived from another cell, of 0.19–0.36% (; ).
Extended Data Fig. 4. Further evaluation of PETRI-Seq for E. coli and S. aureus in Experiment 1.06SaEc.
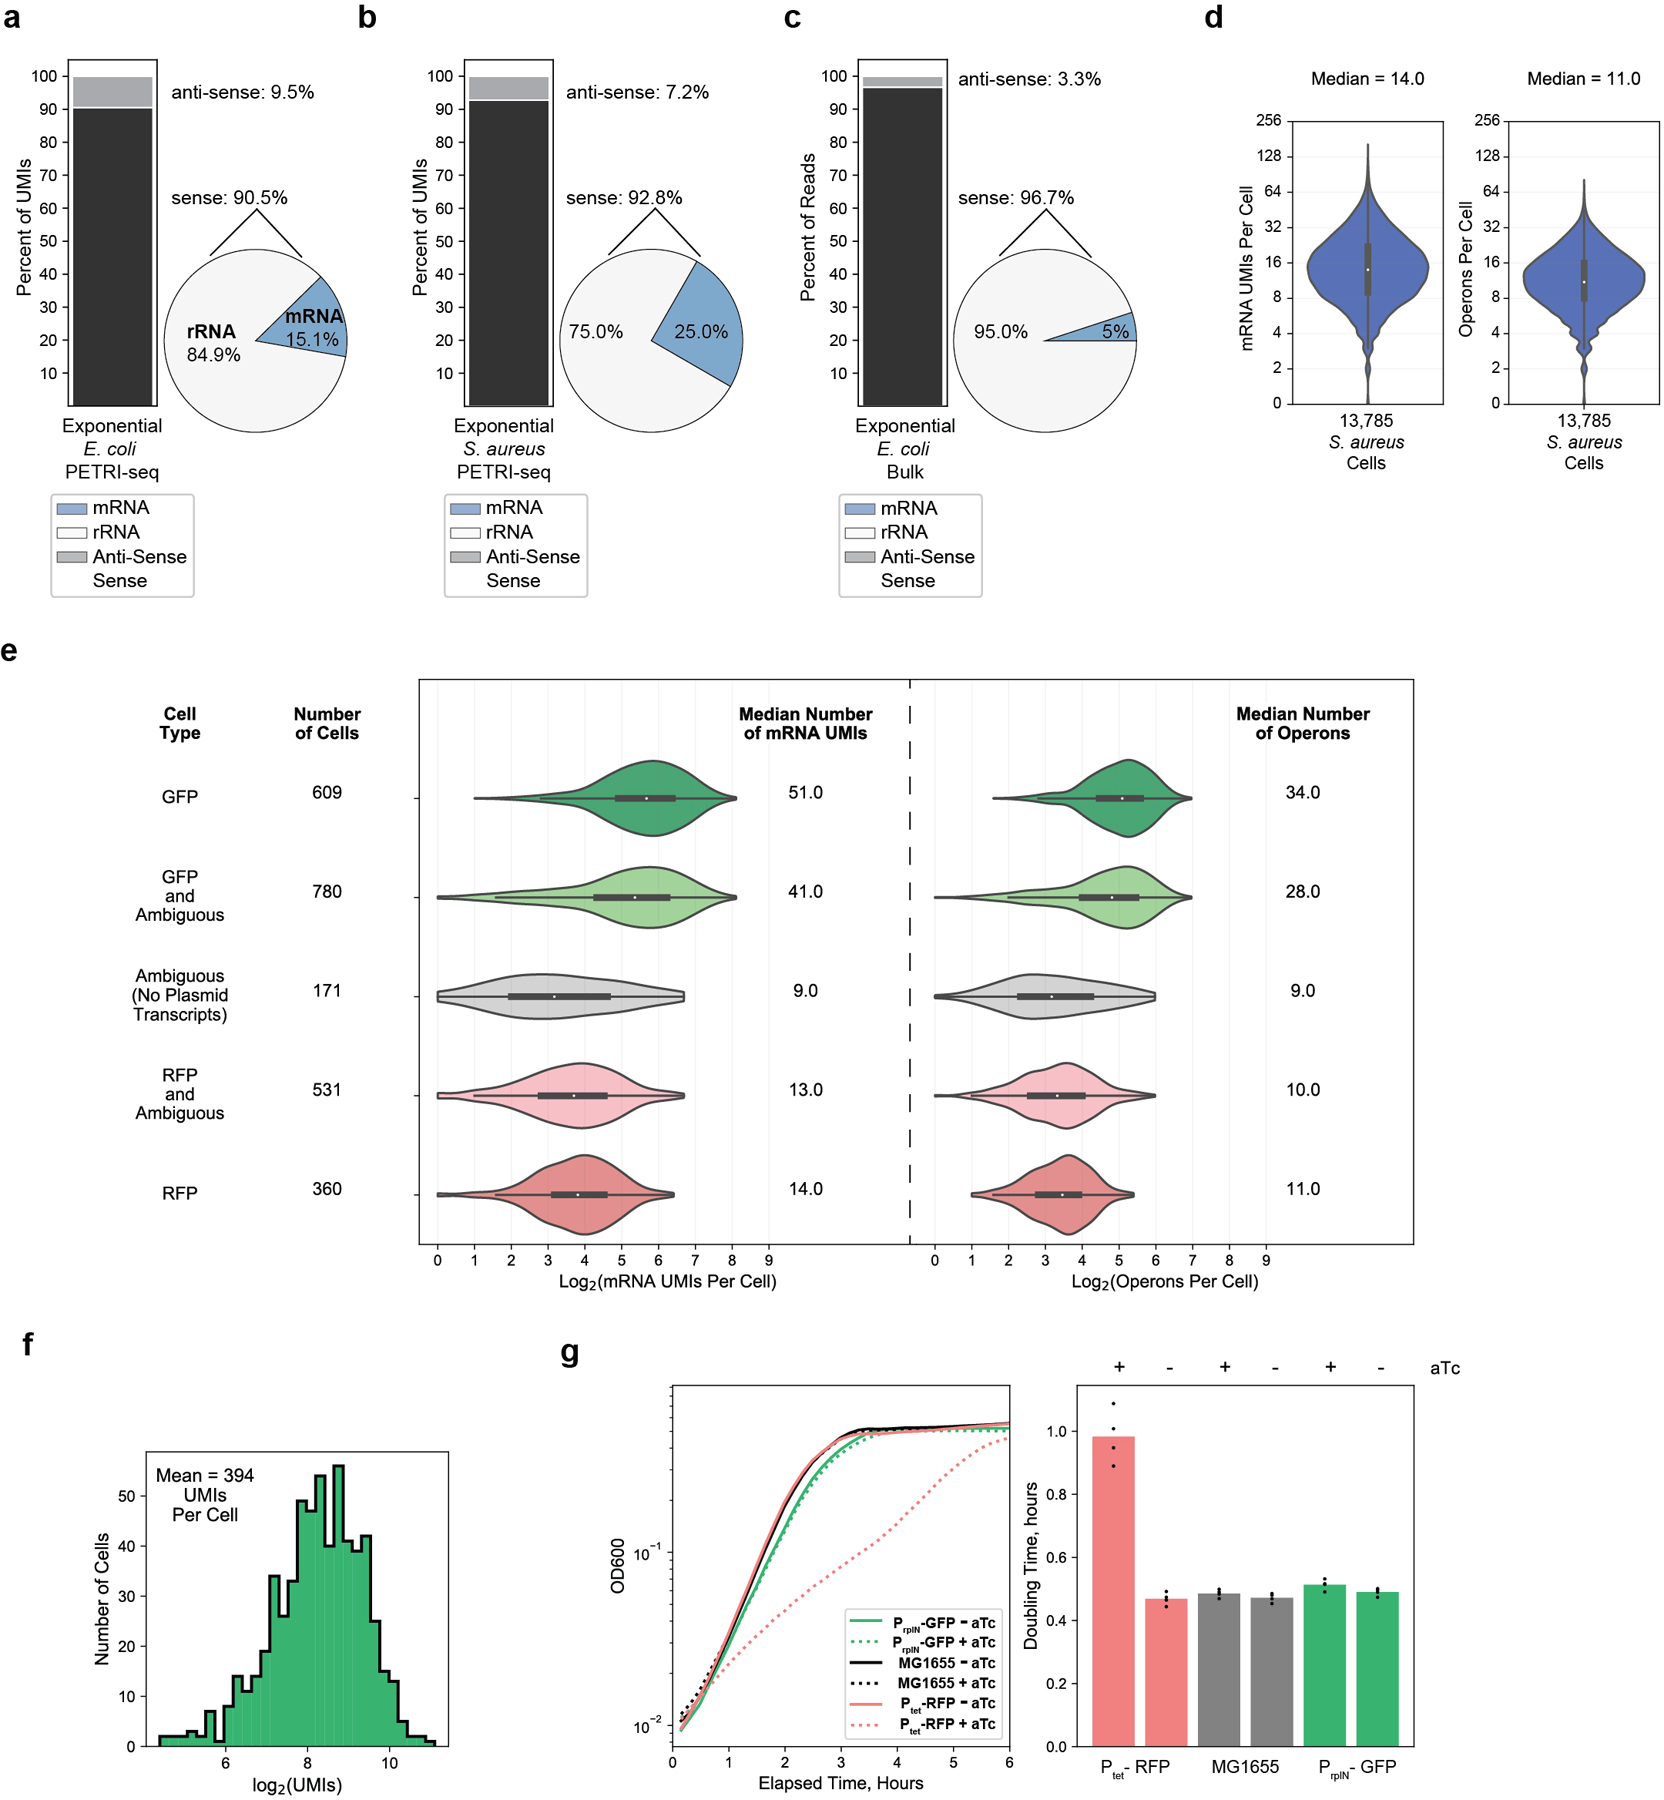
(a,b,c) Breakdown of total aligned UMIs (a,b) or reads (c) per cell for PETRI-seq exponential GFP- and RFP-expressing E. coli (a), PETRI-seq exponential S. aureus (b), and bulk exponential wild-type E. coli (c). Left: Stacked bar shows breakdown of sense and anti-sense alignments. Right: Pie shows breakdown of rRNA and mRNA alignments within the sense fraction. (d) Distributions of mRNA UMIs (left) and operons (right) per S. aureus cell. 13,785 cells are included. 2 cells were omitted as they contained zero mRNAs. Boxplots within violins show interquartile range (black box) and median (white circle). (e) Distributions of mRNA UMIs (left) and operons (right) per E. coli cell in five sub-populations, including GFP cells (contain GFP plasmid transcripts), RFP cells (contain RFP plasmid transcripts), ambiguous cells (contain no plasmid transcripts), and either RFP or GFP and ambiguous cells. Three ambiguous cells classified as E. coli in Fig. 2B were omitted as they contained zero mRNAs. Boxplots within violins show interquartile range (black box) and median (white circle). (f) Distribution of total RNAs per GFP-containing exponential E. coli cell. 609 cells are included. (g) Left, growth curves for PrplN-GFP, Ptet-RFP, and MG1655 (no plasmid) cells with and without aTc. Right, doubling times calculated from the growth curves. Ptet-RFP had a significantly longer doubling time than all other strains/conditions when induced with aTc (n=4, p=2.2 * 10−5, 2.5 * 10−5, 2.1 * 10−5, 3.6 * 10−5, 2.6 * 10−5 [for each sample moving left to right], 2-sided t-test), which might explain fewer mRNA UMIs in these cells.
Extended Data Fig. 5. Further evaluation of growth phase characterization by PETRI-seq.
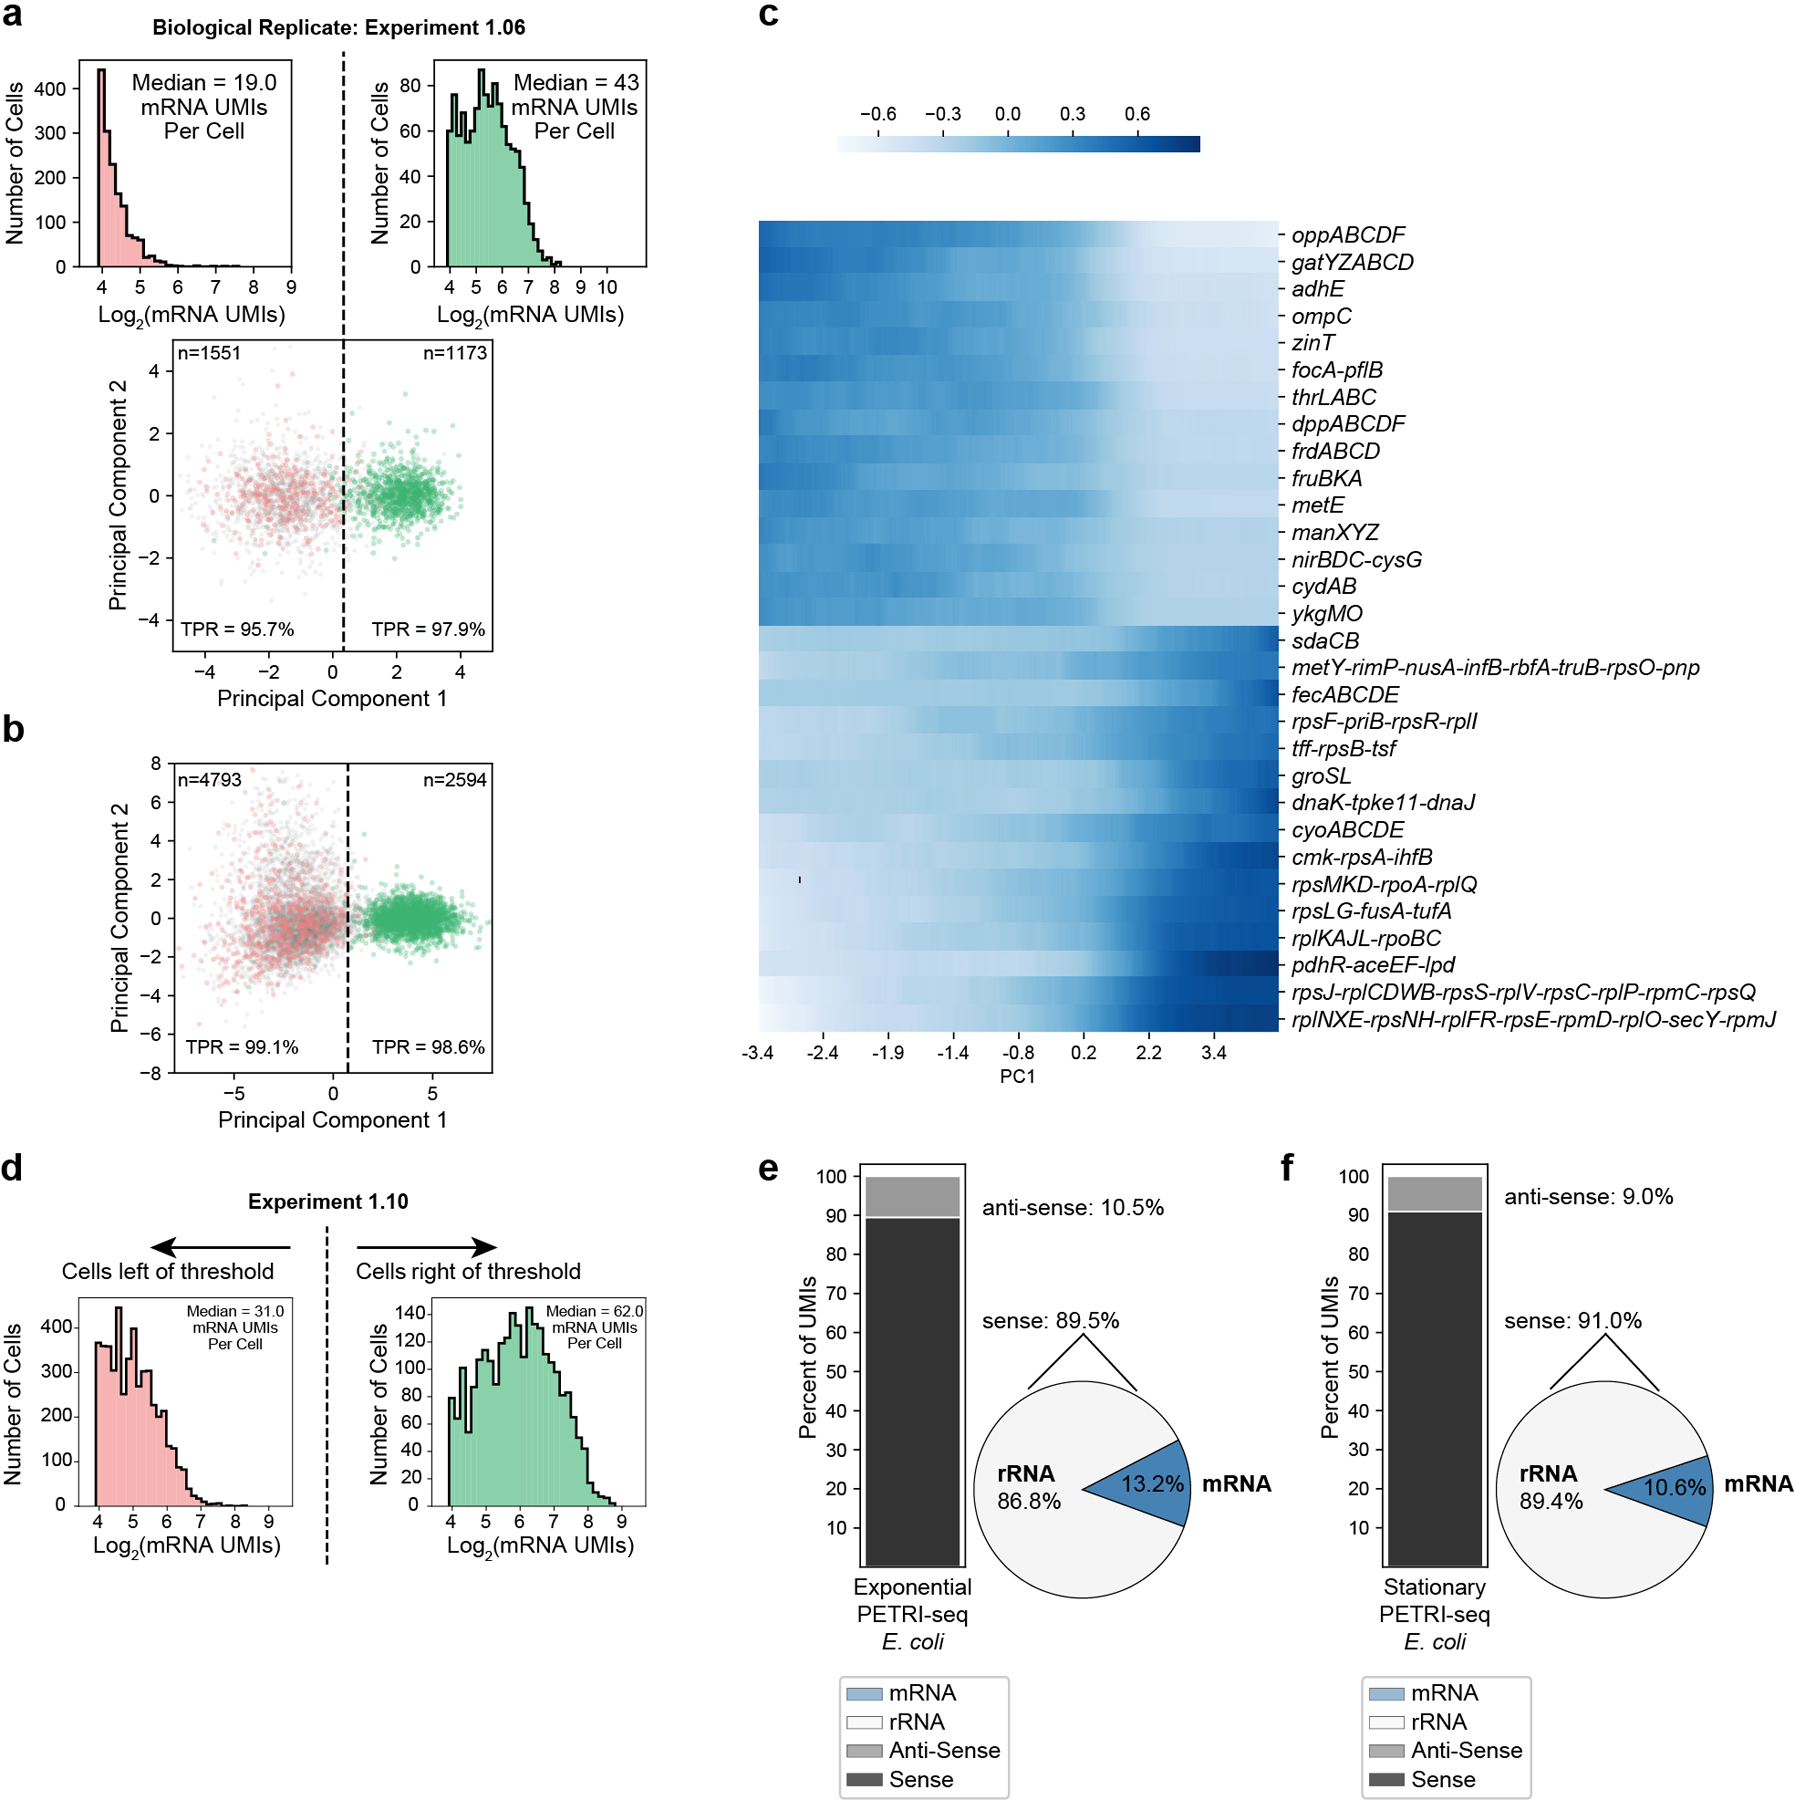
(a) PCA of Experiment 1.06 (biological replicate of 1.10) shows that PETRI-seq can reproducibly distinguish between stationary and exponential cells by projecting cells onto the principal components calculated from the first library (bottom). 2,724 cells are included. 1,551 cells are left of the threshold (PC1=0.34), and 1,173 cells are right of the threshold. mRNA UMIs captured per cell on either side of the threshold line are shown (top). (b) PCA as in Figure 3b, but UMI counts were normalized using sctransform26. (c) Expression along PC1 (Fig. 3b, Experiment 1.10) of operons with the most positive or negative PC1 loadings (z-scored moving average, size=1,000 cells). (d) Distribution of mRNA UMIs per cell (Experiment 1.10) on either side of the threshold line in Figure 3b. Grey cells (without plasmid UMIs) are included. Only cells with greater than 14 mRNA UMIs per cell were included, as cells with fewer were excluded from the PCA. 4,878 cells are left of the threshold, and 2,509 cells are right of the threshold. (e,f) Breakdown of total aligned UMIs per cell for Experiment 1.10 for cells above and below the PC1 threshold in Figure 3b. In (e), Exponential E. coli (above the threshold) are shown and in (f), stationary E. coli (below the threshold) are shown. Left: Stacked bar shows breakdown of sense and anti-sense alignments. Right: Pie shows breakdown of rRNA and mRNA alignments within the sense fraction.
Extended Data Fig. 6. Additional optimization of PETRI-seq by increasing ligation primer concentration and adding detergent during barcoding.
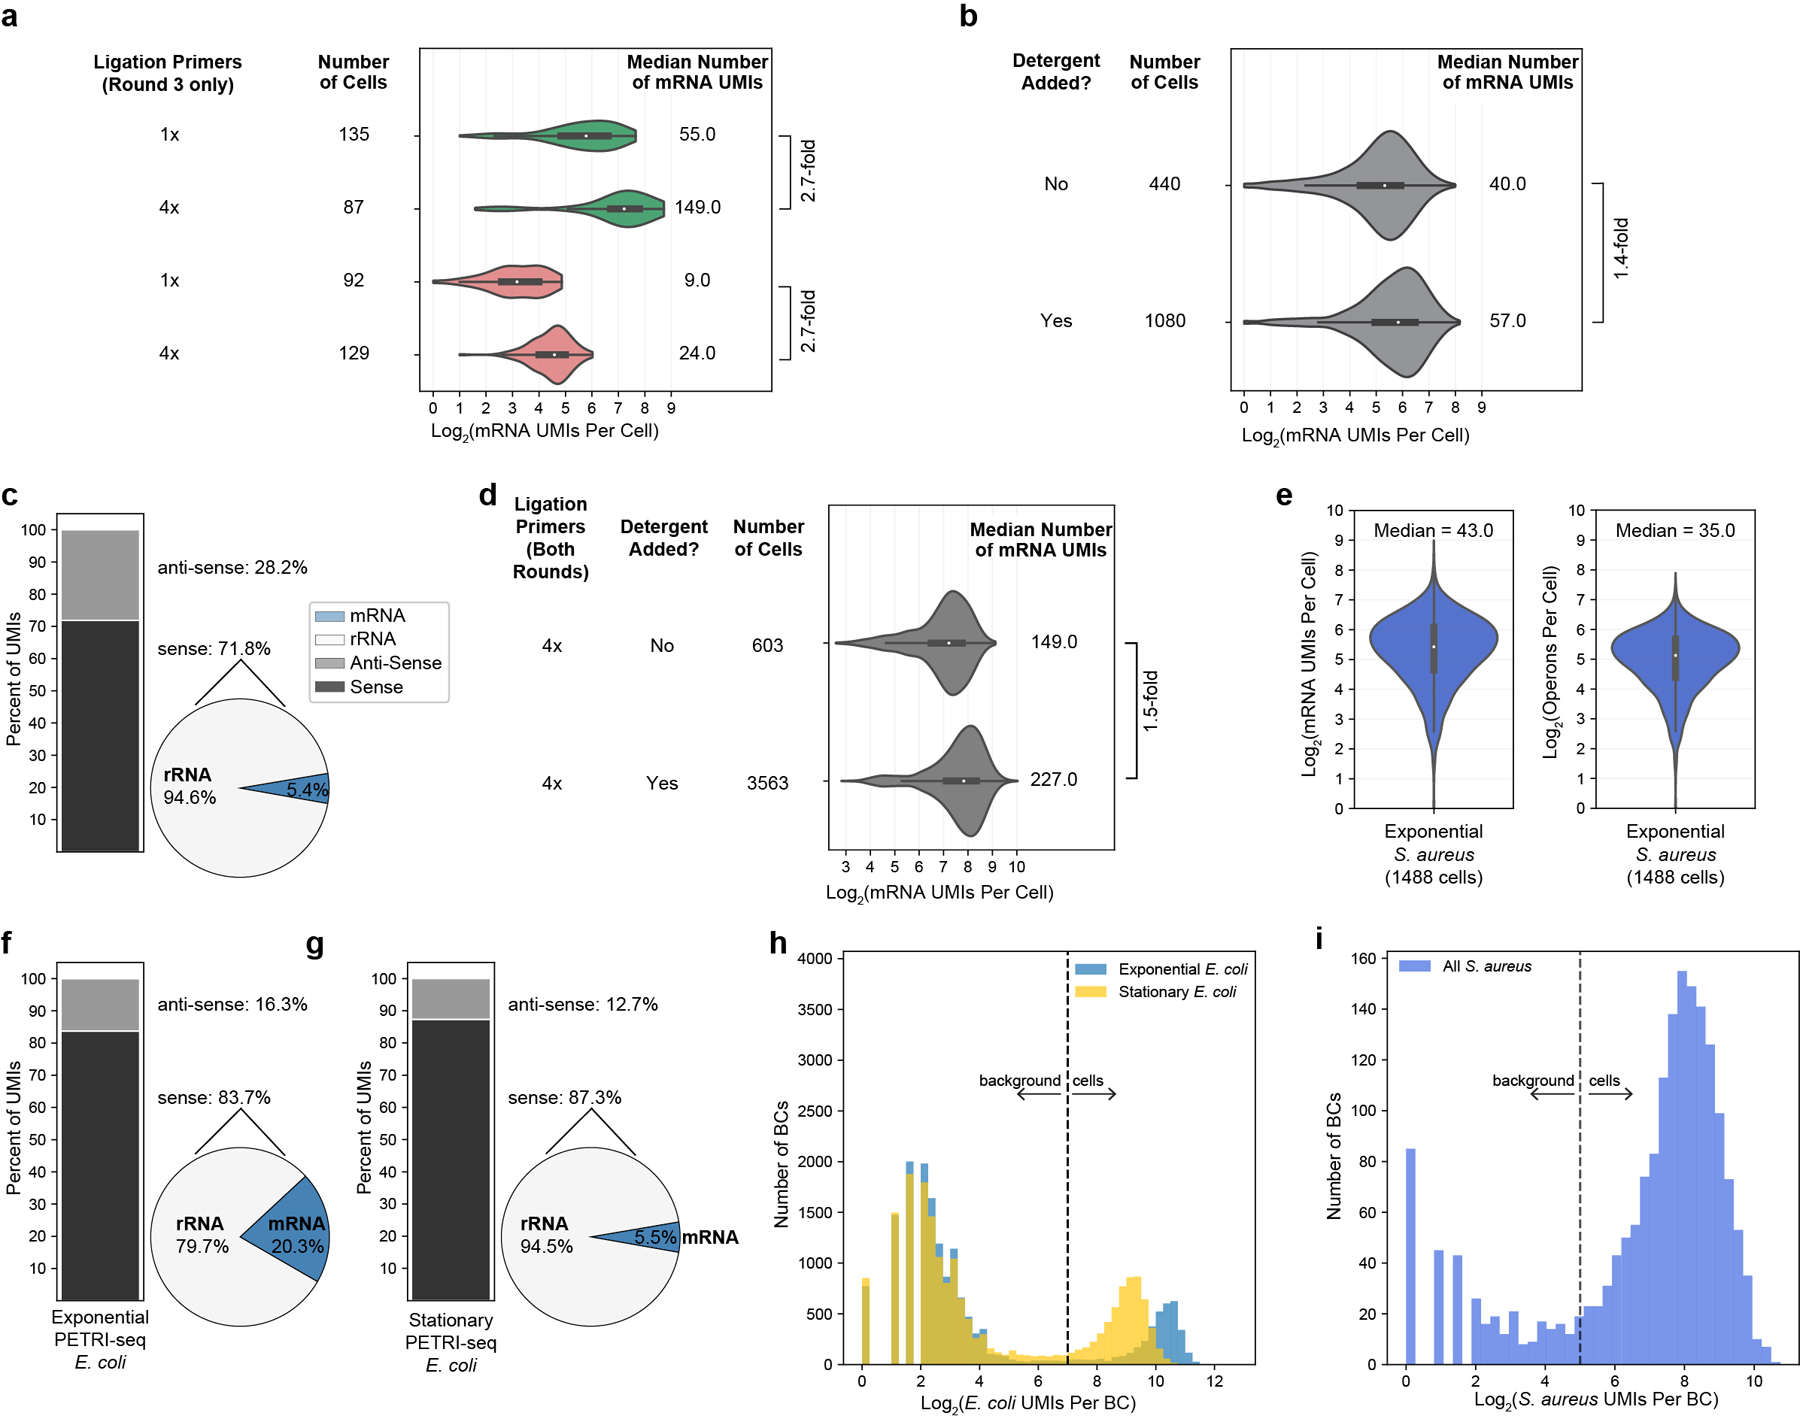
(a) Increasing the concentration of round 3 ligation primers by 4× relative to previous experiments (1.06SaEc and 1.10) increases mRNA UMIs per cell 2.7-fold for GFP-expressing exponential (green) and RFP-expressing stationary E. coli cells (red). Boxplots within violins show interquartile range (black box) and median (white circle). (b) Adding detergent (tween-20) to cells before ligation 1 and after ligation 3 increased mRNA UMIs per cell 1.4-fold relative to original PETRI-seq for wild-type exponential E. coli cells. Boxplots within violins show interquartile range (black box) and median (white circle). (c) With 10× more RT primer relative to original PETRI-seq, we observed a shift in the breakdown of sense/anti-sense and mRNA/rRNA UMIs. Left: Stacked bar shows breakdown of sense and anti-sense alignments. Right: Pie shows breakdown of rRNA and mRNA alignments within the sense fraction. Proportions of anti-sense RNAs and sense rRNAs are significantly increased. We hypothesized that any condition effectively increasing the intracellular concentration of RT primers could lead to this undesirable shift. For this reason, detergent was only ever added after RT to avoid further permeabilizing cells and increasing the effective concentration of RT primer. (d) Combining detergent treatment and increased ligation primer (for both rounds) resulted in higher mRNA capture for wild-type exponential E. coli cells. Detergent again increased mRNA UMIs per cell (1.5-fold). Boxplots within violins show interquartile range (black box) and median (white circle). (e) Optimized PETRI-seq (4× ligation primer, detergent treatment) resulted in S. aureus transcriptomes with a median of 43 mRNA UMIs per cell (left) and 35 operons per cell (right). Boxplots within violins show interquartile range (black box) and median (white circle). (f,g) Breakdown of total aligned UMIs per cell for optimized PETRI-seq (Experiment 2.01) for exponential (f) and stationary E. coli (g). Left: Stacked bar shows breakdown of sense and anti-sense alignments. Right: Pie shows breakdown of sense rRNA and mRNA alignments. (h,i) Distributions of total UMIs per E. coli (H) and S. aureus (I) BCs in Experiment 2.01. Given higher capture, we imposed higher thresholds for distinguishing cells from background than used previously (Extended Data Fig. 1i). E. coli BCs with more than 128 total UMIs (threshold line in h) and S. aureus BCs with more than 32 total UMIs (threshold line in i) were considered cells.
Extended Data Fig. 7. Multiplet frequency and intercellular contamination for optimized PETRI-seq.
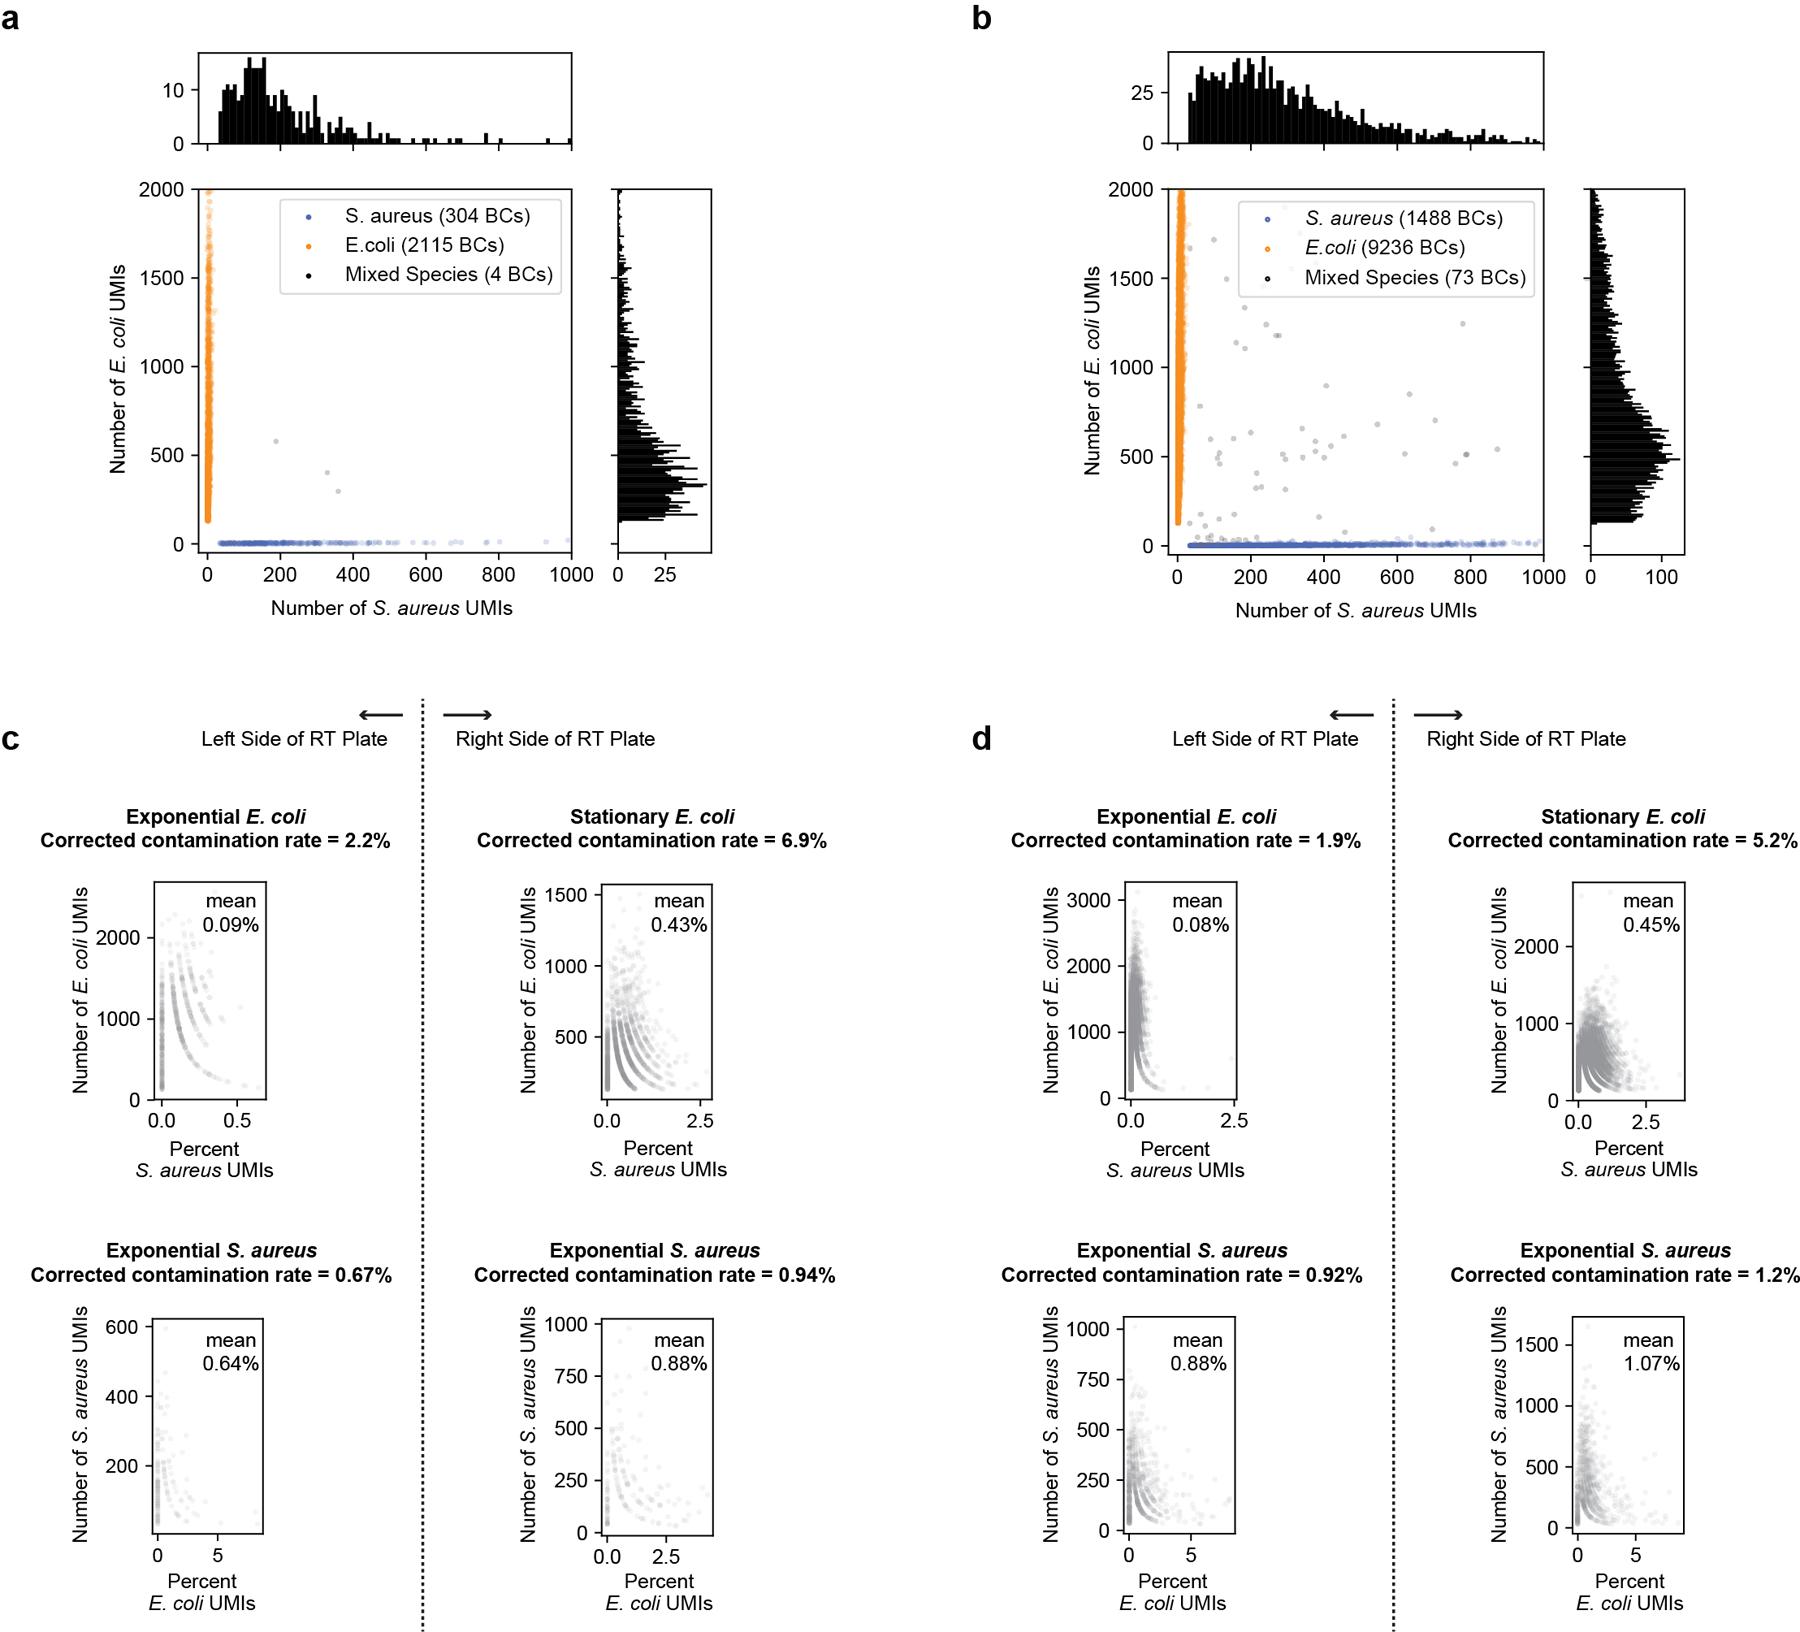
(a) Species mixing plot for PETRI-seq with 4× ligation primers and no detergent. The multiplet frequency is 0.7%, which is 5-fold higher than the Poisson expectation of 0.14% for 2,423 BCs. (b) Species mixing plot for PETRI-seq with 4× ligation primers and detergent (Experiment 2.01). The multiplet frequency is 2.8%, which is 4.7-fold higher than the Poisson expectation of 0.6% for 10,797 BCs. This indicates that compared to no detergent, detergent treatment did not significantly increase multiplet frequency relative to the Poisson expectation. In (a,b), E. coli BCs with > 128 total UMIs and S. aureus BCs with > 32 total UMIs were included. (c,d) Quantification of cross-contamination for PETRI-seq with 4× ligation primers and no detergent (c, same experiment as a) or 4× ligation primers and detergent (d, Experiment 2.01 as in b). Scatterplots show the percent of total UMIs for each cell aligned to the incorrect species. Reads were aligned using the stringent alignment (edit distance = 0) described in Extended Data Fig. 3. Top left: Percent of S. aureus UMIs in exponential E. coli cells (based on first round barcode). Top right: Percent of S. aureus UMIs in stationary E. coli cells (based on first round barcode). Bottom left: Percent of E. coli UMIs in S. aureus cells barcoded with exponential E. coli (based on first round barcode). Bottom right: Percent of E. coli UMIs per S. aureus cell barcoded with stationary E. coli (based on first round barcode). As described in Extended Data Fig. 3, we used these inter-species contamination rates to predict a corrected contamination rate (including intra-species contamination). Though higher than the contamination rates observed in the previous species mixing experiment (Extended Data Fig. 3e,f), these rates are comparable to previous findings for eukaryotic scRNA-seq methods23,24 and are not affected by detergent treatment (c vs. d). Furthermore, we anticipate that contamination could be reduced by additional washing prior to cell lysis (see “Future directions for optimization” in Methods).
Extended Data Fig. 8. Comparison of plasmid-labeled (Experiment 1.10) and RT-labeled (Experiment 2.01) mixed growth stage libraries reveals minimal cross-contamination between E. coli cells barcoded together.
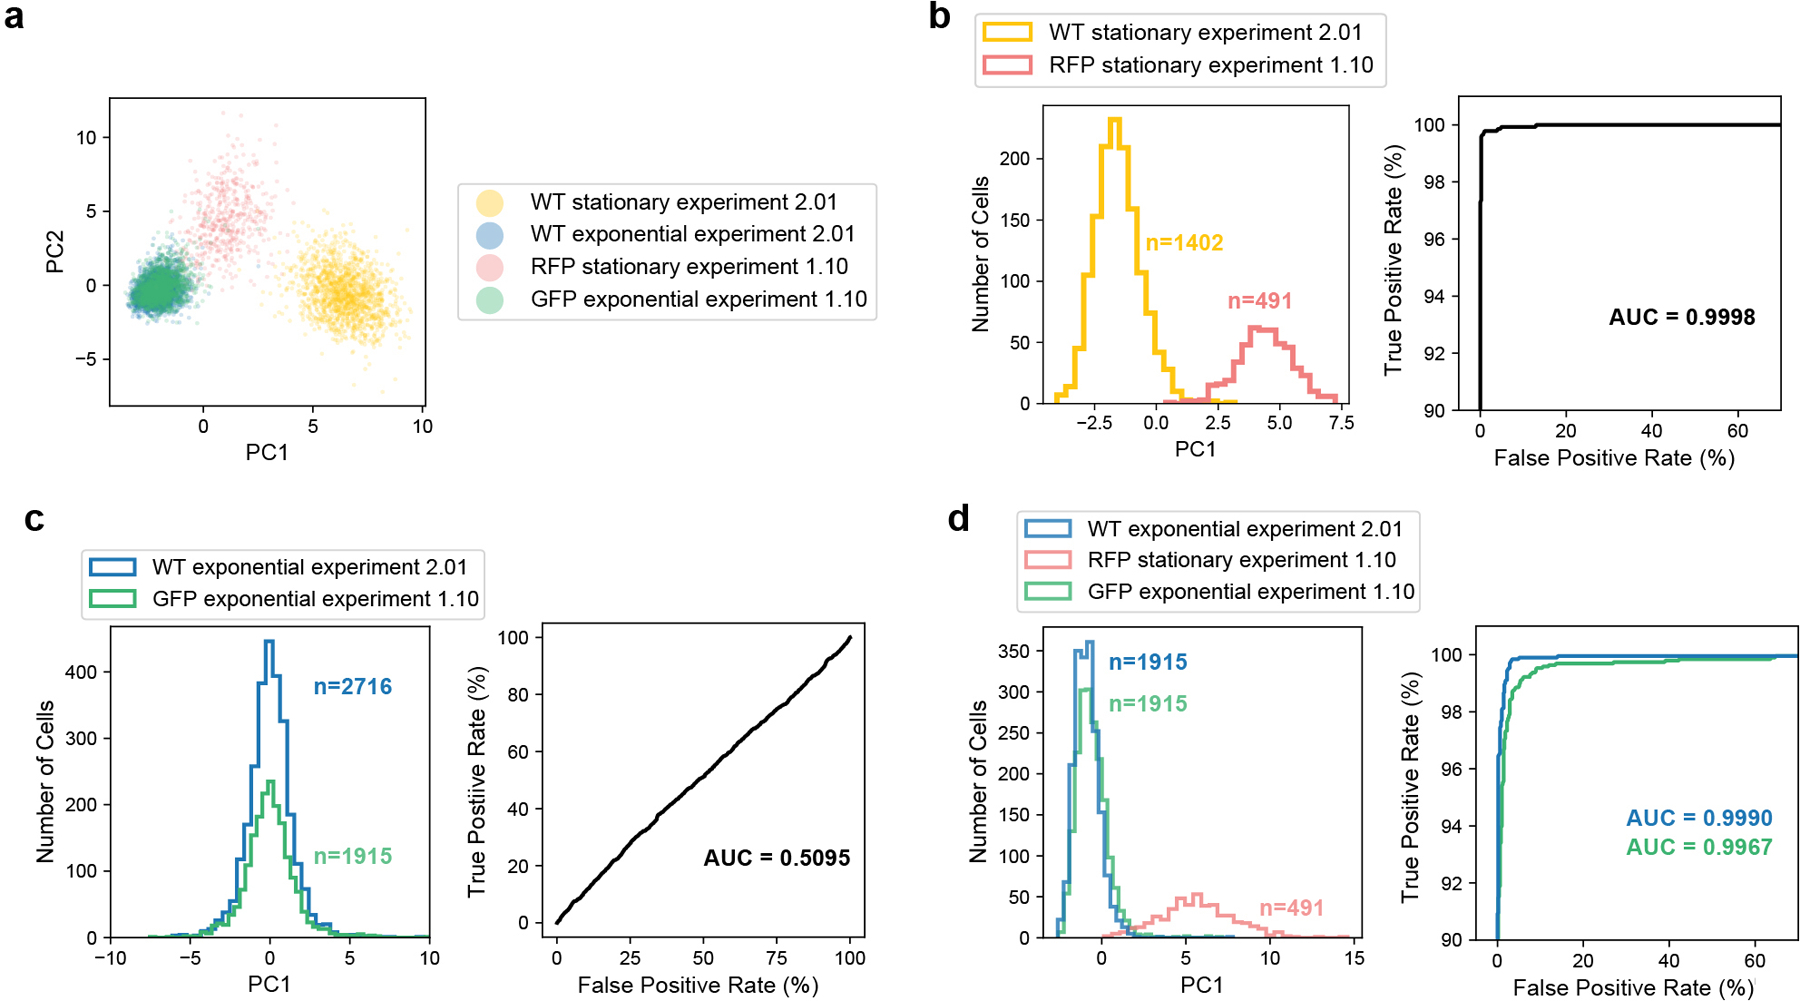
In Experiment 2.01, exponential and stationary cells were prepared separately and then barcoded independently during RT. In contrast, the RFP-expressing stationary cells and GFP-expressing exponential cells barcoded in Experiment 1.10 were combined for fixation and barcoded together, resulting in more opportunity for cross-contamination. Experiment 2.01 is thus a useful reference to quantify this cross-contamination. To account for differences in the capture efficiency for the two experiments, cells were down-sampled to 30 mRNA UMIs. (a) PCA for all 4 cell types reveals that the two stationary populations are biologically distinct, possibly because they were grown independently to slightly different ODs, and RFP cells were induced with aTc. In contrast, the two exponential populations appear very similar. (b) PC1 was calculated using only the stationary cells from both experiments. Right: The receiver operating characteristic (ROC) shows that PC1 is a strong classifier of the two states. (c) PC1 was calculated using only exponential cells from both experiments. Right: The ROC shows that PC1 is a weak classifier of the two exponential states with performance similar to random assignment (Area Under the ROC Curve [AUC]=0.5). (d) PC1 was calculated using wild-type exponential cells from Experiment 2.01, GFP-expressing exponential cells from Experiment 1.10, and RFP-expressing stationary cells from Experiment 1.10 in order to quantify cross-contamination between the GFP and RFP cells using the wild-type exponential cells from Experiment 2.01 as a reference. Right: ROC shows that PC1 is a strong classifier of exponential and stationary cells. The probability that the PC1 value of a wild-type exponential cell is lower than the PC1 value of a stationary RFP cell is 99.9% (AUC = 0.999), while the probability that the PC1 value of a GFP exponential cell is lower than the PC1 value of a stationary RFP cell is 99.67% (AUC = 0.9967). Thus, for the GFP exponential cells, 23 out of 10,000 cell pairs (1 exponential, 1 stationary) will be incorrectly ranked due to cross-contamination in the GFP cells. Finally, we confirmed that in the original library for Experiment 1.10, the relative representation of UMIs from exponential and stationary cells were roughly equal (50.3% stationary, 45.6% exponential), indicating that the cross-contamination analysis for the GFP exponential population would be reciprocal for the RFP stationary population.
Extended Data Fig. 9. Defining consensus transcriptional states of sub-populations by aggregating single-cell transcriptomes.
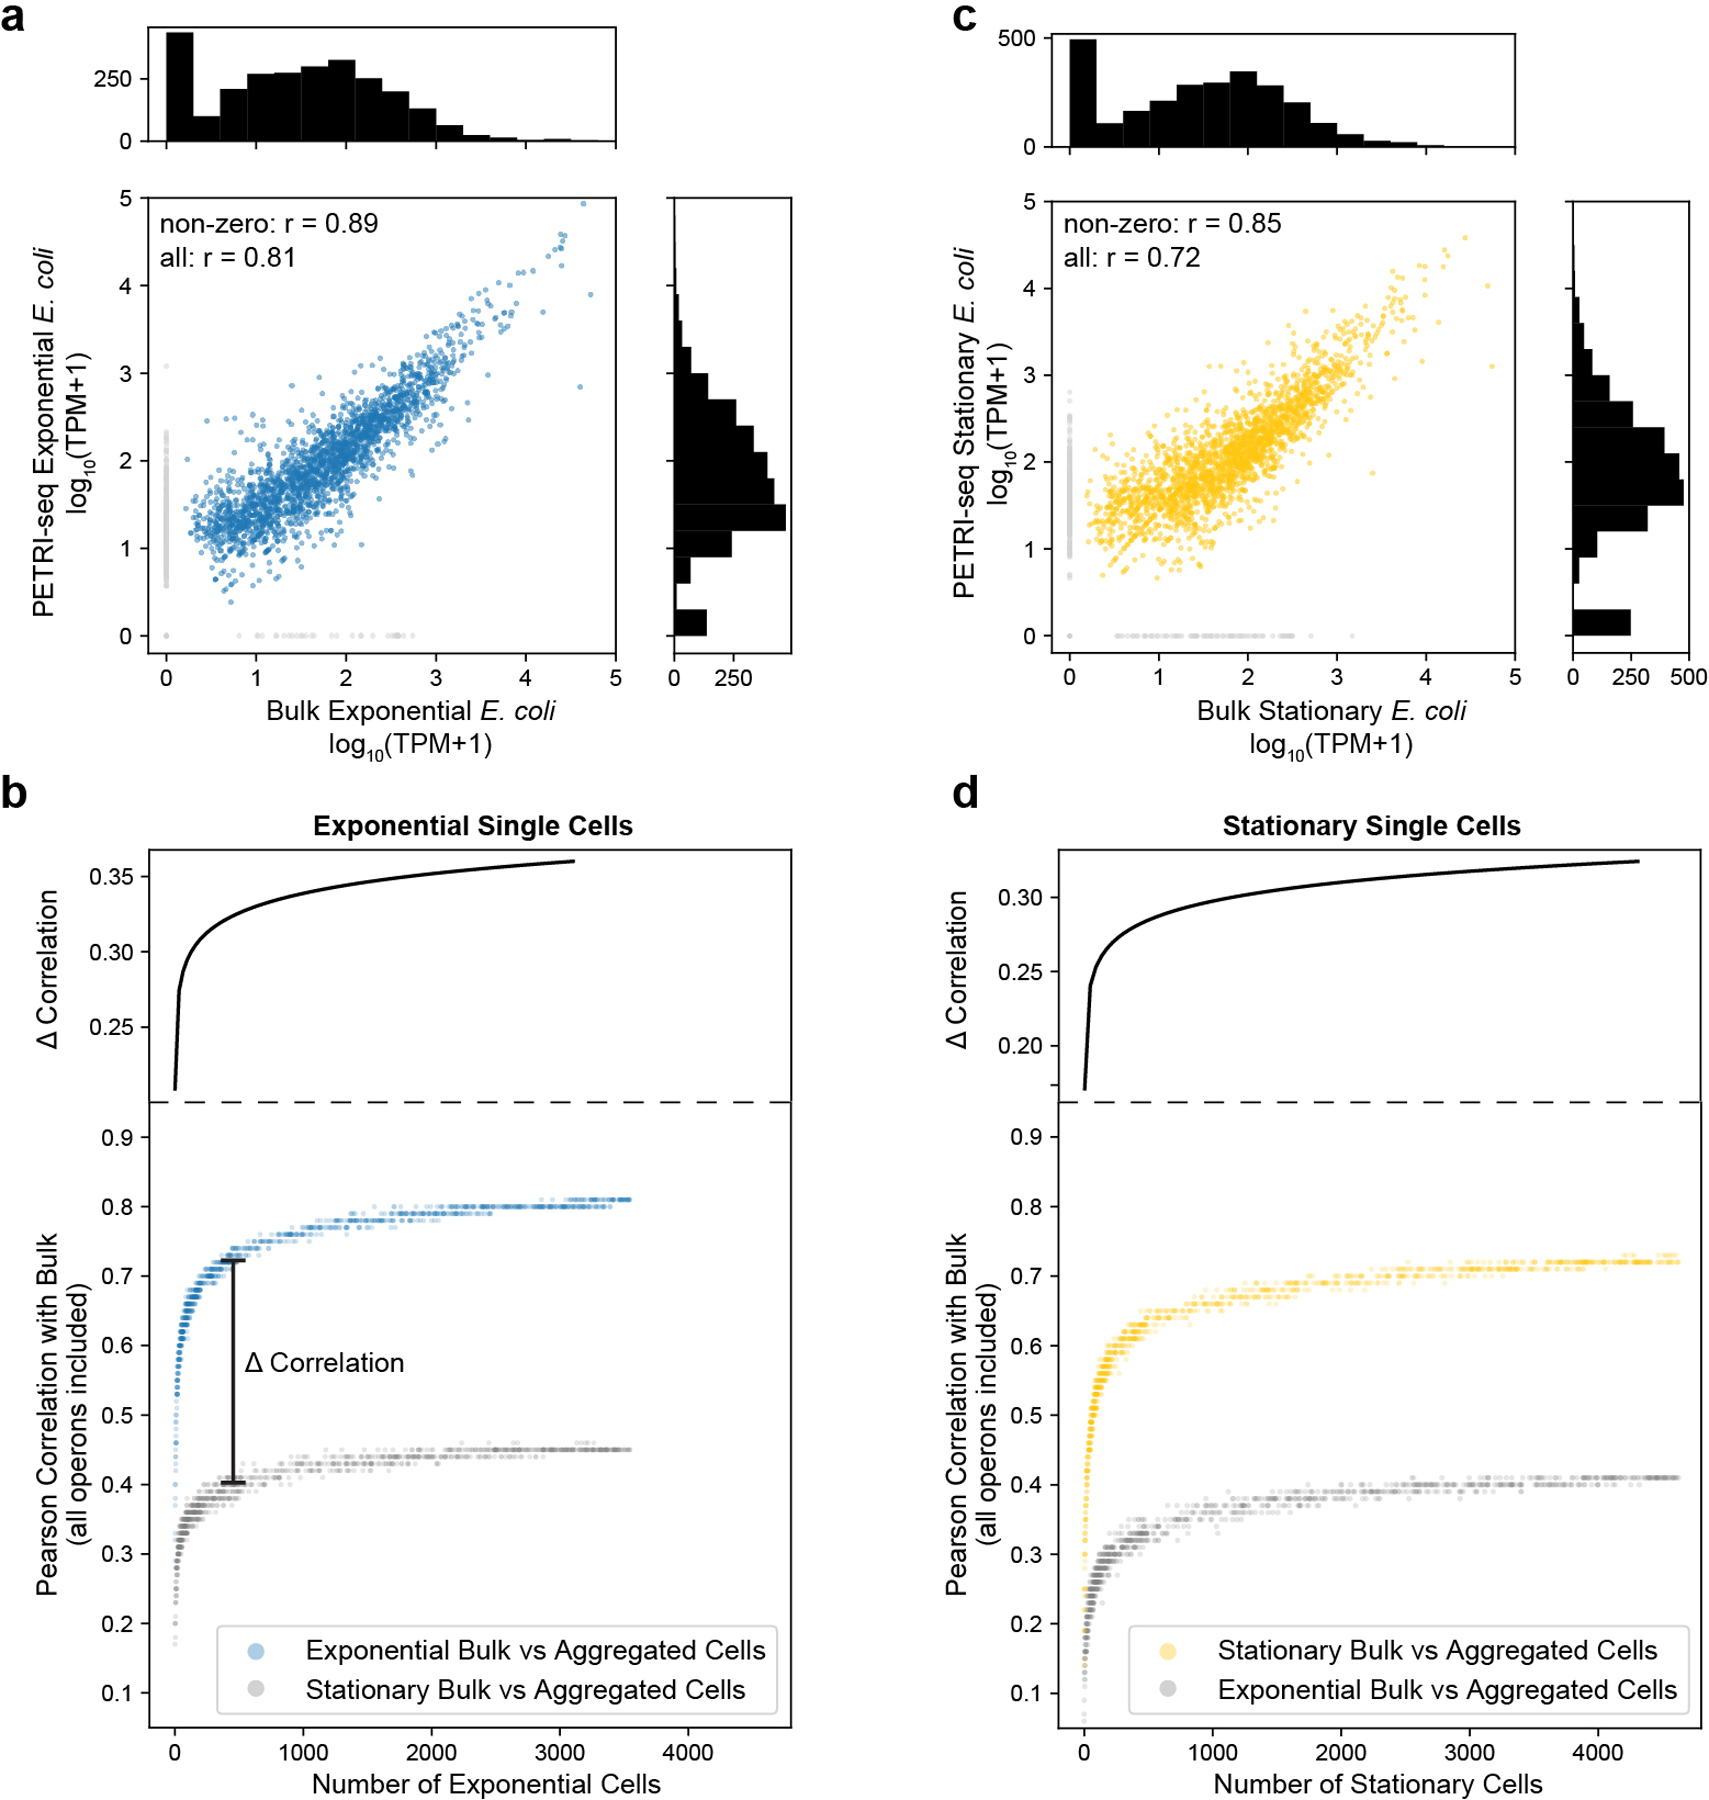
(a) Correlation between mRNA abundances from 3,547 aggregated wild-type exponential cells (Experiment 2.01) vs. bulk preparation from fixed exponential wild-type E. coli cells. The Pearson correlation coefficient (r) was calculated for 2,150 out of 2,612 total operons, excluding those with zero counts in either library (grey points), or for all 2,612 operons. Bulk library was prepared from the same cells as the PETRI-seq library. (b) Bottom: The correlation between the aggregated mRNA counts of single exponential cells (PETRI-seq) and the bulk exponential library increases as more single cells are included. Correlations were calculated from log10(TPM+1) for each sample. Top: Difference between top curve and bottom curve in plot below, based on best-fit lines (y = ln(x) + b, r > 0.98). (c) Correlation between RNA abundances from 4,627 aggregated wild-type stationary cells (Experiment 2.01) vs. bulk preparation from fixed wild-type stationary E. coli cells. The Pearson correlation coefficient (r) was calculated for 2,050 out of 2,612 total operons, excluding those with zero counts in either library (grey points), or for all 2,612 operons. Bulk library was prepared from the same cells as the PETRI-seq library. (d) Bottom: The correlation between the aggregated mRNA counts of single stationary cells (PETRI-seq) and the bulk stationary library increases as more single cells are included. Correlations were calculated from log10(TPM+1) for each sample. Top: Difference between top curve and bottom curve in plot below, based on best-fit lines (y = ln(x) + b, r > 0.98).
Extended Data Fig. 10. PETRI-seq detects rare transcriptional states and candidate genes with highly variable expression.
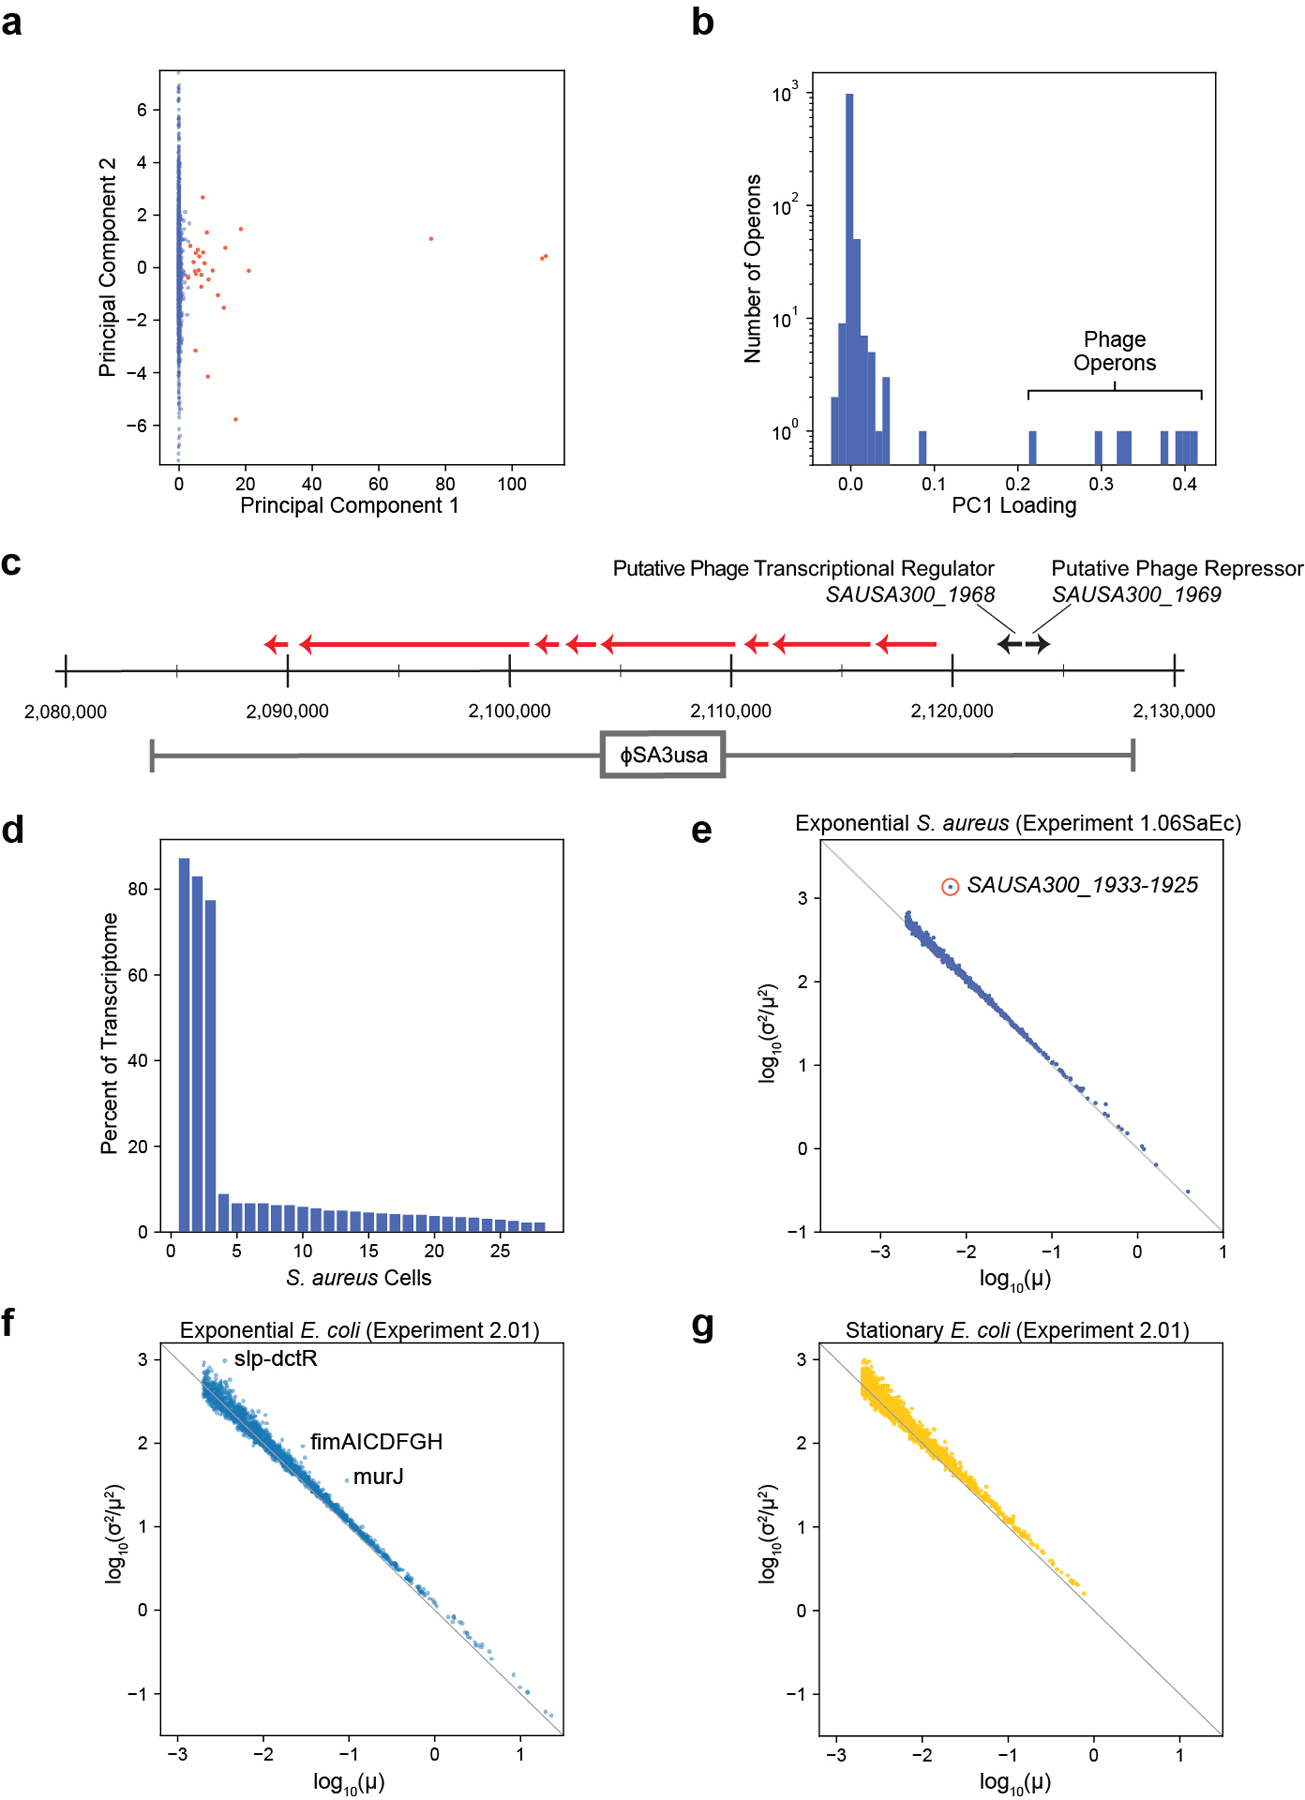
(a) PCA detects rare transcriptional states among 6,663 S. aureus cells. A small sub-population of 28 cells (red) expressed operons from the φSA3usa phage. (b) Distribution of PC1 loadings for all operons included in the S. aureus analysis. Eight operons from the φSA3usa phage have the highest PC1 loadings. (c) Map of genomic region33 surrounding φSA3usa in the genome of S. aureus strain USA300. Red arrows indicate phage operons upregulated along PC1. (d) Percent of mRNA UMIs mapped to the φSA3usa phage for the 28 cells containing phage UMIs. Three cells are composed of >77% phage transcripts. (e) Noise () versus mean () for operon expression within an S. aureus population of 6,663 cells. 676 operons are included. The circled operon (red) is SAUSA300_1933–1925, which deviated significantly from the rest of the distribution (z-score = 20.6 [determined by residuals from linear regression (see methods)], p = 10−94, FDR < 0.01). (f,g) Noise () versus mean () for operon expression in either exponential (f) or stationary (g) E. coli populations from Experiment 2.01. 1,960 operons are included in (f) and 1,219 operons in (g). Five operons significantly (FDR < 0.01, z-scores determined by residuals from linear regression [see methods]) deviated from the other operons in (f): sip-dctR (z-score = 7.3, p = 3*10−13), murJ (z-score = 6.7, p = 3*10−11, fimAICDFGH (z-score = 5.4, p = 7*10−8), mdtL (z-score = 4.8, p = 1*10−6), rnhA (z-score = 4.6, p = 4*10−6). fimAICDFGH, which encodes the type I fimbriae system, has been shown previously to exhibit population-level phase variation that is mediated by transcriptional control37. In (e-g), lines at y = −x indicate Poisson noise where . Operon counts were normalized for each cell before plotting. Operons with fewer than 6 raw total UMIs and a mean less than 0.002 after normalization were excluded.
Supplementary Material
Acknowledgements
We thank the Tavazoie laboratory for helpful discussions and comments on early drafts of the manuscript. We appreciate helpful suggestions from Peter Sims during the early development of PETRI-seq. ST is supported by award 5R01AI077562 from NIH. SB is supported by an NSF Graduate Research Fellowship (DGE 16–44869). WJ is supported by a fellowship from the Jane Coffin Childs Fund.
Footnotes
Code Availability
Relevant code for this manuscript is available upon request, and/or see https://tavazoielab.c2b2.columbia.edu/PETRI-seq/ for current PETRI-seq code and protocols.
Competing Interests
The authors declare no competing interests.
Data Availability
Raw data has been submitted to the Gene Expression Omnibus (GEO) under accession number GSE141018. Source data is also provided for all figures. All figures except Figure 1 include original data. An overview of all of the experiments can be found in Supplementary Table 4. A count matrix for the three primary PETRI-seq experiments is provided as Supplementary Table 6.
References
- 1.Tang F. et al. mRNA-Seq whole-transcriptome analysis of a single cell. Nat Methods 6, 377–382, doi: 10.1038/nmeth.1315 (2009). [DOI] [PubMed] [Google Scholar]
- 2.Ramsköld D. et al. Full-length mRNA-Seq from single-cell levels of RNA and individual circulating tumor cells. Nat Biotechnol 30, 777–782, doi: 10.1038/nbt.2282 (2012). [DOI] [PMC free article] [PubMed] [Google Scholar]
- 3.Picelli S. et al. Smart-seq2 for sensitive full-length transcriptome profiling in single cells. Nat Methods 10, 1096–1098, doi: 10.1038/nmeth.2639 (2013). [DOI] [PubMed] [Google Scholar]
- 4.Fan HC, Fu GK & Fodor SPA Expression profiling. Combinatorial labeling of single cells for gene expression cytometry. Science 347, 1258367, doi: 10.1126/science.1258367 (2015). [DOI] [PubMed] [Google Scholar]
- 5.Macosko EZ et al. Highly Parallel Genome-wide Expression Profiling of Individual Cells Using Nanoliter Droplets. Cell 161, 1202–1214, doi: 10.1016/j.cell.2015.05.002 (2015). [DOI] [PMC free article] [PubMed] [Google Scholar]
- 6.Klein AM et al. Droplet barcoding for single-cell transcriptomics applied to embryonic stem cells. Cell 161, 1187–1201, doi: 10.1016/j.cell.2015.04.044 (2015). [DOI] [PMC free article] [PubMed] [Google Scholar]
- 7.Bose S. et al. Scalable microfluidics for single-cell RNA printing and sequencing. Genome Biol 16, 120, doi: 10.1186/s13059-015-0684-3 (2015). [DOI] [PMC free article] [PubMed] [Google Scholar]
- 8.Zheng GX et al. Massively parallel digital transcriptional profiling of single cells. Nat Commun 8, 14049, doi: 10.1038/ncomms14049 (2017). [DOI] [PMC free article] [PubMed] [Google Scholar]
- 9.Picelli S Single-cell RNA-sequencing: The future of genome biology is now. Rna Biol 14, 1–14, doi: 10.1080/15476286.2016.1201618 (2016). [DOI] [PMC free article] [PubMed] [Google Scholar]
- 10.Sheng K, Cao W, Niu Y, Deng Q & Zong C Effective detection of variation in single-cell transcriptomes using MATQ-seq. Nature Methods 14, 267–270, doi: 10.1038/nmeth.4145 (2017). [DOI] [PubMed] [Google Scholar]
- 11.Cao J. et al. Comprehensive single-cell transcriptional profiling of a multicellular organism. Science 357, 661–667, doi: 10.1126/science.aam8940 (2017). [DOI] [PMC free article] [PubMed] [Google Scholar]
- 12.Rosenberg AB et al. Single-cell profiling of the developing mouse brain and spinal cord with split-pool barcoding. Science 360, 176–182, doi: 10.1126/science.aam8999 (2018). [DOI] [PMC free article] [PubMed] [Google Scholar]
- 13.Cao J. et al. The single-cell transcriptional landscape of mammalian organogenesis. Nature 566, 496–502, doi: 10.1038/s41586-019-0969-x. (2019). [DOI] [PMC free article] [PubMed] [Google Scholar]
- 14.Taniguchi Y. et al. Quantifying E. coli proteome and transcriptome with single-molecule sensitivity in single cells. Science 329, 533–538, doi: 10.1126/science.1188308 (2010). [DOI] [PMC free article] [PubMed] [Google Scholar]
- 15.Bartholomäus A. et al. Bacteria differently regulate mRNA abundance to specifically respond to various stresses. Philos T R Soc A 374, doi: 10.1098/rsta.2015.0069 (2016). [DOI] [PubMed] [Google Scholar]
- 16.Moran MA et al. Sizing up metatranscriptomics. Isme J 7, 237–243, doi: 10.1038/ismej.2012.94 (2013). [DOI] [PMC free article] [PubMed] [Google Scholar]
- 17.de Lange N, Tran TM & Abate AR Electrical lysis of cells for detergent-free droplet assays. Biomicrofluidics 10, 024114, doi: 10.1063/1.4944742 (2016). [DOI] [PMC free article] [PubMed] [Google Scholar]
- 18.Amini S. et al. Haplotype-resolved whole-genome sequencing by contiguity-preserving transposition and combinatorial indexing. Nat Genetics 46, 1343–1349, doi: 10.1038/ng.3119 (2014). [DOI] [PMC free article] [PubMed] [Google Scholar]
- 19.Hodson RE, Dustman WA, Garg RP & Moran MA In situ PCR for visualization of microscale distribution of specific genes and gene products in prokaryotic communities. Appl Environ Microbiol 61, 4074–4082 (1995). [DOI] [PMC free article] [PubMed] [Google Scholar]
- 20.Bloom JD Estimating the frequency of multiplets in single-cell RNA sequencing from cell-mixing experiments. PeerJ 6, e5578, doi: 10.7717/peerj.5578 (2018). [DOI] [PMC free article] [PubMed] [Google Scholar]
- 21.Okayama H & Berg P High-efficiency cloning of full-length cDNA. Mol Cell Biol 2, 161–170, doi: 10.1128/mcb.2.2.161 (1982). [DOI] [PMC free article] [PubMed] [Google Scholar]
- 22.Kivioja T. et al. Counting absolute number of molecules using unique molecular identifiers. Nat Précéd, doi: 10.1038/npre.2011.5903.1 (2011). [DOI] [PubMed]
- 23.Yang S. et al. Decontamination of ambient RNA in single-cell RNA-seq with DecontX. Biorxiv, 704015, doi: 10.1101/704015 (2019). [DOI] [PMC free article] [PubMed] [Google Scholar]
- 24.Young MD & Behjati S SoupX removes ambient RNA contamination from droplet based single-cell RNA sequencing data. Biorxiv, 303727, doi: 10.1101/303727 (2020). [DOI] [PMC free article] [PubMed] [Google Scholar]
- 25.Hotelling H Analysis of a complex of statistical variables into principal components. J Educ Psychol 24, 417–441, doi: 10.1037/h0071325 (1933). [DOI] [Google Scholar]
- 26.Hafemeister C & Satija R Normalization and variance stabilization of single-cell RNA-seq data using regularized negative binomial regression. Genome biology 20, 296, doi: 10.1186/s13059-019-1874-1 (2019). [DOI] [PMC free article] [PubMed] [Google Scholar]
- 27.Gentry DR, Hernandez VJ, Nguyen LH, Jensen DB & Cashel M Synthesis of the stationary-phase sigma factor sigma s is positively regulated by ppGpp. J Bacteriol 175, 7982–7989, doi: 10.1128/jb.175.24.7982-7989.1993 (1993). [DOI] [PMC free article] [PubMed] [Google Scholar]
- 28.Almirón M, Link AJ, Furlong D & Kolter R A novel DNA-binding protein with regulatory and protective roles in starved Escherichia coli Genes & Development 6, 2646–2654, doi: 10.1101/gad.6.12b.2646 (1992). [DOI] [PubMed] [Google Scholar]
- 29.Traxler MF et al. The global, ppGpp-mediated stringent response to amino acid starvation in Escherichia coli. Mol Microbiol 68, 1128–1148, doi: 10.1111/j.1365-2958.2008.06229.x (2008). [DOI] [PMC free article] [PubMed] [Google Scholar]
- 30.Chen H, Shiroguchi K, Ge H & Xie XS Genome-wide study of mRNA degradation and transcript elongation in Escherichia coli. Mol Syst Biol 11, 781 (2015). [DOI] [PMC free article] [PubMed] [Google Scholar]
- 31.Vargas-Garcia CA, Ghusinga KJ & Singh A Cell size control and gene expression homeostasis in single-cells. Curr Opin Syst Biol 8, 109–116 (2018). [DOI] [PMC free article] [PubMed] [Google Scholar]
- 32.Diep BA et al. Complete genome sequence of USA300, an epidemic clone of community-acquired meticillin-resistant Staphylococcus aureus. Lancet 367, 731–739 (2006). [DOI] [PubMed] [Google Scholar]
- 33.Benson DA, Karsch-Mizrachi I, Lipman DJ, Ostell J & Wheeler DL GenBank. Nucleic Acids Res 35, D21–D25, doi: 10.1093/nar/gkl986 (2007). [DOI] [PMC free article] [PubMed] [Google Scholar]
- 34.Saint M. et al. Single-cell imaging and RNA sequencing reveal patterns of gene expression heterogeneity during fission yeast growth and adaptation. Nature Microbiology 4, 480–491, doi: 10.1038/s41564-018-0330-4 (2019). [DOI] [PubMed] [Google Scholar]
- 35.Grün L, Kester L & Oudenaarden A Validation of noise models for single-cell transcriptomics. Nature Methods 11, 637–640, doi: 10.1038/nmeth.2930 (2014). [DOI] [PubMed] [Google Scholar]
- 36.Raj A, van den Bogaard P, Rifkin SA, van den Oudenaarden A & Tyagi S Imaging individual mRNA molecules using multiple singly labeled probes. Nature Methods 5, 877–879, doi: 10.1038/nmeth.1253 (2008). [DOI] [PMC free article] [PubMed] [Google Scholar]
- 37.Abraham JM, Freitag CS, Clements JR & Eisenstein BI An invertible element of DNA controls phase variation of type 1 fimbriae of Escherichia coli. Proc National Acad Sci 82, 5724–5727, doi: 10.1073/pnas.82.17.5724 (1985). [DOI] [PMC free article] [PubMed] [Google Scholar]
- 38.Deutsch DR et al. Extra-Chromosomal DNA Sequencing Reveals Episomal Prophages Capable of Impacting Virulence Factor Expression in Staphylococcus aureus. Front Microbiol 9, 1406, doi: 10.3389/fmicb.2018.01406 (2018). [DOI] [PMC free article] [PubMed] [Google Scholar]
- 39.Balasubramanian S, Osburne MS, BrinJones H, Tai AK & Leong JM Prophage induction, but not production of phage particles, is required for lethal disease in a microbiome-replete murine model of enterohemorrhagic E. coli infection. Plos Pathog 15, e1007494, doi: 10.1371/journal.ppat.1007494 (2019). [DOI] [PMC free article] [PubMed] [Google Scholar]
- 40.Blattman SB, Jiang W, Oikonomou P & Tavazoie S Prokaryotic Single-Cell RNA Sequencing by In Situ Combinatorial Indexing. Biorxiv, 866244, doi: 10.1101/866244 (2019). [DOI] [PMC free article] [PubMed] [Google Scholar]
- 41.Kuchina A. et al. Microbial single-cell RNA sequencing by split-pool barcoding. Biorxiv, 869248, doi: 10.1101/869248 (2019). [DOI] [PMC free article] [PubMed] [Google Scholar]
- 42.Brauner A, Fridman O, Gefen O & Balaban NQ Distinguishing between resistance, tolerance and persistence to antibiotic treatment. Nature Reviews Microbiology 14, 320–330, doi: 10.1038/nrmicro.2016.34 (2016). [DOI] [PubMed] [Google Scholar]
- 43.Girgis HS, Harris K & Tavazoie S Large mutational target size for rapid emergence of bacterial persistence. Proc National Acad Sci 109, 12740–12745, doi: 10.1073/pnas.1205124109 (2012). [DOI] [PMC free article] [PubMed] [Google Scholar]
- 44.Franzosa EA et al. Sequencing and beyond: integrating molecular ‘omics’ for microbial community profiling. Nat Rev Microbiol 13, 360–372, doi: 10.1038/nrmicro3451 (2015). [DOI] [PMC free article] [PubMed] [Google Scholar]
- 45.Lee TS et al. BglBrick vectors and datasheets: A synthetic biology platform for gene expression. J Biol Eng 5, doi: 10.1186/1754-1611-5-12 (2011). [DOI] [PMC free article] [PubMed] [Google Scholar]
- 46.Zaslaver A. et al. A comprehensive library of fluorescent transcriptional reporters for Escherichia coli. Nat Methods 3, 623–628, doi: 10.1038/nmeth895 (2006). [DOI] [PubMed] [Google Scholar]
- 47.Martin M Cutadapt removes adapter sequences from high-throughput sequencing reads. EMBNet 17, 10–12 (2011). [Google Scholar]
- 48.Smith T, Heger A & Sudbery I UMI-tools: Modelling sequencing errors in Unique Molecular Identifiers to improve quantification accuracy. doi: 10.1101/gr.209601.116 (2017). [DOI] [PMC free article] [PubMed]
- 49.Li H & Durbin R Fast and accurate short read alignment with Burrows-Wheeler transform. Bioinformatics 25, 1754–1760, doi: 10.1093/bioinformatics/btp324 (2009). [DOI] [PMC free article] [PubMed] [Google Scholar]
- 50.Liao Y, Smyth GK & Shi W featureCounts: an efficient general purpose program for assigning sequence reads to genomic features. Bioinformatics 30, 923–930, doi: 10.1093/bioinformatics/btt656 (2014). [DOI] [PubMed] [Google Scholar]
- 51.Santos-Zavaleta A. et al. RegulonDB v 10.5: tackling challenges to unify classic and high throughput knowledge of gene regulation in E. coli K-12. Nucleic Acids Res 47, D212–D220, doi: 10.1093/nar/gky1077 (2019). [DOI] [PMC free article] [PubMed] [Google Scholar]
- 52.Taboada B, Ciria R, Martinez-Guerrero CE & Merino E ProOpDB: Prokaryotic Operon DataBase. Nucleic Acids Res 40, D627–631, doi: 10.1093/nar/gkr1020 (2012). [DOI] [PMC free article] [PubMed] [Google Scholar]
- 53.Fu GK, Hu J, Wang P & Fodor SPA Counting individual DNA molecules by the stochastic attachment of diverse labels. Proc National Acad Sci 108, 9026–9031, doi: 10.1073/pnas.1017621108 (2011). [DOI] [PMC free article] [PubMed] [Google Scholar]
- 54.Tange O GNU Parallel 2018. (Ole Tange, 2018).
- 55.Bolger AM, Lohse M & Usadel B Trimmomatic: a flexible trimmer for Illumina sequence data. Bioinformatics 30, 2114–2120, doi: 10.1093/bioinformatics/btu170 (2014). [DOI] [PMC free article] [PubMed] [Google Scholar]
- 56.Butler A, Hoffman P, Smibert P, Papalexi E & Satija R Integrating single-cell transcriptomic data across different conditions, technologies, and species. Nature Biotechnology 36, 411, doi: 10.1038/nbt.4096 (2018). [DOI] [PMC free article] [PubMed] [Google Scholar]
- 57.Benjamini Y & Hochberg Y Controlling the False Discovery Rate: A Practical and Powerful Approach to Multiple Testing. J Royal Statistical Soc Ser B Methodol 57, 289–300, doi: 10.1111/j.2517-6161.1995.tb02031.x (1995). [DOI] [Google Scholar]
- 58.Huang Y, Sheth RU, Kaufman A & Wang HH Scalable and cost-effective ribonuclease-based rRNA depletion for transcriptomics. Nucleic acids research 48, e20, doi: 10.1093/nar/gkz1169 (2020). [DOI] [PMC free article] [PubMed] [Google Scholar]
- 59.Armour CD et al. Digital transcriptome profiling using selective hexamer priming for cDNA synthesis. Nature Methods 6, 647–U635, doi: 10.1038/Nmeth.1360 (2009). [DOI] [PubMed] [Google Scholar]
- 60.He S. et al. Validation of two ribosomal RNA removal methods for microbial metatranscriptomics. Nature Methods 7, 807, doi: 10.1038/nmeth.1507 (2010). [DOI] [PubMed] [Google Scholar]
- 61.Zhulidov PA et al. Simple cDNA normalization using kamchatka crab duplex-specific nuclease. Nucleic Acids Res 32, e37–e37, doi: 10.1093/nar/gnh031. [DOI] [PMC free article] [PubMed] [Google Scholar]
Associated Data
This section collects any data citations, data availability statements, or supplementary materials included in this article.
Supplementary Materials
Data Availability Statement
Raw data has been submitted to the Gene Expression Omnibus (GEO) under accession number GSE141018. Source data is also provided for all figures. All figures except Figure 1 include original data. An overview of all of the experiments can be found in Supplementary Table 4. A count matrix for the three primary PETRI-seq experiments is provided as Supplementary Table 6.