Abstract
Background and aim:
Mitophagy is a lysosomal degradation pathway that selectively removes damaged, aged and dysfunctional mitochondria. Recent advances in understanding mitophagy highlight its importance in various physiological and pathological conditions including liver diseases. However, reliable quantitative assays to monitor mitophagy in cultured cells and in tissues are still scarce.
Methods:
We describe a detailed protocol for monitoring mitophagy in primary cultured hepatocytes and mouse livers using cytochrome C oxidase subunit 8 (Cox8)-enhanced green fluorescent protein (EGFP)-mCherry, a dual color fluorescence based-imaging method.
Results:
Mitochondria are visualized in yellow fluorescence due to the merged EGFP and mCherry signal. In contrast, autolysosome enclosed mitochondria are shown as red puncta due to quenching of EGFP green fluorescence in acidic compartments. Quantifying the number of red-only puncta in each cell can obtain a quantitative measure for mitophagy.
Conclusions:
Cox8-EGFP-mCherry assay can specifically target to mitochondria and be used to monitor mitophagy in vitro and in vivo.
Keywords: Autophagy, Cox8-EGFP-mCherry, Fluorescence microscopy, Mitochondria, Lysosome
1. Introduction
Autophagy (or macroautophagy) is a catabolic process that degrades cellular proteins and damaged or excess organelles through the formation of a double-membrane autophagosome. Autophagosomes engulf these proteins and organelles in the cytoplasm and then fuse with lysosomes to degrade these components via lysosome proteases.1–3 Autophagic degradation can either be non-selective or selective. Non-selective autophagy generally occurs upon nutrient deprivation, which causes the random breakdown of cytoplasmic components to supply cells with nutrients for survival purpose. Selective autophagy removes protein aggregates and damaged or excess organelles using specific receptors, and it occurs in both nutrient-rich and poor conditions.1,3
Mitophagy is a form of selective autophagy that specifically degrades damaged mitochondria. Impaired mitophagy is thought to contribute to various neurodegenerative diseases such as Parkinson’s disease, Alzheimer’s disease and Huntington’s disease.4–7 In addition, increasing evidence supports a protective role of mitophagy against liver injury induced by acetaminophen over-dose, alcohol consumption and viral infection by removing damaged mitochondria.8–10 As a result, pharmacological activation of mitophagy has become a potentially interesting therapeutic approach in preventing or treating tissue damage in human diseases. Therefore, a reliable quantitative assay to monitor mitophagy in mammalian cells and tissues is much needed.
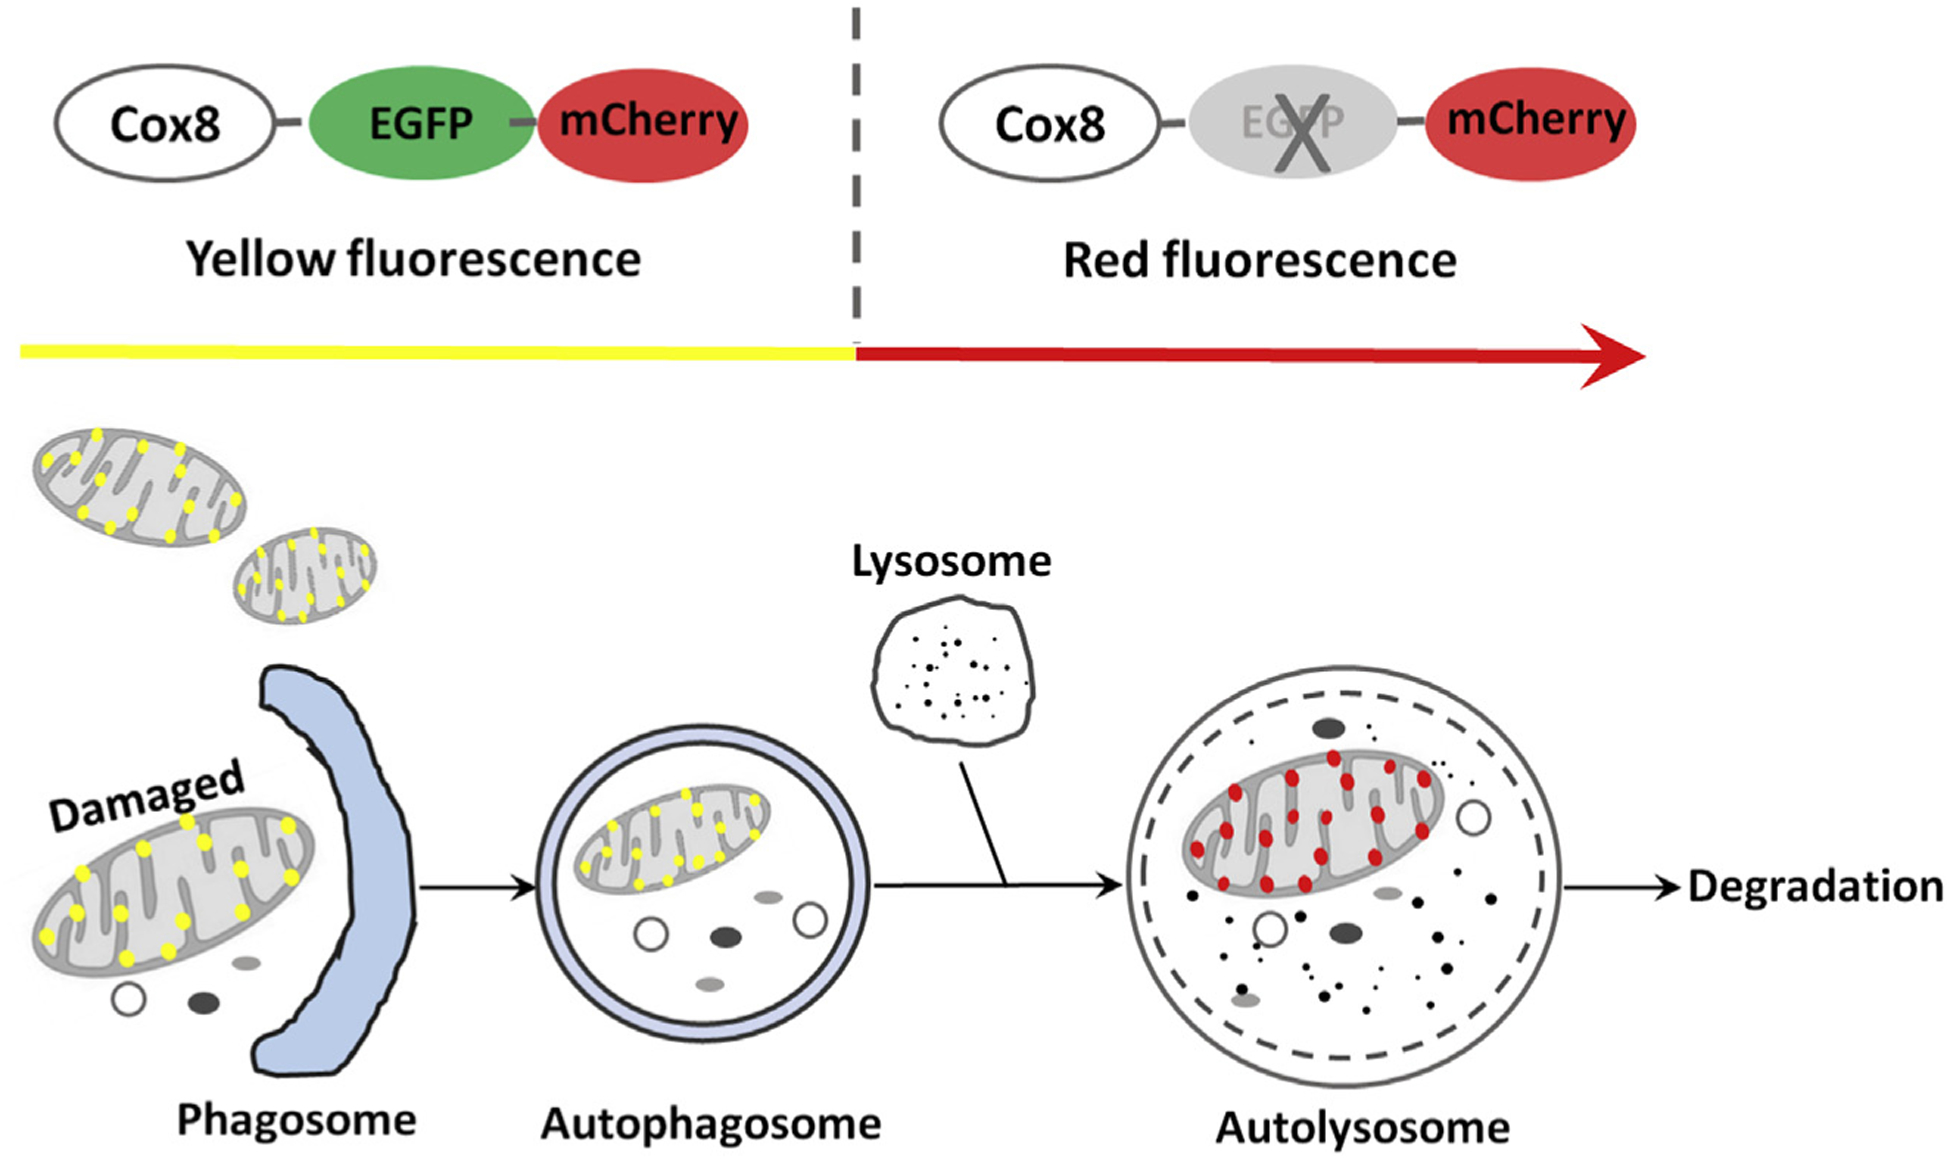
It is well known that the enhanced green fluorescent protein (EGFP) (pKa = 5.9) generally quenches whereas mCherry or red fluorescent protein (RFP) (pKa = 4.5) is relatively stable at the cellular acidic compartments (such as autolysosomes that have low pH values). Cox8 is an inner mitochondrial membrane protein. Therefore, the tandem Cox8-EGFP-mCherry can specifically target to mitochondria and has recently been used to monitor mitophagy in cultured cells.11 Normal mitochondria generally show yellow color whereas autolysosome-enwrapped mitochondria will only display red fluorescence.11,12 The principle of using Cox8-EGFP-mCherry to monitor mitophagy is shown in Fig. 1. In addition to Cox8-EGFP-mCherry, Mito-QC, a tandem mCherry-GFP tag fused to the mitochondrial targeting sequence of the outer mitochondrial membrane protein, has also been recently established to monitor mitophagy.13 However, it should be noted that most outer mitochondrial membrane proteins are degraded by the ubiquitin proteasome system during mitophagy, and inner mitochondrial membrane proteins are more specific for mitophagy.14 Therefore, the use of Cox8-EGFP-mCherry may be more specific than the use of Mito-QC for monitoring mitophagy.
Fig. 1. The principle of using Cox8-EGFP-mCherry to monitor mitophagy.

When cells are expressing Cox8-EGFP-mCherry either by transient transfection with a Cox8-EGFP-mCherry plasmid (available at Addgene #78520) or infected with an adenovirus Cox8-EGFP-mCherry (available at our lab per request), mitochondria will display a yellow color. Once mitochondria are damaged, damaged mitochondria will be recognized and enveloped by an autophagosome that carries the enwrapped mitochondria to a lysosome and further fuses with a lysosome to form an autolysosome. The trapped mitochondria within an autolysosome will only display red fluorescence (mCherry) due to the quench of the green fluorescence (EGFP). As a result, the number of red puncta per cell can be used as a quantitative measurement for mitophagy. Abbreviations: Cox8, cytochrome C oxidase subunit 8; EGFP, enhanced green fluorescent protein.
The transfection efficiency of using most traditional transfection reagents is low in primary hepatocytes, while the adenovirus has very high infection efficiency for gene delivery in cultured hepatocytes and mouse livers. Therefore, to better monitor mitophagy in primary hepatocytes and in mouse liver by using Cox8-EGFP-mCherry, we produced adenovirus Cox8-EGFP-mCherry (Ad-Cox8-EGFP-mCherry) in collaboration with Vector Biolabs (Malvern, PA, USA). We described herein a detailed protocol for monitoring mitophagy in primary cultured hepatocytes and in mouse liver using the dual color fluorescence-based imaging of Cox8-EGFP-mCherry.
2. Materials
2.1. Reagents
1 × phosphate buffer saline (PBS)
70% Ethanol
William’s E medium (W4128; Sigma, USA)
100 × l-Glutamine (SH30034.02; Hyclone, USA)
100 × penicillin/streptomycin (SV30010; Hyclone, USA)
Fetal bovine serum (FBS) (10437–028; Gibco, USA)
Trypan blue (K940; Amresco, USA)
Ad-Cox8-EGFP-mCherry (Vector Biolabs, USA)
4% paraformaldehyde (P6148; Sigma, USA) in 1 × PBS
Hoechst 33342 dye (H3570; Invitrogen, USA)
Mounting medium (TA-030-FM; Thermo, USA)
Saline (S8776; Sigma, USA)
Sucrose (0335; Amresco, USA)
Tissue Plus O.C.T. compound (4585; Fisher Health Care, USA)
2.2. Equipment
Laminar flow hood
Optical microscope
Hemocytometer chamber
Cover glasses for growth (12-545-82; Fisherbrand)
12-well culture plate (3516; Corning)
37 °C incubator with 5% CO2
Confocal microscope (Nikon A1R Confocal Laser Microscope)
Histo-cryotome (Leica)
Superfrost slides (12-550-15; Fisherbrand)
Cover slides (12–543B; Fisherbrand)
3. Methods
3.1. Detection of mitophagy in primary hepatocytes
3.1.1. Primary mouse hepatocyte isolation and culture
Murine hepatocytes are freshly isolated from mouse liver by a retrograde, non-recirculating perfusion as we previously described.15 Cells are suspended in complete William’s E medium with 10% FBS.
3.1.2. Preparation
Make sure that all solutions and equipment that come in contact with the cells are sterile. Always use proper sterile technique and work in a laminar flow hood before fixation.
Medium set up: add 5 mL 100 × l-Glutamine and 5 mL 100 × penicillin/streptomycin to 500 mL William’s E medium.
Glass slides are pretreated with 70% ethanol for sterilization.
Put glass slides into 12-well plate, one well each.
Note: Use the glass slides after ethanol dry.
3.1.3. Adenovirus transduction
-
i
After cells are isolated, cell viability is determined by trypan blue exclusion assay and generally cell viability should be more than 85%.
-
ii
Dilute cell suspensions using complete medium, adjust the final cell density to 2 × 10⁵/mL.
-
iii
Add 10 MOI (multiplicity of infection) of Ad-Cox8-EGFP-mCherry to suspended cells, mix them gently.
Note: The optimum titration of adenovirus varies in different cell types. Forty-eight hours and later are the peak expression time of Ad-Cox8-EGFP-mCherry in primary mouse hepatocytes. 10 MOI is required if the observation time happens early.
-
iv
Seed the cells into 12-well plate containing glass slides, 1 mL per well.
Note: Make sure the glass slides are located on the bottom of wells after seeding. If not, press it down.
-
v
Incubate the plate in a 37 °C incubator with 5% CO2 for allowing the cells to attach and grow on the glass slides.
-
vi
After incubating for 2–3 h, aspirate off the medium and wash the cells with sterile PBS once and replace with conditional William’s E medium without FBS.
Note: For immortalized cell line which requires FBS for normal growth, normally used complete medium can be used to replace the virus containing medium. The virus incubation time varies depending upon the cell type.
-
vii
Incubate the cells overnight in a 37 °C incubator with 5% CO2.
-
viii
After designated treatments/manipulations, fix the cells on the glass slides using 4% paraformaldehyde (prepared in PBS). The slides can be stored in paraformaldehyde at 4 °C for a few weeks, avoid light that may cause fluorescence quenching.
3.1.4. Capture image
At the time to image, rinse the slides 3 times in 1 × PBS at room temperature.
(Optional) Incubate the slides with Hoechst 33342 (1 μg/mL) for 10 min to stain the nuclei in a dark chamber, rinse twice with 1 × PBS.
Mount the slides with mounting medium immediately.
Capture images using a confocal microscope. Emissions at 497–531 nm and 583–695 nm will be used for green and red fluorescence, respectively.
3.1.5. Anticipated results
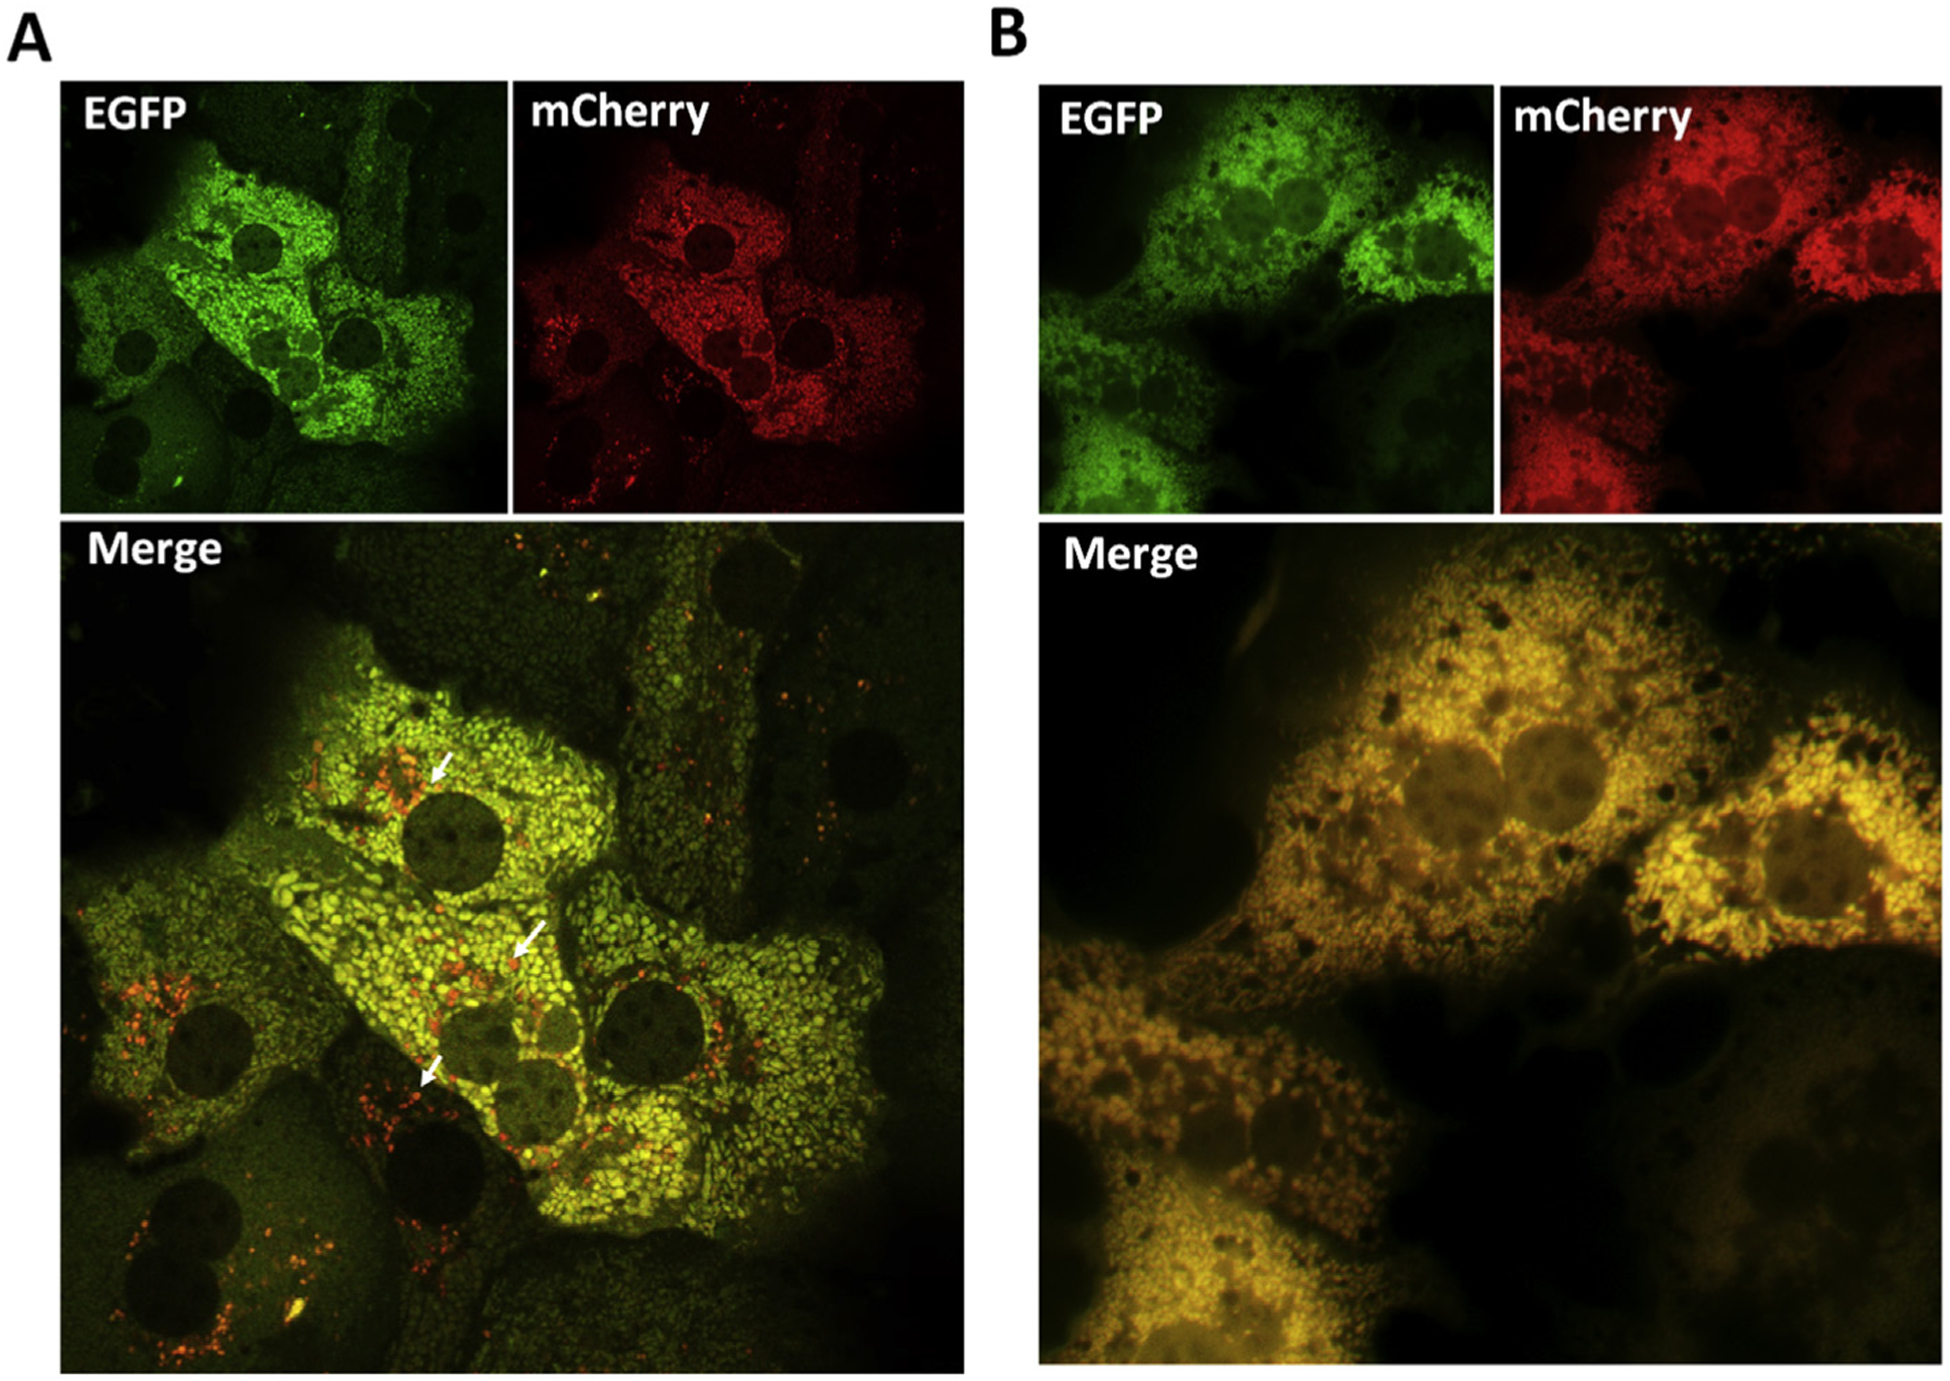
As shown in Fig. 2A, Cox8-EGFP-mCherry displayed spherical or tubular like features, typical mitochondrial structure, in primary mouse hepatocytes. These imaging data indicate that Cox8-EGFP-mCherry can be successfully expressed and targeted to mitochondria in hepatocytes. We found many red-only (mCherry only) puncta in hepatocytes (Fig. 2A, arrows), which reflects the basal level mitophagy in primary cultured hepatocytes. To validate our assay, some hepatocytes were treated with chloroquine (CQ), which can neutralize lysosomal pH and block autophagy. We found that Cox8-EGFP-mCherry displayed exclusively in yellow color in CQ-treated hepatocytes, suggesting a marked decrease of mitophagy (Fig. 2B).
Fig. 2. Using Cox8-EGFP-mCherry to monitor mitophagy in primary hepatocytes.

(A) Primary hepatocytes were isolated from 2-month-old female C57BL/6 mice and infected with Cox8-EGFP-mCherry adenovirus (10 MOI) for 24 h. Cells on the glass slides were fixed followed by confocal microscopy. Representative EGFP, mCherry and overlayed images are shown. Arrows denote red-only mitochondria. (B) Primary hepatocytes were isolated and infected with Cox8-EGFP-mCherry adenovirus (10 MOI) for 24 h. Cells were treated with 40 μM CQ for 6 h before fixation. Images were captured by a fluorescence microscope. Representative EGFP, mCherry and overlayed images are shown. Abbreviations: Cox8, cytochrome C oxidase subunit 8; EGFP, enhanced green fluorescent protein; MOI, multiplicity of infection; CQ, chloroquine.
Note: It is highly recommended to take image from more than 20 cells in each condition and quantify the red-only puncta per cell to obtain a quantitative measure for mitophagy.
3.2. Detection of mitophagy in mouse liver
3.2.1. Adenovirus injection and tissue processing
Animals.
Male C57BL/6J mice (8–12 weeks old) were purchased from Jackson Laboratories (Bar Harbor, ME, USA) and kept in an environmentally controlled room with a 12 h light/dark cycle and ad libitum access to food and water. The procedure for the delivery of Ad-Cox8-EGFP-mCherry to mouse liver and liver tissue processing is described in detail below. All the procedures were approved by the Institutional Animal Care and Use Committee of the University of Kansas Medical Center and followed the criteria of the National Research Council for the care and use of laboratory animal treatment.
Prepare Cox8-EGFP-mCherry adenovirus solution in saline, and then adjust the final virus concentration to 5 × 10¹⁰ plaque forming unit (PFU)/mL.
Then 200 μL virus solution (1 × 10⁹ PFU/mouse) is given to each mouse through tail vein injection.
After 7–10 days following the injection, the mice are sacrificed and liver tissues are harvested. Liver tissues are fixed in 4% paraformaldehyde (prepared in PBS) overnight at 4 °C and then transferred to 20% sucrose (prepared in PBS).
The next day, mount the tissues in O.C.T. compound.
Store the blocks in ‒80 °C freezer until the time for sectioning.
Cut sections of 5 μm thickness, place the sections on a Superfrost slides and store at ‒80 °C.
3.2.2. Capture image
When it is time to image, remove slides from freezer, demarcate the tissue as needed.
Rinse slides gently for 3 times in 1 × PBS to remove the tissue-freezing matrix.
Incubate the slides with Hoechst 33342 dye (1 μg/mL) for 10 min in a dark chamber, rinse 3 times in 1 × PBS.
Mount the slides with a mounting medium immediately.
Capture images using a confocal microscope. Emissions at 497–531 nm and 583–695 nm will be used for green and red fluorescence, respectively.
3.2.3. Data analysis and quantification
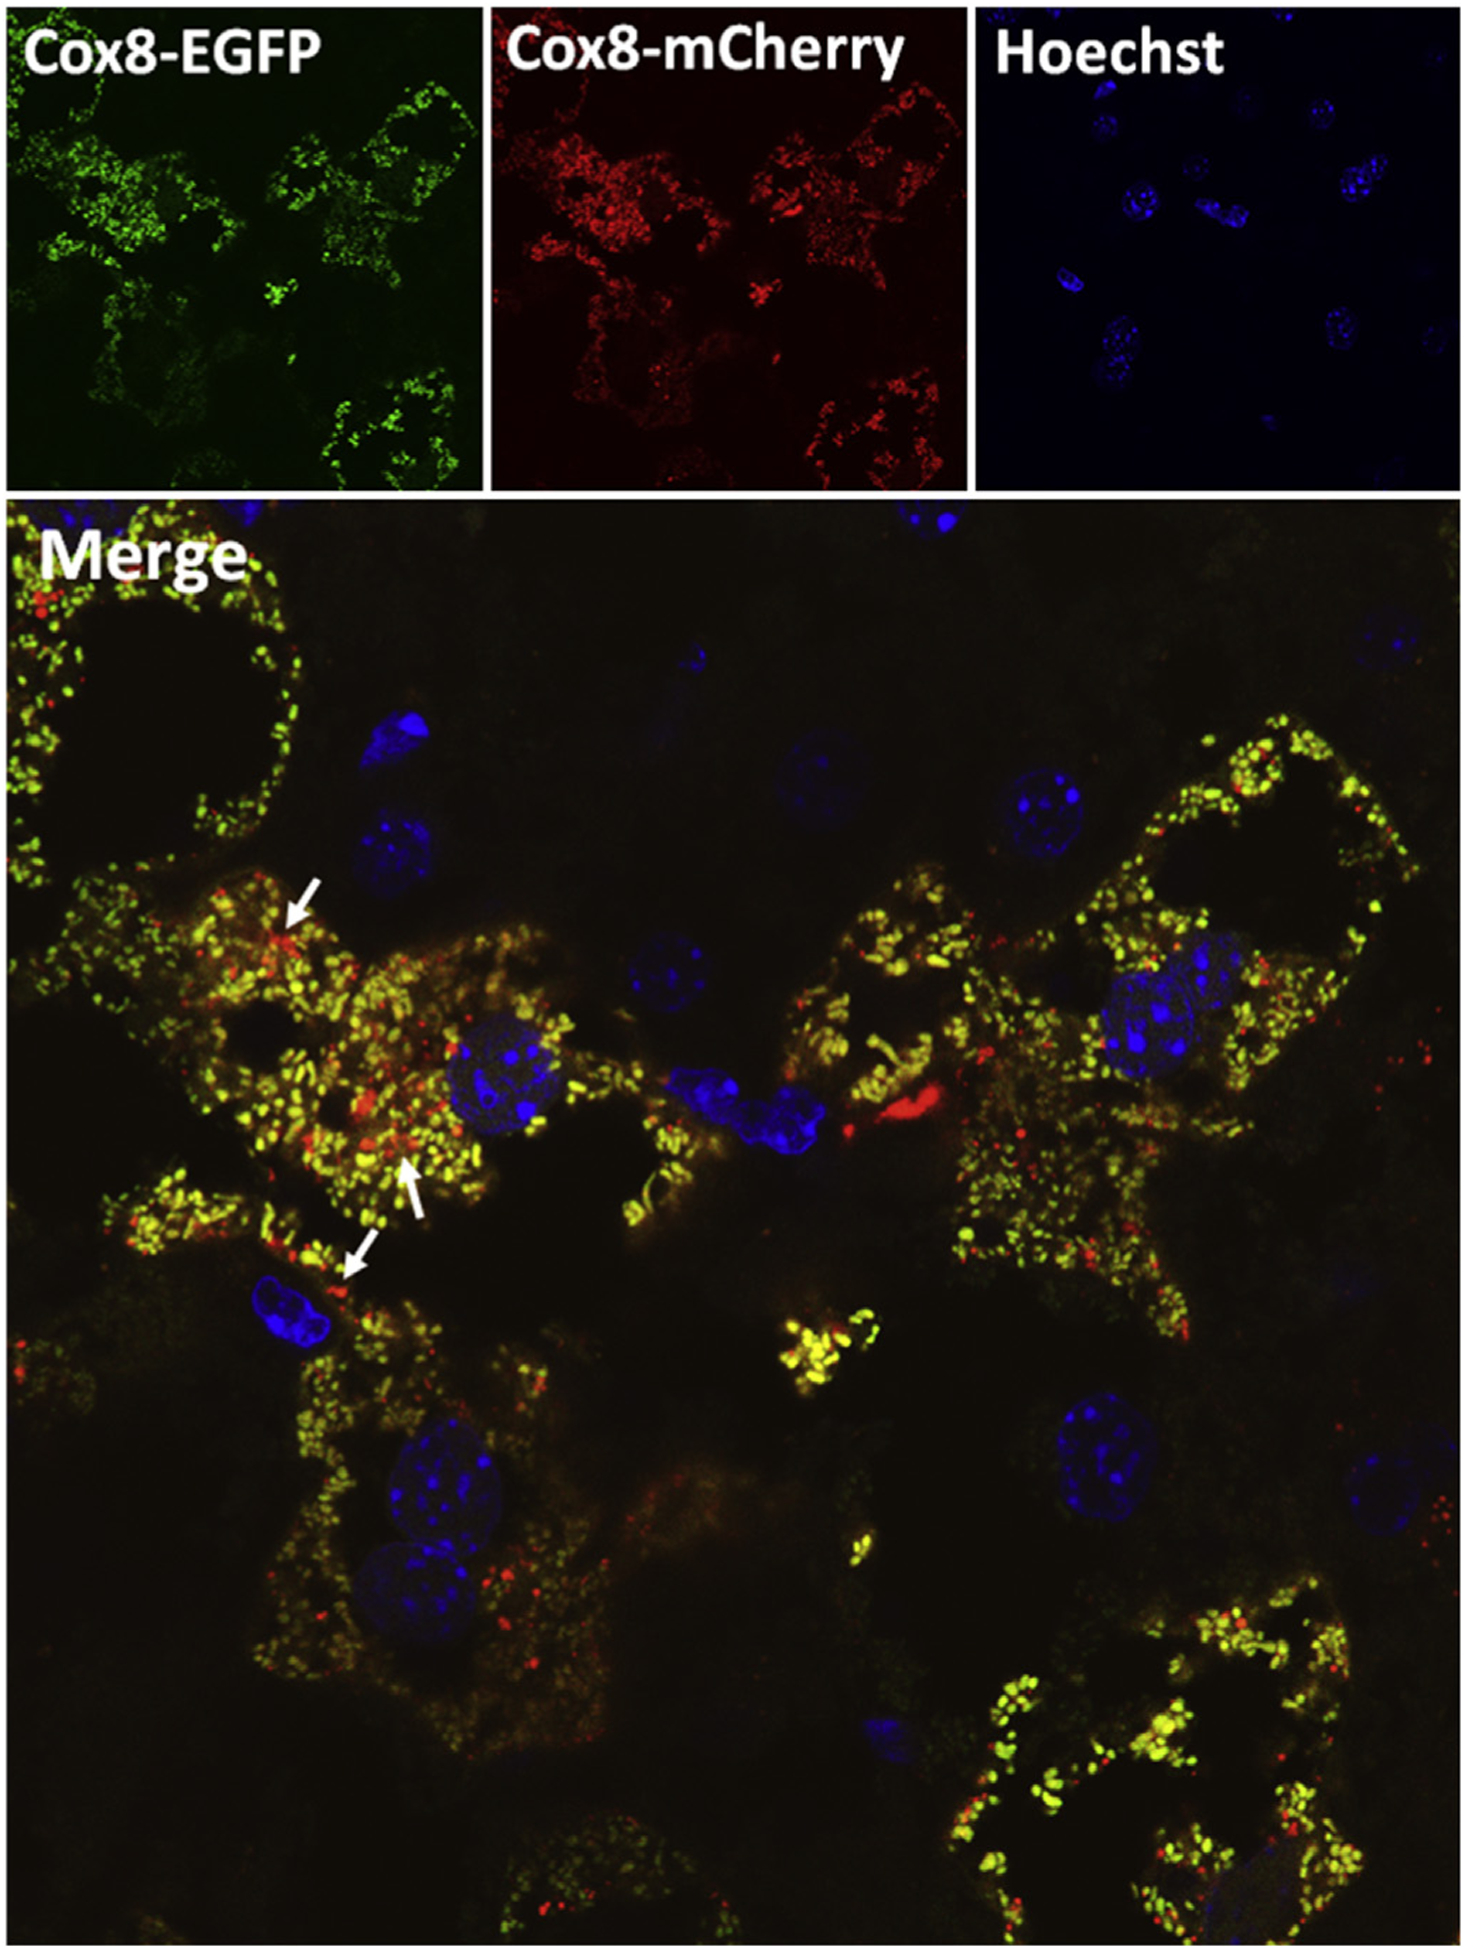
Similar to the primary cultured mouse hepatocytes, Cox8-EGFP-mCherry also showed spherical or tubular like typical mitochondrial morphology in hepatocytes of mouse livers. Mitochondria are expected to be visualized in yellow fluorescence due to the merged EGFP and mCherry signal. In contrast, mitochondria that are enclosed in autolysosomes are expected to be visualized as red puncta due to quenching of green fluorescence of EGFP (Fig. 3, arrows), which may reflect the basal mitophagy in the livers of these mice. It is highly recommended to take more than 5 images from each mouse and quantify the red-only puncta per cell from more than 20 cells in each image to obtain a quantitative measure for mitophagy.
Fig. 3. Using Cox8-EGFP-mCherry to monitor mitophagy in mouse livers.

Cox8-EGFP-mCherry adenovirus (1 × 10⁹ PFU/mouse) were given into 2-month-old male C57/BL6 mice through tail vein injection. Liver tissues were collected and fixed after 10 days of injection. Cryosections of liver tissues were stained with Hoechst 33342 (1 μg/mL) for nuclei followed by confocal microscopy. Representative EGFP, mCherry and overlayed images are shown. Arrows denote red-only mitochondria. Abbreviations: Cox8, cytochrome C oxidase subunit 8; EGFP, enhanced green fluorescent protein; PFU, plaque forming unit.
4. Discussion
Mitophagy plays critical roles in maintaining cellular homeostasis and functions. Impaired mitophagy may lead to metabolic syndrome and pathogenesis of many liver diseases including alcoholic and non-alcoholic fatty liver diseases, hepatic virus infection, drug-induced liver injury and hepatocellular carcinoma.8,10,16–18 Here, we demonstrated that mitophagy can be monitored by using the Cox8-EGFP-mCherry in primary hepatocytes and in mouse livers. This method can be applied to many liver pathophysiological relevant conditions such as alcohol or high fat diet induced fatty liver disease, drug such as acetaminophen-induced liver injury, hepatitis C virus infection and many transgenic mouse models that related to mitochondria. In addition, this assay may also be helpful for better understanding basic biochemical mechanisms regulating mitophagy. Although this assay has great values for monitoring and quantifying mitophagy, it also has some limitations. The major problem is that the expression level of Cox8-EGFP-mCherry varies in different cells depending on adenovirus infection efficiency particular in liver tissues. In primary hepatocytes, we generally use 1–10 MOI adenovirus depending on the conditions of isolation and time-frame of the experiments. For longer cultured primary hepatocytes such as more than 48 h, 1 MOI adenovirus should yield very good expression levels. The relatively low infection efficiency of adenovirus in some organs such as fat, muscle and pancreas, may restrict the application of this assay in other tissues in vivo. Lentivirus may be considered in cells or organs that are resistant to adenovirus infection. To avoid these limitations, perhaps a transgenic mice overexpression of Cox8-EGFP-mCherry will be helpful. In addition, the EGFP signal quenching happens after autophagosome fusing with lysosome. Thus, the red puncta in this assay cannot reflect the very early stage of mitophagy when mitochondria are just enwrapped by autophagosome before the lysosome involve. More efforts are needed to continue to develop more reliable assays for assessing mitophagy especially in vivo and in live cells. These efforts may ultimately lead to new avenues for the treatment of mitochondria dysfunctional diseases.
Acknowledgements
We thank Dr. David Chan from Caltech for providing the Cox8-EGFP-mCherry plasmid. This work was partially supported by the National Institutes of Health (NIH) grants: R37 AA020518, R01 DK102142, U01 AA024733 and 1R21AG065720-01.
Footnotes
Declaration of competing interest
The authors declare that they have no conflict of interest.
References
- 1.Williams JA, Zhao K, Jin S, Ding WX. New methods for monitoring mitochondrial biogenesis and mitophagy in vitro and in vivo. Exp Biol Med (Maywood). 2017;242:781–787. 10.1177/1535370216688802. [DOI] [PMC free article] [PubMed] [Google Scholar]
- 2.Mizushima N, Komatsu M. Autophagy: renovation of cells and tissues. Cell. 2011;147:728–741. 10.1016/j.cell.2011.10.026. [DOI] [PubMed] [Google Scholar]
- 3.Mizushima N. Autophagy in protein and organelle turnover. Cold Spring Harb Symp Quant Biol. 2011;76:397–402. 10.1101/sqb.2011.76.011023. [DOI] [PubMed] [Google Scholar]
- 4.Pickrell AM, Youle RJ. The roles of PINK1, parkin, and mitochondrial fidelity in Parkinson’s disease. Neuron. 2015;85:257–273. 10.1016/j.neuron.2014.12.007. [DOI] [PMC free article] [PubMed] [Google Scholar]
- 5.Hong X, Liu J, Zhu G, et al. Parkin overexpression ameliorates hippocampal long-term potentiation and β-amyloid load in an Alzheimer’s disease mouse model. Hum Mol Genet. 2014;23:1056–1072. 10.1093/hmg/ddt501. [DOI] [PubMed] [Google Scholar]
- 6.Hwang S, Disatnik MH, Mochly-Rosen D. Impaired GAPDH-induced mitophagy contributes to the pathology of Huntington’s disease. EMBO Mol Med. 2015;7: 1307–1326. 10.15252/emmm.201505256. [DOI] [PMC free article] [PubMed] [Google Scholar]
- 7.Ding WX, Yin XM. Mitophagy: mechanisms, pathophysiological roles, and analysis. Biol Chem. 2012;393:547–564. 10.1515/hsz-2012-0119. [DOI] [PMC free article] [PubMed] [Google Scholar]
- 8.Williams JA, Ding WX. A mechanistic review of mitophagy and its role in protection against alcoholic liver disease. Biomolecules. 2015;5:2619–2642. 10.3390/biom5042619. [DOI] [PMC free article] [PubMed] [Google Scholar]
- 9.Ni HM, Bockus A, Boggess N, Jaeschke H, Ding WX. Activation of autophagy protects against acetaminophen-induced hepatotoxicity. Hepatology. 2012;55: 222–232. 10.1002/hep.24690. [DOI] [PMC free article] [PubMed] [Google Scholar]
- 10.Chao X, Wang H, Jaeschke H, Ding WX. Role and mechanisms of autophagy in acetaminophen-induced liver injury. Liver Int. 2018;38:1363–1374. 10.1111/liv.13866. [DOI] [PMC free article] [PubMed] [Google Scholar]
- 11.Rojansky R, Cha MY, Chan DC. Elimination of paternal mitochondria in mouse embryos occurs through autophagic degradation dependent on PARKIN and MUL1. Elife. 2016;5, e17896. 10.7554/eLife.17896. [DOI] [PMC free article] [PubMed] [Google Scholar]
- 12.Yoshii SR, Mizushima N. Monitoring and measuring autophagy. Int J Mol Sci. 2017;18:1865. 10.3390/ijms18091865. [DOI] [PMC free article] [PubMed] [Google Scholar]
- 13.McWilliams TG, Prescott AR, Allen GF, et al. mito-QC illuminates mitophagy and mitochondrial architecture in vivo. J Cell Biol. 2016;214:333–345. 10.1083/jcb.201603039. [DOI] [PMC free article] [PubMed] [Google Scholar]
- 14.Williams JA, Ding WX. Mechanisms, pathophysiological roles and methods for analyzing mitophagy-recent insights. Biol Chem. 2018;399:147–178. 10.1515/hsz-2017-0228. [DOI] [PMC free article] [PubMed] [Google Scholar]
- 15.Ding WX, Ni HM, DiFrancesca D, Stolz DB, Yin XM. Bid-dependent generation of oxygen radicals promotes death receptor activation-induced apoptosis in murine hepatocytes. Hepatology. 2004;40:403–413. 10.1002/hep.20310. [DOI] [PubMed] [Google Scholar]
- 16.Williams JA, Ding WX. Targeting pink1-parkin-mediated mitophagy for treating liver injury. Pharmacol Res. 2015;102:264–269. 10.1016/j.phrs.2015.09.020. [DOI] [PMC free article] [PubMed] [Google Scholar]
- 17.Liu K, Lee J, Kim JY, et al. Mitophagy controls the activities of tumor suppressor p53 to regulate hepatic cancer stem cells. Mol Cell. 2017;68:281–292. 10.1016/j.molcel.2017.09.022. e5. [DOI] [PMC free article] [PubMed] [Google Scholar]
- 18.Ma X, McKeen T, Zhang J, Ding WX. Role and mechanisms of mitophagy in liver diseases. Cells. 2020;9:837. 10.3390/cells9040837. [DOI] [PMC free article] [PubMed] [Google Scholar]


