Abstract
Ultrasound contrast enhanced super resolution imaging has recently attracted attention because of its extraordinary ability to image vascular features much smaller than the ultrasound diffraction limit. This method requires sensitive detection of separable microbubble events despite a noisy tissue background to indicate the microvasculature, and any approach which could improve the sensitivity of the ultrasound system to individual microbubbles would be highly beneficial. In this study, we evaluated the effect of varying microbubble size on super-resolution imaging sensitivity. Microbubble preparations were size sorted into different mean diameters, and then were imaged at equal concentrations. Commercial Definity and Optison were also imaged for comparison. Both in vitro experiments in phantom vessels and in vivo experiments imaging rat tumors demonstrated that the sensitivity of contrast enhanced super resolution imaging can be improved by using microbubbles with a larger diameter.
Keywords: Super resolution, Microbubble contrast agent, Sensitivity, Size distribution
Introduction
Ultrasound contrast enhanced super resolution (SR) imaging has recently attracted the attention of researchers in the medical ultrasound domain because of its extraordinary ability to image microvessels at resolutions as small as ten micrometers, over an order of magnitude smaller than the ultrasound diffraction limit. SR imaging is originally inspired by the revolutionary technology of optical localization microscopy (Betzig et al. 2006; Rust et al. 2006), which utilizes the stochastic blinking of specific fluorescent sources and then localizes the center of each separable source and accumulates these center positions over thousands of samples (Huang et al. 2010). In the medical ultrasound domain, gas-filled encapsulated microbubbles contrast agent, which typically have a mean diameter less than 5 μm, are used as an acoustic equivalent of these fluorescent sources. Researchers have investigated different ways to meet the key requisite of separable microbubble detection in order to achieve ultrasound super resolution images (Christensen-Jeffries et al. 2015; Desailly et al. 2013; Errico et al. 2015; O’Reilly and Hynynen 2013). Among these techniques, the method called ultrasound localization microscopy (ULM), which was proposed by Tanter’s group, can separate microbubbles from tissue even when utilizing a clinically-relevant concentration, by using ultrafast acquisition and spatiotemporal filtering (Demene et al. 2015) to detect the decorrelation of microbubbles from a stack of images. ULM, also referred to as SR imaging in this paper, reduces the acquisition time from a few hours to tens of minutes to reconstruct a 2D SR image, and therefore is more reasonable for clinical translation (Errico et al. 2015). Previous studies have shown the super-resolved vasculature maps of mouse ear (Christensen-Jeffries et al. 2015), rat brain (Errico et al. 2015; O’Reilly and Hynynen 2013) and tumor-associated angiogenesis (Lin et al. 2016; Lin et al. 2017).
However, there exist compromises between imaging sensitivity, transmitted energy and microbubble concentration. A high frame rate is required to achieve super resolution images within a reasonable imaging time, and thus contrast agent microbubbles are exposed to ten to a hundred times more number of ultrasound pulses for a longer time period than microbubbles in a traditional contrast enhanced ultrasound imaging study. Therefore, the transmitted energy needs to be very low to minimize microbubble destruction. Complicating this, the low transmitted energy degrades the imaging sensitivity and leads a challenge obtaining significant numbers of detected microbubble events. Furthermore, although increasing the injected microbubble concentration can enhance the scattered signals, a high microbubble concentration may result in unseparable microbubbles even after the use of spatiotemporal filter, especially in the case of large vessels where a large number of microbubbles are present in close spatial proximity. These challenges provide motivation to optimize the sensitivity of SR imaging by improving sensitivity on a per-bubble basis.
Over the last few years, some researchers have shown that contrast agent echogenicity can be increased both by matching the imaging frequency to the bubble resonant frequency and by increasing the diameter of microbubbles because of larger scattering cross section (Kaya et al. 2009; Talu et al. 2007). These improvements have been demonstrated on traditional contrast enhanced imaging on mouse kidneys (Sirsi et al. 2009) and targeted molecular imaging on rat tumors (Streeter et al. 2010). In addition, larger microbubbles have a longer persistence time in the bloodstream (Borden and Longo 2002; Kabalnov et al. 1998), which is also an advantage for SR imaging which requires a longer imaging time than traditional contrast imaging.
We hypothesized that SR imaging can benefit from the use of larger microbubbles. In this study, we change imaging sensitivity of SR imaging to small vessels as a function of bubble size. Experiments were conducted in vitro in microtubes and in vivo in a rat fibrosarcoma (FSA) tumor model. Data illustrate that the sensitivity of SR imaging is improved with increasing mean diameter of microbubble distribution.
Material and Methods
In-house made lipid-encapsulated microbubble contrast agents were generated by sonicating lipid solution in the presence of decafluorobutane (SynQuest Labs, Alachua, FL, USA), using a sonicator (Model 500, Fisher Scientific, Hampton, NH) running at 70% power for 10 seconds. Lipid solution was prepared with a 9:1 molar mixture of 1,2-distearoyl-sn-glycero-3-phosphocholine (DSPC, Avanti Polar Lipids, Alabaster, AL, USA) and 1,2-distearoyl-sn-glycero-3-phosphoethanolamine-N-[methoxy(polyethylene glycol)-2000] (mPEG-DSPE, Creative PEGWorks, Winston Salem, NC, USA) in phosphate buffered saline containing 15% (v/v) propylene glycol and 5% (v/v) glycerol (Feingold et al. 2010). Microbubbles were size selected through centrifugation using the protocol described by Feshitan. (Feshitan et al. 2009). Three different sizes of in-house lipid shelled microbubbles were examined. Additionally, two commercial contrast agents, Definity (Lantheus Medical Imaging, North Billerica, MA) and Optison (GE Healthcare Bio-Sciences, Pittsburgh, PA) were also tested for comparison. Concentration and size distribution of all microbubbles were measured using a laser light obscuration and scatter device (Accusizer 780A, Particle Sizing Systems, Santa Barbara, CA).
In vitro studies were conducted on a thin-walled polycarbonate microtube (Paradigm Optics Inc., WA, USA) with inner diameter of 150 μm. Microbubbles were infused at the rate of 25 μL/min, which is a reasonable flow rate to mimic blood flow in tumor vessels (Rieger et al. 2016), with the aid of an infusion pump (Harvard Apparatus, Holliston, Mass). The concentration was matched to 1×10⁷ bubbles per milliliter for all in-vitro studies. After each experiment, the microtube was cleaned by flushing with water and air in order to minimize the disturbance to the following experiment with different size of microbubbles. A control microtube with only water inside was also imaged and used as reference data.
In vivo studies were conducted on female Fischer 344 rats (approximately 180 g, Charles River Laboratories, Durham, NC) implanted with subcutaneous fibrosarcoma (FSA; originally provided by the laboratory of Dr. Mark Dewhirst) tumors in the right flank region. Animal studies were approved by the University of North Carolina Institutional Animal Care and Use Committee. Imaging was performed after anesthetizing the rats with vaporized isoflurane and placing them on a warming stage to maintain body temperature. The right flank was shaved and depilated to remove the hair, and ultrasound gel was applied to couple the transducer to the skin. Microbubbles were infused through a 24-gauge tail-vein catheter. For each imaging study, a bolus of 5×10⁷ microbubbles was injected. Only the in-house lipid shelled microbubbles were tested in-vivo at the time of the study. After each experiment, circulating microbubbles were cleared with higher energy transmissions (mechanical index = 0.19) at high frame rate and then there was a 5 minute waiting period prior to commencing the next imaging study. The rat was also imaged without microbubbles as a control.
Both in vitro and in vivo experiments were performed using a Verasonics Vantage system (Verasonics Inc., Redmond, WA, USA) with a L11–5 linear probe, using plane-wave imaging at a pulse repetition frequency of 200 Hz. The transmitted pulses were 2 cycle sinusoids at 9 MHz with a rarefactional pressure of 172 kPa (mechanical index = 0.06). 8,000 images were acquired for each experiment to reconstruct a 2D SR image. SR images were obtained through offline post-processing on beamformed IQ data. A detailed description on the data post-processing method can be found in (Lin et al. 2017). The filter order of the spatiotemporal singular value decomposition (SVD) filter and intensity threshold, which were two important parameters for localization of microbubbles, remained the same when processing all the datasets from different sized microbubbles. For in vitro experiments, the filter order was chosen as 20 and the two intensity thresholds used were −25 dB and −31 dB. For in vivo experiments, the filter order was chosen as 35 and the two intensity thresholds used were −38 dB and −44 dB.
Results
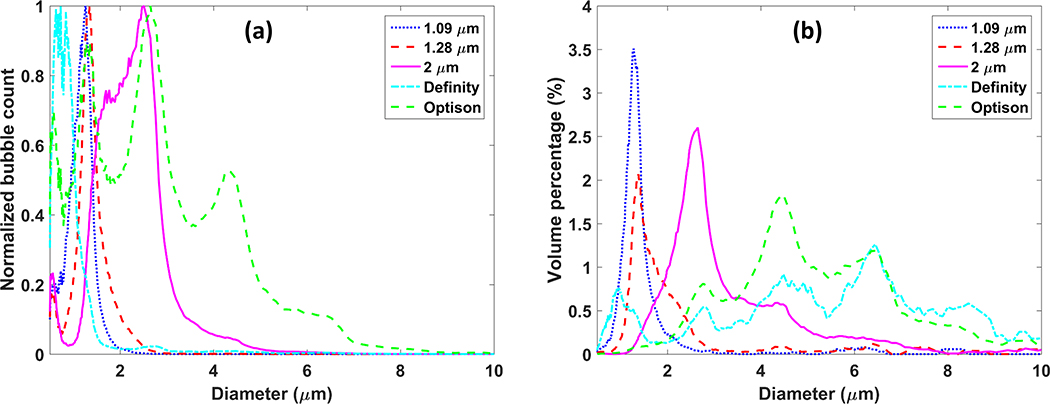
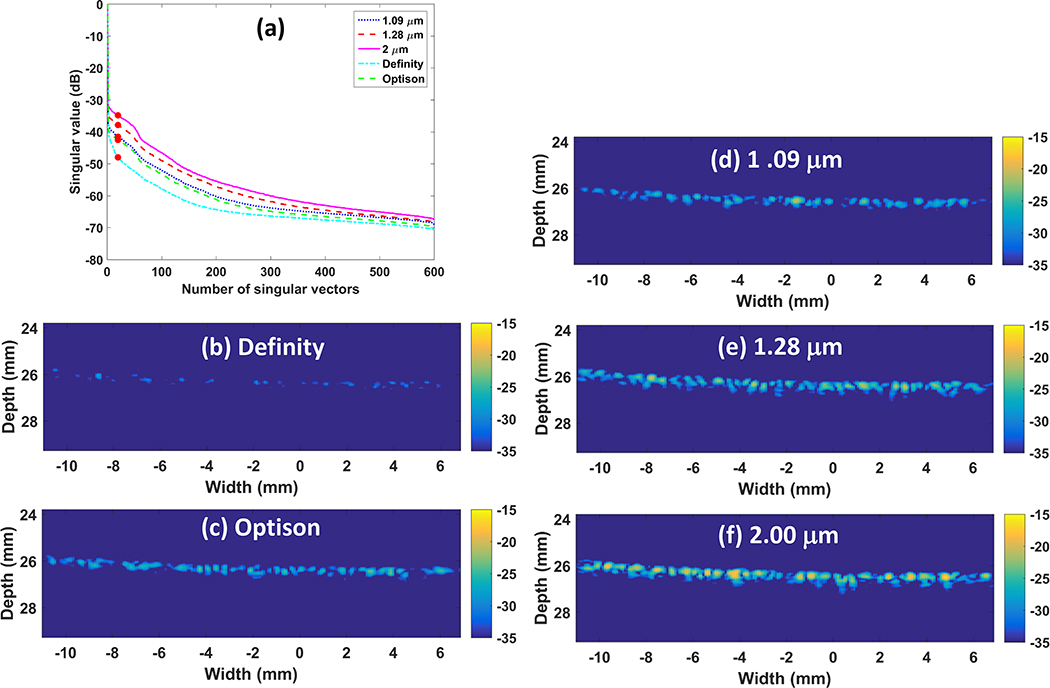
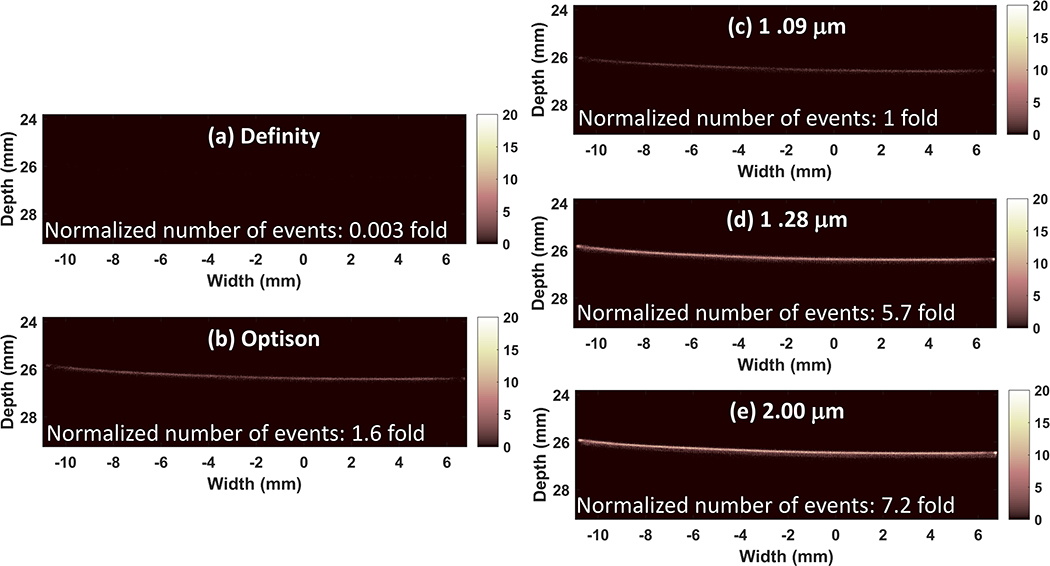
Centrifugal sorting enabled preparation of three different microbubble populations. The mean diameter of the three populations of in-house agents was 1.09 ± 0.29 μm, 1.28 ± 0.44 μm and 2.00 ± 0.76 μm, respectively. The mode diameter was 1.23 μm, 1.38 μm and 2.44 μm, respectively. The size of Definity was measured as 0.86 ± 0.45 μm and Optison was measured as 2.02 ± 1.37 μm. The mode diameter was 0.75 μm and 2.72 μm, respectively. The counted number of microbubbles was normalized to the maximum count of each population for comparison (Figure 1a). Volume percentage was also shown to indicate the gas volume distribution of these microbubble populations (Figure 1b). Figure 2(a) shows the singular value plot obtained from the acquisition data, which indicates the signal intensity associated with each movement (Demene et al. 2015), for the different sized microbubbles flowing in the microtube phantom. The singular value is displayed in dB scale. Figure 2(b–f) display one SVD filtered image for each microbubble size. For easier comparison, filtered images were normalized to the maximum intensity of the B mode images from reference data. It can been clearly seen that for our house-made microbubbles and Definity, the microbubble signal increases as the mean diameter becomes larger, while Optison does not hold to this trend, and actually performs poorer than the 2.0 micron lipid shelled formulation, despite having a similar mean diameter. Figure 3 displays the final SR image for each microbubble population, after accumulating all the center position of detected microbubble events from all the 8,000 SVD filtered images. The number of detected events was counted and normalized to the number of events detected from the microbubble population of 1.09 μm (Figure 3(c)) to indicate the sensitivity of the imaging in each case. The two larger microbubble populations of 1.28 μm and 2.00 μm result in an event number increase of 5.7 fold and 7.2 fold, respectively, when compared with the microbubble population of 1.09 μm, while Definity and Optison results in 0.003 fold and 1.6 fold. Figure 3 demonstrates that when excluding Optison, the imaging sensitivity increases with microbubble size and the largest examined microbubble distribution leads to the final SR image with the best sensitivity.
Figure 1.
Size distribution of microbubbles used for in vitro experiments: (a) Number of microbubbles of each size. Values were normalized to the maximum count for comparison. (b) Volume percentage of each size.
Figure 2.
In vitro results: singular value plot (a) and SVD filtered images (b-f) for commercial Definity, Optison and house-made microbubbles with mean diameter of 1.09 μm, 1.28 μm and 2.00 μm, respectively. SVD filter order used was marked as solid circles on the singular value plot (a). SVD filtered images (b-f) were normalized to the maximum intensity of B mode images from reference data. The dynamic range was 20 dB.
Figure 3.
In vitro results: resulting SR images for Definity (a), Optison (b) and the three house-made different sized microbubbles (c-e). The number of detected events was normalized to the number of events detected from the microbubbles of 1.09 μm (c) and displayed on each SR image (a-e).
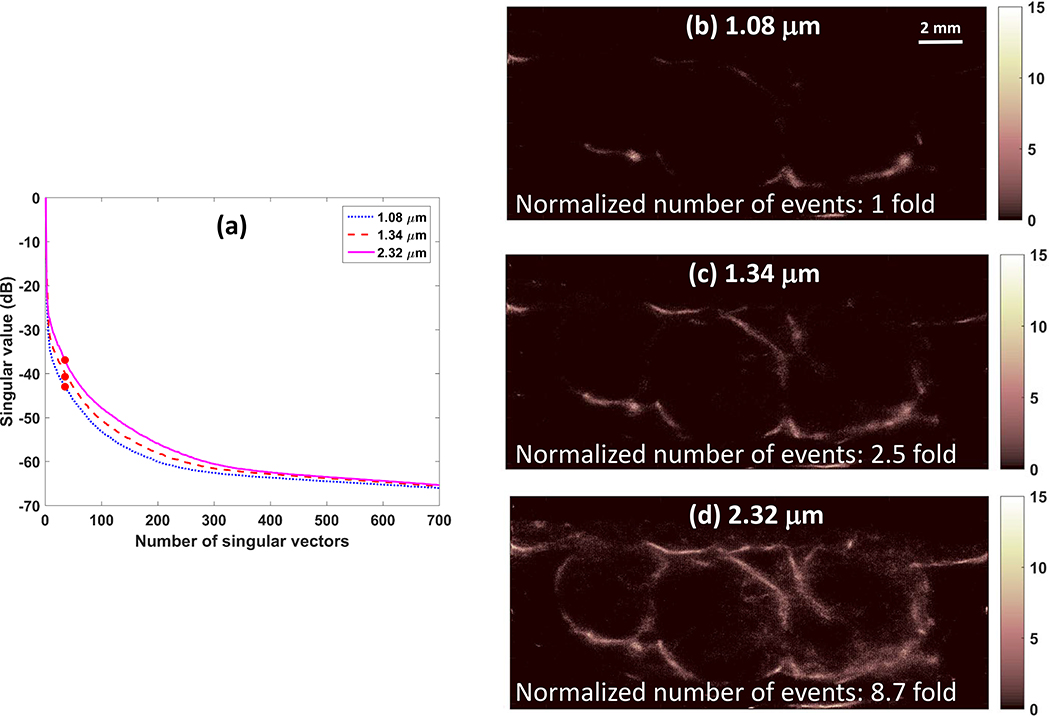
For in vivo experiments on a rat FSA tumor, the diameter of the three examined microbubbles was 1.08 ± 0.83 μm, 1.34 ± 0.47 μm and 2.32 ± 0.94 μm, respectively. The mode diameter was 1.18 μm, 1.38 μm and 2.72 μm, respectively. Figure 4 presents the singular value plot, the normalized number of detected microbubble events and final SR images for the three microbubble sizes. In vivo results agree with the in vitro results that the SR imaging sensitivity increases with the microbubble mean diameter. The imaging sensitivity increase was 2.5 fold and 8.7 fold for the two larger microbubble populations.
Figure 4.
In vivo results: singular value plot (a) and resulting SR images (b-d) for microbubbles with mean diameter of 1.08 μm, 1.34 μm and 2.32 μm, respectively. SVD filter order used was marked as solid circles on the singular value plot (a). The number of detected events was normalized to the number of events detected from the microbubble population of 1.08 μm (b) and displayed on each SR image (b-d).
Discussion and Summary
Data presented demonstrate that microbubbles with a larger mean diameter can substantially improve the sensitivity of super-resolution imaging to small vessels without increasing the administered contrast agent concentration. Microbubbles with larger mean diameter and the same concentration lead to larger volume of gas and larger cross section. This is in agreement with our studies which have shown that larger bubbles can also provide improved signal in ultrasound molecular imaging, another application where detection of low numbers of contrast agents is crucial (Streeter et al. 2010).
Lipid shelled microbubbles made and size sorted in-house were used in our experiments. The imaging frequency was at 9 MHz, which corresponds to the resonant frequency of microbubbles with mean diameter of 1.1 microns (Talu et al. 2007). In other words, microbubbles with mean diameter higher than 1.1 microns correspond to resonant frequencies lower than 9 MHz. In our experiments, they were driven off-resonance but scattered stronger signals, resulting from the substantially larger scattering cross section.
Commercial FDA approved Definity and Optison were also examined for comparison. Definity reports a mean diameter of 1–3 microns (LantheusMedicalImaging 2016), and Optison reports an average diameter listed as 3–4.5 microns (GE Healthcare 2012). However, the size measured by our Accusizer system was smaller than the reported size. This may be because the Accusizer system is sensitive to bubbles below 1 micron and thus the average diameter may be less than if commercial product reagents were made with an alternate sizing system, such as the traditionally used Coulter Counter (Brea, CA), which cannot resolve microbubbles less than 1 micron (when using the 50 micron aperture), or optical microscopy based counting and sizing, which is similarly challenged to resolve bubbles below 1 micron. However, it is unknown what method of sizing the commercial manufacturers used. Definity has lipid shell and the mean diameter was measured as 0.86 μm, smaller than all the other house-made lipid shell microbubbles. Correspondingly, the scattered signal was observed to be the weakest. Optison has an albumin shell and the size distribution has multiple main peaks, different from all the other tested microbubbles having only one main peak. Our observations reported that although Optison had a similar mean diameter as the largest lipid shell microbubbles tested (~2 microns), the performance was similar to that of smaller lipid shell microbubbles. This weaker echogenicity for Optison compared to lipid shell microbubbles with matched gas volume has been previously reported (Hyvelin et al. 2017), leading one to hypothesize that the shell material plays a role in this case. The difference may be due to differences in bubble stability due to the shell, (and thus the presence of intact bubbles persisting in the acoustic field), or due to the role of the shell in damping the echo. Further studies would need to be done to identify the mechanism.
Prior studies by Sirsi et al. (Sirsi et al. 2010) have demonstrated the ability to sort lipid shelled microbubble populations up to 6–8 microns and use these agents in mice in-vivo without noted complications, so such large bubbles would also be worth studying in the future.
Acknowledgements
This work was supported by grants R01CA170665, R01CA189479, R44CA165621, and F31CA196216 from the National Institutes of Health.
References
- Betzig E, Patterson GH, Sougrat R, Lindwasser OW, Olenych S, Bonifacino JS, Davidson MW, Lippincott-Schwartz J, Hess HF. Imaging intracellular fluorescent proteins at nanometer resolution. Science 2006;313:1642–1645. [DOI] [PubMed] [Google Scholar]
- Borden MA, Longo ML. Dissolution behavior of lipid monolayer-coated, air-filled microbubbles: Effect of lipid hydrophobic chain length. Langmuir 2002;18:9225–9233. [Google Scholar]
- Christensen-Jeffries K, Browning RJ, Tang M-X, Dunsby C, Eckersley RJ. In vivo acoustic super-resolution and super-resolved velocity mapping using microbubbles. IEEE Trans Med Imaging 2015;34:433–440. [DOI] [PubMed] [Google Scholar]
- Demene C, Deffieux T, Pernot M, Osmanski B-F, Biran V, Franqui S, Correas J-M, Cohen I, Baud O, Tanter M. Spatiotemporal clutter filtering of ultrafast ultrasound data highly increases Doppler and fUltrasound sensitivity. IEEE Trans Med Imaging 2015;34:2271–85. [DOI] [PubMed] [Google Scholar]
- Desailly Y, Couture O, Fink M, Tanter M. Sono-activated ultrasound localization microscopy. Appl Phys Lett 2013;103:174107. [Google Scholar]
- Errico C, Pierre J, Pezet S, Desailly Y, Lenkei Z, Couture O, Tanter M. Ultrafast ultrasound localization microscopy for deep super-resolution vascular imaging. Nature 2015;527:499–502. [DOI] [PubMed] [Google Scholar]
- Feingold S, Ryan G, Ismayil MG, Dayton PA. Quantitative volumetric perfusion mapping of the microvasculature using contrast ultrasound. Invest Radiol 2010;45:669–674. [DOI] [PMC free article] [PubMed] [Google Scholar]
- Feshitan JA, Chen CC, Kwan JJ, Borden MA. Microbubble size isolation by differential centrifugation. J Colloid Interface Sci Elsevier Inc., 2009;329:316–324. [DOI] [PubMed] [Google Scholar]
- GE Healthcare. Optison prescribing information. 2012;
- Huang B, Babcock H, Zhuang X. Breaking the diffraction barrier: Super-resolution imaging of cells. Cell 2010;143:1047–1058. [DOI] [PMC free article] [PubMed] [Google Scholar]
- Hyvelin J-M, Gaud E, Costa M, Helbert A, Bussat P, Bettinger T, Frinking P. Characteristics and Echogenicity of Clinical Ultrasound Contrast Agents: An In Vitro and In Vivo Comparison Study. J Ultrasound Med 2017;941–953. [DOI] [PubMed] [Google Scholar]
- Kabalnov A, Bradley J, Flaim S, Klein D, Pelura T, Peters B, Otto S, Reynolds J, Schutt E, Weers J. Dissolution of multicomponent microbubbles in the bloodstream: 2. Experiment. Ultrasound Med Biol 1998;24:751–760. [DOI] [PubMed] [Google Scholar]
- Kaya M, Feingold S, Streeter J, Hettiarachchi K, Lee AP, Dayton PA. Acoustic characterization of individual monodisperse contrast agents with an optical-acoustical system. IEEE Int Ultrason Symp 2009;1813–1816. [Google Scholar]
- LantheusMedicalImaging. Prescribing Information for Definity. 2016.
- Lin F, Rojas JD, Dayton PA. Super resolution contrast ultrasound imaging: Analysis of imaging resolution and application to imaging tumor angiogenesis. IEEE Int Ultrason Symp 2016;1–4. [Google Scholar]
- Lin F, Shelton SE, Espíndola D, Rojas JD, Pinton G, Dayton PA. 3-D Ultrasound Localization Microscopy for Identifying Microvascular Morphology Features of Tumor Angiogenesis at a Resolution Beyond the Diffraction Limit of Conventional Ultrasound. Theranostics 2017;7:196. [DOI] [PMC free article] [PubMed] [Google Scholar]
- O’Reilly MA, Hynynen K. A super-resolution ultrasound method for brain vascular mapping. Med Phys 2013;40:110701. [DOI] [PMC free article] [PubMed] [Google Scholar]
- Rieger H, Fredrich T, Welter M. Physics of the tumor vasculature: Theory and experiment. Eur Phys J Plus 2016;131:1–12. [Google Scholar]
- Rust MJ, Bates M, Zhuang XW. Sub-diffraction-limit imaging by stochastic optical reconstruction microscopy (STORM). Nat Methods 2006;3:793–795. [DOI] [PMC free article] [PubMed] [Google Scholar]
- Sirsi S, Feshitan J, Borden M, Homma S. High-frequency ultrasound imaging of size-isolated microbubbles in mice. IEEE Int Ultrason Symp 2009;271–274. [Google Scholar]
- Sirsi S, Feshitan J, Kwan J, Homma S, Borden M. Effect of microbubble size on fundamental mode high frequency ultrasound imaging in mice. Ultrasound Med Biol 2010;36:935–948. [DOI] [PMC free article] [PubMed] [Google Scholar]
- Streeter JE, Gessner R, Miles I, Dayton PA. Improving Sensitivity in Ultrasound Molecular Imaging by Tailoring Contrast Agent Size Distribution: In Vivo Studies. Mol Imaging 2010;9:87–95. [PMC free article] [PubMed] [Google Scholar]
- Talu E, Hettiarachchi K, Zhao S, Powell RL, Lee AP, Longo ML, Dayton PA. Tailoring the size distribution of ultrasound contrast agents: Possible method for improving sensitivity in molecular imaging. Mol Imaging 2007;6:384–392. [PMC free article] [PubMed] [Google Scholar]


