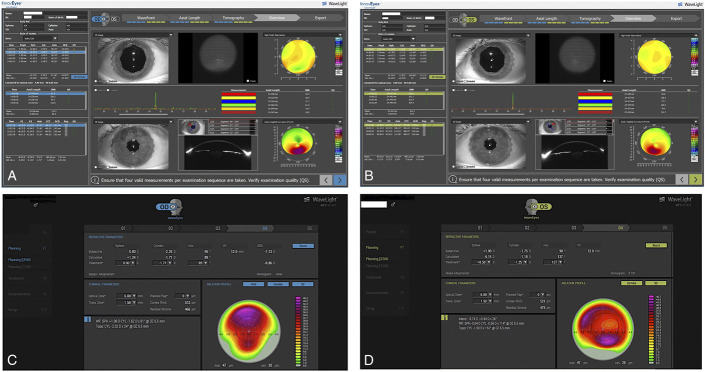
FIGURE 1.
The Sitemap diagnostic device summary display of measurements captured for the OD (A) and the OS (B): wavefront data in the top row of images, interferometry axial length data in the middle, and tomography data in the bottom. The InnovEyes treatment interface summary display for the OD (C) and the OS (D): In both (C, D) images, first line shows the subjective refraction, middle line the calculated refraction by the software, and bottom line the adjusted treatment used for the customized surface ablation. We manually chose to treat less hyperopia than the manifest refraction and that calculated by the device because we anticipated from long experience with the Athens protocol technique that the 40-μm PTK would induce a myopic shift.

