

Abstract
The reciprocal parent of origin-specific expression of H19 and IGF2 is controlled by the H19/IGF2:IG-DMR (IC1), whose maternal allele is unmethylated and acts as a CTCF-dependent insulator. In humans, internal IC1 deletions are associated with Beckwith–Wiedemann syndrome (BWS) and Silver-Russell syndrome (SRS), depending on their parental origin. These genetic mutations result in aberrant DNA methylation, deregulation of IGF2/H19 and disease with incomplete penetrance. However, the mechanism linking the microdeletions to altered molecular and clinical phenotypes remains unclear. To address this issue, we have previously generated and characterized two knock-in mouse lines with the human wild-type (hIC1wt) or mutant (hIC1∆2.2) IC1 allele replacing the endogenous mouse IC1 (mIC1). Here, we report an additional knock-in line carrying a mutant hIC1 allele with an internal 1.8 kb deletion (hIC1∆1.8). The phenotype of these mice is different from that of the hIC1∆2.2-carrying mice, partially resembling hIC1wt animals. Indeed, proper H19 and Igf2 imprinting and normal growth phenotype were evident in the mice with maternal transmission of hIC1Δ1.8, while low DNA methylation and non-viable phenotype characterize its paternal transmission. In contrast to hIC1wt, E15.5 embryos that paternally inherit hIC1Δ1.8 displayed variegated hIC1 methylation. In addition, increased Igf2 expression, correlating with increased body weight, was found in one third of these mice. Chromatin immunoprecipitation experiments in mouse embryonic stem cells carrying the three different hIC1 alleles demonstrate that the number of CTCF target sites influences its binding to hIC1, indicating that in the mouse, CTCF binding is key to determining hIC1 methylation and Igf2 expression.
Introduction
Genomic imprinting is an epigenetic process causing monoallelic and parent-of-origin-dependent expression of a small subset of mammalian genes. Imprinted genes play a key role in the development of mammals, and most of them are organized in clusters. Usually, an Imprinting Control Region (ICR or IC) regulates the differential expression of the genes of the cluster. ICs are 2–5 kb-long genomic sequences displaying differential DNA methylation between their maternal and paternal alleles. IC methylation is established during gametogenesis, and maintained throughout development, despite extensive demethylation occurring in the embryonic genome before implantation, and de novo methylation occurring after implantation (1). Proper methylation of the ICs is required for correct imprinting of the gene cluster. A number of oocyte and zygotic factors are involved in the processes of de novo methylation and maintenance of differential methylation of the ICs in the gametes and early embryo (2). In humans, aberrant IC methylation as well as uniparental disomy, genetic mutations and copy number variants affecting imprinted loci are associated with several diseases characterized by disturbances of growth, metabolism and behavior that are globally classified as Imprinting Disorders.
The imprinted domain harboring the H19 and Insulin-like growth factor 2 (Igf2) genes maps to the mouse distal chromosome 7 and is orthologous with the telomeric domain of the human chromosome 11p15.5 cluster (3). The Igf2 gene is expressed from the paternal allele and encodes a protein promoting fetal growth (4). The H19 gene is expressed from the maternal allele and encodes a long non-coding RNA with growth inhibitory properties (5). The H19 RNA also releases miR-675 late in gestation to suppress the growth of the placenta just before birth (6). The reciprocal imprinting of Igf2 and H19 is regulated by an ICR (also known as H19/IGF2:IG-DMR or IC1 in humans) that is methylated on the paternal chromosome. The unmethylated maternal IC1 allele interacts with the CCCTC-binding factor (CCTF), thus generating an insulator that through long-range chromosome interactions interferes with the access of the Igf2 promoter to enhancers that are located downstream of H19 (7). Methylation of the paternal IC1 inhibits CTCF binding and insulator function, allowing interaction of the enhancers with the Igf2 but not with the H19 promoter, which instead acquires DNA methylation during development. This results in transcriptional activation of H19 and silencing of Igf2 on the maternal chromosome, and Igf2 activation and H19 silencing on the paternal chromosome (8,9).
In humans, deregulation of the H19 and IGF2 genes is associated with two imprinting disorders, Beckwith–Wiedemann syndrome (BWS, MIM #130650) and Silver–Russell syndrome (SRS, MIM #180860), which are characterized by somatic overgrowth and undergrowth, respectively. Opposite DNA methylation defects can be found at IC1 in BWS and SRS patients. Gain of methylation (GOM) of the maternal allele and loss of methylation (LOM) of the paternal allele cause reciprocal changes of H19 and IGF2 expression in BWS and SRS, respectively (10,11). Also, IC1 GOM represents the molecular defect of BWS with the highest risk of developing Wilms tumors (12). Although most of the cases with IC1 methylation defects are sporadic, rare familial cases in which internal IC1 deletions are associated with aberrant DNA methylation and H19/IGF2 deregulation have been described (13–19). It has been proposed that these deletions alter the binding of proteins preventing DNA methylation, such as CTCF, on the maternal allele, and the binding of proteins maintaining DNA methylation, such as ZFP57, on the paternal allele (15). Nevertheless, the mechanism linking these genetic defects with the altered molecular and clinical phenotypes has not yet been demonstrated.
Although the function of IC1 appears well conserved, its DNA sequence is very different in the human and mouse species. While the human IC1 (hIC1) contains seven CTCF target sites (CTSs) included in repetitive sequences overall spanning about 5 kb, the mouse IC1 (mIC1) is shorter (about 2 kb), non-repetitive and contains only four CTSs (3) (Fig. 1A). Also, the number of the ZFP57 target sites (ZTSs) differs between hIC1 and mIC1, with the former harboring 12 ZTSs and the latter only six (Fig. 1A).
Figure 1 .

Generation of the hIC1∆1.8 allele. (A) From the top: the mouse H19 endogenous locus, the targeting vector (pH19hIC1∆1.8-neo), the correctly targeted allele with the neomycin resistance cassette (H19hIC1∆1.8-neo), the targeted allele after neoR excision (H19hIC1∆1.8) and the targeted wild-type human allele (H19hIC1). The white rectangle depicts IC1 with the CTCF binding sites (vertical lilac bars) and ZFP57 target sites (purple circles), H19 exons (gray rectangles), neoR cassette (yellow rectangle), loxP sites (black arrowheads); pBluescriptIIKS vector with the human insert flanked by the mouse sequences (outlined with dashed blue lines) used as arms for the homologous recombination. Restriction sites and their relative positions (in kb) to the H19 transcription start site are also indicated. The probes (A and B) used for Southern blot screening are indicated as green lines below the endogenous locus and the PCR primers used for confirming neoR excision are indicated with green arrows. (B) Southern blot analysis confirming the targeting of the mutant IC1 allele was carried out on EcoRV digested wild-type (+/+) and targeted (+/hIC1Δ1.8-neo) ES cell DNA hybridized to the probe A (lying 5′ of the targeting arm) or on StuI digested DNA hybridized to the probe B (lying 3′ of the targeting arm). (C) Correctly Cre-mediated excision of neoR was confirmed by a PCR product of 550 bp from F1 mice (hIC1Δ1.8/cre) and F2 (hIC1Δ1.8/+), while no amplification was assessed for mice with the neoR cassette.
To clarify the role of hIC1 mutations in the origin of imprinting defects, we have previously generated and characterized two knock-in (KI) mouse lines in which the murine IC1 (mIC1) is replaced by the orthologous human sequence in either wild-type (hIC1wt) or mutant (hIC1Δ2.2) form. In the latter case, the IC1 allele carrying a 2.2 kb deletion found in a BWS family was chosen (17). The mice carrying the hIC1wt allele showed normal IC1 methylation, H19 and Igf2 expression and growth phenotype on maternal transmission, but disrupted imprinting, severe growth restriction and a non-viable phenotype on paternal transmission (20). Conversely, the mice carrying the hIC1 Δ2.2 allele were viable, but with tissue-specific and mosaic imprinting alterations and pre/post-natal overgrowth on maternal transmission and undergrowth on paternal transmission. To further investigate the mechanism causing such unexpected behavior of the human IC1 alleles in the mouse context, we have now generated and characterized an additional humanized mouse line carrying an hIC1 allele with an internal 1.8 kb deletion, which was found in another familial BWS case (13). The comparison of this line with the previous lines indicates that in the mouse context the number of CTSs of hIC1 is crucial for the maintenance of imprinting at the Igf2/H19 locus.
Results
Generation of the hIC1Δ1.8 line
To better understand the molecular mechanisms linking epimutations and clinical phenotype with hIC1 sequence, we extended our previous studies by generating a new humanized mouse line, in which the endogenous mIC1 was replaced with a mutant hIC1 allele carrying the deletion of 1.8 kb that was previously found in a familial BWS case (13) (Fig. 1; see also Materials and Methods). Once the germ line transmission of the KI was established, we crossed heterozygous KI (having C57BL/6 background) with wild-type Balb/C mice and typed polymorphic sites in the F1 hybrid progeny to distinguish the parental origin of the H19 and Igf2 alleles in all molecular analyses. Wild-type littermates were used as control animals.
Maternal transmission of the hIC1Δ1.8 allele does not affect growth and H19/Igf2 imprinting.
To determine the effect of the hIC1Δ1.8 allele on somatic growth, we measured the weight of the progeny of H19hIC1Δ1.8/+ × H19+/+ mice (conventionally, the order of the alleles of the genotype is: maternal/paternal) at different developmental stages (Fig. 2). Comparable weights of body and placenta were found in KI mice and their wild-type littermates at embryonic day 15.5 (E15.5, Fig. 2A), birth (P1, Fig. 2B) and postnatally until 14 weeks of age (Fig. 2C). Also, the weights of kidney, liver and tongue of adult KI and wild-type mice did not show any statistically significant difference (Fig. 2D).
Figure 2 .

Normal somatic growth on maternal transmission of the hIC1Δ1.8 allele. Box plots of weights of (A) E15.5 embryo body and placenta and (B) newborn (P1) mice, (C) growth chart and (D) box plots of organ/whole animal weights of mice at 14 weeks of age. Box plots display the full range of variation (from minimum to maximum value), the likely range of variation (the first and third quartiles), and the median (the horizontal bar within box). Values in brackets indicate the number of animals derived from three litters of 6–8 pups each, and analyzed in the present study. P = P-value calculated by two-tailed Student’s T-test. In (C) the growth chart represents the ratio between weights of H19hIC1Δ1.8/+ and H19+/+ mice of three litters. Bars represent the mean ± SEM. In (D) the box plots represent the relative values of organ weight/whole animal weight ratios, obtained by arbitrarily setting the median value of H19+/+ as 1.
Gene expression and DNA methylation of the H19/Igf2 locus were analyzed in the body and placenta of E15.5 embryos, as well as liver, kidney and tongue of P1 mice. We found that the H19hIC1Δ1.8/+ mice had total (Fig. 3A and Supplementary Material, Fig. S1A) and allele-specific (Fig. 3B and Supplementary Material, Fig. S1B) expression of H19 and Igf2 similar to their H19+/+ littermates in all the analyzed tissues. DNA methylation of two CTCF target sites, CTS1 and CTS6, found exclusively in the human sequences on the maternal chromosome, was tested by pyrosequencing of bisulfite-converted DNA. Similar to the endogenous maternal mIC1, very low methylation levels (1–6%) were detected in both E15.5 and P1 tissues (Fig. 3C, Supplementary Material, Figs S1C and S2A). Low methylation was detected also at CTS1 and CTS6 (0 and 8%, respectively) in oocytes of the H19hIC1Δ1.8/+ females (Fig. 3D and Supplementary Material, Fig. S2B).
Figure 3 .

Expression and DNA methylation analysis in H19hIC1Δ1.8/+ mice. (A) Histograms of total H19 and Igf2 expression in neonatal liver, embryo body and placenta at E15.5 of H19hIC1Δ1.8/+ and H19+/+ littermates analyzed by RT-qPCR. (B) Allele-specific expression of H19 and Igf2. Dots indicate the percent expression of the maternal allele in each sample. (C) Graphs of DNA methylation analysis at IC1 in H19hIC1Δ1.8/+ mice. Percent of DNA methylation measured by pyrosequencing at two CTCF target sites (CTS1 and CTS6) in P1 liver, E15.5 embryo body and placenta, collected from H19hIC1Δ1.8/+ mice. Each histogram represents the mean value of the methylation level of 5 (CTS 1) or 6 (CTS 6) CpGs, tested in H19hIC1Δ1.8/+ (n = 11/9) and H19+/+ (n = 6/11) mice. On the bottom, schematic representation of the humanized and the endogenous IC1: the black bars indicate the analyzed region (see Supplementary Material, Figure S2 for the endogenous control values). A shaded pink box indicates the deleted region of H19hIC1∆1.8. For other details, see legend to Figure 1A. (D) Percent methylation measured by pyrosequencing at CTS1 and CTS6 in a pool of oocytes collected from four H19hIC1Δ1.8/+ females. Values in brackets indicate the number of analyzed animals in these experiments; they derived from three litters of 6–8 pups each. NS, Not Significant. Bars represent the mean ± SEM.
Paternal transmission of the hIC1Δ1.8 allele is embryonic lethal and results in Igf2 down-regulation and loss of H19 imprinting
We then investigated the effect of paternal transmission of the hIC1Δ1.8 allele. We observed that in 10 litters derived from H19+/+ × H19hIC1Δ1.8/+ breedings, the number of live pups/litter was reduced to about 50% that of maternal transmission, and only wild-type live-born mice were found, suggesting that paternal transmission of the hIC1Δ1.8 allele was embryonic lethal. Consistent with this hypothesis, we found that when analyzed at E15.5, viable H19+/hIC1Δ1.8 and H19+/+ embryos were observed in similar proportion. A severe growth deficiency of the H19+/hIC1Δ1.8 conceptuses, however, was noted in these mice. The weight of their body and placenta was significantly lower (~25 and ~30%, respectively) than those of H19+/+ littermates (Fig. 4).
Figure 4 .
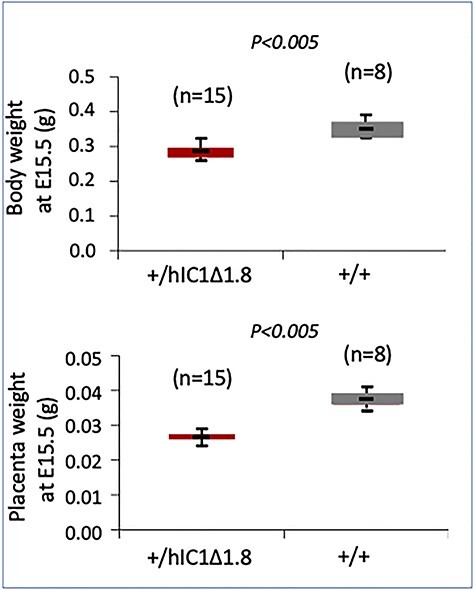
Growth restriction on paternal transmission of the hIC1Δ1.8 allele. Box plots of embryo body and placenta weights at E15.5. The analyzed animals derived from three litters of 6–8 pups each. See also legend to Figure 2.
Total and allele-specific gene expression of the H19 and Igf2 genes were performed on body and placenta of the H19+/hIC1Δ1.8 and H19+/+ conceptuses at E15.5. Total H19 expression was increased in body and placenta of the H19+/hIC1Δ1.8 embryos (Fig. 5A). Conversely, Igf2 expression was strongly decreased in both body and placenta of the H19+/hIC1Δ1.8 line (Fig. 5A). Analysis of allele-specific expression demonstrated comparable levels of the maternal and paternal H19 alleles in these tissues (40–50% pat/mat + pat), indicating complete loss of H19 imprinting, in H19+/hIC1Δ1.8 conceptuses (Fig. 5B). In contrast, Igf2 imprinting was normal and only its paternal allele was expressed, although at a lower level.
Figure 5 .

Expression and DNA methylation analysis in H19+/hIC1Δ1.8 mice at E15.5. (A) Histograms of total H19 and Igf2 expression in E15.5 embryo body and placenta of H19+/hIC1Δ1.8 and H19+/+ littermates analyzed by RT-qPCR. (B) Allele-specific expression of H19 and Igf2. Dots indicate the percent expression of the paternal allele in each individual sample. (C) DNA methylation analysis at CTS1 and CTS6 of embryo body and placenta collected from H19+/hIC1Δ1.8 conceptuses. See also legend to Figure 3. (D) Top: percent methylation measured by pyrosequencing at CTS1 and CTS6 in a pool of male germ cells collected from two H19hIC1Δ1.8/+ males. Bottom: the same regions were also analyzed by bisulphite treatment followed by cloning and sequencing. Each line corresponds to a single template DNA molecule cloned; each circle corresponds to a CpG dinucleotide. Filled circles designate methylated cytosines; open circles, unmethylated cytosines.
hIC1 methylation was then analyzed in the H19+/hIC1Δ1.8 conceptuses by pyrosequencing. Methylation levels of hIC1 detected in body (CTS1 = 10%, CTS6 = 8%) and placenta (CTS1 = 14%, CTS6 = 13%) of the analyzed embryos were on average much lower than that of the endogenous paternal mIC1 (100%) (Fig. 5C and Supplementary Material, Fig. S2A). When sperm of adult H19hIC1Δ1.8/+ mice was investigated, methylation levels were lower at hIC1 (CTS1 = 45%, CTS6 = 38%; Fig. 5D, top) than at the endogenous mIC1, which was fully methylated (Supplementary Material, Fig. S2B, lower panel). Incomplete hIC1 methylation in sperm of these mice was confirmed by bisulfite treatment followed by cloning and sequencing (Fig. 5D, bottom). These results indicate that DNA methylation of the hIC1Δ1.8 allele is properly established only in about one third of the male germ cells during spermatogenesis.
Variegated hIC1 methylation and Igf2 expression in H19+/hIC1Δ1.8 embryos
Although the average hIC1 methylation was very low in H19+/hIC1Δ1.8 embryos, we observed a strong heterogeneity among individual animals (Fig. 6A and B). Within the 15 individuals analyzed, 10 showed levels <5%, while five (#4, #5, #9, #10, #11) had relatively higher methylation levels in both body (20–35%) and placenta (20–40%). Interestingly, increased Igf2 but similar H19 expression was found in the samples (#4, #5, #9, #10, #11) with higher methylation values, particularly in placenta (Fig. 6C and D). Also, CTS1/CT6 methylation and Igf2—but not H19—expression were directly correlated with body weight in E15.5 embryos (Fig. 6E and Supplementary Material, Fig. S3).
Figure 6 .

DNA methylation and expression analysis at the H19/Igf2 locus in individual samples of H19+/hIC1Δ1.8 mice at E15.5. (A and B) DNA methylation of CTS1 and CTS6 and (C and D) Igf2 and H19 expression levels in individual embryos. Bars represent the mean ± SEM of three technical replicates of the same sample. (E) Plots of the Pearson’s linear correlation coefficients between all pairs of the following parameters: body weights, methylation of CTS1 and CTS6, total expression of Igf2. Each dot represents the values of each mouse relative to the mean of its own litter. The red circle includes the animals with higher methylation values (#4, #5, #9, #10, #11). The trend line and the ρ coefficient of Pearson correlation are shown in each plot.
Differential CTCF binding at hIC1 alleles in mouse ES cells
To get further insights into the mechanism of DNA methylation maintenance at hIC1, we analyzed the binding of CTCF and ZFP57 to the hIC1Δ1.8 allele by chromatin immunoprecipitation in mouse ES cells (ESCs), and compared it with the binding of these proteins to hIC1wt and hIC1Δ2.2. The amount of a DNA fragment (CTS1) that is unaffected by the deletions was measured by quantitative real-time PCR in the immunoprecipitated DNA. We found that CTCF was about 50% less enriched on CTS1 in the ESCs carrying the hIC1Δ2.2 allele compared to the ESCs carrying the hIC1Δ1.8 or the hIC1wt alleles (Fig. 7A). Conversely, no difference was observed in CTCF binding at the endogenous mIC1, Plagl1 and Gapdh loci, nor in ZFP57 and H3K4me3 enrichment at these loci, in the three ESC lines carrying the different hIC1 alleles. Comparable levels (20–25%) of CTS1 methylation was demonstrated in the three ESC lines, thus excluding that the difference in CTCF binding was caused by differential DNA methylation acquired during cell culture (Fig. 7B).
Figure 7 .

CTCF binding to the three hIC1 alleles in mouse ESCs. (A) ChIP analysis of CTCF, H3K4me3 and ZFP57 enrichment at CTS1 of the hIC1 transgenes and at the endogenous IC1 (mIC1), Plagl1 and Gapdh loci. The last two loci were analyzed as positive and negative controls, respectively. (B) Percent methylation at CTS1 of the hIC1 transgenes (hIC1-CTS1) and at the endogenous IC1(mIC1), as measured by pyrosequencing. Bars represent the mean ± SD.
Discussion
In BWS and SRS, IC1 imprinting defects may arise as primary epigenetic mutation or as consequence of an internal deletion. The latter mechanism is less frequent, but is characterized by higher recurrence risk (14,21). We have previously suggested that the penetrance and expressivity of the clinical phenotype associated with internal IC1 deletions are influenced by their parental origin, as well as by the transcription factor binding sites and their arrangement affected by the mutation (15). However, the molecular mechanisms underlying hIC1 hyper- and hypo-methylation remain undemonstrated and the relationship between IC1 mutations and epimutations and clinical phenotypes still far from being completely understood (11,22). To increase our understanding of this issue, we have generated a number of humanized mouse lines, in which the orthologous human wild-type or mutant IC1 sequence replaced the endogenous locus. In the present study, we report the characterization of a second mutant line, hIC1 Δ1.8, which carries a smaller hIC1 deletion and lacks two CTSs instead of three, with respect to the previously described hIC1Δ2.2 (Fig. 8A). Overall, the phenotype of the hIC1 Δ1.8 mice was found intermediate between that of the hIC1wt and hIC1 Δ2.2 lines, suggesting that in the mouse context the number of CTCF binding sites has a crucial role in maintenance of hIC1 methylation and H19/Igf2 expression.
Figure 8 .
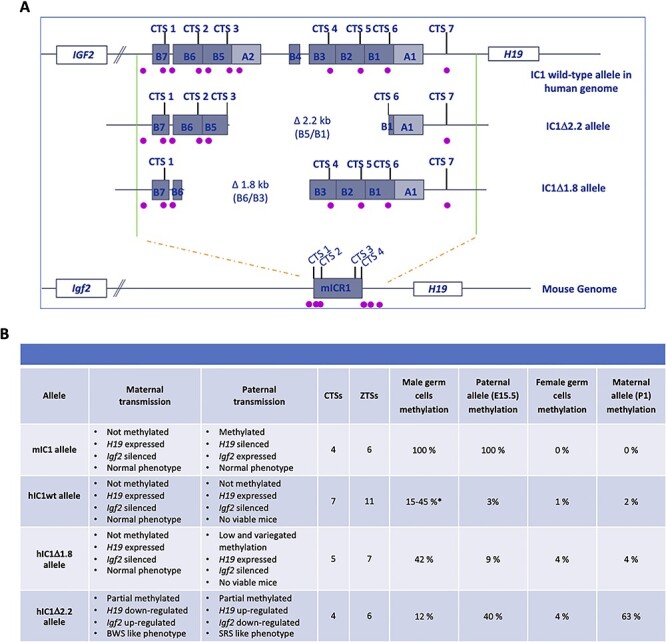
Summary of the characteristics and properties of the endogenous (mIC1) and humanized (hIC1wt, hIC1∆2.2 and hIC1∆1.8) IC1 alleles. (A) Schematic representation showing the organization of the wild-type and mutant human and mouse IC1, with indication of A-type and B-type repeats, CTSs and ZTSs (purple dots). (B) Table summarizing the molecular and phenotypic characteristics of the human and mouse IC1 alleles. *The methylation levels of the hIC1wt mice derive from two different studies (20,23).
On maternal transmission, the phenotype of the hIC1∆1.8 mice is similar to that of hIC1wt. Both the hIC1∆1.8 and hIC1wt lines showed proper H19/Igf2 imprinting and normal pre/postnatal growth (20). Conversely, the hIC1Δ2.2 line showed partial gain of methylation, increased Igf2 and decreased H19 expression and pre- and post-natal overgrowth. (Fig. 8B) (23). On paternal transmission, both hIC1∆1.8 and hIC1wt mice are characterized by IC1 hypomethylation and severe growth restriction, and are not viable (Fig. 8B). However, the imprinting defect of hIC1∆1.8 is less dramatic than that of hIC1wt. In one third of the animals inheriting the hIC1∆1.8 allele from their father, IC1 methylation was relatively higher and Igf2 expression not completely silenced as in the hIC1wt line. Consistent with this finding, growth restriction was less severe in the pat hIC1∆1.8 than in the pat hIC1wt mice, although probably not enough to be compatible with post-natal life. As proposed for the hIC1wt line (20), it is likely that increased H19 coupled with lower Igf2 expression is responsible for the lethal phenotype of the H19+/hIC1Δ1.8 mice. In contrast to hIC1∆1.8 and hIC1wt, paternal transmission of the hIC1Δ2.2 allele is associated with partial IC1 methylation, decreased Igf2, increased H19 and pre/post-natal growth restriction (Fig. 8B) (23).
The analysis of the gametes and embryos indicates that all the three humanized IC1 lines fail to properly acquire methylation in the male germline, but also that they differ in their competence to maintain it postzygotically. In all the three KI mouse lines, hIC1 was properly hypomethylated in oocytes but, contrary to the endogenous mouse locus, was methylated in a minority of sperm cells, indicating the inability of the human allele to properly establish DNA methylation in male germ cells (Fig. 8B). Conversely, the three hIC1 alleles showed a different capacity to maintain methylation after fertilization. While hIC1wt completely lost methylation on the paternal allele during development, hIC1∆1.8 partially maintained it in one third of the animals, and hIC1∆2.2 acquired mosaic methylation on both maternal and paternal alleles (Fig. 8B). The stronger CTCF binding to the hIC1wt and hIC1∆1.8 alleles compared to hIC1∆2.2 suggests that the number of CTSs is critical to control the level of hIC1 methylation during development, in the mouse context. However, we cannot exclude that other factors are involved in the control of de novo methylation and methylation maintenance of hIC1. Indeed, both the mouse and human IC1 harbor binding sites (one and three, respectively) (24) formed by single or multiple motifs recognized by the pluripotency factors OCT4 and SOX2 that have been demonstrated to cooperate with CTCF to maintain the unmethylated status of the maternal IC1 (25). Several point mutations affecting one of the OCT4/SOX2 binding sites within the human maternal IC1 are associated with IC1 GOM and BWS phenotype (26). Also, a small deletion disrupting a binding site formed by a single SOX2 motif has been identified in a BWS case with IC1 GOM (26). Since the OCT4 binding site is lost on both hIC1∆1.8 and hIC1∆2.2 alleles and the SOX2 binding site is lost in hIC1∆2.2 (15), it is possible that these factors in combination with CTCF influence the epigenetic status of the humanized IC1 alleles during mouse development.
In humans, the IC1∆1.8 mutation has been associated with higher penetrance of imprinting defects, BWS phenotype and increased risk of developing Wilms tumors compared to IC1∆2.2 (17) on maternal transmission, and proper methylation and imprinting and healthy phenotype on paternal transmission (17). This has led to the hypothesis that proper CTS spacing rather than the number of CTSs is relevant for imprinting maintenance. Instead, this study demonstrates that, at least in the mouse context, the number of CTSs seems crucial to control hIC1 methylation and H19/Igf2 imprinting, representing a further example of evolutionarily divergent imprinting mechanisms at the H19/Igf2 locus.
Materials and Methods
Targeting of the mIC1 locus and generation of the KI mice
In order to generate the hIC1Δ1.8 mouse line, we carried out gene targeting by homologous recombination in E14 embryonic stem (ES) cells to replace the endogenous mIC1 with a plasmid containing the hIC1Δ1.8 allele and neomycin resistance cassette (NeoR; Fig. 1A). A PciI-PciI restriction fragment of 440 bp in length, containing the break-point of the 1.8 kb deletion found in a BWS family (13), was excised from the EΔ1.8 (B5/B2)pL vector (17), and subcloned into the wild type hIC1 region already cloned in the Δ3.8 kb-5′ pre-targeting vector (27) by using the restriction enzyme PciI. The steps to obtain the targeting vector were performed as previously described (20,23). To confirm the correct targeting of ES clones, we performed Southern blot analysis of 5′ and 3′ arms, using two different probes (Fig. 1B). Injection into C57BL/6 (B6) blastocysts of the hIC1∆1.8-neo KI ES clones and generation of chimeras were obtained by Cogentech Facility S.c.a.r.l. (Milan, Italy). Chimeric mice were crossed to B6 mice. Germline transmission of the KI allele was detected in the agouti progeny by PCR-genotyping using primers flanking the deletion break point (hDMDdelF2: 5′-GTTCCCGAGGGTTGTCAGAGATAG-3′; hDMDdelRev: 5′-CCCGATGTGGCTCCCATGAATGTC-3′). The neoR cassette was excised by crossing heterozygous KI mice with pCX-NLS-Cre transgenic mice (28) on a B6 background. Excision was tested by PCR using primers flanking the neoR cassette (NeoEXL3: 5′-ACAGAATCGGTTGTGGCTGT-3′ H19SeqR1: 5′-CCACAGAGTCAGCATCCAC-3′) (Fig. 1C). KI mice were crossed with B6 mice and only the progeny carrying the KI and missing the Cre gene was used for further analysis. All animal experimentation was performed in accordance with the guidelines of the Animal Care and Use Committee of Campania University ‘Luigi Vanvitelli’ (Naples, Italy) and was authorized by the Italian Ministry of Health (Last two authorizations: 760/2016-PR and 178/2020-PR).
Molecular analyses
For extraction of nucleic acids, liver, kidneys and tongue were collected from the mice at birth (P1) and at 14 weeks of age. Total body (excluding the head) and placenta tissues were collected from conceptuses at 15.5 days post coitum (E15.5). Genomic DNA was isolated as previously described (23). Unfertilized oocytes were collected from four superovulated 8 week-old females and resuspended in 0.03% SDS, 10 mg glycogen, 10 mg proteinase K and 1× PBS to a final volume of 20 μl. The suspension was incubated at 37°C for 90 min followed by 15 min at 95°C and then used for DNA methylation analysis. Sperm cells were collected from two H19hIC1Δ1.8/+ males. Epididymis were separately immersed in PBS 1x (pH 7.6) and cut to let sperm cells flow out from the ducts. Cells were then filtered throughout cheesecloth to eliminate epididymal tissue fragments, centrifugated at 1500 × g for 30 min at 4°C, and incubated with a Somatic Cell Lysis Buffer (SCLB) [0.1% SDS, 0.5% Triton X-100 in DEPC-H2O] on ice for 30 min to eliminate possible contaminant somatic cells. Sperm cells were centrifugate at 800 × g for 15 min at 4°C. The pellet was washed twice with PBS 1× and genomic DNA was isolated as previously reported (23). About 2 mg were used for DNA methylation analysis.
Total and allele-specific gene expression and DNA methylation analyses were performed as previously described (23). Primers and PCR conditions are reported in Supplementary Material, Table S1. For the statistical analysis, data are reported as the mean ± standard error of the mean (SEM), unless otherwise indicated. The significance of the difference between two groups (KI, wild-type) was determined by two-tailed Student’s t-test with two-sample unequal variance. The number of animals analyzed, and biological or technical replicates are indicated in the figure legends. Differences with P-values ≤0.05 were considered significant. Pearson correlation was applied to calculate the correlation coefficient (ρ) measuring the strength of the relationship between the following pairs of parameters: body weights and CTS1/CTS6 methylation and H19/Igf2 expression. The value of the correlation coefficient varies between +1 and −1. A value of ±1 indicates a perfect degree of association between the two variables. As the correlation coefficient value goes towards 0, the relationship between the two variables will be weaker. The direction of the relationship is indicated by the sign of the coefficient; a + sign indicates a positive relationship and a − sign indicates a negative relationship.
Chromatin Immunoprecipitation (ChIP) was performed as previously described (29). The following conditions were used: for CTCF, 7 μg of Diagenode C15410210 for 100 μg of chromatin in 600 μl of shearing buffer; for H3K4me3, 7 μg of Abcam ab8895 for 100 μg of chromatin in 600 μl of shearing buffer; and for ZFP57, 8 μg of Abcam ab45341 for 100 μg of chromatin in 600 μl of shearing buffer. The rabbit control IgG ChIP-grade antibody (5 μg of Abcam ab46540-1) was used as a control in the ChIP. Q-PCR assays of locus-specific ChIP were performed in triplicate on ABI PRISM 7500 using the default cycling conditions. Primers used for ChIP are listed in Supplementary Material, Table S2. Each immunoprecipitated DNA was reported as percent of the input.
Supplementary Material
Acknowledgements
The authors thank the staff of the Animal facility of University of Campania ‘Luigi Vanvitelli’ for the valuable technical support.
Conflicts of Interest statement. The authors declare no conflict of interest.
Contributor Information
Andrea Freschi, Department of Environmental Biological and Pharmaceutical Sciences and Technologies (DiSTABiF), Università degli Studi della Campania “Luigi Vanvitelli”, Caserta 81100, Italy; Genetics and Epigenetics of Behaviour (GEB), Istituto Italiano di Tecnologia (IIT), Genova 16163, Italy.
Rosita Del Prete, Department of Environmental Biological and Pharmaceutical Sciences and Technologies (DiSTABiF), Università degli Studi della Campania “Luigi Vanvitelli”, Caserta 81100, Italy.
Laura Pignata, Department of Environmental Biological and Pharmaceutical Sciences and Technologies (DiSTABiF), Università degli Studi della Campania “Luigi Vanvitelli”, Caserta 81100, Italy.
Francesco Cecere, Department of Environmental Biological and Pharmaceutical Sciences and Technologies (DiSTABiF), Università degli Studi della Campania “Luigi Vanvitelli”, Caserta 81100, Italy; Institute of Genetics and Biophysics (IGB) “Adriano Buzzati-Traverso”, Consiglio Nazionale delle Ricerche (CNR), Naples 80131, Italy.
Francesco Manfrevola, Department of Experimental Medicine, Università degli Studi della Campania “Luigi Vanvitelli”, Naples 80138, Italy.
Monica Mattia, Department of Experimental Medicine, Università degli Studi della Campania “Luigi Vanvitelli”, Naples 80138, Italy.
Gilda Cobellis, Department of Experimental Medicine, Università degli Studi della Campania “Luigi Vanvitelli”, Naples 80138, Italy.
Angela Sparago, Department of Environmental Biological and Pharmaceutical Sciences and Technologies (DiSTABiF), Università degli Studi della Campania “Luigi Vanvitelli”, Caserta 81100, Italy.
Marisa S Bartolomei, Department of Cell and Developmental Biology, Epigenetics Institute, Perelman School of Medicine at the University of Pennsylvania, Philadelphia, PA 19104, USA.
Andrea Riccio, Department of Environmental Biological and Pharmaceutical Sciences and Technologies (DiSTABiF), Università degli Studi della Campania “Luigi Vanvitelli”, Caserta 81100, Italy; Institute of Genetics and Biophysics (IGB) “Adriano Buzzati-Traverso”, Consiglio Nazionale delle Ricerche (CNR), Naples 80131, Italy.
Flavia Cerrato, Department of Environmental Biological and Pharmaceutical Sciences and Technologies (DiSTABiF), Università degli Studi della Campania “Luigi Vanvitelli”, Caserta 81100, Italy.
Funding
AIRC-Associazione Italiana Ricerca sul Cancro (IG 2016 N.18671 and IG 2020 ID 24405 to A.R.); Telethon-Italia (GGP15131 to A.R.); ‘Progetti per la ricerca oncologica della Regione Campania’ Grant: I-Cure (to A.R. and F.C.), ‘Progetti competitivi intraAteneo’ Programma V:ALERE (VAnviteLli pEr la RicErca) 2019—grant MIRIAM from Università degli Studi della Campania ‘Luigi Vanvitelli’ (to A.R., F.C. and A.S.), NIH grant (GM51279 to M.S.B.).
References
- 1. Barlow, D.P. and Bartolomei, M.S. (2014) Genomic imprinting in mammals. Cold Spring Harb. Perspect. Biol., 6. doi: 10.1101/cshperspect.a018382. [DOI] [PMC free article] [PubMed] [Google Scholar]
- 2. Monk, D., Mackay, D.J.G., Eggermann, T., Maher, E.R. and Riccio, A. (2019) Genomic imprinting disorders: lessons on how genome, epigenome and environment interact. Nat. Rev. Genet., 20, 235–248. [DOI] [PubMed] [Google Scholar]
- 3. Chang, S. and Bartolomei, M.S. (2020) Modeling human epigenetic disorders in mice: Beckwith-Wiedemann syndrome and Silver-Russell syndrome. Dis. Model. Mech., 13. doi: 10.1242/dmm.044123. [DOI] [PMC free article] [PubMed] [Google Scholar]
- 4. DeChiara, T.M., Efstratiadis, A. and Robertson, E.J. (1990) A growth-deficiency phenotype in heterozygous mice carrying an insulin-like growth factor II gene disrupted by targeting. Nature, 345, 78–80. [DOI] [PubMed] [Google Scholar]
- 5. Gabory, A., Jammes, H. and Dandolo, L. (2010) The H19 locus: role of an imprinted non-coding RNA in growth and development. BioEssays, 32, 473–480. [DOI] [PubMed] [Google Scholar]
- 6. Keniry, A., Oxley, D., Monnier, P., Kyba, M., Dandolo, L., Smits, G. and Reik, W. (2012) The H19 lincRNA is developmental reservoir of miR-675 that suppresses growth and Igf1r. Nat. Cell Biol., 14, 659–665. [DOI] [PMC free article] [PubMed] [Google Scholar]
- 7. Qiu, X., Vu, T.H., Lu, Q., Ling, J.Q., Li, T., Hou, A., Wang, S.K., Chen, H.L., Hu, J.F. and Hoffman, A.R. (2008) A complex deoxyribonucleic acid looping configuration associated with the silencing of the maternal Igf2 allele. Mol. Endocrinol., 22, 1476–1488. [DOI] [PMC free article] [PubMed] [Google Scholar]
- 8. Hark, A.T., Schoenherr, C.J., Katz, D.J., Ingram, R.S., Levorse, J.M. and Tilghman, S.M. (2000) CTCF mediates methylation-sensitive enhancer-blocking activity at the H19/Igf2 locus. Nature, 405, 486–489. [DOI] [PubMed] [Google Scholar]
- 9. Bell, A.C. and Felsenfeld, G. (2000) Methylation of a CTCF-dependent boundary controls imprinted expression of the Igf2 gene. Nature, 405, 482–485. [DOI] [PubMed] [Google Scholar]
- 10. Wakeling, E.L., Brioude, F., Lokulo-Sodipe, O., O'Connell, S.M., Salem, J., Bliek, J., Canton, A.P., Chrzanowska, K.H., Davies, J.H., Dias, R.P. et al. (2017) Diagnosis and management of Silver-Russell syndrome: first international consensus statement. Nat. Rev. Endocrinol., 13, 105–124. [DOI] [PubMed] [Google Scholar]
- 11. Brioude, F., Kalish, J.M., Mussa, A., Foster, A.C., Bliek, J., Ferrero, G.B., Boonen, S.E., Cole, T., Baker, R., Bertoletti, M. et al. (2018) Expert consensus document: clinical and molecular diagnosis, screening and management of Beckwith-Wiedemann syndrome: an international consensus statement. Nat. Rev. Endocrinol., 14, 229–249. [DOI] [PMC free article] [PubMed] [Google Scholar]
- 12. Anvar, Z., Acurzio, B., Roma, J., Cerrato, F. and Verde, G. (2019) Origins of DNA methylation defects in Wilms tumors. Cancer Lett., 457, 119–128. [DOI] [PubMed] [Google Scholar]
- 13. Sparago, A., Cerrato, F., Vernucci, M., Ferrero, G.B., Silengo, M.C. and Riccio, A. (2004) Microdeletions in the human H19 DMR result in loss of IGF2 imprinting and Beckwith-Wiedemann syndrome. Nat. Genet., 36, 958–960. [DOI] [PubMed] [Google Scholar]
- 14. Sparago, A., Russo, S., Cerrato, F., Ferraiuolo, S., Castorina, P., Selicorni, A., Schwienbacher, C., Negrini, M., Ferrero, G.B., Silengo, M.C. et al. (2007) Mechanisms causing imprinting defects in familial Beckwith-Wiedemann syndrome with Wilms' tumour. Hum. Mol. Genet., 16, 254–264. [DOI] [PubMed] [Google Scholar]
- 15. Sparago, A., Cerrato, F. and Riccio, A. (2018) Is ZFP57 binding to. Clin. Epigenetics, 10, 23. doi: 10.1186/s13148-018-0454-7. [DOI] [PMC free article] [PubMed] [Google Scholar]
- 16. Cerrato, F., Sparago, A., Di Matteo, I., Zou, X., Dean, W., Sasaki, H., Smith, P., Genesio, R., Bruggemann, M., Reik, W. et al. (2005) The two-domain hypothesis in Beckwith-Wiedemann syndrome: autonomous imprinting of the telomeric domain of the distal chromosome 7 cluster. Hum. Mol. Genet., 14, 503–511. [DOI] [PubMed] [Google Scholar]
- 17. Beygo, J., Citro, V., Sparago, A., De Crescenzo, A., Cerrato, F., Heitmann, M., Rademacher, K., Guala, A., Enklaar, T., Anichini, C. et al. (2013) The molecular function and clinical phenotype of partial deletions of the IGF2/H19 imprinting control region depends on the spatial arrangement of the remaining CTCF-binding sites. Hum. Mol. Genet., 22, 544–557. [DOI] [PMC free article] [PubMed] [Google Scholar]
- 18. Abi Habib, W., Brioude, F., Azzi, S., Salem, J., Das Neves, C., Personnier, C., Chantot-Bastaraud, S., Keren, B., Le Bouc, Y., Harbison, M.D. et al. (2017) 11p15 ICR1 partial deletions associated with IGF2/H19 DMR hypomethylation and Silver-Russell syndrome. Hum. Mutat., 38, 105–111. [DOI] [PubMed] [Google Scholar]
- 19. Kraft, F., Wesseler, K., Begemann, M., Kurth, I., Elbracht, M. and Eggermann, T. (2019) Novel familial distal imprinting Centre 1 (11p15.5) deletion provides further insights in imprinting regulation. Clin. Epigenetics, 11, 30. doi: 10.1186/s13148-019-0629-x. [DOI] [PMC free article] [PubMed] [Google Scholar]
- 20. Hur, S.K., Freschi, A., Ideraabdullah, F., Thorvaldsen, J.L., Luense, L.J., Weller, A.H., Berger, S.L., Cerrato, F., Riccio, A. and Bartolomei, M.S. (2016) Humanized H19/Igf2 locus reveals diverged imprinting mechanism between mouse and human and reflects Silver-Russell syndrome phenotypes. Proc. Natl. Acad. Sci. USA., 113, 10938–10943. [DOI] [PMC free article] [PubMed] [Google Scholar]
- 21. Cerrato, F., Sparago, A., Verde, G., De Crescenzo, A., Citro, V., Cubellis, M.V., Rinaldi, M.M., Boccuto, L., Neri, G., Magnani, C. et al. (2008) Different mechanisms cause imprinting defects at the IGF2/H19 locus in Beckwith-Wiedemann syndrome and Wilms' tumour. Hum. Mol. Genet., 17, 1427–1435. [DOI] [PubMed] [Google Scholar]
- 22. Duffy, K.A., Cielo, C.M., Cohen, J.L., Gonzalez-Gandolfi, C.X., Griff, J.R., Hathaway, E.R., Kupa, J., Taylor, J.A., Wang, K.H., Ganguly, A. et al. (2019) Characterization of the Beckwith-Wiedemann spectrum: diagnosis and management. Am. J. Med. Genet. C Semin. Med. Genet., 181, 693–708. [DOI] [PMC free article] [PubMed] [Google Scholar]
- 23. Freschi, A., Hur, S.K., Valente, F.M., Ideraabdullah, F.Y., Sparago, A., Gentile, M.T., Oneglia, A., Di Nucci, D., Colucci-D'Amato, L., Thorvaldsen, J.L. et al. (2018) Tissue-specific and mosaic imprinting defects underlie opposite congenital growth disorders in mice. PLoS Genet., 14, e1007243. doi: 10.1371/journal.pgen.1007243. [DOI] [PMC free article] [PubMed] [Google Scholar]
- 24. Shmela, M.E. and Gicquel, C.F. (2013) Human diseases versus mouse models: insights into the regulation of genomic imprinting at the human 11p15/mouse distal chromosome 7 region. J. Med. Genet., 50, 11–20. [DOI] [PubMed] [Google Scholar]
- 25. Zimmerman, D.L., Boddy, C.S. and Schoenherr, C.S. (2013) Oct4/Sox2 binding sites contribute to maintaining hypomethylation of the maternal igf2/h19 imprinting control region. PLoS One, 8, e81962. [DOI] [PMC free article] [PubMed] [Google Scholar]
- 26. Abi Habib, W., Azzi, S., Brioude, F., Steunou, V., Thibaud, N., Das Neves, C., Le Jule, M., Chantot-Bastaraud, S., Keren, B., Lyonnet, S. et al. (2014) Extensive investigation of the IGF2/H19 imprinting control region reveals novel OCT4/SOX2 binding site defects associated with specific methylation patterns in Beckwith-Wiedemann syndrome. Hum. Mol. Genet., 23, 5763–5573. [DOI] [PubMed] [Google Scholar]
- 27. Thorvaldsen, J.L., Mann, M.R., Nwoko, O., Duran, K.L. and Bartolomei, M.S. (2002) Analysis of sequence upstream of the endogenous H19 gene reveals elements both essential and dispensable for imprinting. Mol. Cell. Biol., 22, 2450–2462. [DOI] [PMC free article] [PubMed] [Google Scholar]
- 28. Nagy, A. (2000) Cre recombinase: the universal reagent for genome tailoring. Genesis, 26, 99–109. [PubMed] [Google Scholar]
- 29. Anvar, Z., Cammisa, M., Riso, V., Baglivo, I., Kukreja, H., Sparago, A., Girardot, M., Lad, S., De Feis, I., Cerrato, F. et al. (2016) ZFP57 recognizes multiple and closely spaced sequence motif variants to maintain repressive epigenetic marks in mouse embryonic stem cells. Nucleic Acids Res., 44, 1118–1132. [DOI] [PMC free article] [PubMed] [Google Scholar]
Associated Data
This section collects any data citations, data availability statements, or supplementary materials included in this article.