

Abstract
Following a mandate from the European Commission, EFSA has developed a Guidance on Technical Requirements (Guidance on Particle‐TR), defining the criteria for assessing the presence of a fraction of small particles, and setting out information requirements for applications in the regulated food and feed product areas (e.g. novel food, food/feed additives, food contact materials and pesticides). These requirements apply to particles requiring specific assessment at the nanoscale in conventional materials that do not meet the definition of engineered nanomaterial as set out in the Novel Food Regulation (EU) 2015/2283. The guidance outlines appraisal criteria grouped in three sections, to confirm whether or not the conventional risk assessment should be complemented with nanospecific considerations. The first group addresses solubility and dissolution rate as key physicochemical properties to assess whether consumers will be exposed to particles. The second group establishes the information requirements for assessing whether the conventional material contains a fraction or consists of small particles, and its characterisation. The third group describes the information to be presented for existing safety studies to demonstrate that the fraction of small particles, including particles at the nanoscale, has been properly evaluated. In addition, in order to guide the appraisal of existing safety studies, recommendations for closing the data gaps while minimising the need for conducting new animal studies are provided. This Guidance on Particle‐TR complements the Guidance on risk assessment of nanomaterials to be applied in the food and feed chain, human and animal health updated by the EFSA Scientific Committee as co‐published with this Guidance. Applicants are advised to consult both guidance documents before conducting new studies.
Keywords: nanomaterial, nanofraction, solubility, dissolution/degradation rate, sample dispersion protocol, electron microscopy, particle size distribution
Short abstract
This publication is linked to the following EFSA Journal article: http://onlinelibrary.wiley.com/doi/10.2903/j.efsa.2021.6768/full
This publication is linked to the following EFSA Supporting Publications article: http://onlinelibrary.wiley.com/doi/10.2903/sp.efsa.2021.EN-6804/full
Summary
In the context of regulated food and feed products, when an application concerns a material that meets the definition of engineered nanomaterial set out in Regulation (EU) 2015/2283, the application must follow the EFSA Scientific Committee Guidance on risk assessment of nanomaterials to be applied in the food and feed chain, human and animal health, published in 2018 and updated in 2021, which is also used by EFSA when conducting its assessment. Nanospecific considerations for risk assessment may be required for conventional materials that contain a fraction of small particles, but do not meet the definition of engineered nanomaterial. Such particles may be formed naturally or as by‐products in the production process, or during handling and processing of foods.
Following a mandate from the European Commission, the European Food Safety Authority (EFSA) has developed this Guidance on Technical Requirements (Guidance on Particle‐TR), setting out the information requirements for applications in the regulated food and feed product areas, and establishing criteria for assessing the presence of a fraction of small particles, including particles requiring specific assessment at the nanoscale, in conventional materials which do not meet the definition of engineered nanomaterial set out in the Novel Food Regulation (EU) 2015/2283.
This document complements the EFSA Scientific Committee Guidance on risk assessment of nanomaterials to be applied in the food and feed chain, human and animal health mentioned above and should be considered by the applicant when preparing the application and dossier, and then by the EFSA Panels and units when considering the information submitted. Applicants are advised to consult both guidance documents before conducting new studies.
The present Guidance on Particle‐TR provides mandatory information requirements for novel food applications submitted in accordance to Regulation (EU) 2015/2283, and for those regulated food products to which the engineered nanomaterial definition is also directly or indirectly applicable: food flavourings, food additives, feed additives, vitamins and minerals used in food in accordance with Regulation (EC) No 1925/2006 and/or in food supplements in accordance with Directive 2002/46/EC as well as vitamins, minerals or other substances used in food for specific groups in accordance with Regulation (EU) No 609/2013. In order to maintain the coherence of the EFSA assessments on nanoparticles, this Guidance on Particle‐TR is also relevant for conventional materials in areas not covered by the engineered nanomaterial definition in food and feed (e.g. substances used in food contact materials and active substances in plant protection products), complementing the applicable specific guidance, e.g. the note for guidance on food contact materials (EFSA CEP Panel, 2008), and the Guidance documents on the risk assessment of pesticides.
The document guides the applicant on different ways for confirming when a conventional risk assessment is sufficient. The applicants may select, according to their knowledge and available information, the best appraisal route or combination of appraisal routes to justify: (a) the absence of a fraction of small particles, or (b) that the material contains a fraction of small particles but it is covered by the conventional risk assessment and does not require a separate assessment regarding nanoscale properties. The guidance also provides information related to best practices for reporting and assessing existing safety studies, and recommendations for generating additional information.
This Guidance on Particle‐TR is applicable to all chemical materials, marketed or to be marketed as substances or mixtures, to be assessed by EFSA, including mixtures and products marketed as liquid formulations unless the information confirms that they are true liquids and do not contain small particles in suspension. The characterisation of the fraction of small particles, including the particle size distribution, is needed in all cases unless the applicant demonstrates that the material will be fully dissolved under the intended use conditions and consumers will not be exposed to particles. For multi‐constituent substances and mixtures, the information to be submitted should cover each single constituent or each component in the mixture, as well as the multi‐component material. In the case of (a) botanicals and other chemically complex materials of biological origin with unknown or variable composition, (b) macromolecules of biological origin (e.g. enzymes and other proteins) or (c) other similar cases, the applicant should provide a rationale demonstrating that an assessment of the fraction of small particles including nanoparticles is not needed, or that is already covered in the safety assessment process.
The general principles and the summary of appraisal routes that applicants may follow to confirm that a fraction of small particles is either not present or covered by the conventional risk assessment are presented in Section 2. Solubility and dissolution rate can be used to demonstrate that under the anticipated use conditions the material will be fully dissolved in the marketed product, in food or, following ingestion, during the gastrointestinal tract processes, and that consumers will not be exposed to particles after food consumption. Under these circumstances, the conventional safety assessment is appropriate and no further characterisation of the fraction of small particles is required.
Section 3 describes the information requirements and methods that should be used when characterisation of the particle size distribution is needed. Screening methods are sufficient when the applicant is able to demonstrate that the particle size is equal to or larger than 500 nm and that the material contains less than 10% of particles (number‐based) with at least one dimension smaller than 500 nm; the detection capability of the method(s) used for this assessment should provide convincing evidence that particles smaller than 500 nm are adequately counted. As a proper sample dispersion is essential for the characterisation of the size distribution, a dispersion protocol to be followed by the applicants is included in Section 3.2.
Quantitative methods for characterising the particle size distribution are required for materials containing a fraction of small particles (particles < 500 nm). Electron microscopy is the preferred method and Appendix A provides information on how this characterisation should be reported in the application. A pragmatic trigger for materials consisting of or containing a fraction of small particles is applied when the large majority of the material is not at the nanoscale, but a tiny tail within the particle size distribution at the nanoscale may be present due to the manufacturing process. The trigger is that the material should have less than 10% of the particles (number‐based) of the sub‐500 nm fraction with at least one external dimension smaller than 250 nm. For conventional materials, this situation implies that the total mass of particles at the nanoscale is very low; in these cases, a conventional risk assessment is sufficient and no further assessment for properties at the nanoscale is needed. In addition to the numerical criteria, a description of the fraction of small particles (i.e. particles smaller than 500 nm) should confirm that the particles at the nanoscale are just part of the size distribution tail resulting from the same manufacturing process of the powder, and that all particles have similar characteristics except those directly related to size.
Section 4 presents the information to be provided on existing safety studies on conventional materials, not originally designed to specifically consider the presence of a fraction of small particles. There are two essential conditions to address that the possible adverse effects linked to the fraction of small particles, including nanoparticles, are covered by the study: (a) the available information should demonstrate that the test material included the fraction of small particles, and (b) the suitability of the study selection, study design and the level of dispersion/degree of agglomeration of the test material for assessing the hazard of small particles including nanoparticles.
Regarding the first condition, the applicant should provide at least the characterisation of the fraction of small particles of the marketed material and the variability between production processes and batches. Ideally, a comparison of the characterisation of the fraction of particles in the material as marketed and in the material used for the safety study should be provided. In other cases, the comparison should focus on the manufacturing process in order to demonstrate that the test material was produced by the same manufacturing process and current production conditions, and that the test material was in compliance with the current material specifications. If the manufacturing process has been modified, information addressing the changes regarding the fraction of small particles, should be provided. In case of broad‐range technical specifications of the bulk material that is placed on the market, the full range of small particles or at least the conditions representing the worst case, have to be covered by the test materials used in the existing studies.
Regarding the second condition, the criteria for checking the adequacy of the study selection, study design, and level of dispersion/degree of agglomeration are presented in Section 4.2. Information on the design and execution, in addition to a detailed characterisation of the test material, of any existing toxicity study is required to ensure that the study had addressed specific aspects related to particles in the nanoscale; including information on preparation of the test material to understand whether or not it would have minimised aggregation/agglomeration of the particles, the matrix/vehicle used, and the mode of administration. Specific recommendations are provided for the appraisal of in vivo and in vitro studies, and Appendix B describes best practices for reporting the information. Additional considerations are required for genotoxicity and toxicokinetic studies.
A decision process for assessing data gaps, determining if new additional studies are needed, and establishing the testing strategy are presented in Section 4.3; recommendations for conducting new studies are provided in Section 5. Applicants should consult these sections before conducting new studies, and follow the recommendations in order to avoid unnecessary duplication of animal studies.
1. Introduction
1.1. Background and Terms of Reference as provided by the European Commission
The engineered nanomaterial definition set out in Regulation (EU) 2015/22831 (the Novel Food Regulation) is also directly or indirectly applicable to other EU legislation concerning regulated food products (food flavourings, food additives, feed additives, vitamins and minerals used in food in accordance with Regulation (EC) No 1925/20062 and/or in food supplements in accordance with Directive 2002/46/EC3 as well as vitamins, minerals or other substances used in food for specific groups in accordance with Regulation (EU) No 609/20134), and in food information to consumers, and implies significant requirements in terms of the premarket safety assessment and the post market labelling requirements for foods containing engineered nanomaterials.
In the context of regulated food and feed products that are subject to the engineered nanomaterial definition set out in Regulation (EU) 2015/2283,1 we are currently facing two situations on nanomaterials that link their regulatory status with their safety assessment:
When an application concerns a material that meets the definition of engineered nanomaterial set out in the Novel Food Regulation (EU) 2015/2283, the application must contain all the information needed, e. g. description of physical and chemical properties, technical, biological and toxicological data on the material as required by the specific legislation, in order to allow for its safety assessment by EFSA, leading to its eventual authorisation. In terms of the safety assessment, EFSA is conducting its assessment in line with its recently updated guidance on risk assessment of the application of nanoscience and nanotechnologies in the food and feed chain.
A potentially more complex situation arises when an application concerns a conventional material which does not meet the definition of engineered nanomaterial but may contain small particles including particles at the nanoscale (< 100 nm in one or more dimensions). Particles at the nanoscale can be formed naturally or as by‐products in the production process or during handling and processing of the foods.
To proactively ensure that materials that fall in case (2) above, are properly assessed for safety by the applicants themselves when they conduct the safety tests required by the applicable legislation and by EFSA when the application is evaluated, technical guidance for applicants is necessary. It is therefore appropriate to request that EFSA develops technical guidance setting out the technical information that will need to be part of a new regulated food or feed application, to demonstrate whether a conventional material, which is not covered by the definition of engineered nanomaterial set out in the Novel Food Regulation (EU) 2015/2283, consists of or contains a fraction of small particles, including particles at the nanoscale.
TERMS OF REFERENCE
In accordance with Art 29 (1) of Regulation (EC) No 178/20025, the European Commission asks the European Food Safety Authority to develop technical guidance setting out the information requirements for applications in the regulated food and feed product areas of conventional materials which do not meet the definition of engineered nanomaterial set out in the Novel Food Regulation (EU) 2015/22831, in order to demonstrate whether a portion or the whole of the material is in the nanoscale.
Furthermore, for those materials which have been determined to contain a fraction of small particles, including particles at the nanoscale, the European Commission asks the European Food Safety Authority to include in the guidance the information requirements demonstrating that the nanoscale fraction of the material was properly evaluated in the safety studies of the material.
The guidance should in particular address the following parameters and include any other technical or scientific elements considered appropriate to be included:
-
a)
The physicochemical criteria that will help identify/signal materials that are likely to consist of small particles, including nanoparticles, or contain a fraction of small particles, including nanoparticles, in a given regulated food or feed product.
-
b)
The technical and scientific information (e.g. particle size distribution including necessary meta‐information) that the applicant will need to include in the application if a material meets the above criteria that will document the presence or absence of small particles, or a fraction of small particles, including nanoparticles, in the material and/or in the final regulated food and feed products.
-
c)
When applicable, the evidence requirements, in line with the EFSA guidance on risk assessment of the application of nanosciences and nanotechnologies in the food and feed chain that will demonstrate that the safety studies conducted included the fraction of small particles, including nanoparticles, so that EFSA can carry out the proper safety assessment of the material.
1.2. Interpretation of the Terms of Reference
In line with the Terms of Reference, EFSA has produced this Guidance on Technical Requirements addressing the presence of small particles (hereafter ‘Guidance on Particle‐TR’) describing the information to be submitted by applicants in the food and feed areas to allow the safety assessment of the materials with a fraction of small particles, including particles at the nanoscale.
In order to maintain the coherence of the EFSA assessments on nanoparticles, this Guidance on Particle‐TR is also relevant for conventional materials in areas not covered by the engineered nanomaterial definition in food and feed (e.g. substances used in food contact materials (FCMs) and active substances in plant protection products), complementing the applicable specific guidance, e.g. the note for guidance on food contact materials (EFSA CEP Panel, 2008), and the Guidance documents on the risk assessment of pesticides.
It should be noted that the definition of engineered nanomaterials also includes structures with size above the order of 100 nm that retain properties that are characteristic of the nanoscale.
1.3. Implementation of this Guidance on Technical Requirements in EFSA regulatory assessments
This Guidance on Particle‐TR provides mandatory information requirements for novel food applications submitted in accordance to Regulation (EU) 2015/2283 (the Novel Food Regulation), and for those regulated food products for which the engineered nanomaterial definition is also directly or indirectly applicable: food flavourings, food additives, feed additives, vitamins and minerals used in food in accordance with Regulation (EC) No 1925/2006 and/or in food supplements in accordance with Directive 2002/46/EC as well as vitamins, minerals or other substances used in food for specific groups in accordance with Regulation (EU) No 609/2013.
This Guidance on Particle‐TR should be considered by the applicants when preparing the application/dossier, and then by the EFSA Panels and Units when assessing the information submitted. The document guides the process to decide whether or not the material, or a fraction of it, does require specific assessment of properties at the nanoscale. This Guidance on Particle‐TR provides ways for confirming that a conventional risk assessment is sufficient. The applicants may select, according to their knowledge and available information, the best appraisal route or combination of appraisal routes to justify (a) the absence of a fraction of small particles, or (b) that the material contains a fraction of small particles but that this fraction is covered by the conventional risk assessment and relevant sectoral guidance documents, and does not require a separate assessment for the nanoscale. When preparing the application/dossier, if a particular appraisal route does not provide adequate justification regarding points (a) and (b) above, the applicant may consider other appraisal routes (see Figure 1 for details on the possible appraisal routes and links to the different sections of this document), nevertheless all information should be presented in the application/dossier. Some pieces of information, such as verifiable quantitative assessment of solubility or dissolution rates, may be essential. The Guidance also provides information related to best practices for reporting and assessing existing studies, and recommendations for generating additional information.
Figure 1.
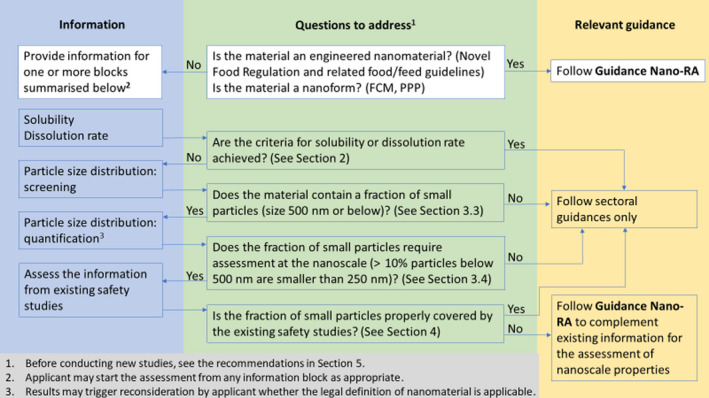
Decision process for selecting the applicable guidance document(s) to be used for the risk assessment of the material regarding the assessment of small particles
In order to implement the Terms of Reference, this Guidance includes a set of working definitions and criteria with numerical thresholds, triggering information requirements applicable to conventional materials. The thresholds have been selected considering the need for achieving a high level of protection for consumers, and are based on scientific knowledge and technical reasons related to analytical limitations to the techniques available at present. The details for the selection are presented in the relevant sections and summarised in the Glossary. These thresholds have been specifically selected for the purpose of this Guidance, and are not necessarily relevant or applicable outside the context of setting information requirements for the risk assessment of conventional materials, and should in no way be seen as interpretation or implementation of existing regulatory thresholds, if any such thresholds are in place.
This Guidance on Particle‐TR complements the EFSA Scientific Committee Guidance on risk assessment of nanomaterials to be applied in the food and feed chain, human and animal health (EFSA Scientific Committee, 2021; hereafter ‘Guidance on Nano‐RA’). Applicants and other readers are referred to that guidance regarding the specific scientific elements to be considered when assessing the risk of particles at the nanoscale. It should be considered that the Guidance on Nano‐RA is currently being updated. Figure 1 presents the connectivity between this Guidance on Particle‐TR, the Guidance on Nano‐RA and the sectoral guidance documents; clarifying under which conditions the material requires assessment at the nanoscale following the Guidance on Nano‐RA.
According to this decision process, applicants, interested parties and risk assessors should apply this Guidance on Particle‐TR when assessing whether the material contains small particles. A full assessment addressing the properties at the nanoscale, in line with the Guidance on Nano‐RA, is required if the applicant or the risk assessor concludes that the material:
fulfils the definition of engineered nanomaterial according to the Novel Food Regulation (Regulation (EU) 2015/2283),
is a substance to be used to manufacture FCMs, which is in nanoform in accordance with Article 9(2) of Commission Regulation (EU) 10/2011, or deliberately engineered to particle size which exhibit functional physical and chemical properties that significantly differ from those at a larger scale in accordance to Article 5(2)(c)(ii) of Commission Regulation (EC) No 450/2009;
is an active substance in Plant Protection Products (PPP), consisting of or containing nanoforms according to the provisions of Commission Regulations (EU) 2018/1881, and (EU) 2020/878, amending the Annexes I, II, III, VI, VII, VIII, IX, X, XI and XII of the REACH Regulation to introduce nanospecific clarifications, or is a PPP with co‐formulants in nanoform;
is a nanostructured material according to the ISO definition, that may be composed of large particles but keeps nanoscale characteristics, or
consists of, or contains a fraction of small particles as outlined in this Guidance on Particles‐TR, unless according to the principles in this Guidance on Particle‐TR, the information confirms that the conventional assessment is sufficient to address the risk for consumers.
This Guidance on Particle‐TR intends to highlight that safety assessment of food/feed ingredients and additives consists of or contains a fraction of small particles may not be complete if only chemical aspects are considered without taking into account certain particle‐size related physical aspects as well. It should be noted that this Guidance on Particle‐TR only addresses the risk for consumers exposed via food. Other assessments to be performed by applicants, in particular human occupational exposure and environmental risk assessments are not addressed. However, some general principles may be relevant.
This Guidance on Particle‐TR is intended to assist applicants and interested parties intending to submit application dossiers or other comparable forms of submissions.
2. Materials requiring assessment according to this Guidance on Technical Requirements and general principles
2.1. Introduction
This Guidance on Particle‐TR is applicable to chemical materials either as substances or mixtures to be assessed by EFSA. This Guidance on Particle‐TR is also applicable to mixtures and products marketed as liquid formulations (e.g. suspensions) unless the methods described below confirm that they do not contain small particles in suspension, and therefore can be considered as ‘true liquids’ or ‘fully solubilised solids’. Substances that are true liquids or fully solubilised at normal conditions of oral ingestion (37°C and 1 atmospheric pressure, see Section 2.3.3) are sufficiently covered by the sectoral guidance.
The characterisation of the fraction of small particles, including the particle size distribution, is needed in all cases unless the applicant demonstrates that the material will be fully dissolved and consumers will not be exposed to particles. This Guidance on Particle‐TR focusses on the implications for the safety assessment. The decision whether or not a material is an engineered nanomaterial according to the definition in the Novel Food Regulation is outside EFSA's remit and is not addressed in this Guidance on Particle‐TR.
For multi‐constituent substances and mixtures (defined in the glossary), the information to be submitted according to this Guidance on Particle‐TR should cover each single constituent or each component in the mixture, as well as the full material. In the case of (a) botanicals and other complex materials of biological origin with unknown or variable composition, (b) macromolecules of biological origin (e.g. enzymes and other proteins), or (c) other similar cases, the applicant should provide a rationale demonstrating that an assessment of the fraction of small particles including nanoparticles is not needed, or that is already covered in the safety assessment process.
2.2. General principles and list of appraisal routes for confirming that a fraction of small particles is either not present or covered by the conventional risk assessment
This Guidance on Particle‐TR presents several appraisal routes for confirming that (a) the material does not contain a fraction of small particles, or (b) a fraction of small particles is present but properly covered by the conventional risk assessment. In both cases, an additional assessment related to the presence of particles at the nanoscale is not needed. The appraisal routes are listed according to the level of complexity for generating the information, but they should not be considered as a tiered approach.
The applicant may select one or several appraisal routes appropriate for each material to demonstrate the absence of a fraction of small particles, or that a fraction is present but well‐covered by the studies submitted by the applicant for the conventional risk assessment.
If the applicant confirms that a fraction of small particles is present but cannot demonstrate that the hazard assessment of the material also covers this fraction (see Section 4 for details), the applicant should present information to complement the risk assessment. Section 4.3 provides the information requirements to be considered by the applicants in order to cover the safety assessment of the fraction of small particles with nanoscale properties in line with the Guidance on Nano‐RA.
Table 1 complements Figure 1 summarising the different appraisal routes, describing the parameters or options to be considered for each appraisal route, and the associated decision criteria for confirming that the conventional risk assessment is sufficient, and methodology for obtaining the information.
Table 1.
List of appraisal routes and corresponding decision criteria for demonstrating that the material does not require specific assessment at the nanoscale (i.e. assessment according to Guidance on Nano‐RA)
| Parameters/Options | Decision criteria1 | Methodology | Comments |
|---|---|---|---|
| Appraisal routes using solubility and dissolution rate to demonstrate that consumers will not be exposed to small particles (Section 2.3 ) | |||
| Solubility in water (Section 2.3.1) | Equal to or higher than 33.3 g/L | According to OECD TG 105 (OECD, 1995) with specific considerations for small particles | For multi‐constituent substances and mixtures, the decision criterion has to be fulfilled for each constituent/component |
| Dissolution/degradation rate in water (Section 2.3.2) | Half‐life of 10 min or less corresponding to dissolved fraction equal to or higher than 88% in 30 min | Single concentration corresponding to exposure at the maximum use level in water | For multi‐constituent substances and mixtures, the decision criterion has to be fulfilled for each constituent/component. If solubility is pH dependent, the criteria should be confirmed at pH = 3 and/or pH = 7 |
| Solubility/dissolution in the marketed product or in food (Section 2.3.4) | At the expected maximum levels: the substance is fully dissolved in an aqueous or a non‐aqueous matrix; or residues in food are below the relevant solubility limit. | Solubility/dissolution tests of the substance in water, lipids or relevant simulants. | Results should confirm that under the intended use conditions (e.g. marketed product or food) the material or its residues in food will be solubilised in the products ingested by consumers |
| Appraisal routes related to the particle size distribution (Section 3 ), proper dispersion of the material is essential in each case | |||
| Particle size distribution of the material (Section 3.3) | Particles equal to or larger than 500 nm The detection capability of the method(s) used for this assessment should provide convincing evidence that the material contains less than 10% of particles (number‐based) with at least one dimension smaller than 500 nm | The method selection should be justified, and detection capability should be reported, examples of possible methods are:
|
Proper dispersion of the material should be ensured (Section 3.2) |
| For liquid formulations/products (Sections 2.3.3 and 3.3) | Results should confirm the absence of particles in suspension | Ultrafiltration, or other appropriate method if justified, of the liquid product The detection capability should be reported | To be tested for the full formulation as marketed |
| Particle size distribution of fraction of small particles (Section 3.4) | Less than 10% of the particles (number‐based) of the sub‐500 nm fraction with at least one external dimension smaller than 250 nm | Quantitative EM or a different method with justification | Applies to the fraction of small particles of the full material (also for multi‐constituent substances and mixtures) When the criterion is not met, this information is also required for assessing if the fraction of small particles is covered by the existing safety studies following the criteria described in Section 4 |
| Appraisal routes demonstrating that the fraction of small particles is properly covered by the existing safety studies (Section 4 ) | |||
| The studies address properly the potential hazards of the fraction of small particles (Sections 4.1 and 4.2) | The test material included the fraction of small particles, and The test design, and the level of dispersion/degree of agglomeration was sufficient for addressing the fraction of small particles | Characterisation of the test material (particle characteristics and particle size distribution), comparison with the marketed material, Specific consideration for genotoxicity and toxicokinetic assessments, and Demonstration of a sufficient level of dispersion/degree of agglomeration based on extraction of information from study protocol or additional information (See Appendix B) | For existing studies see details in Section 4. Before conducting new safety studies for materials containing a fraction of small particles, see the recommendations of the Guidance on Nano‐RA. |
| The submitted risk assessment covers the fraction of small particles (Section 4.3) | The gaps observed in the safety studies are covered (or are of overall low relevance) and do not trigger additional concerns | The lines of evidence are combined in a weight of evidence approach | See examples under Table 4, Section 4.3 |
OECD: Organisation for Economic Co‐operation and Development; EM: electron microscopy.
Fulfilling the decision criteria for one of the parameters/options is sufficient for demonstrating that the assessment according to the sectoral guidance is sufficient.
The technical feasibility for applying the criteria above may be problematic for complex materials of biological origin that are not fully characterised or are of variable composition, such as some novel foods, botanicals, enzymes and other proteins or extracts. These materials may have a fraction of small particles of natural origin similar to that of foods considered safe for consumption. In these cases, the applicant may justify that the fraction of small particles has similar fate in the gastrointestinal tract (GIT) and similar hazard properties to those naturally present in comparable foods, and covered by the available studies and does not require additional assessment. A scientifically sound case‐by‐case justification supported by the available evidence should be presented.
2.3. Confirmatory appraisal routes related to solubility and dissolution rate
The assessment of particles at the nanoscale refers to entities in solid form, including particles in suspension/dispersion (Rauscher et al., 2019b). From the risk assessment perspective, as indicated in the Guidance on Nano‐RA, if the material is expected to be fully solubilised in the food or in the GIT, an assessment at the nanoscale may not be needed.
The terms relating to solubility, dispersibility and dissolution rate have been explained in the Guidance on Nano‐RA. Briefly, solubility is a property of the substance defined as the proportion of a solute in a solvent under equilibrium conditions (i.e. in a saturated state), whereas dissolution is a process and the dissolution rate refers to the kinetics of dissolution. For nanomaterials, dissolution means that the material is solubilised into individual ionic or molecular species, and this needs to be differentiated from dispersion, which is a colloidal suspension of the particles. In addition, it is also important to consider the form in which a material may be solubilised. For example, some materials may not be solubilised as such, but they may do so as a result of a chemical transformation – such as hydrolysis or oxidation – if permitted by the conditions in a solvent.
A Guidance on safety assessment of nanomaterials in cosmetics has been published by the Scientific Committee on Consumer Safety (SCCS, 2019). Alike the Guidance on Nano‐RA, it emphasises the need to distinguish between solubility and dispersion of nanomaterials, and describes solubility as disintegration of a nanomaterial in an aqueous medium or biological environment into molecular components with the loss of nano features. It also highlights the consideration of the time required for dissolution, because that will determine the consideration for risk assessment to be based on either particle risk or solubilised substance risk (SCCS, 2019).
Following the ingestion of small particles, the material may dissolve in the GIT. As detailed in the Guidance on Nano‐RA, the dissolution/degradation of the material can be investigated under simulated GIT conditions. If the results confirm that the dissolution kinetics is rapid enough to achieve full solubilisation in the stomach or in the intestine before gastrointestinal uptake of the particles, a conventional risk assessment is sufficient. The principles of the Guidance on Nano‐RA have been adapted in this Guidance to offer a simplified dissolution rate assay in water (described in Section 2.3.2.3). If solubility is pH‐dependent and the criterion is not achieved at pH = 7, it would be sufficient to demonstrate that the dissolution rate at pH = 3, representing the stomach conditions, is sufficiently rapid to ensure full dissolution in the stomach.
Currently, there are no standardised methods for measuring the dissolution kinetics under conditions relevant for oral ingestion; consequently, a dissolution rate protocol is included in Section 2.3.2. Highly water soluble substances dissolve quickly, and are expected to be solubilised during food processing or quickly after ingestion. In order to avoid unnecessary testing, a threshold for substances with very high solubility in water has been included in Section 2.3.1, if water solubility is above this threshold, there is no need for conducting a dissolution rate study; in other cases, the dissolution rate protocol is needed for accounting that, after ingestion, dissolution will occur before reaching the intestine.
2.3.1. Solubility in water
2.3.1.1. Decision criteria
If the solubility of the substance in water is equal to or higher than 33.3 g/L, no additional assessment for the fraction of small particles is needed.
This criterion can also be applied to multi‐constituent substances and mixtures. For mixtures, each substance in the mixture should be tested separately and achieve the solubility criterion of equal to or higher than 33.3 g/L. For complex multi‐constituent substances where the solubility of each single component cannot be assessed, the applicant should consider the dissolution rate in water, focusing on the components with the slowest dissolution rate. Alternatively, other appraisal routes described in Sections 3 and 4 of this Guidance should be considered. If some components in the multi‐constituent substance or in the mixture do not achieve the solubility criterion the other appraisal routes should focus on those components.
2.3.1.2. Information required and methodology
A solubility test according to OECD TG 105 (OECD, 1995) or equivalent is required. It is important to remove any suspended particles from the suspension. Ultrafiltration is the recommended method for removing small particles (including nanoparticles) from the solubilised fraction. Other methods have also been mentioned in literature for this purpose. These include ultracentrifugation and dialysis. However, the separation process in these methods may be too slow compared to the dissolution process, and for this and other reasons, the use of ultracentrifugation and dialysis is not recommended (OECD, 2020).
2.3.1.3. Principles
The criterion on solubility in water is based on the SCCS Guidance (2019) and specifically on the criteria for measuring the solubility of nanoparticles. According to the SCCS (2019), nanospecific risk assessment may be waived for a material composed/comprised of small particles that has a high solubility (i.e. solubility of 33.3 g/L or more).
As a guide, the solubility of a substance should be seen in the context of the categories for degrees of solubility proposed by JECFA and the European and US Pharmacopoeias (Table 2).
Table 2.
Solubility Terms as defined by JECFA (2006) and European and US Pharmacopeias (Council of Europe (2019); USP38 and USP38 NF33**)
| Term | Parts of solvent required for 1 part of solute | Solubility defined in g/L |
|---|---|---|
| Very soluble | Less than 1 part | > 1,000 |
| Freely soluble | 1–10 parts | 1,000–100 |
| Soluble | 10–30 parts | 100 to 33.3 |
| Sparingly soluble | 30–100 parts | 33.3 to 10 |
| Slightly soluble | 100–1,000 parts | 10 to 1 |
| Very slightly soluble | 1,000–10,000 parts | 1 to 0.1 |
| Insoluble* | > 10,000 parts | < 0.1 |
The European Pharmacopeia terms it as ‘practically insoluble.
The United States Pharmacopeia–National Formulary (United States Pharmacopeial Convention, 2016).
The value of 33.3 g/L selected as threshold for this appraisal route is based on internationally agreed standard testing for chemicals in general. At this solubility level and above, the material is expected to be fully solubilised either in the food matrix or in the GIT, regardless the use levels. Therefore, consumers will not be significantly exposed to the material in particle form and a conventional risk assessment is sufficient.
Even if the criterion is not met, a proper measurement of solubility is essential for applying other appraisal routes. When testing insoluble or partially solubilised substances, it must be kept in view that they will be present in a test medium as a nano‐dispersion rather than a solution. Special attention should be paid to the agglomeration/aggregation behaviour, and the insoluble/partially soluble nature of small particles in the nanoscale (OECD, 2009; SCENIHR, 2009; Chaudhry et al., 2010; Gottardo et al., 2017).
2.3.2. Dissolution rate in water
2.3.2.1. Decision criteria
If, at a concentration corresponding to exposure at maximum use level (as detailed in Section 2.3.2.3), the (mass‐based) dissolution rate of the material in water (or the dissolution rate of each constituent in case of a multi‐constituent substance) shows a half‐life of 10 min or less, no additional assessment for the fraction of small particles is needed. This dissolution rate corresponds to 12% or less of the material (mass‐based) remaining present as particles after 30 min, a percentage and time point adequate for minimising measurement uncertainty. Multiple time points should be determined to establish the dissolution rate. No indication for incomplete dissolution should be observed within the time‐frame of the study.
This criterion is also applicable to mixtures. Each substance in the mixture should be tested separately and achieve the dissolution rate mentioned here. If some components in the mixture do not achieve this dissolution rate, the other appraisal routes should focus on those components.
2.3.2.2. Information required and methodology
A dissolution rate test as described below is required. The dissolution rate test should measure the dissolution of the test item at a single concentration, representing the maximum level of consumer exposure, at different time‐points. Background information on dissolution rate tests for particulate materials can be found in OECD (2020).
2.3.2.3. Principles
Size‐specific properties or effects of a material composed of small particles, including nanoparticles, are intrinsically linked to the stability of its small particle/nanoscale features. When the material loses these properties, e.g. due to dissolution, it will not be expected to behave differently from its corresponding conventional chemical form (i.e. the soluble substance having the same chemical composition).
The dissolution rate test is aimed to investigate whether a particulate material that is not completely soluble in water (i.e. with solubility < 33.3 g/L6) shows a dissolution rate7 in water indicating that, at the exposure levels expected for consumers, the particles will dissolve, and therefore consumers will not be exposed to small particles even if present in the material as marketed. It is a screening test in water, at room temperature, meant to address point 3 (‘Dissolution/Degradation rate [g/(L×h)]’) in Table 1C of the Guidance on Nano‐RA. If the test criterion is met, conventional risk assessment is sufficient, whereas if the criterion is not met, other appraisal routes should be considered.
In the case of sparingly and (very) slightly soluble materials, the threshold is based on the dissolution process instead of the solubility. Dissolution is a rate, whereas solubility represents an equilibrium situation. This dissolution approach takes explicitly into account the time needed for particles to cross the mucus layer lining the intestinal epithelium and subsequent cellular uptake. If the particles dissolve within this time frame, it can be assumed that uptake does not occur in the form of particles, and thus that there is no systemic exposure to particles. The time required for particles to cross the mucus layer and uptake by intestinal cells is short, i.e. within minutes.8 With this in mind, a cut‐off value for a dissolution/degradation rate based on a half‐life of 10 min is proposed to differentiate the quickly dissolving nanomaterials that can follow a conventional safety assessment according to relevant sectoral guidance, from those requiring further assessment according to this Guidance. This cut‐off value is considered analytically feasible. It is imperative that different time‐points are used to determine the dissolution rate, and that a clear decrease is observed (no plateau).9 The concentration(s) tested should be based on the intended maximum use levels, see below for further details.
For pragmatic reasons the dissolution rate in water is considered; however, key elements of the gastrointestinal conditions – pH and ionic strength – are taken into account.
The general outline of the test strategy is as follows.
The starting point is the identification of the intended maximum use level and the concentration at which the dissolution rate is to be tested. This process includes two steps. The first step is the estimation of the maximum daily amount to be ingested by the consumers. This should be estimated according to the intended use patterns and the exposure assessment methods described in the relevant guidance documents covering the risk assessment of regulated products in the different areas. It should be based on estimations of the maximum concentration in foods and maximum expected consumption of the food conducted according to the relevant sectoral guidance; when the material may be present in several food commodities, the estimation should include the maximum levels per day for the relevant population groups. This step is a standard part of the exposure assessment. The second step is to estimate the concentration at which the dissolution rate is to be tested. This estimation is done by assuming that the amount ingested per day is diluted in the GIT up to a volume of 2 L (Guidance on Nano‐RA). The volume should be adapted to 1 L when the dissolution/degradation is expected to occur only, or mostly, at the acidic conditions of the stomach, as well as in case of assessments for infants and children. In case of doubts on the exposure assessment, applicants may test somewhat higher worst‐case exposure levels for the dissolution rate than those included in the application.
Following the estimation of the concentration to be tested, for solid powdered materials the applicants should use the protocol proposed below (deviations should be justified):
Disperse the test item at room temperature in water containing 85 mmol/L NaHCO3 and 40 mmol/L NaCl,10 at the concentration selected as described above. Allow the soluble components to dissolve under stirring conditions (in general 300 rpm should be sufficient). If there are insoluble particles, these will exist in the medium forming a dispersion. An appropriate dispersion method (see Section 3.2) has to be applied to deagglomerate potential agglomerates. Attention should be paid to employing sonication techniques delivering sufficient energy (i.e. probe sonication11 instead of bath sonication). The analytical report should indicate the equipment used and the operating conditions (time, power output12) and the measured pH.
Analyse this dispersion (t = 0)13 for the chemical substances constituting the particles, e.g. for inorganic materials measure the associated characteristic elements (by techniques such as inductively coupled plasma optical emission spectroscopy (ICP‐OES) or inductively coupled plasma mass spectrometry (ICP‐MS)) after microwave‐assisted digestion.14
Then perform an ultrafiltration of a small aliquot of the dispersion (t = 0) using a membrane filter with pore size in the range 3–10 kDa. The membrane will retain the particles and the filtrate will contain only solubilised components.15 In some cases, filtration through a 0.22‐μm filter may be needed beforehand to remove larger particles (including potential agglomerates and aggregates) and prevent obstruction of the 10‐kDa membranes in the subsequent ultrafiltration step. The time between sampling and ultrafiltration has to be kept to a minimum.
Submit small aliquots of the dispersion at multiple, appropriate time points to the same separation treatment and the filtrate to the same chemical analysis as described above.16 The filtrate should be free of small particles/nanoparticles, which are retained on the membrane surface (if present). At each sampling occasion, care has to be taken to keep the time between sampling and ultrafiltration to a minimum.
The material is considered to degrade/dissolve quickly (i.e. to have a high degradation/dissolution rate with a half‐life of 10 min or less) if the degradation rate profile shows a clear decrease in the presence of particles17 over time (no plateau) and 12% or less of the material (mass‐based) – compared with the concentration at the beginning of the test18 – remains as particles after 30 min. A half‐life of 10 min or less is indicative that no (or a very limited number of) particles will remain to be taken up as such by consumers.19
At least four time points should be tested for the determination of the degradation/dissolution rate. For instance, the ultrafiltration and subsequent analysis should be repeated; in addition to t = 0, also at for example t = 5 min, t = 10 min, t = 30 min and t = 60 min. The degradation/dissolution curve has to be documented and the degradation/dissolution rate at t = 30 min calculated.
If degradation/dissolution is pH‐dependent, the dissolution test should be carried out at different points covering the pH range of physiological relevance (pH = 320 to pH = 7). If 88% dissolution or more is achieved in 30 min at pH = 7 and/or pH = 321 the confirmatory criterion is achieved (see previous bullet point). For the studies conducted at pH = 3, the concentration of test item should be multiplied by two, in order to account for the difference between the volume of the gastric compartment (1 L) and the volume of the gastro‐intestinal track (2 L).
The applicant may also consider the recommendations for degradation/dissolution rate of nanomaterials in the GIT described in the Guidance on Nano‐RA, including the characterisation of the degradation products.
2.3.3. Confirmation of absence of particles for liquid materials
For materials marketed in liquid form, it should be sufficient to demonstrate the absence of particles following ultrafiltration22 that the material is a true liquid and not a dispersion containing small particles.
Applicants should provide mass balance estimations or verification of the absence of small particles including nanoparticles by electron microscopy (EM). Other alternative methods for verifying the absence of the particles in suspension (e.g. see Mech et al., 2020a) may be used if properly justified.
2.3.4. Solubility/dissolution in the marketed product or in food
This appraisal route covers situations when according to the substance properties and the intended uses, consumers will only be exposed to the solubilised material. This happens when the substance will be fully dissolved or degraded into non‐nano forms in the marketed products or in the food of any nature – aqueous, non‐aqueous, semi‐solid, lipophilic, etc. – before ingestion by consumers. In those instances, a conventional risk assessment will therefore be sufficient.
A first situation covers substances marketed in liquid (either aqueous or non‐aqueous) matrices or when all intended uses require a dissolution of the substance in a liquid matrix before consumption. The applicant should provide information on the solubility of the substance in water, in the non‐aqueous matrix,23 or in a relevant solvent, as appropriate, and compare the solubility with the intended/resulting concentration of the substance in that matrix. The submitted information should provide convincing evidence for concluding that the substance will be fully dissolved in the solvent/matrix, and not just dispersed as small particles.
A second situation covers substances that are not intentionally added to food, but their use may lead to transfer or carry‐over of residues in food items.
The first case for this second situation is represented by substances used in FCMs that have solubility less than 33.3 g/L but may transfer from a FCM into food only at such low levels that are solubilised. Depending on the toxicological data, migration limits for non‐genotoxic substances are currently set at between 0.05 and 60 mg/kg food or food simulant (EFSA CEP Panel, 2008 and updates of the Note of Guidance), making 60 mg/L24 a generic upper migration limit for FCM substances (EU Reg. 10/2011). Putting this upper limit in perspective, it can be anticipated that if an FCM substance has solubility greater than 60 mg/L, then its transfer from the FCM to food will be in fully solubilised form and not as particles. In a case where migration of a FCM substance may exceed the prescribed generic limit of 60 mg/L, then from the risk assessment perspective, it will be irrelevant whether it is in solubilised or in particle form because it will not comply with legislation. Therefore, a conventional risk assessment may be sufficient for an FCM substance if its levels migrating into food can be considered to be in solubilised form on the basis of solubility/dissolution rate, or can be demonstrated to be solubilised under worse‐case time‐temperature conditions for the packaging (e.g. under the shortest time and lowest temperature conditions foreseeable for the packed food), before ingestion of the packed food.
The cases associated to carry‐over of residues in food are related to the use of feed additives and pesticides. The sectoral risk assessment processes provide guidance for estimating the nature of the residues (which may differ from the marketed substance) and its magnitude. In these cases, even if the marketed or ‘pristine’ material has a fraction of small particles, the solubility of the substance (or of the substances that constitute the residue) in water, lipids or relevant food simulants may be sufficient for confirming that, at the maximum residue levels of the substance, the residues in the treated animals/plants will be fully dissolved.
When addressing the characteristics and magnitude of expected or permitted levels of materials or their residues in food according to the sectoral guidances, applicants may consider this appraisal route as an alternative to the characterisation of the particle size distribution of the residues in food. Technically, the preferred experimental approach to test for solubility involves (ultra)filtration. However, such measurements in most foods are difficult or even impossible to implement given the capabilities of current methods and the compositional complexity of many foods. Therefore, appropriate food simulants such as those specified for migration testing (e.g. ethanol, acetic acid, olive oil, etc.) of FCM substances (EU Regulation 10/2011) could be used in such situations to provide conclusive evidence on the solubility in the foods that these simulants are representing.
3. Characterisation of the size distribution of the material including the fraction of small particles
3.1. Introduction
This Section includes the information on the particle size distribution that should be included in the application/dossier when the criteria on solubility and dissolution rate dealt with in Section 2 are not met.
For practical reasons and in line with current methods for measuring particle size distribution, the information requirements are divided in two steps: the characterisation of the particle size distribution of the full material and the characterisation of the fraction of small particles (< 500 nm). This characterisation is also needed for applying the appraisal routes described in Section 4.
Particle size is a distribution and should be described accordingly (e.g. see Section 3.4.2.3 for describing the particle size distribution for materials contains a fraction of small particles).
The physical property ‘particle size’ can only be defined unambiguously, i.e. with a single descriptor for particles with a regular shape (e.g. spheres, cubes). More precise in this context is the term ‘external dimension’. Industrial materials often consist of irregularly shaped particles with many possible external dimensions. The size reported for such particles thus strongly depends on the external dimension measured and reported. Many particle size analysis techniques produce equivalent spherical particle diameters and tend to overestimate the minimum external dimensions. The minimum external dimensions of particles with irregular shape can be better assessed by the minimum Feret diameter and/or the maximum inscribed circle diameter. For a detailed discussion of the measurement principles, measurands and how to interpret the results of different sizing techniques, users should consult the NanoDefine Methods Manual (Mech et al., 2020a,b,c. In all cases, users should report and justify the measurand used to estimate the minimum external dimension. It should also be noted that the fraction of small particles, including nanoparticles, require specific attention with regard to the representativeness of sampling and proper dispersion state. All measurements of particle size distribution should ensure a proper dispersion of the sample in line with the recommendations presented in Section 3.2. These recommendations should be also considered for preparing the samples for conducting safety studies and when interpreting results of the studies. Also, possibilities for deagglomeration of the small particles under different testing and physiological conditions should be considered in risk assessment (OECD, 2012; Peters et al., 2012 (ACS NANO, 2012)).
3.2. Dispersion protocol for sample preparation
Dispersion of materials composed of small particles (usually powders) in liquids is an important step in the sample preparation for most common particle size measurement methods. The dispersion procedure used may influence the particle size distribution measurements. For material characterisation, the final liquid dispersion of the material should result in a particle size distribution that consists of the smallest dispersible particles.25 The dispersion also needs to be sufficiently stable, i.e. show a constant size distribution pattern or minimal re‐agglomeration, avoiding particle sedimentation over the time necessary to carry out particle size measurements or for application in in vitro or in vivo toxicological tests.
Due to the likelihood of high physical and chemical variability amongst materials, a generally applicable standard operating procedure (SOP) is currently not available for dispersion of a dry powder in liquids. The following general steps should be considered when developing a dispersion procedure (Mech et al., 2020c):
Choice of media, pre‐dispersion and wetting can be the main limitations for an instrumental method used later.
Choice of the method for deagglomeration/disaggregation of the material; the input energy used – i.e. is it sufficient to deagglomerate/disaggregate without changing the particle morphology. A general choice for most materials with a fraction of small particles is ultrasonic treatment using either a probe or vial sonicator.
Stabilisation is the final and complex step in the process, therefore consideration of the choice of stabiliser is needed, along with other possible variables such as compatibility of the stabilisation method with the measurement method. Effectiveness of the stabilisation including the timescale for which stability must be ensured.
Concerning step (ii), it has to be noted that sonication may introduce a significant variability in the dispersion process due to the differences amongst the variety of sonication instruments that are available on the market. In order to reduce this variability, a ‘Generic SOP for calorimetric calibration of an ultrasonic probe sonication’ has been developed (Mech et al., 2020c). This SOP allows harmonisation in the use of different sonication instruments and methods (probe versus vial) by determination of the actual energy effectively transferred to the test sample.
For the purposes of this Guidance on Particle‐TR, a dispersion protocol can be considered effective if it yields samples which consist as much as possible of non‐agglomerated/non‐aggregated particles. To monitor the effectiveness of a protocol, analytical methods, which can reliably distinguish constituent particles from agglomerates and aggregates, are required. Suitable methods are those based on EM techniques, such as SEM or TEM. As EM methods require dry samples, care must be taken to optimise the specimen preparation to minimise re‐agglomeration of particulates during specimen drying. If it is not possible to verify agglomeration and aggregation state with EM, efforts should be made to empirically verify that the protocol has been optimised to produce the minimum mean particle size possible with the facilities available for dispersion. To do this, the dispersion steps should be applied systematically using different sonication times and fixed power settings with the mean particle size being measured by methods such as centrifugal liquid sedimentation (CLS), dynamic light scattering (DLS), Asymmetric Flow Field Flow Fractionation (AF4) (associated to suitable detection methods) or single particle ICP‐MS, as appropriate based on the concentration of the dispersion and the nature of the material. The most suitable sonication time and power should be chosen as the time when further incremental increases in sonication time and/or power do not result in significant further changes in mean size (Rauscher et al., 2019a).
As mentioned above, there is no universally applicable test protocol for preparing stable dispersions of materials with a fraction of small particles. On the other hand, in the scientific literature numerous specific methods for certain types of particles are reported. A more systematic approach has been proposed in the NanoDefine EU‐project, where a specific optimised dispersion protocol was developed for a number of priority nanomaterials and laid down in the form of SOPs (Mech et al., 2020c). Examples of these substances are CaCO3 (fine grade), BaSO4 (fine and ultrafine grade), kaolin, coated TiO2 (pigment grade), zeolite powder or MWCNT (highly tangled fibrous carbonaceous material). For each of these materials, specific dispersion requirements need to be met, along with corresponding types of dispersants, stabilisers and sonication conditions. Typical probe sonication dispersion conditions involve applying energies between 600 J/mL and 2,500 J/mL sample volume. These SOPs can serve as a starting point or guide templates for developing protocols for other materials on the basis of physicochemical similarities with one of the standard nanomaterials used in developing the SOPs.
As elaborated in a JRC report (Rauscher et al., 2019a) the effective stability (resistance to re‐agglomeration and/or selective sedimentation) of a prepared sample for the time between sample preparation and the end of the measurement should be verified.
In order to check the stability of dispersions, periodic verifications should be made of the apparent particle size distribution from stock dispersions using at least one technique which is sensitive to changes in particle size and quantity. CLS can be used to very sensitively reveal any change in size distribution, and therefore CLS can be regarded as well suitable for such verification – assuming the expected particle size range and density are compatible with the lower size limit of the CLS instrument being used. Re‐agglomeration changes the particle size distribution and often leads to sedimentation. However, certain dispersions may change over time due to gravitational sedimentation only (without re‐agglomeration); this can be easily reversed and therefore would not be regarded as instability of the dispersion. Before verifying size distributions with CLS or other appropriate alternative the sample dispersion should be re‐homogenised by a short period (few minutes) of bath sonication.
After dispersion, particles may re‐agglomerate. Therefore, it is important to ensure that suspensions are prepared with the intention of achieving sufficient dispersion stability to allow appropriate measurement of the needed parameters. Hence, further to optimising the dispersion energy mentioned above, additional steps should be taken to avoid re‐agglomeration of dispersed particles for the applied measurement techniques. In the case of aqueous dispersions this may be achieved by natural electrostatic stabilisation and appropriate modification of the pH value. In many cases, it may be necessary to add a dispersing agent or a surfactant. The choice of, e.g. surfactants depends on the intrinsic properties such as hydrophobicity, surface charge and chemical functionality of the specific material under consideration. Commercially available chemical surfactants e.g. phosphate, sulfonate or polyethylene glycol and others have been successfully applied for the above‐mentioned priority nanomaterials. Where applicable, measurements of the zeta potential can be useful to check whether a dispersion is expected to be stable for a sufficiently long period of time. An absolute value higher than 25 mV would be indicative for sufficient stability (Dukhin and Xu, 2020). As a guide, a minimum required stability time of 30 min has been suggested for these priority nanomaterials for the various applied measurement techniques as described by Mech et al., 2020c.
Other protocols for the preparation of nanomaterial dispersions by sonification and guidance for optimisation of the tests conditions and process parameters have also been published elsewhere (Taurozzi et al., 2012a,b).
Concerning characterisation of the dispersion stability, ISO Guidelines (ISO, 2013) and an OECD test approach for nanomaterials in simulated environmental media (OECD, 2017) have addressed the key aspects and described a method based on dispersion and re‐agglomeration characteristics of nanomaterials.
It is recommended that applicants follow the ISO and OECD guidelines mentioned above to adopt appropriate methods for preparing stable dispersions of their materials. In case of a broad particle size distribution with a high content of large particles, it may be necessary to remove the larger sized particle fraction by means of filtration or centrifugation, and then apply the guidelines to the remaining smaller particle fraction.
3.3. Characterisation of the particle size distribution
The characterisation of the particle size distribution is needed for all materials for which the solubility or dissolution rate cannot exclude the likelihood of exposure of consumers to undissolved particles. Considering currently available methods, a practical threshold of 500 nm as the upper limit for the range of ‘small particles’ is proposed. When a fraction of small particles is detected, the information provided in this section on the characteristics of this fraction is also needed for the appraisal routes described in Section 4, and consequently should be provided by the applicant even when the appraisal criteria are not met.
3.3.1. Particle size distribution of the material
3.3.1.1. Decision criteria
When the material is not expected to have a fraction at the nanoscale, the applicant should demonstrate that the particles are equal to or larger than 500 nm after a proper dispersion of the test material. The method(s) used for this assessment should provide convincing evidence that the material contains less than 10% particles (number‐based) with at least one dimension smaller than 500 nm.
3.3.1.2. Information required and methods
Different methods can be used for characterising the particle size distribution of the material. For the assessment of the fraction of small particles, these methods should be suitable for detecting particles with at least one dimension smaller than 500 nm.
Methods allowing the detection of small particles include:
Centrifugal liquid sedimentation
Particle tracking analysis
Descriptive electron microscopy
Filtration complemented with chemical analysis
The applicant should select the method(s) according to the characteristics of the material and justify the selection. The applicant may select a method other than those listed above. However, the applicant must justify the selection of a different method from those listed above. For each method, a description of the test conditions, including the sample preparation and dispersion protocols, the range of particle sizes covered by the method, and the detection accuracy within the relevant range of particle sizes should be reported. The selected method or methods should provide convincing evidence that the material contains less than 10% of particles (number‐based) with at least one dimension smaller than 500 nm. A combination of different methods may be needed in some cases.
3.3.1.3. Principles
This appraisal route offers an applicant the possibility to confirm using the screening methods that the particles are equal to, or larger than 500 nm, and as such contain only a very small proportion of the particles in the nanoscale.
The rationale behind this appraisal route is that particle uptake from the GIT has been generally found to be possible for sizes up to 250 nm. As described in more detail in the Guidance on Nano‐RA, the optimum size for particle uptake from GIT has been generally found to be smaller than this value, but there is some evidence that particles sized up to 250 nm can be absorbed with certain surface modifications/coatings (e.g. see the review by Chaudhry et al., 2008). Materials that only contain a negligible fraction of particles smaller than 250 nm would not have to undergo a nanospecific assessment. An uncertainty factor of 2 is applied to account for the limitations of available screening techniques for size measurements resulting in a limit of 500 nm. Limitations include the particle size range that can be detected, limits of quantification, conversion into number‐based distributions.
Assuming a normal size distribution of the full material (which represents a worst‐case scenario for conventional materials), 10% or less of the particles being smaller than 500 nm implies that the fraction of nanosized particles (1–100 nm) will be minimal and that the likelihood of a risk from their uptake is negligible. Important is that the applicant assures that the selected method for determining the size distribution covers this 10% threshold.
The proposed value of 10% number‐based particle size smaller than 500 nm is therefore considered sufficient to cover that the uptake of particles through the gastrointestinal epithelium would be only negligible, and a conventional risk assessment should be sufficient, with no need for further assessment of the material properties at the nanoscale.
3.3.1.4. Centrifugal liquid sedimentation
A relatively quick and economic method of ascertaining the presence of small particles in a dispersion of particulate material is through analysis by CLS. CLS is a scaled‐down version of analytical centrifugation that is designed in the form of a rotating disc, which contains a thin layer of liquid sucrose gradient. When a sample of particle dispersion is applied at the centre of the disc, which is rotating at around 24,000 rpm (30,000 G‐force), the centrifugal force leads the particles to sediment and travel outwards at velocities dependent on their particle size and morphology. Using X‐ray diffraction or optical detection, a typical equipment can measure the velocity of particle sedimentation to calculate particle size distribution against standards of known particle density and size. The method is regarded as quick, highly reproducible, and with a good sensitivity that can range from 3 nm to several μm (e.g. see validation study by Braun et al., 2011). Analysis of low‐density materials can require much longer times, but special discs are also available that can reduce the run time. The equipment is generally also accompanied with proprietary software that can convert mass‐based particle size distribution into number‐based values on the basis of particle morphology and density. Such a conversion may however be prone to errors, especially when the concentration of a nanofraction is very low as the instrumental ‘noise’ may also be counted as a particle signal.
There is ISO standard 13318 series for the method, which is also mentioned in the REACH guidance R7.1 for the characterisation of nanomaterials (ISO, 2001a, 2007a,b). Standard operating procedures for CLS have been developed by the NanoReg project for particle size determination.26
3.3.1.5. Particle tracking analysis
The evaluation of the number‐based particle size distribution in liquid dispersions can be effectively carried out using the particle tracking analysis (PTA) method for diffusion velocity measurements. PTA, also known as nanoparticle tracking analysis in some instrumental versions, is a single particle technique where scattered laser light is recorded with a microscope and a digital camera. The Brownian motion of the particles, as recorded in a video, is processed by the software to determine the diffusion coefficient for each constituent particle and from it calculate the hydrodynamic diameter.27
By means of PTA the sizing and number concentration measurement of particles in the size range of one or few tens of nm (depending on the chemical nature of the material) up to 1 μm approximately can be performed in aqueous suspensions. PTA measures the hydrodynamic diameter using the spherical model as DLS does but suffers less perturbation from large particles in polydisperse samples compared to DLS. However, the measured hydrodynamic diameter can be affected by the salt concentration of the suspending medium, pH and concentration of the dispersant. Therefore, the effects of these parameters should be investigated or controlled. For instance, when performing sample dilutions to obtain the optimal concentration for PTA measurement – which is in the range 106–109 particles/mL – it is important to ensure that the ionic strength, stabilizer concentration and pH are kept constant. All these parameters should be documented and reported. Reduction of dispersant concentration and changes in pH can lead to particle agglomeration and increase in polydispersity of the sample.
There is an ISO standard for the PTA method (ISO 19430:2016 (ISO, 2016)), whereas other sources are available which describe method validations (Kestens et al., 2017), interlaboratory comparisons (Hole et al., 2013; Maguire et al., 2017), and provide SOPs (EUNCL, 2018).
3.3.1.6. Descriptive electron microscopy
To assess the presence of nanoparticles, and before more advanced quantitative analyses are initiated, a detailed description of the material is a first and essential step to determine the basic properties of the examined nanoparticles and to assess the quality of the sample and specimen preparation.
This method may be used to confirm that the fraction of small particles is just a tail resulting from a manufacturing process of a powder and that all particles have similar characteristics except for size.
Based on a series of electron micrographs recorded at magnifications typically ranging from 100 to 100,000 times, and representative for the entire specimen, an overview of the specimen, and the properties of the nanoparticles of interest such as size, shape, surface and inner morphology, and crystallographic structure, can be visualised by the electron microscope. A descriptive EM analysis includes, at least, representative and calibrated micrographs, and a description of the following parameters: (i) the roughly estimated size (distribution) of the constituent and aggregated/agglomerated particles; (ii) the agglomeration and aggregation status; (iii) the general morphology; (iv) the surface topology; (v) the structure (crystalline, amorphous, etc.); and (vi) the presence of contaminants and aberrant particles. If contaminants are observed, such as salt crystals, organic matter, protein agglomerates, lipids, other type of particles (e.g. catalysts), they should be described and reported; in addition, selected micrographs can highlight unusual or rare features, such as impurities and crystal defects.
When nanoparticles are observed, a descriptive EM analysis should further report the specimen quality describing possible impurities and artefacts, the density of particles (number/surface area) in the EM specimen, their contrast with the background and how even they are distributed on the EM specimen. On the basis of these parameters, the relevance and suitability of a quantitative EM analysis of the examined specimen, and the need for optimization of the sample and specimen preparation should be assessed.
The characteristics of the objects of interest such as aggregates and agglomerates, and of the constituent particles, are described in Appendix A, Table A.1.
Table B.1.
Best practices for extracting and reporting information from existing safety studies. Similar steps can be used and adapted for presenting information from in vitro studies
| Elements to be extracted from the study report of in vivo studies | Related info to be reported by applicants | |
|---|---|---|
| Test material1 |
|
|
| Test material preparation |
|
|
| Preparation of doses |
|
|
| Test material administration |
|
|
For multi‐constituent substances and mixtures, each constituent/component should be assessed independently.
Info provided should be in line with Section 2 of the Guidance on Particle‐TR.
Info provided should be in line with Section 3 of the Guidance on Particle‐TR.
Note that full dispersion cannot be observed by visual examination or with the aid of an inverted microscope.
Note that higher doses may show a higher degree of agglomeration as compared to lower doses.
For each sample, the report of a descriptive EM analysis must include a detailed description in text form of the above‐mentioned six parameters. To categorise and describe the shape of aggregates and agglomerates (Appendix A, Figure A.1 (A)), the system of López‐de‐Uralde et al. (2010) is proposed. To categorise and describe the surface topology (Appendix A, Figure A.1 (A,B)), and the shape of constituent particles (Appendix A, Figure A.2), the systems of Krumbein and Sloss (1963), and Muñoz‐Mármol et al. (2015), respectively, are proposed.
Figure A.1.
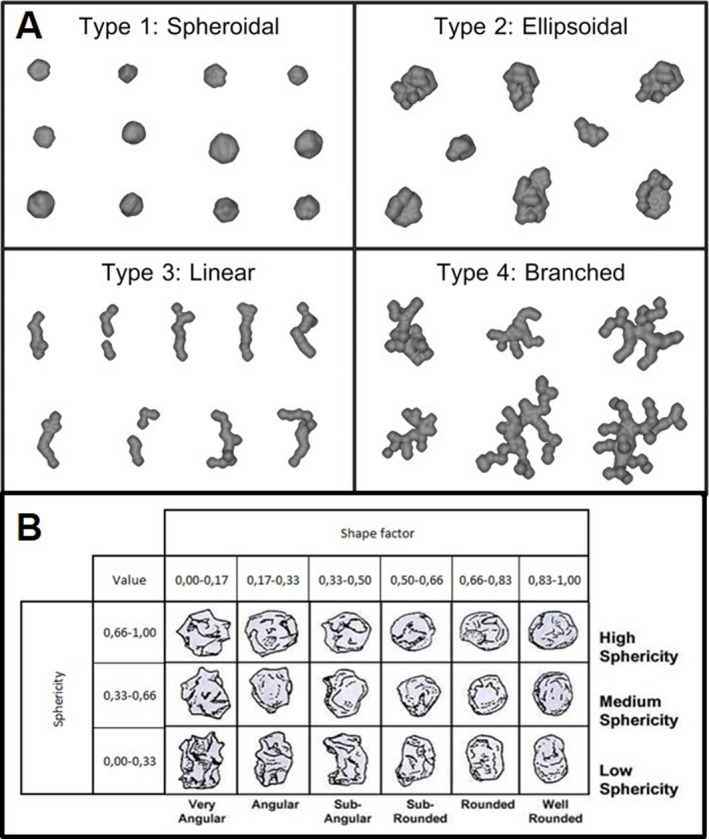
Description of the shape of aggregates/agglomerates (A) according to López‐de‐Uralde, and of the surface topology of constituent particles (B; sphericity and shape factor) according to Krumbein and Sloss. These figures correspond to Figures 3 and 5, respectively, of the NANoREG Deliverable 2.10 available at http://portal.s2nano.org:8282/files/TEM_protocol_NANoREG.pdf
Furthermore, calibrated micrographs must be provided giving an overview of the sample, as well as calibrated micrographs showing the (smallest) constituent particles. The magnification of the latter can be determined based on the criterion of Merkus (2009).
For convenience, a tabulated summary of this description, as exemplified in Appendix A, Table A.1, is proposed for efficient reporting of the descriptive EM results assuring uniformity in reporting, reducing misunderstanding by suggesting a set of possible descriptions.
3.3.1.7. Filtration complemented with chemical analysis
The approach described in Section 2.3.2, based on filtration and analytical determination of the substance(s) constituting the particles before and after filtration, can be used to gain an insight into the mass‐based particle size distribution of a material and, specifically, to assess the fraction of small particles (< 500 nm).
A sequential, stepwise approach should be used to characterise the mass fraction of (i) particles ≥ 500 nm, (ii) particles < 500 nm and (iii) dissolved species.
As far as the mass fraction of particles ≥ 500 nm is concerned, several membrane filters with pore sizes ≥ 0.5 μm should be used and the results appropriately described and interpreted. Membranes made of different materials should be compared and data which are worst case (i.e. indicating the lowest amount of particles ≥ 500 nm) should be selected for the size characterisation. This is due to the fact that filtration overestimates the amount of larger particles because a fraction of particles smaller than the pore sizes are always retained on the membrane due to the build‐up of material on the membrane surface and physicochemical interactions of the particles with the membrane material. In some cases, filtration through membranes with (considerably) larger pore sizes may be needed beforehand to remove very large particles (including potential agglomerates and aggregates) and prevent obstruction of the 0.5 μm membrane.
For the characterisation of the small particles (< 500 nm), the filtrate (‘worst‐case’) has to be subjected to ultrafiltration using a membrane filter with molecular weight cut‐off in the range 3–10 kDa. The membrane will retain the small particles and the filtrate will contain only soluble components.
The mass‐fraction corresponding to the small particles (corrected for the soluble fraction, if any) has to be compared to the one of the particles ≥ 500 nm. The particle size distribution data can be converted from mass‐ to number‐based by using assumptions (e.g. spherical particle shape) and appropriate algorithms. Range of plausible values should be obtained using upper‐ and lower‐bound values for the number‐based particle size distribution.
The measurement process should be clearly documented and quality control demonstrated by using an adequate number of (certified) reference materials (or, if not available, size control samples) matching as close as possible the chemical composition and the physicochemical properties of the material to be characterised. The experimental design and the results should be discussed in a transparent way and the conclusions justified.
3.4. Characterisation of the fraction of small particles
If a fraction of small particles (particles < 500 nm) is expected or identified, the applicant should provide additional information on this fraction, starting with a description of the particles, e.g. using descriptive EM as presented in Section 3.3.1.6, followed by a quantitative assessment of the size distribution of the fraction of small particles.
A proper dispersion of the sample according to the recommendations in Section 3.2 is essential.
3.4.1. Identification of a fraction at the nanoscale
As indicated in Section 3.3.1.3, in line with the Guidance on Nano‐RA, no specific concern regarding the nanoscale is needed for particles larger than 250 nm.
3.4.1.1. Information required and methods
Electron microscopy is proposed as the recommended method to determine the size distribution of the fraction of small particles. In specific cases, e.g. for platelet‐shape particles, where due to preferential orientation of the particles on the grid (support) their minimal external dimension is not accessible for measurement, alternative approaches, such adapted specimen preparation (e.g. resin embedded samples) and detection methods (e.g. atomic force microscopy) can be instrumental. The applicant should justify the use of other methods and provide sufficient evidence on the limit of particle size detection and the level of dispersion avoiding the aggregation/agglomeration of the particles.
3.4.1.2. Decision criterion
When the fraction of the material with a particle size below 500 nm (sub‐500 nm fraction) contains less than 10% particles (number‐based) with at least one dimension smaller than 250 nm, the material is adequately covered by the conventional safety assessment and does not require an additional assessment for the fraction of small particles. The 10% is a technical threshold based on the measurement uncertainty that can be achieved under typical conditions with the currently available EM methods.
This criterion can also be applied to mixtures. Each substance in the mixture should be tested separately and meet the criterion. If some components in the mixture do not meet this criterion, additional information on the fraction of small particles of those components should be presented.
The rationale for this criterion is the same as for Section 3.3.1.3, except that constituent particles can be determined with EM. This takes away the uncertainty whether constituent particles, agglomerates or aggregates are measured. This is important, as agglomerates may disintegrate.
3.4.1.3. Principles
This consideration implements a pragmatic trigger for materials consisting of or containing a significant fraction of small particles, to be applied when the large majority of the material is not at the nanoscale but a tail of particle size distribution at the nanoscale may be present due to the manufacturing process. When the fraction of the material with a particle size below 500 nm contains less than 10% particles (number‐based) with at least one dimension smaller than 250 nm, the total mass of particles at the nanoscale would be very low.
In addition to the numerical criteria, a description of the fraction of small particles (i.e. particles smaller than 500 nm) should confirm that the particles at the nanoscale are just part of the size distribution tail resulting from a manufacturing process of the powder and that all particles have similar characteristics except for size. This confirmation plus the use of conservative thresholds offers a conservative approach, a conventional risk assessment is sufficient and no further assessment for properties at the nanoscale is needed.
3.4.1.4. Specimen preparation for EM analysis
Specimen preparation for EM analysis aims at depositing on a carrier suitable for EM analysis a fraction of particles which optimally represents the particles in the sample and which allows detecting and measuring the constituent particles individually. Critical parameters that need to be controlled and reported are the level of dispersion of the particles, the type of carrier, the compatibility of the particle charge with the charge of the carrier and the particle concentration.
The quality of EM particle size and shape measurement results strongly depends on sample and specimen preparation. Standard methods for depositing (nano)particles on measurement substrates are described, for example, in ISO/DIS 19749 (ISO, 2020a) for SEM and ISO 21363:2020 (ISO, 2020b) for TEM. There is, however, no single best preparation method for all particles, rather suitability of the methods is determined by the characteristics of nanoparticles and the measurand, the quantity intended to be measured. It is indispensable to ensure that the EM specimens are representative and relevant to the measurand. The knowledge about and the number of methods of nanoparticle deposition are growing rapidly, and it is advisable to explore and use the most suitable methods from the available literature that are specific to the nanoparticle measurand and the material type (Vladár and Hodoroaba, 2020).
Suspensions of particles in their most dispersed state, prepared as described in Section 3.2 are suitable to prepare specimens for both descriptive and quantitative EM analyses.
Detailed guidelines to select suitable carriers for TEM analysis, approaches to tailor the EM grids to the particles and to deposit and concentrate particles to the EM grids are proposed in Mast et al., 2015, 2020 and in CEN/TS 17273:2018 (CEN, 2018). CEN/TS 17273:2018 provides specific guidance on the preparation of EM specimens for detection and identification of nanoparticles in complex matrices using EM. A detailed standard operating procedure on EM specimen preparation: ‘Preparation of EM‐grids containing a representative sample of a dispersed nanomaterial’ describing how to bring a dispersed nanomaterial in contact with an EM‐grid, and to select the appropriate concentration of the nanomaterial, and the type and charge of the grid is provided by NANoREG D2.10 SOP 01.28 It should be noted that during specimen preparation, care should be taken to avoid precipitation of soluble materials such as salts, on the EM grid, e.g. by including suitable washing steps after bringing the particles on the grid.
Specific guidelines for SEM sample specimen are described by Vladár and Hodoroaba, 2020.
For TEM and STEM analysis, EM grids are typically applied as sample carriers. For SEM analyses, various types of carriers, including SEM stubs, are applied. All TEM specimens are, however, suitable for SEM imaging, so nanoparticle preparation methods published for TEM imaging and measurement also apply to sample preparation for SEM. The use of TEM grids is recommended as a carrier for all types of EM analysis (TEM, STEM and SEM) to optimally control specimen preparation conditions and obtain best limits of detection (CEN/TS 17273:2018) (CEN, 2018). Approaches to prepare EM specimens from dry powders, often applied to prepare conventional SEM specimens, are only suitable if particles properties are monodispersed or if particles are well separated and not (strongly) agglomerated.
A sufficiently high number of particles has to be deposited, ideally as single particles, to assure efficient analysis of a representative fraction of particles. At the same time, however, care has to be taken not to overload the carrier with particles because overlapping particles will limit particle detection and the applicability of image analyses methods to accurately measure the particles. Overlay of particles, certainly in multiple layers and of polydisperse materials, must be avoided, because it results in larger particles blocking imaging of smaller particles and consequently in biased measurements. As a rule of thumb, a coverage with nanoparticles of a few percent of the TEM grid surface is well suited for descriptive and subsequent quantitative EM analysis with image analyses. In case samples are very polydispersed in size, simultaneously containing micrometer‐ and nanometer‐sized particles, omission, e.g. by sieving, of the largest particles that can cover large parts of the EM‐grid, might be necessary to make detection of the fraction of nanosized particles possible.
3.4.2. Characterisation of the fraction of small particles by quantitative electron microscopy
When the decision criteria described under Sections 2 and 3 above are not met, the applicant should provide a characterisation of the fraction of small particles using EM.
Electron microscopy allows to visualise and identify individual objects of interest based on specific criteria such as size, shape, crystallographic structure, and elemental composition. It is one of the few methods that, to some extent, allow to identify constituent particles in aggregates and agglomerates. Due to its high spatial resolution in two dimensions, EM analysis covers a size range of 1 nm to 1000 nm, depending on the type and configuration of the EM. Possibilities and limitations of quantitative EM to characterise the fraction of nanosized particles are reviewed in Mast et al., 2015, 2020.
By combining EM imaging with image analysis, the properties of individual objects, such as the size, shape and surface texture, can be estimated from their two‐dimensional projection. Combining these measurements, the material can be characterised quantitatively as number‐based distributions and corresponding descriptive statistics of selected measurands.
Guidance on the determination and reporting of size and shape distributions based on SEM and TEM images of both nanoscale and larger than nanoscale particles is provided in ISO/DIS19749 and ISO 21363:2020 (ISO, 2020b). Guidance on sample preparation, particle detection, imaging and identification of nanoparticles in complex matrices is provided in CEN/TS 17273:2018 (CEN, 2018). This technical specification provides approaches combining identification of specific particles by their elemental composition using analytical methods including energy‐dispersive X‐ray spectrometry (EDX) with measurement of particle properties from representative images obtained by EM imaging. This guideline is particularly relevant to characterize particles in complex matrices and multiconstituent mixtures, and it is also useful for EM analysis of relatively pure materials and materials in simple matrices.
3.4.2.1. EM imaging
EM imaging for quantitative EM analysis aims to record a set of calibrated electron micrographs showing objects that are representative of the objects deposited on the EM carrier, typically an EM‐grid. The conditions for TEM, STEM, SEM and transmission scanning EM (TSEM) imaging suitable for quantitative particle analysis can be determined from the following general guidelines.
Before image analysis is initiated, particular attention has to be given to the optimisation of the dispersion and specimen preparation protocols because poor separation and overlap tend to bias particle identification and measurement. Image analysis is much easier and gives more accurate measurements when particles are well separated and not overlapping (Dudkiewicz et al., 2019; Verleysen et al., 2020).
Before analysis, the electron microscope must be suitably aligned to reach lens conditions optimal for EM imaging, and calibrated using appropriate (certified) reference materials to assure accurate measurement results traceable to the standard unit of length (metre) in the International System of Units (SI). Guidelines for EM alignment and calibration are provided in the magnification calibration guidance document ISO 29301(ISO, 2017).
The magnification for EM imaging should be selected such that the useful working range covers the size distribution of the analysed particles. This useful range is determined by the lower and upper size quantification limits, as defined in CEN/TS 17273:2018 (CEN, 2018). Briefly, the magnification should be selected in such a way that the size of the smallest particle to be measured, which is estimated during the descriptive TEM analysis (Section 3.3.1.6) complies with the criterion of Merkus (2009). This criterion requires that the area of equiaxial particles consists of at least one hundred pixels assuring that large systematic deviations in size measurements are avoided. To measure the dimensions of non‐equiaxial particles, as a rule of thumb, the minimum external particle dimension should consist of at least 10 pixels (CEN/TS 17273:2018) (CEN, 2018). The upper size quantification limit is set to the size of pixels making up one‐tenth of the image size in one dimension, according to ISO 13322‐1. Post‐analysis, the appropriateness of the chosen magnification can be evaluated based on the percentages of particles smaller and larger than, respectively, the lower and upper limits of quantification. These percentages should be reported.
The applicant must assure that the recorded micrographs are representative for the specimen, avoiding selectivity during imaging, for example, by applying a random and systematic imaging scheme. De Temmerman et al. (2012) and Verleysen et al. (2014) addressed this by recording images at several positions, pre‐defined by the microscope stage, that were distributed over the entire grid.
3.4.2.2. Image analysis
Particles visualised in electron micrographs can be detected and measured using manual and (semi)automated approaches provided that individual objects of interest can be detected and identified based on criteria such as mass‐thickness contrast, elemental composition, size, morphology and crystallographic structure. Manual particle measurement is still applied for complex samples and particle types (Hougaard et al., 2013) and to validate new, automated approaches (De Temmerman et al., 2014a). It is, however, prone to operator bias, measures only a limited number and types of measurands, and is relatively time‐consuming and labour‐intensive. In many cases, (semi‐)automatic approaches are more efficient and accurate. ISO 13322‐1:2006 provides a standardised description of the technique used to analyse particles, including nanoparticles, in static images, such as electron micrographs.
Specific guidance for TEM‐based particle size and shape measurement is provided in ISO 21363:2020 (ISO, 2020b) and CEN/TS 17273:2018 (CEN, 2018). Many of these guidelines can be applied for SEM and scanning transmission electron microscopic (STEM) analyses too. A typical image analysis consists of an image preparation step, the setting and adjusting of the threshold value for particle detection, the definition of the detection area, the setting of the detection parameters and the detection and the selection of measurands and measurement of objects of interest (CEN/TS 17273:2018) (CEN, 2018).
Approaches for image preparation, algorithms to suppress the background signal and to identify constituent particles in aggregates and agglomerates are rapidly evolving. They should be optimised for types of particles and overlap of particles (Wagner and Eglinger, 2017).
A range of size and shape measurands (descriptors) can be measured according to ISO 9276‐6:2008 (ISO, 2008a) in function of the purpose of the analyses, but reported measurands should include, at least, an estimate of the minimum external particle dimension, such as the minimum Feret diameter, and the aspect ratio, quantifying the particles elongation.
3.4.2.3. Representation of measurement results
ISO standards provide detailed guidelines for the representation of the results of analyses of particle size (ISO 9276‐2:2014 (ISO, 2014b) and ISO 9276‐5:2005 (ISO, 2005)), particle shape and morphology (ISO 9276‐6:2008) (ISO, 2008a), the fitting of distributions (ISO 9276‐3:2008 (ISO, 2008b)) and the classification of particles (ISO 9276‐4:2001 (ISO, 2001b)). Each report should present at least the number‐based size and shape distributions (minimum Feret diameter and aspect ratio), and the corresponding descriptive statistics (Median, Q25, Q75, % < 100 nm, % < 250 nm).
The results should, as for any other quantitative analytical methods, be reported with an estimate of the measurement uncertainty obtained by a valid procedure to estimate measurement uncertainty according to ISO 98‐3:2008. Examples of EM method validation studies estimating measurement uncertainty are published by Dudkiewicz et al. (2015), Waegeneers et al. (2019), Verleysen et al. (2019, 2020). One of the factors that determine the robustness of the measurements is the number of analysed particles. By the numerical method of Masuda and Gotoh (1999) described in ISO 13322‐1:2014 (ISO, 2014a) which assumes a log‐normal distribution of the relevant measurand, and by determining the relation between the number of measured particles and the measurement uncertainty for the relevant measurand (De Temmerman et al., 2013, 2014a,b; Verleysen et al., 2015), the number of particles required to estimate a measurand with a known uncertainty can be objectified.
3.4.3. Considerations for materials with broad specifications
For the characterisation of the fraction of small particles of the marketed material as described in Section 3.4.2, the following elements should be considered when under the same specifications and legal frame, the material may be marketed as a variety of types with different characteristics (e.g. types containing different amounts of nanoparticles within the range indicated in the specifications; different crystallinity).
The specifications should include information on the fraction of small particles (i.e. size/range, number‐ and mass‐based, of the nanofraction; and the characteristics of the nanoparticles, i.e. description and acceptable ranges for the nanorelevant physicochemical parameters, if possible according to the Guidance on Nano‐RA), and the applicant should provide safety data taking into account and closely matching those ranges. Manufacturing of a material by different processes, or by the same process but under different conditions or by different manufacturers, can potentially alter the physicochemical characteristics of the material. Where data on different batches indicate a significant difference in the physicochemical characteristics between batches, it is important that detailed specifications of the material produced by different processes or conditions are provided by the applicant. The applicant should also provide information on the characteristics of the test material used in the safety studies. In case of incomplete characterisation of the test material, detailed information on the production process and conditions should be provided. The applicant should also provide information on the effect of ageing on the materials including particle agglomeration, aggregation and sedimentation behaviour.
The applicant should indicate the physicochemical characteristics considered worst case for the safety assessment. Such a rationale should comprise considerations for toxicokinetics (e.g. absorption, distribution, accumulation) as well as hazard. This exercise is similar to that of read‐across for a given endpoint, as elaborated in Section 6.3 in the Guidance on Nano‐RA. If such a rationale cannot be provided, multiple representative materials would need to be investigated that cover all physicochemical properties within the provided ranges. This may, for example, be the case, when different shapes and surface coatings, coating thickness or surface properties are present in the material according to the specifications provided by the applicant.
On the basis of this information, a risk assessor can decide whether the batch(es) used in toxicity testing cover(s) the worst‐case situation and therefore, can be used in risk assessment of the material. For example, it can be checked whether a material that represents the size distribution with the smallest particles sizes of the possible range has been tested, since these materials can be assumed to be orally absorbed to a greater extent than materials composed of larger particles and are typically more reactive due to their larger volume specific surface area.
For mixtures and formulations, a description should be provided to indicate the form in which the material is present in a mixture or formulation, e.g. powder, dispersion. The information should cover all components, as well as dispersants/stabilisers and other auxiliaries (e.g. preservatives, processing aids, etc.) used.
4. Evidence to be submitted on safety studies conducted without documented consideration of the properties of small particles
This Section focuses on the information to be provided on safety studies originally designed for addressing conventional materials, in order to ensure that the possible adverse effects linked to the fraction of small particles, including nanoparticles, can be identified by the study. These studies are referred here as ‘existing safety studies’.
There are two essential conditions to be followed by the applicant, interested parties, and risk assessors, regarding existing safety studies that were not originally designed to specifically consider the presence of a fraction of small particles, including guideline studies and scientific publications retrieved from literature reviews:
The available information should demonstrate that the test material includes the fraction of small particles. In case of broad‐range technical specifications of the bulk material that is placed on the market, the full range of small particles or at least the conditions representing the worst case, has to be covered by the test materials used in the existing studies.
The study selection, study design and the level of dispersion/degree of agglomeration of the test material, should be appropriate for assessing the hazard of small particles including nanoparticles.
The possibility to read‐across from existing information of a similar material, for example to a material with a smaller particle fraction, can be considered (see Section 4.2).
These elements are detailed in the Sections below. In addition, some recommendations are provided for deciding how to gather additional information when the available studies do not cover the possible hazards associated to the fraction of small particles.
The principles below focus on the safety assessment of consumers exposed to nanoparticles through the diet. For feed additive applications, these principles are also generally applicable to the safety assessment of the target animals exposed to nanoparticle‐containing feed. The Guidance on Nano‐RA includes an Appendix detailing the specific considerations for the assessment of nanomaterials as feed additives. Those considerations are also applicable to conventional materials containing a fraction of small particles including particles at the nanoscale. When the assessment indicates that consumers will be exposed to nanoparticles through the consumption of animal products, the provisions highlighted in this Section are also applicable.
4.1. Information to demonstrate that the tested materials used in the existing safety studies included the fraction of small particles
A comparison of the characterisation of the particles (see Section 3) in the material as marketed and in the material used for the safety studies should be presented for each study. In line with the Guidance on Nano‐RA and ECHA (2019), the information should include: chemical composition (confirming identity or presenting the differences with that of the bulk material), size, crystallinity, shape, purity, and, if relevant, surface modifications. If this information is lacking in the study report but the batch used as test material is still available and the stability of the material, including its particle size distribution, can be confirmed, this information should be generated.
If the test material is no longer available, the comparison should focus on the manufacturing process in order to demonstrate that the test material was produced by the same manufacturing process and current production conditions, and that the test material was in compliance with the current material specifications. Information regarding the characteristics of the fraction of small particles in the manufactured material, should include variability between the batches from the same production process, and between batches from different processes when applicable. If the manufacturing process has been modified, information addressing the changes regarding the fraction of small particles, focusing on chemical composition (confirming similarity or presenting the differences with that of the bulk material), particle size distribution, crystallinity, particle shape, purity and any particle surface modifications should be provided.
For materials with considerable variability in one or more of the characteristics, such as particle size distribution, the applicant should provide justification that the tested materials covers ‘worst‐case conditions’. Regarding size this may include that the test materials contains a larger proportion of particles in the nanoscale. When comparing the characteristics of the test material with the specifications of the material currently marketed, applicants may consider the principles for grouping and read‐across of different nanoforms of the same substance in a set of similar nanoforms to support their conclusions.29
The applicant should provide at least the characterisation of the marketed material including particle size distribution (see Section 3) and variability between production processes and batches, and a comparison with the description available for the test material.
When the available information is insufficient for confirming the presence of the fraction of small particles in the tested materials, a case‐by‐case judgement is required in order to decide if a new toxicity study should be provided. Recommendations are presented under Section 4.3.
In addition to the studies conducted with the full material, safety studies conducted with the fraction of small particles, or with a specific set of nanoparticles, are relevant for the risk assessment, provided that the characteristics of the tested particles are as much as possible similar to those of the equivalent fraction present in the marketed material. The possibility for read‐across may be considered when the characteristics of the tested particles deviate, in terms of particle size or other features, from those reported for the particles present in the marketed material.
4.2. Adequacy of existing studies for assessing the hazards of the fraction of small particles: selection, design and dispersion
In general, the safety studies, conducted according to the EFSA guidance documents and OECD test guidelines for assessing the toxicity of conventional materials, are considered to sufficiently cover the hazard assessment of small particles present in conventional materials provided that the study conditions including duration is adequate and some specific precautions are implemented to ensure sufficient dispersion of the nanoparticles, as described in Section 4.2.3. Additional considerations are required for genotoxicity and toxicokinetics.
For repeated dose oral toxicity studies, the duration of exposure should be sufficient to address the potential hazard of small particles. The sectoral guidances for food additives (EFSA ANS Panel, 2012), feed additives (EFSA FEEDAP Panel, 2017), and novel foods (EFSA NDA Panel, 2016) consider a 90‐day animal study (OECD TG 408 (OECD, 2018)) as the first tier for the assessment of toxicity. The Guidance on Nano‐RA considers that OECD TG 408 has sufficient duration for the safety assessment of particles at the nanoscale; the appraisal of the capacity of OECD TG 408 guideline studies for addressing potential hazards related to the fraction of small particles should focus on appropriate exposure, which is achieved by good dispersion as detailed in Section 4.2.3.
The capacity of small particles to produce local effects, such as inflammation, at the site of first contact should be considered. In case of oral exposures, this requires sufficient information on the histopathological assessment of the GIT demonstrating for instance that the epithelia of the different GIT parts and Peyer's patches were examined. The OECD TG 408 describes the tissues to be covered for the histopathological assessment of the GIT; the area covered by the assessment should be large enough, considering that possible local effects of particles are expected to be less homogeneously distributed than those produced by the soluble fraction. If inflammatory responses or other local lesions in the GIT are observed, the possible role of the fraction of material present as small particles should be investigated. This may require additional mechanistic studies to elucidate the mode of action of small particles.
Another situation may occur for lipophilic organic substances. These can be (very) slightly soluble or insoluble in water and display a slow dissolution rate, indicating that these substances can be present as particles in aqueous conditions. However, they can follow the uptake route of lipids and partition to physiological hydrophobic environments. The available information on the physicochemical properties, e.g. solubility and Kow, confirmed by toxicokinetic information, may be sufficient to conclude that, at the expected use levels, the gastrointestinal uptake will be linked to the conventional processes for the absorption of lipids and lipophilic materials by the intestinal epithelia, such as passive transport through the cellular membranes and partitioning to physiological lipophilic environments. In these cases, a conventional risk assessment is sufficient. The applicant should compile the information supporting this appraisal route and provide a reasoned justification.
4.2.1. Genotoxicity testing for materials containing a fraction of small particles
The applicant should submit results of two different in vitro assays on mammalian cells, one covering induction of gene mutation and the other covering structural and numerical chromosome damage, in line with the Guidance on Nano‐RA. In case of equivocal results, the applicant should refer to EFSA guidance on genotoxicity (EFSA Scientific Committee, 2011, 2017).
The bacterial Ames test is not a suitable method for assessing the genotoxicity potential of the fraction of small particles; a mammalian cell mutagenicity test (OECD TG 476 or 490) is an appropriate alternative (see the Guidance on Nano‐RA). It has been shown that small particles are not taken up by the bacterial system of the Ames test and this may lead to a false negative result. However, in case of an already available Ames test, a positive result should not be disregarded, as this may be linked to indirect genotoxic effects due to extracellular induction of reactive oxygen species or to the genotoxic potential of the dissolved fraction or degradation products.
4.2.2. Toxicokinetic and residue studies for materials containing a fraction of small particles
It should be considered that the dissolved and particulate fractions of the conventional material may have different toxicokinetic behaviours. In particular, the potential uptake of particles in the nanoscale by size‐specific pathways in the GIT epithelia and accumulation in tissues should be investigated (e.g. see Section 6.6 in Guidance on Nano‐RA). In addition to the general consideration on a sufficient level of dispersion/degree of agglomeration (see Section 4.2.3), specific assessment is needed regarding the study duration and the sensitivity of the analytical methods used for determining the content of test material in tissues, e.g. ICP‐MS (Aureli et al., 2020), as the pathways for particle uptake require more time and provide lower absorption rates than those for dissolved chemicals. Otherwise, the absorption may have remained undetected. The presence of small particles/nanosized particles may be studied quantitatively by single particle ICP‐MS (Tassinari et al., 2013; Talamini et al., 2019; Peters et al., 2020), whereas ultrastructural localisation in tissues requires visual methods, e.g. EM, enhanced darkfield microscopy (Modrzynska et al., 2018) or enhanced darkfield hyperspectral microscopy (Campbell et al., 2017). The two latter methods can be applied on hematoxylin and eosin‐stained tissue samples, which are used for microscopic diagnosis of changes in toxicity studies. The limit of detection (LOD) and limit of quantification (LOQ), respectively, should always be documented for the applied method.
The applicant should evaluate and provide the available experimental data, e.g. ADME information from administration of different doses or comparison of concentrations in organs, such as liver or spleen, observed after exposure to several doses, to get an insight into whether the absorption of the material is dose‐dependent.
For feed additives, residue studies are pivotal for the assessment of consumer safety (see EFSA FEEDAP Guidance on the assessment of the safety of feed additives for the consumer, 2017). The bioavailability and toxicological properties of the fraction of small particles including particles at the nanoscale can be different from bulk material, and its toxicokinetics may be different from that of the dissolved fraction. When the studies indicate the potential for uptake of the material as small particles, the presence of a small‐particle fraction of residues should be properly characterized in edible tissues (e.g., muscle, fat liver and kidney in mammals) as well as (when relevant) in the edible products milk or eggs which can be crucial for consumer safety assessment. The Guidance on Nano‐RA provides specific recommendations for assessing the risk of feed additives for the target species and for consumers.
For pesticides, specifically designed residue studies would be required that can be used to estimate the dietary exposure to residues in particle form resulting from crops treated with nanopesticides. In the absence of guidance on specifically designed residue studies, consideration of currently applicable guidance needs to be sought. If consumers are expected to be exposed to significant residues in nanoform, considerations on the bioavailability and toxicological properties of the nanoscaled residues are required including derivation of toxicological reference values for consideration in the consumer risk assessment.
4.2.3. Adequacy of the study design of existing studies for covering the hazard assessment of the fraction of small particles
In addition to ensuring that the fraction of small particles was present in the test material, information on the design and performance of any existing toxicity study is required to ensure that the study had addressed the specific characteristics of particles in the nanoscale. These should include information on preparation of the test material, in particular if the need of a proper dispersion of the material was considered and to understand whether or not the test design and the matrix/vehicle for administration used were appropriated for minimising the agglomeration of the particles, and if the administration considers how consumers will be exposed.
The test design should be considered adequate for covering the fraction of small particles, including nanoparticles, in conventional materials when at least one of the following criteria is met:
Dispersion covered by a verified SOP or a systematic approach (e.g. reference to NANOGENOTOX or ENPRA protocols or to verified protocols specific for this material, ISO or OECD guidelines for dispersion of nanomaterials, or equivalent reference; or
sonication applying energy densities from 600 to 2,500 J/mL sample volume plus confirmation of stability for at least 30 min and/or stability ensured until at least administration or application is completed; or
specific confirmation of sufficient level of dispersion and of the stability of the dispersion (options include EM, DLS, zeta potential higher than 25 mV or lower than –25 mV in the dispersion media); or
use of demonstrably effective dispersing agents or surfactants with a proper justification (and inclusion of solvent control); or
in case of administration in the animal diet, information on the level of agglomeration in the stock suspension/powder mixed with the feed and in the animal diet for each dose, or
confirmation of cell/tissue exposure during execution of the test (e.g. ICP‐MS or ultrastructural localisation by EM, enhanced darkfield microscopy, etc.); including evidence that the particles correspond to the material.
As indicated in the Guidance on Nano‐RA for in vivo oral studies, gavage, administration with food or through drinking water may be used and the method selection should be in line with the expected pathway to consumer exposure. The applicant who submits an existing study should therefore justify the method of administration used, describe the preparation of the test material and dispersion of the test material, focusing on the potential for aggregation and agglomeration of the fraction of small particles and provide results of analyses of the achieved concentrations, and particle size distribution in the matrix/vehicle at each dose.
The information on solubility and dissolution rate of the test material, to be provided in line with the requirements in Section 2 of this Guidance, and the information for each study to be reported according to OECD test guidelines, are the starting points for assessing whether or not a sufficient level of dispersion of the material was achieved in the test medium. Appendix B summarises the information to be extracted and reported by the applicant for each existing study based on the current OECD test guidelines. Studies that were conducted under other guidelines or non‐guideline protocols should be assessed on a case‐by‐case basis for analogy with the OECD test guideline requirements prior to being used for submission.
It needs to be kept in view that higher doses may result in a higher degree of particle agglomeration compared to lower doses. On the other hand, for materials that show some degree of solubility, the level of dissolution depends on the concentration of the material dispersed in the testing medium, this concentration may be different for each dose. Consequently, where complete dissolution is not expected from the doses used in an existing study, the assessment of solubility/dissolution rate, dispersion, aggregation and agglomeration, should be conducted separately for each dose.
The following principles should be considered by the applicant for evaluating the suitability of existing in vivo studies:
The lack of turbidity or a precipitate should not be taken as proof of full dissolution because particles in the nanoscale may not be detected as turbidity or as a precipitate visible by eye or with the aid of an inverted microscope.
If solutions/suspensions had been prepared during sample preparation for an existing study, the presence of small particles in the dispersion should be assumed for all concentrations exceeding the measured solubility (see Section 2).
Further dissolution in the GIT of the experimental animals could be considered when using the existing study. A pH value of 3 in the stomach and pH value of 7 for the intestine may be considered for materials which solubility is pH‐dependent (Ward and Coates, 1987). The water content in the GIT has been estimated in the order of 1 mL for the mouse and between 8 (fed) and 3 (fasted) mL for the rat (McConnell et al., 2008).
For multi‐constituent substances and mixtures, the solubility of each constituent/component should be assessed independently when interpreting the adequacy of the existing studies and drawing conclusions from them.
For materials that show some degree of solubility, the solubility and dissolution rate, as well as the time between preparation and administration should be reported and considered in the assessment. When the material was only partially solubilised (i.e. remained in part as particles) but was properly dispersed, the results are relevant for the safety assessment. The use of dispersion agents is generally expected to increase the level of particle dispersion and reduce agglomeration, but may also affect the results, thus an additional control group is always needed.
If the test material is still available and the stability is ensured, the applicant may consider repeating the dose preparation method used in the existing study and check for the presence of particles and the level of dispersion achieved at each dose, using EM or other suitable methods (see Section 3 for details).
An in vitro study is not adequate (and should be repeated) where the level of dispersion, investigation of cellular uptake, and other considerations ensuring a proper coverage of the fraction of small particles, cannot be verified.
Following the considerations of the issues described above, the applicant should provide, for each relevant existing study, a detailed assessment of the capacity of the study for detecting and covering the fraction of small particles with properties in the nanoscale.
4.3. Criteria for requiring new studies and setting the assessment and testing strategy
When the applicant cannot demonstrate that the existing safety studies offer a proper coverage for assessing the hazards and risks of the fraction of small particles, additional considerations during the risk assessment are needed in order to decide if additional tests in line with the Guidance on Nano‐RA are needed, particularly when the decision requires the replication of an existing in vivo study.
The need for new studies may be triggered by different reasons. These include the quality (i.e. reliability, relevance and level of reporting) of the existing study results, as well as concerns about the representativeness of the test material relative to the marketed or intended to be marketed material. In addition, updates of the guideline protocols, e.g. the 2018 update of the OECD TG 408 (OECD, 2018) for addressing concerns on endocrine disruption, should be used in the weight of evidence for deciding if a new study is necessary.
When the existing toxicity studies are considered reliable and sufficient for assessing the safety of the bulk material, but the information on the presence of the fraction of small particles is lacking or only partially available, the applicant should:
-
Summarise the available information, in particular:
1.1 the results of the safety assessment of the conventional material;
1.2 the characteristics of the fraction of small particles (Section 3); and
1.3 the areas of the safety assessment (e.g. genotoxicity, toxicokinetics, repeated oral toxicity, etc.) covered by studies with identified gaps for addressing the fraction of small particles (Section 4);
Identify, in a weight of evidence approach, the areas where safety can be demonstrated for the conventional material but there are still concerns regarding the fraction of small particles in the nanoscale;
-
For those areas of the safety assessment with insufficient coverage of the fraction of small particles:
3.1 develop an Integrated Testing and Assessment Strategy (IATA) (OECD,30 EC,31 Sakuratani et al., 2018) to address the gaps and integrating the assessment of the fraction of small particles in the conventional assessment; or
3.2 conduct a complementary assessment for the fraction of small particles at the nanoscale in line with the Guidance on Nano‐RA.
The assessment under point 2 above requires the integration of a large number of lines of evidence, thus it is not feasible to address all possible combinations of such lines of evidence in this Guidance on Particle‐TR. Some general recommendations and a non‐exhaustive set of examples on the combination of different pieces of evidence are provided below, covering some typical cases.
The first consideration is related to the homogeneity of the material. The characterisation under Section 3, may provide evidence that the marketed material (a substance or a mixture) has a small particle fraction that differs from the rest of the material not only in terms of particle size, but also in particle shape, crystal structure, chemical composition, or a combination of more than one of these features. In these cases, the existing 90‐day oral studies should always be complemented with the required provisions for addressing the fraction of small particles in accordance to this Section 4; and if needed, with new safety studies addressing the effects of small particles according to the Guidance on Nano‐RA.
When size is the only difference between the fraction of small particles and larger particles, the applicant may consider the available information on chemical composition, toxicity and toxicokinetics, as exemplified for some typical cases in Table 3.
Table 3.
Non‐exhaustive set of examples of observations and additional information for combining the different pieces of evidence regarding the coverage of the fraction of small particles by the conventional risk assessment
| Observations from existing toxicity studies | Observations from existing toxicokinetic studies | Additional information | Conclusion from the pieces of evidence |
|---|---|---|---|
| Existing 90‐day oral studies cannot be complemented with the required provisions for addressing the fraction of small particles in the nanoscale in accordance to this Section 4 | The marketed material (a substance or a mixture) has a small particle fraction that differs from the rest of the material in terms of particle shape, crystal structure, chemical composition, or a combination of more than one of these features. | Safety studies addressing the effects of small particles according to the Guidance on Nano‐RA are needed | |
| Local toxicity in the GIT observed | Chemical composition indicates that the soluble/degradation products are of low toxicity | Effects likely associated to small particles, specific assessment needed according to Guidance on Nano‐RA | |
| Systemic toxicity with dose‐response observed in oral studies | Significant absorption at toxic doses | Chemical composition of the fraction of small particles similar to bulk material | Conventional risk assessment offers sufficient coverage for the fraction of small particles |
| Some systemic toxicity observed in oral studies but no clear dose‐response | Low or negligible absorption in standard toxicokinetic studies | Safety studies addressing the effects of small particles according to the Guidance on Nano‐RA are needed | |
| No toxicity observed in oral 90‐day studies | Significant absorption in the GIT | Chemical composition of the fraction of small particles similar to bulk material | Conventional risk assessment offers sufficient coverage for the fraction of small particles |
| No toxicity observed in oral 90‐day studies | Negligible absorption but no information on accumulation of particles in toxicokinetic studies | Chemical composition of the fraction of small particles similar to bulk material | Toxicokinetic studies according to Guidance on Nano‐RA are needed for confirming the negligible absorption and absence of accumulation of the small particles |
| No toxicity observed in oral 90‐day studies | Low toxicity confirmed following repeated dose parenteral (e.g. intravenous) administration | Conventional risk assessment offers sufficient coverage for the fraction of small particles, except for local effects in the GIT |
When no toxicity or unclear indications are observed in the safety studies, the applicant may consider complementary information in a weight of evidence approach to address some concerns.
In some cases, and before conducting a full assessment for the fraction of small particles in line with Guidance on Nano‐RA, the applicant may develop an Integrated Testing and Assessment Strategy (IATA) for addressing the identified gaps and integrating the assessment of the fraction of small particles in the conventional assessment. The opportunity for addressing the gaps through New Approach Methodologies (NAM), including in vitro or other alternative methods, avoiding or minimising the use of experimental animals, should be considered (see Guidance on Nano‐RA). Independent of the specific IATA/NAM method applied, characterization and sample preparation of the test material should substantially be the same as required for in vivo studies. Any deviation has to be documented and justified (see also Appendix B). For some processes and sectoral legislation the applicants may consider support from EFSA in line with the EFSA Catalogue of services (EFSA, 2016) or the new provisions for pre‐submission advice under the Transparency Regulation.
Where the applicant cannot demonstrate that the conventional safety assessment addresses properly the fraction of nanoparticles, an assessment focusing on the fraction of small particles with nanoscale characteristics should be conducted in line with Guidance on Nano‐RA and submitted within the dossier.
When differences in the toxicokinetic and/or toxicodynamic properties are known between the fraction of particles at the nanoscale and the rest of the material, both whole mixture approaches and component‐based approaches can be applied, adapting the general principles for assessing mixture toxicity described in the EFSA Scientific Committee Guidance on harmonised methodologies for human health, animal health and ecological risk assessment of combined exposure to multiple chemicals (EFSA Scientific Committee, 2019). The component‐based approaches can also be used when differences in the toxicokinetic and/or toxicodynamic properties, due to particle size, crystallinity, or other properties, are observed between different fractions of particles at the nanoscale, contained in the marketed material. When the component‐based approach is used, the dose addition method should be the default assumption.
5. Recommendations for conducting new studies on materials consisting of or containing a fraction of small particles
When conducting new studies, applicants and other interested parties, including contract laboratories, should check the presence of a fraction of small particles in the material. A solubility test according to the provisions in Section 2.3.1 should be conducted, considering the special provisions for materials with solubility lower than 33.3 g/L. If the criterion for solubility is not met, a dissolution rate study according to the provisions in Section 2.3.2 should be considered.
The presence of a fraction of small particles in the nanoscale should be considered for all concentrations above the material's own solubility limit. If the material does not meet the decision criteria presented in Sections 2 and 3 of this Guidance on Particle‐TR, the recommendations of the Guidance on Nano‐RA for the genotoxicity testing, the assessment of toxicokinetic characteristics and the design of in vivo studies should be followed with regard to the characterisation, dispersion and assessment of any potential accumulation of the fraction of small particles.
The characterisation of the material as marketed, including the particle size distribution and the variability between batches, and the characterisation of the sample used in the study should be included in the study report (see Section 3 and Appendix A for details on how to report quantitative EM); the adaptations of the study design for ensuring its applicability for assessing materials containing small particles should be presented in the protocol and the study report. The need for EM examination of samples with the aim to demonstrate the presence of small particles in tissues should be considered in the study protocol.
Abbreviations
- ADME
absorption, distribution, metabolism and excretion
- AF4
Asymmetric Flow Field Flow Fractionation
- ANS
EFSA Panel on Food Additives and Nutrient Sources Added to Food
- CEN
European Committee for Standardization
- CEN TC
European Committee for Standardization Technical Committee
- CLS
centrifugal liquid sedimentation
- dEM
descriptive electron microscopy
- DLS
dynamic light scattering
- ECHA
European Chemicals Agency
- EDX
energy‐dispersive X‐ray spectrometry
- EM
electron microscopy
- FCM
food contact material
- FEEDAP
EFSA Panel on Additives and Products or Substances used in Animal Feed
- GIT
gastrointestinal tract
- IATA
integrated approach to testing and assessment
- ICP‐MS
inductively coupled plasma mass spectrometry
- ICP‐OES
inductively coupled plasma optical emission spectroscopy
- ISO
International Organization for Standardization
- JRC
Joint Research Centre
- NAM
new approach methodology
- NDA
EFSA Panel on Nutrition, Novel Foods and Food Allergens
- OECD
Organisation for Economic Co‐operation and Development
- pH minus
(−) logarithm of the concentration of H+ ions.
- PPP
plant protection product
- PTA
particle tracking analysis
- REACH
Registration, Evaluation, Authorisation and Restriction of Chemicals
- SC
Scientific Committee
- SCCS
Scientific Committee on Consumer Safety
- SCENIHR
Scientific Committee on Emerging and Newly Identified Health Risks
- SEM
scanning electron microscopy
- SG
scientific guidance
- SOPs
standard operating procedures
- STEM
scanning transmission electron microscopy
- TEM
transmission electron microscopy
- TSEM
transmission scanning electron microscopy
- TG
(OECD) test guideline
Glossary
In brackets the source used for the description, EFSA: taken from EFSA glossary (https://www.efsa.europa.eu/en/glossary-taxonomy-terms). When no source is provided, the text represents the working description used for this Guidance.
- ADME (EFSA)
An abbreviation for ‘absorption, distribution, metabolism and excretion’, the four key processes which describe how drugs and chemicals get into the body, what happens to them while they are there, and how they are eliminated.
- Agglomerate
Agglomerate refers to a collection of weakly bound particles or aggregates where the resulting external surface area is similar to the sum of the surface areas of the individual components.
- Aggregate
Aggregate means a particle comprised of strongly bound or fused particles.
- Constituent particle
Constituent particles are the (morphologically) identifiable particles, including those inside an aggregate or agglomerate. In agglomerates the constituent particles are only weakly bound. In aggregates the constituent particles are strongly bound. Mobility‐based techniques cannot be used to measure the size of constituent particles in aggregates and agglomerates (from Rauscher et al., 2019a).
- Conventional material
In line with the European Commission mandate, conventional materials are materials not covered by the legal definition for engineered nanomaterials or nanoforms.
- Degradation
Degradation is the process by which a nanoparticle is transformed to degradation products in the form of another nanoparticles (examples include photodegradation, oxidative degradation, etc.) or to solutes with the loss of nano features. A relevant example is the oxidative degradation of silver nanoparticles with the release of Ag+ ions (i.e. dissolved form of silver). The degradation/dissolution rate includes degradation into soluble chemical species in addition to dissolution, while excludes the degradation into other nanoparticles.
- Dissolution
The process by which a nanomaterial in a liquid medium dissolves into its respective ions or molecules, resulting in the loss of its nanospecific features.
- Dispersion
A system in which discrete particles are distributed in a continuous phase (e.g. a liquid) of a different composition. A poorly soluble nanomaterial introduced into a liquid forms a ‘dispersion’, where the liquid and the nanosized particles coexist.
- Engineered
nanomaterial (Novel Food Regulation (EU) No 2015/2283, point (f) of Article 3(2): intentionally produced material that has one or more dimensions of the order of 100 nm or less or that is composed of discrete functional parts, either internally or at the surface, many of which have one or more dimensions of the order of 100 nm or less, including structures, agglomerates or aggregates, which may have a size above the order of 100 nm but retain properties that are characteristic of the nanoscale. Properties that are characteristic of the nanoscale include: (i) those related to the large specific surface area of the materials considered and/or (ii) specific physico‐chemical properties that are different from those of the non‐nanoform of the same material.
- Fraction of small particles
For conventional materials, the term ‘fraction of small particles’ is used in this document to describe the fraction of the materials composed by particles with at least one external dimension equal to or lower than 500 nm. The threshold of 500 nm as the upper limit for the range of ‘small particles’ is based on technical considerations (availability of methods for both screening and accurate measurement of particle size distribution in the 1–500 nm range) and the scientific evidence that uptake from the gastrointestinal tract has been generally found to be possible for sizes up to 250 nm. An uncertainty factor of 2 is applied to account for the limitations of available screening techniques for size measurements resulting in a limit of 500 nm.
- In silico
(EFSA) Research theoretical method, particularly involving computer models, to predict the likely toxicological, or other, effects of substances.
- In vitro
(EFSA) Research method which involves testing cells or tissues extracted from living organisms.
- In vivo
(EFSA) Research method which involves testing individual live animals or populations of live animals.
- Manufactured nanomaterial
(ISO) Nanomaterial intentionally produced for commercial purposes to have specific properties or a specific composition.
- Material
A general term to be used in this Guidance independently from a regulation and be adaptable to different sectors. It is a generic term for what is covered and regulated afterwards by sector‐specific legislation. Hence, ‘material’ can for example be an ingredient, a mixture, a preparation or be intended as test ‘material’.
- Materials consisting of small particles
This term is used in this document to describe materials composed by particles with at least one external dimension equal to or lower than 500 nm. Materials composed by particles with at least one external dimension lower than 500 nm as well as larger particles with all external dimensions above 500 nm are considered in this document as ‘materials containing a fraction of small particles’.
- Mixture
Mixture or solution composed of two or more substances (REACH, Art. 3(2)). It should be noted that the surface treatment of a substance is a ‘two dimensional’ modification of macroscopic particles which implies a chemical reaction between the functional groups only on the surface of a macroscopic particle. A chemically surface treated substance cannot be regarded as a mixture of the core substance with the surface treating substance.
- Multi‐constituent substance (ECHA)
A substance, defined by its quantitative composition, in which more than one main constituent is present in a concentration ≥ 10% (w/w) and < 80% (w/w). A multi‐constituent substance is the result of a manufacturing process (ECHA, 2017d). These thresholds do not apply to the cover surface treatment. The presence of coating (synonym of surface functionalisation treatment) should be considered a characteristic of the substance/nanoform and requires proper characterisation.
- Nanofibre
Refers to nanoparticles characteriaed by significantly different lengths of the longest and shortest axes.
- Nanoform
Form of a natural or manufactured substance containing particles, in an unbound state or as an aggregate or as an agglomerate and where, for 50% or more of the particles in the number size distribution, one or more external dimensions is in the size range 1 nm‐100 nm, including also by derogation fullerenes, graphene flakes and single wall carbon nanotubes with one or more external dimensions below 1 nm (REACH, Annex VI).
- Nanomaterial
Nanomaterial encompasses materials covered by the legal definitions. For the purposes of this guidance the provisions for the risk assessment of nanomaterials are also applicable to the fraction of nanoparticles, present in conventional materials and any other material or fraction exhibiting characteristics of the nanoscale and, consequently, requiring risk assessment with specific considerations for addressing these characteristics.
- Nanoparticle
Covers all particles exhibiting characteristics at the nanoscale. This cover particles with any external dimension on the nanoscale including ‘nanofibres’ (two external dimensions in the nanoscale) and ‘nanoplates’ (one external dimension on the nanoscale).
- Nanoproperty
Examples include (but are not restricted to) size on the nanoscale, large surface area, high surface reactivity, quantum effects, possibility to translocate over biological membranes not observed in larger non‐nanosized particles etc.
- Nanoscale
The size range 1–100 nm (e.g. Lövenstam et al., 2010; SCENIHR, 2010). From a metric interpretation, nanoscale encompasses the range from 1 to 999 nm. The size range below 1 nm is measured in picometres, and the size range above 999 nm is measured in micrometres.
- Nanosized
degradation product Is a degradation product in the form of a nanomaterial, meaning not in ionic or molecular form.
- Nanosize fraction
Fraction of a conventional material requiring risk assessment at the nanoscale.
- Nanostructured material (ISO)
A material having internal or surface nanostructure, this includes a composition of interrelated constituent parts in which one or more of those parts is at the nanoscale.
- Non‐nanomaterial
A material that is either in ionic, molecular or particulate form having a size above the nanoscale.
- Particle
It refers to a minute piece of matter with defined physical boundaries, and of any shape.
- Particulate material
A material consisting of solid particles.
- Pristine material
Original, pure material (before it is processed).
- Solid particle
According to the European Commission's position (JRC113469), the EC definition of a nanomaterial covers only particles that are solid at normal temperature and pressure. As explained in Rauscher et al. (2015) ‘Solid’ is one of the four fundamental states of matter (the others being liquid, gas, and plasma). It is characterised by structural rigidity and resistance to changes of shape or volume. This excludes emulsions (liquid particles in liquid media) and micelles. A rationale for this is the fact that for these materials the external dimensions generally depend more on chemical and physical (mechanical) forces from their surroundings than those of solid particles. For micelles, also the high frequency of molecules leaving and entering the structure makes their structure highly dynamic’.
- Solubility (OECD, ECHA)
The quantity of solute that dissolves in a given quantity of solvent to form a saturated solution (OECD). Solubility is specified by the saturation mass concentration of the substance in water or another solvent at a given temperature (kg/m3 or g/L). Solubility in relevant media requires description of the media and the conditions under which the measurements were made.
- Substance
A chemical element and its compounds in the natural state or obtained by any manufacturing process, including any additive necessary to preserve its stability and any impurity deriving from the process used, but excluding any solvent which may be separated without affecting the stability of the substance or changing its composition (REACH, Art. 3(1)).
- True liquid
A substance in liquid state, or a substance or mixture fully dissolved in a solvent.
- Ultrafiltration
(ANSES, OECD) Ultrafiltration is technique that employs centrifugation of liquid samples through a semi‐permeable ultrafiltration membrane, which separates smaller sized substances from the larger ones, depending on the size cut‐off the membrane. In the context of testing solubility of nanomaterials, the use of ultrafiltration is recommended to first separate out the solubilised fraction of a nanomaterial from any (undissolved) nanoparticles that are retained by the ultrafiltration membrane. Subsequent analysis of the filtered media then reflects the truly solubilised proportion of the nanomaterial.
Appendix A – Particle size distribution of the constituent particles
1.
When the solubility and dissolution rate studies confirm that consumers will be exposed to particles, the applicant will need to document the presence or absence of small particles, or of a fraction of small particles, including nanoparticles, in the material and/or in the final regulated food and feed products, and to characterise this fraction. Particle size distribution of the constituent particles of the material has to be provided, including the meta‐information necessary to evaluate these data. This information may have legal consequences and should therefore be based on robust and precise data and be supported by applying scientifically sound criteria to the outcomes of the analysis.
The methods and measurement techniques applied to measure particle size distributions can be based on considerably different measurement principles, and the level of detail that they provide and their region of applicability may also differ considerably. These aspects are reviewed in Mech et al. (2020a). Likewise, there is an overwhelming diversity of materials that potentially contain a fraction of small‐ or nanosized particles, with a wide spectrum of physicochemical properties. For most materials, methods are available that allow to determine the presence or absence of small particles, including nanoparticles. The suitability of different methods is reviewed in Rauscher et al. (2019a) and Mech et al. (2020a,b) and examples of standard operating procedures are provided in Mech et al. (2020c).
There are a number of issues that should be considered when assessing the appropriateness of the analysis method and the outcome. When selecting and implementing a method suitable to experimentally assess the presence of small particles the following requirements need to be met:
Sufficient physicochemical information on the material needs to be available
Basic physicochemical information on the material to be assessed should be obtained and considered before a measurement of the particle size distribution is performed, including chemical composition, dispersibility, particle shape, expected size range, aggregation and agglomerations status, and other properties that could affect the choice of size measurement techniques. Guidance to describe the physicochemical properties based on descriptive EM analysis is described in Section 3.3.1.6. Guidance on other methods is provided in Mech et al. (2020c).
The selected technique is compatible with the material
The measurement technique(s) to be applied must be compatible with the material. For example, if the measurement or preparation conditions induce changes in the particle size distribution of the material, the method should not be used to assess the particle size. The physicochemical properties of a material should therefore be matched with the capabilities of the techniques and the measurement conditions. Details are provided in Rauscher et al. (2019a) and Mech et al. (2020a,b).
The selected technique should provide confirmatory information allowing conclusive assessment
Although screening methods may provide a more affordable, cost‐efficient indication that the material contains a fraction of small particles, a conclusive assessment cannot be achieved by screening methods only and requires a more elaborate analysis using confirmatory method such as quantitative EM (3.4) (Rauscher et al., 2019a; Mech et al., 2020b).
The applied methods should be validated in line with ISO. Methods for which (international) documentary standards exist, or those that are internationally recognised are preferred. A non‐exhaustive overview of relevant (international) documentary standards is given in Mech et al. (2020b). The applied methods should be validated according to the guidance of ISO 5725‐1:1994 (ISO, 1994) and ISO 5725‐2:2019 (ISO, 2019). The user should ensure the robustness and trueness of the method by applying good measurement practices. This should be provided along with an estimate of the uncertainty of the measurement result. Examples of the validation of particle sizing methods are provided in Linsinger et al. (2013), De Temmerman et al. (2013) and Verleysen et al. (2019).
The number of analysed particles should be sufficiently high to obtain precise results. Approaches to determine a suitable particle number are described in CEN/TS 17273:2018 (CEN, 2018). The outcome of the analysis has to be accompanied by all meta‐data necessary for assessing the reliability of the data. The analysis outcome needs to be supported with the information on how the analysis was performed. Precise and detailed information on meta‐data are pivotal to ensure the proper assessment of the robustness and reliability of the generated data and is necessary to guarantee reproducibility and comparability of the measurement outcomes. For instance, for the purpose of data comparability, the exact details of all steps involved in a dispersion protocol, the equipment and measurement procedure applied should be reported.
The type of raw data produced by the selected method should allow a true and precise estimation of the constituent particle size distribution.
Depending on the measurement principle of a method different types of raw data are produced. When choosing a method, the analyst must be aware of the type of size distribution of raw (primary) data a technique yields, i.e., whether the technique provides a number‐, mass‐ or scattered light intensity‐based distribution or any other type of quantity, and whether the technique counts constituent particles or measures ensembles of particles instead.
If the technique does not provide a number‐based size distribution as raw data, the analyst must be aware of the potential uncertainties and bias that are involved when converting another type of distribution into a number‐based size distribution.
The analysed samples have to be representative for the original material
The outcome of the sample analysis should be applicable to the whole material. Nearly all particle measurement techniques involve a degree of subsampling to perform the analysis. It is therefore essential to ensure appropriate subsampling of the material from the bigger batch so the analysed sample can be considered representative. The sampling method, as well as the sample preparation and the analysis methods need to be selected such that the fraction of small particles is representatively sampled. Specific guidance regarding sampling is provided in ISO 14488:2007 (ISO, 2007c).
The applied sample preparation has to be appropriate for the intended method
Sample preparation is an essential step in the process of making measurements of the particle size distribution which must be efficient, reproducible and deliver a particle size distribution which is as close as possible to the true distribution of the constituent particles. Different materials often require different sample preparation conditions that can have an impact on the observed particle size and particle concentration. Therefore, the effectiveness of the employed sample preparation method for the intended method and stability of the dispersion should be verified.
The useful (size) range of the performed analysis method needs to be suitable for the analysed (sub)sample.
The determined particle size distribution should be a reliable representation of the true distribution of the size of the constituent particles of the material. This means that the measurements should be performed in a size range in which all involved particles can be analysed. Thus, the upper and lower limits in which a given sample should be analysed are determined by the presence of its biggest and the smallest constituent particles. For example, when considering an electron microscopy technique, if the variation of particle size in the analysed sample is very large (i.e. polydispersed materials), then the results of images taken at different magnifications may need to be combined to assure correct determination of the median of the particle size distribution.
Bias related to the selection of a sampling, sample preparation and analysis method should be avoided. Therefore, in certain cases, such as for materials with a high size polydispersity, different sampling, sample preparation and analysis methods are required to characterise (sub)fractions of differently sized particles of a material. Approaches to represent and evaluate the resulting different size distributions are discussed in ISO 9276‐2:2014 (ISO, 2014b), ISO 9276‐3:2008 (ISO, 2008b), ISO 9276‐4:2001 (ISO, 2001b), ISO 9276‐6:2008, ISO 9276‐5:2005 (ISO, 2005). Table A.1 includes a tabulated summary for efficient reporting of the descriptive EM results assuring uniformity in reporting, reducing misunderstandings by suggesting a set of possible descriptions.
Table A.1: Example of a scheme for systematic reporting of descriptive EM analyses (Adapted from Mast et al., 2020)
-
Description of the material, batch and sample
Provide information on the material (chemical composition, batch, molecular formula, molecular weight, CAS No., stability, purity, and physicochemical properties)
Provide information on the selection of the sample and the preparation of the specimen for the EM analysis
-
Confirm that a quantitative EM analysis is feasible and provide evidence on the following aspects:
the EM specimen is representative for the sample, and,
the particles are evenly distributed over the grid, and,
the particles can be distinguished from the background and matrix.
-
Presence of impurities
-
Describe the level of purity
the sample is pure, no impurities are found
occasionally an impurity is observed
nanoparticles are embedded in a matrix
between the impurities the NP are visible
micrographs only contain impurities, no nanoparticles are observed
If impurities are observed, include a description of the impurities
-
-
Describe the findings regarding the level and characteristics of aggregation/agglomeration
-
State
The particles are constituent particles
The particles are agglomerated/aggregated and contain X to Y constituent particles per aggregate/agglomerate
-
Size
-
Estimated size:
approximately X nm
ranging from X nm to Y nm
The minimum aggregate/agglomerate size is …
-
-
Shape: describe shape according to Figure A.1 (A)
Spheroidal
Ellipsoidal
Linear
branched/dendritic
-
-
Describe the characteristics of the constituent particles
-
Type of polydispersity:
Monomodal distribution
Bimodal distribution
Trimodal distribution
Polymodal or broad distribution
-
Estimation of size
approximately XX nm
smaller than XX nm
ranging from XX nm to XX nm
XX ± XX nm for N = XX
The minimum constituent particle size is …
-
Crystal structure
Particles show diffraction contrast suggesting a crystalline structure
Particles show no diffraction contrast suggesting an amorphous structure
Describe 2D shape according to the taxonomic hierarchy of 2D shapes in Figure A.2
Describe 3D shape according to the taxonomic hierarchy of 3D shapes in Figure A.2
Surface topology: describe surface topology according to Figure A.1 (B)
-
Figure A.2.
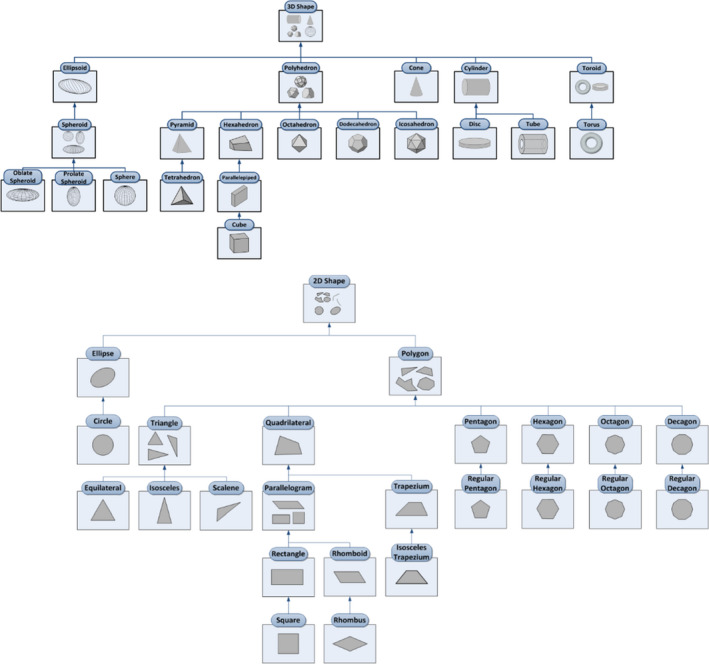
Description of the shape of constituent particles in 2D and 3D according to Muñoz‐Mármol et al. (2015). These figures corresponds to Figures S1 and S2 in the Supplementary data of https://doi.org/10.1016/j.nano.2014.07.006 are protected by copyright and reproduced here with permission from the publisher
Appendix B – Summary of the information to be provided for each safety study according to the requirements presented under Section 4
1.
Suggested citation: EFSA Scientific Committee , More S, Bampidis V, Benford D, Bragard C, Halldorsson T, Hernández‐Jerez A, Bennekou SH, Koutsoumanis K, Lambré C, Machera K, Naegeli H, Nielsen S, Schlatter J, Schrenk D, Silano (deceased) V, Turck D, Younes M, Castenmiller J, Chaudhry Q, Cubadda F, Franz R, Gott D, Mast J, Mortensen A, Oomen AG, Weigel S, Barthelemy E, Rincon A, Tarazona J and Schoonjans R, 2021. Guidance on technical requirements for regulated food and feed product applications to establish the presence of small particles including nanoparticles. EFSA Journal 2021;19(8):6769, 48 pp. 10.2903/j.efsa.2021.6769
Requestor: European Commission
Question number: EFSA‐Q‐2019‐00692
Panel members: Simon More, Vasileios Bampidis, Diane Benford, Claude Bragard, Thorhallur Halldorsson, Antonio Hernández‐Jerez, Susanne Hougaard Bennekou, Kostas Koutsoumanis, Claude Lambré, Kyriaki Machera, Hanspeter Naegeli, Søren Nielsen, Josef Schlatter, Dieter Schrenk, Vittorio Silano (deceased), Dominique Turck and Maged Younes.
Waiver: R. Franz declared that Fraunhofer institute at which he was employed provides advisory services to private business operators active in the sector on food contact materials. In line with EFSA's Policy on Independence (https://www.efsa.europa.eu/sites/default/files/corporate_publications/files/policy_independence.pdf) and the Decision of the Executive Director on Competing Interest Management (https://www.efsa.europa.eu/sites/default/files/corporate_publications/files/competing_interest_management_17.pdf), a waiver was granted to R. Franz regarding his participation to the EFSA's Working Group on Nanoscience and Nanotechnologies in Food and Feed in accordance with Article 21 of the Decision of the Executive Director on Competing Interest Management. Pursuant to Article 21(6) of the above‐mentioned Decision, the involvement of R. Franz is authorised as member in the cross‐cutting Working Group (ccWG) on Nanotechnologies, allowing him to take part in the discussions and in the drafting phase of the scientific output, but he is not allowed to be, or act as, a chairman, a vice‐chairman or rapporteur of the working group.
Declarations of interest: The declarations of interest of all scientific experts active in EFSA's work are available at https://ess.efsa.europa.eu/doi/doiweb/doisearch.
Acknowledgements: The Scientific Committee and the cross‐cutting Working Group on Nanotechnologies wish to thank the EFSA staff members: Hermine Reich, Renata Leuschner, Maria Vittoria Vettori, Irene Cattaneo, and Maria Chiara Astuto for the support provided to this scientific output. The Scientific Committee and the cross‐cutting Working Group on Nanotechnologies wish to acknowledge JRC, ECHA and the Member States delegates of the EFSA Scientific Network of risk assessment of nanotechnologies in food and feed that provided feedback for this scientific output.
This publication is linked to the following EFSA Journal article: http://onlinelibrary.wiley.com/doi/10.2903/j.efsa.2021.6768/full
This publication is linked to the following EFSA Supporting Publications article: http://onlinelibrary.wiley.com/doi/10.2903/sp.efsa.2021.EN-6804/full
Notes
OJ L 327, 11.12.2015, p. 1.
OJ L 404, 30.12.2006, p. 26.
OJ L 183, 12.7.2002, p. 51.
OJ L 181, 29.6.2013, p. 35.
OJ L 31, 1.2.2002, p. 1.
Corresponding to the definition of ‘sparingly soluble’ or ‘slightly soluble’ or ‘very slightly soluble’, or ‘insoluble’, as given by JECFA and US and European Pharmacopoeias.
The degradation/dissolution rate refers to the kinetics of dissolution and degradation. Particulate materials composed of small particles may degrade/dissolve faster than their bulk counterparts because of their high surface‐to‐volume ratio. The dissolution rate is influenced by various factors, including solvent, temperature, pH, concentration and presence of substances interacting with the particle's surface. It can be determined by kinetic measurements such as time‐dependent concentration changes (of either the nanoparticles or the dissolved species) or changes in the particle size distribution (to smaller sizes).
This applies to particles having the capacity to cross the mucus layer and be taken up by intestinal cells.
Details regarding the selection of this threshold are provided in the Guidance on Nano‐RA.
A 85 mmol/L NaHCO3 and 40 mmol/L NaCl solution has a pH of ca. 8.1, which can be adjusted to pH 7 with few drops of concentrated HCl.
If probe sonication is used, care has to be taken to avoid bias from the degradation of the probe if it may lead to release of particles with a similar chemical nature of the ones to be tested. Cross‐contamination of samples via the probe has to be prevented as well.
Estimated according to: Mech et al., 2020c – Part 3.
The first sampling (t = 0) has to take place immediately, i.e. as soon as the dispersion procedure has ended.
The analytical method has to be selected on a case‐by‐case basis and has to be fit‐for‐purpose.
Only ultra‐small particles, smaller than the pore size, may pass through the membrane (OECD 2020): such potential presence does not affect significantly the test results.
For inorganic elements, microwave assisted digestion may be omitted at this stage.
The particulate fraction is measured by comparison, at each time point, of the concentration in the filtrate versus the concentration before ultrafiltration.
i.e. Before ultrafiltration.
The duration of intestinal digestion is ca. 2 h and 2 h is the recommended time in standardised static in vitro digestion methods (Brodkorb et al., 2019).
Upper bound of the physiological pH in the stomach. As a general rule, 1 mol/L HCl is added to adjust the pH to 3. Deviations have to be justified. The pH may have to be re‐adjusted during the procedure, depending on the test item.
If solubility is pH dependent and the criterion is not achieved at pH = 7, it would be sufficient to demonstrate that the criterion is met at pH = 3.
Using a membrane filter with pore size in the range 3–10 kDa.
E.g. a lipophilic compound in oil.
Plastic materials and articles shall not transfer their constituents to food simulants in quantities exceeding 10 milligrams of total constituents released per dm² of food contact surface or 60 mg/6 dm². This corresponds for a packaging surface of 6 dm² in contact with 1 kg food to a migration of 60 mg/L food simulant.
For the so‐called swelleable or gelleable materials, the concentration(s) used for measuring the particle size distribution should be in a range low enough that could ensure that gel formation is avoided.
NANoREG D2.08 SOP 03, available via the NANoREG Results Repository.
This means that used software version has a direct impact on the results. Therefore, software updates to meet the current technical capabilities are essential. Documentation of the software version used has to be provided.
NANoREG D2.10 SOP 01, available via the NANoREG Results Repository.
ECHA (2017a,b,c, 2019) and several research projects, including GRACIOUS EU H2020 (Stone et al., 2020), have proposed frameworks for the read‐across of nanoforms and nanomaterials that could be adapted and used for comparing the characteristics of the fraction of small particles in marketed and tested materials.
References
- Aureli F, Ciprotti M, D'Amato M, do Nascimento da Silva E, Nisi S, Passeri D, Sorbo A, Raggi A, Rossi M and Cubadda F, 2020. Determination of total silicon and SiO2 particles using an ICP‐MS based analytical platform for toxicokinetic studies of synthetic amorphous silica. Nanomaterials, 10, 888. 10.3390/nano10050888 [DOI] [PMC free article] [PubMed] [Google Scholar]
- Braun A, Couteau O, Franks K, Kestens V, Roebben G, Lamberty A and Linsinger TPJ, 2011. Validation of dynamic light scattering and centrifugal liquid sedimentation methods for nanoparticle characterisation. Advanced Powder Technology, 22, 766–770. 10.1016/j.apt.2010.11.001 [DOI] [Google Scholar]
- Brodkorb A, Egger L, Alminger M, Alvito P, Assunção R, Ballance S, Bohn T, Bourlieu‐Lacanal C, Boutrou R, Carrière F, Clemente A, Corredig M, Dupont D, Dufour C, Edwards C, Golding M, Karakaya S, Kirkhus B, Le Feunteun S, Lesmes U, Macierzanka A, Mackie AR, Martins C, Marze S, McClements DJ, Ménard O, Minekus M, Portmann R, Santos CN, Souchon I, Singh RP, Vegarud GE, Wickham MSJ, Weitschies W and Recio I, 2019. INFOGEST static in vitro simulation of gastrointestinal food digestion. Nature Protocols, 14, 991–1014. 10.1038/s41596-018-0119-1 [DOI] [PubMed] [Google Scholar]
- Campbell JL, SoRelle ED, Ilovich O, Liba O, James ML, Qiu Z, Perez V, Chan CT, de la Zerda A and Zavaleta C, 2017. Multimodal assessment of SERS nanoparticle biodistribution post ingestion reveals new potential for clinical translation of Raman imaging. Biomaterials, 135, 42–52. 10.1016/j.biomaterials.2017.04.045 [DOI] [PMC free article] [PubMed] [Google Scholar]
- CEN (European Committee for Standardization), 2018. CEN/TS 17273:2018, Nanotechnologies ‐ Guidance on detection and identification of nano‐objects in complex matrices.
- Chaudhry Q, Scotter M, Blackburn J, Ross B, Boxall A, Castle L, Aitken R and Watkins R, 2008. Applications and implications of nanotechnologies for the food sector. Food Additives & Contaminants: Part A, 25, 241–258. 10.1080/02652030701744538 [DOI] [PubMed] [Google Scholar]
- Chaudhry Q, Bouwmeester H and Hertel RF (Hodge GA, Bowman DM and Maynard AD), 2010. The current risk assessment paradigm in relation to the regulation of nanotechnologies. International Handbook on Regulating Nanotechnologies. Cheltenham: Edward Elgar, 124–143.
- Council of Europe , 2019. European Pharmacopoeia, 10th Edition. Strasbourg, Council of Europe. [Google Scholar]
- De Temmerman P‐J, Van Doren E, Verleysen E, Van der Stede Y, Francisco MAD and Mast J, 2012. Quantitative characterization of agglomerates and aggregates of pyrogenic and precipitated amorphous silica nanomaterials by transmission electron microscopy. Journal of Nanobiotechnology, 10, 24. [DOI] [PMC free article] [PubMed] [Google Scholar]
- De Temmerman P‐J, Lammertyn J, De Ketelaere B, Kestens V, Roebben G, Verleysen E and Mast J, 2013. Measurement uncertainties of size, shape, and surface measurements using transmission electron microscopy of near‐monodisperse, near‐spherical nanoparticles. Journal of Nanoparticle Research, 16, 2177. 10.1007/s11051-013-2177-1 [DOI] [Google Scholar]
- De Temmerman P‐J, Verleysen E, Lammertyn J and Mast J, 2014a. Semi‐automatic size measurement of primary particles in aggregated nanomaterials by transmission electron microscopy. Powder Technology, 261, 191–200. 10.1016/j.powtec.2014.04.040 [DOI] [Google Scholar]
- De Temmerman P‐J, Verleysen E, Lammertyn J and Mast J, 2014b. Size measurement uncertainties of near‐monodisperse, near‐spherical nanoparticles using transmission electron microscopy and particle‐tracking analysis. Journal of Nanoparticle Research, 16, 2628. [Google Scholar]
- Dudkiewicz A, Boxall ABA, Chaudhry Q, Mølhave K, Tiede K, Hofmann P and Linsinger TPJ, 2015. Uncertainties of size measurements in electron microscopy characterization of nanomaterials in foods. Food Chemistry, 176, 472–479. 10.1016/j.foodchem.2014.12.071 [DOI] [PubMed] [Google Scholar]
- Dudkiewicz A, Lehner A, Chaudhry Q, Molhave K, Allmaier G, Tiede K, Boxall ABA, Hofmann P and Lewis J, 2019. Development of a sample preparation approach to measure the size of nanoparticle aggregates by electron microscopy. Particuology, 45, 49–57. 10.1016/j.partic.2018.05.007 [DOI] [Google Scholar]
- Dukhin AS and Xu R, 2020. Chapter 3.2.5 ‐ Zeta‐potential measurements. In: Hodoroaba V‐D, Unger WES and Shard AG (eds.). Characterization of Nanoparticles. Elsevier. pp. 213–224. [Google Scholar]
- ECHA (European Chemicals Agency), 2017a. Guidance on information requirements and chemical safety assessment: Appendix R7‐1 for nanomaterials applicable to chapter R7a endpoint specific guidance. Version 2.0. Helsinki, Finland.
- ECHA (European Chemicals Agency), 2017b. Guidance on information requirements and chemical safety assessment: Appendix R7‐1 for nanomaterials applicable to chapter R7b endpoint specific guidance. Version 2.0. Helsinki, Finland.
- ECHA (European Chemicals Agency), 2017c. Guidance on information requirements and chemical safety assessment: Appendix R7‐2 for nanomaterials applicable to chapter R7c endpoint specific guidance. Version 2.0. Helsinki, Finland.
- ECHA (European Chemicals Agency), 2017d. Guidance for identification and naming of substances under REACH and CLP. Version 2.1. Helsinki, Finland.
- ECHA (European Chemicals Agency), 2019. Appendix for nanoforms applicable to the Guidance on Registration and Substance Identification. Version 1.0. Helsinki, Finland.
- EFSA (European and Food Safety Authority), 2016. EFSA's Catalogue of support initiatives during the life‐cycle of applications for regulated products. EFSA Supporting Publication 2015;13(4):EN‐1025, 300 pp. 10.2903/sp.efsa.2016.EN-1025 [DOI] [Google Scholar]
- EFSA ANS Panel (EFSA Panel on Food Additives and Nutrient Sources added to Food), 2012. Guidance for submission for food additive evaluations. EFSA Journal 2012;10(7):2760, 60 pp. 10.2903/j.efsa.2012.2760 [DOI] [Google Scholar]
- EFSA CEP Panel (EFSA Panel on Food Contact Materials, Enzymes, Flavourings and Processing Aids), 2008. Note for Guidance For the Preparation of an Application for the Safety Assessment of a Substance to be used in Plastic Food Contact Materials. EFSA Journal 2008;6(7):21r, 41 pp. 10.2903/j.efsa.2008.21r (see also updates on this Note for Guidance). [DOI] [Google Scholar]
- EFSA FEEDAP Panel (EFSA Panel on Products or Substances used in Animal Feed), 2017. Guidance on the assessment of the safety of feed additives for the consumer. EFSA Journal 2017;15(10):5022, 17 pp. 10.2903/j.efsa.2017.5022 [DOI] [PMC free article] [PubMed] [Google Scholar]
- EFSA NDA Panel (EFSA Panel on Dietetic Products, Nutrition and Allergies), 2016. Guidance on the preparation and presentation of an application for authorisation of a novel food in the context of Regulation (EU) 2015/2283. EFSA Journal 2016;14(11):4594, 24 pp. 10.2903/j.efsa.2016.4594 [DOI] [Google Scholar]
- EFSA Scientific Committee , 2011. Scientific Opinion on genotoxicity testing strategies applicable to food and feed safety assessment. EFSA Journal 2011;9(9):2379, 69 pp. 10.2903/j.efsa.2011.2379 [DOI] [Google Scholar]
- EFSA Scientific Committee , 2017. Scientific Opinion on the clarification of some aspects related to genotoxicity assessment. EFSA Journal 2017;15(12):5113, 25 pp. 10.2903/j.efsa.2017.5113 [DOI] [PMC free article] [PubMed] [Google Scholar]
- EFSA Scientific Committee , 2019. Guidance on harmonised methodologies for human health, animal health and ecological risk assessment of combined exposure to multiple chemicals. EFSA Journal 2019;17(3):5634, 77 pp. 10.2903/j.efsa.2019.5634 [DOI] [PMC free article] [PubMed] [Google Scholar]
- EFSA Scientific Committee , More S, Bampidis V, Benford D, Bragard C, Halldorsson T, Hernandez‐Jerez A, Bennekou SH, Koutsoumanis K, Lambre C, Machera K, Naegeli H, Nielsen S, Schlatter J, Schrenk D, Silano (deceased) V, Turck D, Younes M, Castenmiller J, Chaudhry Q, Cubadda F, Franz R, Gott D, Mast J, Mortensen A, Oomen AG, Weigel S, Barthelemy E, Rincon A, Tarazona J and Schoonjans R, 2021. Guidance on risk assessment of nanomaterials to be applied in the food and feed chain, human and animal health. EFSA Journal 2021;19(7):6768, 112 pp. 10.2903/j.efsa.2021.6768 [DOI] [PMC free article] [PubMed] [Google Scholar]
- EUNCL (European Nanomedicine Characterization Laboratory), 2018. Particle Tracking Analysis. Available online: http://www.euncl.eu/about-us/assay-cascade/PDFs/PCC/EUNCL_PCC_023.pdf
- Gottardo S, Crutzen H and Jantunen AP, 2017. NANoREG Framework for the safety assessment of nanomaterials. Publications Office of the European Union. EUR 28550 EN. 10.2760/245972 [DOI]
- Hole P, Sillence K, Hannell C, Maguire CM, Roesslein M, Suarez G, Capracotta S, Magdolenova Z, Horev‐Azaria L, Dybowska A, Cooke L, Haase A, Contal S, Manø S, Vennemann A, Sauvain J‐J, Staunton KC, Anguissola S, Luch A, Dusinska M, Korenstein R, Gutleb AC, Wiemann M, Prina‐Mello A, Riediker M and Wick P, 2013. Interlaboratory comparison of size measurements on nanoparticles using nanoparticle tracking analysis (NTA). Journal of Nanoparticle Research: An Interdisciplinary Forum for Nanoscale Science and Technology, 15, 2101. 10.1007/s11051-013-2101-8 [DOI] [PMC free article] [PubMed] [Google Scholar]
- Hougaard KS, Jackson P, Kyjovska ZO, Birkedal RK, De Temmerman P‐J, Brunelli A, Verleysen E, Madsen AM, Saber AT, Pojana G, Mast J, Marcomini A, Jensen KA, Wallin H, Szarek J, Mortensen A and Vogel U, 2013. Effects of lung exposure to carbon nanotubes on female fertility and pregnancy. A study in mice. Reproductive Toxicology, 41, 86–97. 10.1016/j.reprotox.2013.05.006 [DOI] [PubMed] [Google Scholar]
- ISO (International Organization for Standardization), 1994. ISO 5725‐1:1994, Accuracy (trueness and precision) of measurement methods and results — Part 1: General principles and definitions.
- ISO (International Organization for Standardization), 2001a. ISO 13318‐1:2001, Determination of particle size distribution by centrifugal liquid sedimentation methods ‐ Part 1: General principles and guidelines.
- ISO (International Organization for Standardization), 2001b. ISO 9276‐4:2001, Representation of results of particle size analysis — Part 4: Characterization of a classification process.
- ISO (International Organization for Standardization), 2005.ISO 9276‐5:2005, Representation of results of particle size analysis — Part 5: Methods of calculation relating to particle size analyses using logarithmic normal probability distribution.
- ISO (International Organization for Standardization), 2007a. ISO 13318‐2:2007, Determination of particle size distribution by centrifugal liquid sedimentation methods ‐ Part 2: Photocentrifuge method.
- ISO (International Organization for Standardization), 2007b. ISO 13318‐3:2004, Determination of particle size distribution by centrifugal liquid sedimentation methods ‐ Part 3: Centrifugal X‐ray method.
- ISO (International Organization for Standardization), 2007c. ISO 14488:2007, Particulate materials — Sampling and sample splitting for the determination of particulate properties.
- ISO (International Organization for Standardization), 2008a. ISO 9276‐6:2008, Representation of results of particle size analysis — Part 6: Descriptive and quantitative representation of particle shape and morphology.
- ISO (International Organization for Standardization), 2008b. ISO 9276‐3:2008, Representation of results of particle size analysis — Part 3: Adjustment of an experimental curve to a reference model.
- ISO (International Organization for Standardization), 2013. ISO/TR 13097:2013, Guideline for the characterization of dispersion stability.
- ISO (International Organization for Standardization), 2014a. ISO 13322‐1:2014, Particle size analysis — Image analysis methods — Part 1: Static image analysis methods.
- ISO (International Organization for Standardization), 2014b. ISO 9276‐2:2014, Representation of results of particle size analysis — Part 2: Calculation of average particle sizes/diameters and moments from particle size distributions.
- ISO (International Organization for Standardization), 2016. ISO 19430:2016, Particle size analysis — Particle tracking analysis (PTA) method.
- ISO (International Organization for Standardization), 2017. ISO 29301:2017, Microbeam analysis — Analytical electron microscopy — Methods for calibrating image magnification by using reference materials with periodic structures.
- ISO (International Organization for Standardization), 2019. ISO 5725‐2:2019, Accuracy (trueness and precision) of measurement methods and results — Part 2: Basic method for the determination of repeatability and reproducibility of a standard measurement method.
- ISO (International Organization for Standardization), 2020a. ISO/DIS 19749, Nanotechnologies — Measurements of particle size and shape distributions by scanning electron microscopy.
- ISO (International Organization for Standardization), 2020b. ISO 21363:2020, Nanotechnologies — Measurements of particle size and shape distributions by transmission electron microscopy.
- JECFA (Joint FAO/WHO Expert Committee on Food Additives), 2006. Combined Compendium of Food Additive Specifications. Volume 4: Analytical methods, test procedures and laboratory solutions used by and referenced in food additive specifications. Rome, Food and Agriculture Organization of the United Nations. ISBN 92‐5-105569‐6.
- Kestens V, Bozatzidis V, De Temmerman P‐J, Ramaye Y and Roebben G, 2017. Validation of a particle tracking analysis method for the size determination of nano‐ and microparticles. Journal of Nanoparticle Research, 19, 271. 10.1007/s11051-017-3966-8 [DOI] [PMC free article] [PubMed] [Google Scholar]
- Krumbein WC and Sloss LL, 1963. Stratigraphy and sedimentation.
- Linsinger TPJ, Chaudhry Q, Dehalu V, Delahaut P, Dudkiewicz A, Grombe R, von der Kammer F, Larsen EH, Legros S, Loeschner K, Peters R, Ramsch R, Roebben G, Tiede K and Weigel S, 2013. Validation of methods for the detection and quantification of engineered nanoparticles in food. Food Chemistry, 138, 1959–1966. 10.1016/j.foodchem.2012.11.074 [DOI] [PubMed] [Google Scholar]
- López-de‐Uralde J, Ruiz I, Santos I, Zubillaga A, Bringas PG, Okariz A and Guraya T, 2010. Automatic morphological categorisation of carbon black nano‐aggregates. Proceedings of the International Conference on Database and Expert Systems Applications, 185–193 pp.
- Lövenstam G, Rauscher H, Roebben G, Sokull Klütten B, Gibson N, Putaud JP and Stamm H, 2010. Considerations on a definition of nanomaterial for regulatory purposes. JRC (Joint Research Centre) Reference Report, EUR 24403 EN. 10.2788/98686 [DOI]
- Maguire CM, Sillence K, Roesslein M, Hannell C, Suarez G, Sauvain J‐J, Capracotta S, Contal S, Cambier S, El Yamani N, Dusinska M, Dybowska A, Vennemann A, Cooke L, Haase A, Luch A, Wiemann M, Gutleb A, Korenstein R, Riediker M, Wick P, Hole P and Prina‐Mello A, 2017. Benchmark of nanoparticle tracking analysis on measuring nanoparticle sizing and concentration. Journal of Micro and Nano‐Manufacturing, 5. 10.1115/1.4037124 [DOI] [Google Scholar]
- Mast J, Verleysen E and De Temmerman P‐J, 2015. Physical characterization of nanomaterials in dispersion by transmission electron microscopy in a regulatory framework. Advanced Transmission Electron Microscopy: Applications to Nanomaterials, 249–270. 10.1007/978-3-319-15177-9_8 [DOI] [Google Scholar]
- Mast J, Verleysen E, Hodoroaba V‐D and Kaegi R, 2020. Characterization of nanomaterials by transmission electron microscopy: measurement procedures. In: Hodoroaba V‐D, Unger WES and Shard AG (eds.). Characterization of Nanoparticles, Elsevier. pp. 29–48. [Google Scholar]
- Masuda H and Gotoh K, 1999. Study on the sample size required for the estimation of mean particle diameter. Advanced Powder Technology, 10, 159–173. 10.1016/s0921-8831(08)60447-1 [DOI] [Google Scholar]
- McConnell EL, Basit AW and Murdan S, 2008. Measurements of rat and mouse gastrointestinal pH, fluid and lymphoid tissue, and implications for in‐vivo experiments. Journal of Pharmacy and Pharmacology, 60, 63–70. 10.1211/jpp.60.1.0008 [DOI] [PubMed] [Google Scholar]
- Mech A, Rauscher H, Babick F, Hodoroaba VD, Ghanem A, Wohlleben W, Marvin H, Weigel S, Brüngel R and Friedrich CM, 2020a. The NanoDefine Methods Manual. Part 1: The NanoDefiner Framework and Tools, EUR 29876 EN, Publications Office of the European Union, Luxembourg, 2020, ISBN 978‐92-76‐11950‐0. 10.2760/55181, JRC117501 [DOI]
- Mech A, Rauscher H, Rasmussen K, Babick F, Hodoroaba VD, Ghanem A, Wohlleben W, Marvin H, Brüngel R and Friedrich CM, 2020b. The NanoDefine Methods Manual. Part 2: Evaluation of methods, EUR 29876 EN, Publications Office of the European Union, Luxembourg, 2020, ISBN 978‐92-76‐11953‐1. 10.2760/071877, JRC117501. [DOI]
- Mech A, Rauscher H, Rasmussen K, Gilliland D, Babick F, Hodoroaba VD, Ghanem A, Wohlleben W, Marvin H, Löschner K, Brüngel R and Friedrich CM, 2020c. The NanoDefine Methods Manual. Part 3: Standard Operating Procedures (SOPs), EUR 29876 EN, Publications Office of the European Union, Luxembourg, 2020, ISBN 978‐92-76‐11955‐5. 10.2760/02910, JRC117501. [DOI]
- Merkus HG, 2009. Particle size measurements: fundamentals, practice, quality, Springer Science & Business Media. [Google Scholar]
- Modrzynska J, Berthing T, Ravn‐Haren G, Kling K, Mortensen A, Rasmussen RR, Larsen EH, Saber AT, Vogel U and Loeschner K, 2018. In vivo‐induced size transformation of cerium oxide nanoparticles in both lung and liver does not affect long‐term hepatic accumulation following pulmonary exposure. PLoS ONE, 13, e0202477. 10.1371/journal.pone.0202477 [DOI] [PMC free article] [PubMed] [Google Scholar]
- Muñoz‐Mármol M, Crespo J, Fritts MJ and Maojo V, 2015. Towards the taxonomic categorization and recognition of nanoparticle shapes. Nanomedicine: Nanotechnology, Biology and Medicine, 11, 457–465. [DOI] [PubMed] [Google Scholar]
- OECD (Organisation for Economic Co‐operation and Development), 1995. Test No. 105: Water Solubility, OECD Guidelines for the Testing of Chemicals, Section 1, OECD Publishing, Paris. 10.1787/9789264069589-en [DOI]
- OECD (Organisation for Economic Co‐operation and Development), 2009. Working Party on Manufactured Nanomaterials. Preliminary Review of OECD Test Guidelines for their Applicability to Manufactured Nanomaterials, ENV/CHEM/NANO (2009)6/REV1.
- OECD (Organisation for Economic Co‐operation and Development), 2012. Series on the Safety of Manufactured Nanomaterials No 36: Guidance on sample preparation and dosimetry for the safety testing of manufactured nanomaterials. ENV/JM/MONO(2012)40.
- OECD (Organisation for Economic Co‐operation and Development), 2017. Test No. 318: Dispersion stability of nanomaterials in simulated environmental media, OECD Guidelines for the Testing of Chemicals. OECD Publishing, Paris, France, 32 pp.
- OECD (Organisation for Economic Co‐operation and Development), 2018. Test No. 408: Repeated Dose 90‐Day Oral Toxicity Study in Rodents, OECD Guidelines for the Testing of Chemicals, Section 4, OECD Publishing, Paris. 10.1787/9789264070707-en [DOI]
- OECD (Organisation for Economic Co‐operation and Development), 2020. Series on Testing and Assessment No. 318. Guidance document for the testing of dissolution and dispersion stability of nanomaterials and the use of the data for further environmental testing and assessment strategies, ENV/JM/MONO(2020)9.
- Peters R, Kramer E, Oomen AG, Rivera ZE, Oegema G, Tromp PC, Fokkink R, Rietveld A, Marvin HJ, Weigel S, Peijnenburg AA and Bouwmeester H, 2012. Presence of nano‐sized silica during in vitro digestion of foods containing silica as a food additive. ACS Nano, 6, 2441–2451. 10.1021/nn204728k [DOI] [PubMed] [Google Scholar]
- Peters RJB, Oomen AG, van Bemmel G, van Vliet L, Undas AK, Munniks S, Bleys RLAW, Tromp PC, Brand W and van der Lee M, 2020. Silicon dioxide and titanium dioxide particles found in human tissues. Nanotoxicology, 14, 420–432. 10.1080/17435390.2020.1718232 [DOI] [PubMed] [Google Scholar]
- Rauscher H, Roebben G, Boix Sanfeliu A, Emons H, Gibson P, Koeber R, Linsinger T, Rasmussen K, Riego Sintes J, Sokull Kluettgen B and Stamm H, 2015. Towards a review of the EC Recommendation for a definition of the term ‘nanomaterial’ ‐ Part 3: Scientific‐technical evaluation of options to clarify the definition and to facilitate its implementation. Rauscher H and Roebben G (eds.). Luxembourg: Publications Office of the European Union. 10.2788/678452 [DOI] [Google Scholar]
- Rauscher H, Mech A, Gibson N, Gilliland D, Held A, Kestens V, Koeber R, Linsinger T and Stefaniak E, 2019a. Identification of nanomaterials through measurements, EUR 29942 EN, Publications Office of the European Union, Luxembourg, 2019, ISBN 978‐92-76‐10371‐4. 10.2760/053982, JRC118158. [DOI]
- Rauscher H, Roebben G, Mech A, Gibson N, Kestens V, Linsinger T and Riego Sintes J, 2019b. An overview of concepts and terms used in the European Commission's definition of nanomaterial, EUR 29647 EN, European Commission, JRC, Ispra, ISBN 978‐92-79‐99660‐3. 10.2760/459136, JRC113469. [DOI]
- Sakuratani Y, Horie M and Leinala E, 2018. Integrated approaches to testing and assessment: OECD activities on the development and use of adverse outcome pathways and case studies. Basic & Clinical Pharmacology & Toxicology, 123, 20–28. 10.1111/bcpt.12955 [DOI] [PubMed] [Google Scholar]
- SCCS (Scientific Committee on Consumer Safety), 2019. Guidance on the Safety Assessment of Nanomaterials in Cosmetics, SCCS/1611/19.
- SCENIHR (Scientific Committee on Emerging and Newly Identified Health Risks), 2009. Risk assessment of products of nanotechnologies.
- SCENIHR (Scientific Committee on Emerging and Newly Identified Health Risks), 2010. Scientific basis for the definition of the term ‘nanomaterial’. 46 pp. Available online: http://ec.europa.eu/health/scientific_committees/emerging/docs/scenihr_o_032.pdf
- Stone V, Gottardo S, Bleeker EAJ, Braakhuis H, Dekkers S, Fernandes T, Haase A, Hunt N, Hristozov D, Jantunen P, Jeliazkova N, Johnston H, Lamon L, Murphy F, Rasmussen K, Rauscher H, Jiménez AS, Svendsen C, Spurgeon D, Vázquez‐Campos S, Wohlleben W and Oomen AG, 2020. A framework for grouping and read‐across of nanomaterials‐ supporting innovation and risk assessment. Nano Today, 35, 100941. 10.1016/j.nantod.2020.100941 [DOI] [Google Scholar]
- Talamini L, Gimondi S, Violatto MB, Fiordaliso F, Pedica F, Tran NL, Sitia G, Aureli F, Raggi A, Nelissen I, Cubadda F, Bigini P and Diomede L, 2019. Repeated administration of the food additive E171 to mice results in accumulation in intestine and liver and promotes an inflammatory status. Nanotoxicology, 13, 1087–1101. 10.1080/17435390.2019.1640910 [DOI] [PubMed] [Google Scholar]
- Tassinari R, Cubadda F, Moracci G, Aureli F, D'Amato M, Valeri M, De Berardis B, Raggi A, Mantovani A, Passeri D, Rossi M and Maranghi F, 2013. Oral, short‐term exposure to titanium dioxide nanoparticles in Sprague‐Dawley rat: focus on reproductive and endocrine systems and spleen. Nanotoxicology, 8, 654–662. 10.3109/17435390.2013.822114 [DOI] [PubMed] [Google Scholar]
- Taurozzi JS, Hackley VA and Wiesner MR, 2012a. NIST Special Publication 1200‐2: preparation of nanoparticle dispersions from powdered material using ultrasonic disruption. Version, 1, 1. 10.6028/nist.sp.1200-2 [DOI]
- Taurozzi JS, Hackley VA and Wiesner MR, 2012b. NIST Special Publication 1200‐3: preparation of a nanoscale TiO2 aqueous dispersion for toxicological or environmental testing. Version, 1, 2. 10.6028/nist.sp. 1200‐3 [DOI]
- United States Pharmacopeial Convention , 2016. United States Pharmacopeia and National Formulary (USP 38‐NF 33). United States Pharmacopeial Convention, Rockville, MD.
- Verleysen E, De Temmerman P‐J, Van Doren E, Francisco MAD and Mast J, 2014. Quantitative characterization of aggregated and agglomerated titanium dioxide nanomaterials by transmission electron microscopy. Powder Technology, 258, 180–188. [Google Scholar]
- Verleysen E, Van Doren E, Waegeneers N, De Temmerman PJ, Abi Daoud Francisco M and Mast J, 2015. TEM and SP‐ICP‐MS analysis of the release of silver nanoparticles from decoration of pastry. Journal of Agricultural and Food Chemistry, 63, 3570–3578. 10.1021/acs.jafc.5b00578 [DOI] [PubMed] [Google Scholar]
- Verleysen E, Wagner T, Lipinski H‐G, Kägi R, Koeber R, Boix‐Sanfeliu A, De Temmerman P‐J and Mast J, 2019. Evaluation of a TEM based approach for size measurement of particulate (nano) materials. Materials, 12, 2274. [DOI] [PMC free article] [PubMed] [Google Scholar]
- Verleysen E, Waegeneers N, Brassinne F, De Vos S, Jimenez IO, Mathioudaki S and Mast J, 2020. Physicochemical characterization of the pristine E171 food additive by standardized and validated methods. Nanomaterials (Basel, Switzerland), 10, 592. 10.3390/nano10030592 [DOI] [PMC free article] [PubMed] [Google Scholar]
- Vladár AE and Hodoroaba V‐D, 2020. Characterization of nanoparticles by scanning electron microscopy. In: Hodoroaba V‐D, Unger WES and Shard AG (eds.). Characterization of Nanoparticles, Elsevier. pp. 7–27. [Google Scholar]
- Waegeneers N, De Vos S, Verleysen E, Ruttens A and Mast J, 2019. Estimation of the uncertainties related to the measurement of the size and quantities of individual silver nanoparticles in confectionery. Materials (Basel, Switzerland), 12, 2677. 10.3390/ma12172677 [DOI] [PMC free article] [PubMed] [Google Scholar]
- Wagner T and Eglinger J, 2017. thorstenwagner/ij-particlesizer: v1.0.9 Snapshot release (Version v1.0.9‐SNAPSHOT). Zenodo. 10.5281/zenodo.820296 [DOI] [Google Scholar]
- Ward F and Coates M, 1987. Gastrointestinal pH measurement in rats: influence of the microbial flora, diet and fasting. Laboratory Animals, 21, 216–222. [DOI] [PubMed] [Google Scholar]