. 2021 Jul 22;10:e64851. doi: 10.7554/eLife.64851

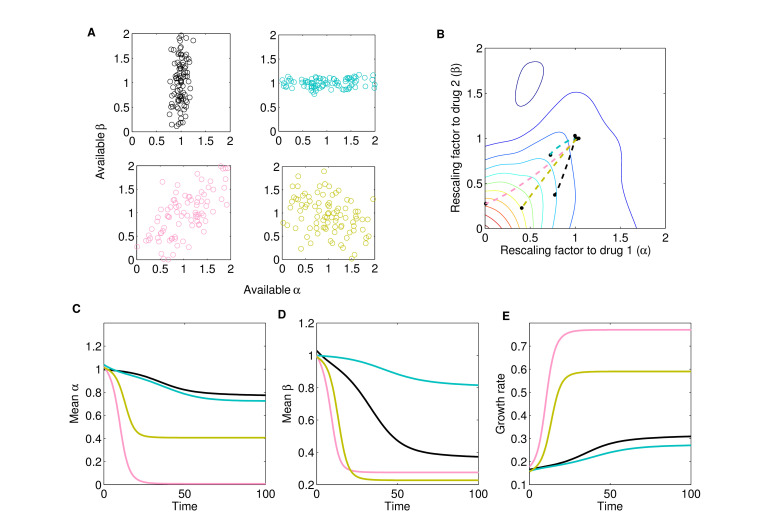
Figure 3. Different collateral profiles drive different evolutionary dynamics under the same treatment.

We simulated random collateral profiles for susceptibilities to two drugs and use them to predict phenotypic trajectories of a bacterial population. For the two-drug landscape, we chose one of the experimentally measured surfaces from Dean et al., 2020; Figure 3—figure supplement 1C, corresponding to the drug combination TGC-CIP (drug 1-drug 2). (A) Four special profiles include predominant variation in β (black), predominant variation in α (cyan), positive correlation between αs and βs (pink), and negative correlation between the susceptibilities to the two drugs (green). These were generated from a bivariate normal distribution with mean (1,1) and covariance matrices Σ1=(0.010.020.020.4), Σ2=(0.50.020.020.01), Σ3=(0.30.210.210.3), Σ4=(0.3-0.15-0.150.3). (B) The trajectories in mean α-β space following treatment (x0,y0), with x0=0.5xmax=0.025 and y0=0.5ymax=0.25, corresponding to different collateral profiles. (C) The dynamics of mean susceptibility to drug 1 α¯(t) for the four cases. (D) The dynamics of mean susceptibility to drug 2 β¯(t) for the four cases. (E) The dynamics of mean growth rate for the four cases. For underlying heterogeneity, we drew 100 random αi and βi as shown in (A) and initialized dynamics at ancestor frequency 0.99 and the remaining 1% evenly distributed among available mutants. It is clear that each collateral structure in terms of the available (αi,βi) leads to different final evolutionary dynamics under the same two-drug treatment. In this particular case, the fastest increase in resistance to two drugs and increase in growth rate occurs for the collateral resistance (positive correlation) case. The time course of the detailed selective dynamics in these four cases is depicted in Figure 3—videos 14.

Figure 3.

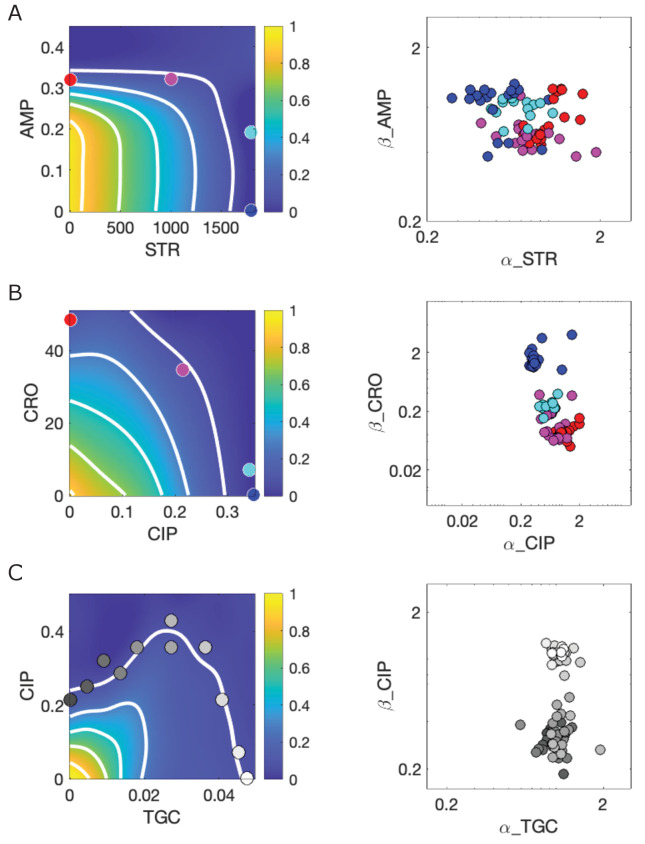
Figure 3—figure supplement 1. Response surfaces and scaling parameters for three drug pairs.

Figure 3—figure supplement 1.

Growth rate surfaces (left) and scaling parameters α and β for three drug combinations: ampicillin (AMP)-streptomycin (STR) (A); ceftriaxone (CRO)-ciprofloxacin (CIP) (B); and ciprofloxacin (CIP)-tigecycline (TGC) (C). Large color-coded circles on the left panels indicate external concentrations at which selection took place. Circles on the right panels indicate all observed mutants (αi,βi) that emerged, pooled across conditions. Data from Dean et al., 2020. Growth rate is measured in normalized units where growth of the drug-free ancestral cells (approximately 1 hr−1) is set to 1.
Figure 3—video 1. Evolutionary dynamics for collateral effects in Figure 3A.
Download video file (73KB, mp4)
Trajectory of mean traits in rescaling factor space (α,β) for case A in Figure 3 where the randomly generated available standing variation is higher in β (resistance to drug 2) and much lower in α (resistance to drug 1). The selective regime in drug dosage is (x0,y0)=0.5(xmax,ymax). The size of the circles at t=0,... represents the relative frequencies of different mutant subpopulations available at the beginning and changing over time.
Figure 3—video 2. Evolutionary dynamics for collateral effects in Figure 3B.
Download video file (70.8KB, mp4)
Trajectory of mean traits in rescaling factor space (α,β) for case A in Figure 3 where the randomly generated available standing variation is lower in β and higher in α. The selective regime in drug dosage is (x0,y0)=0.5(xmax,ymax). The dynamic size of the circles represents the relative frequencies of different mutant subpopulations available at the beginning and changing over time.
Figure 3—video 3. Evolutionary dynamics for collateral effects in Figure 3C.
Download video file (72.6KB, mp4)
Trajectory of mean traits in rescaling factor space (α,β) for case A in Figure 3 where the randomly generated available standing variation in β correlates positively with that in α (collateral resistance between the two drugs TGC-CIP). The selective regime in drug dosage is (x0,y0)=0.5(xmax,ymax). The dynamic size of the circles represents the changing relative frequencies of different mutant subpopulations.
Figure 3—video 4. Evolutionary dynamics for collateral effects in Figure 3B.
Download video file (73.6KB, mp4)
Trajectory of mean traits in rescaling factor space (α,β) for case A in Figure 3 where the randomly generated available standing variation in β correlates negatively with that in α (collateral sensitivity between TGC and CIP). The selective regime in drug dosage is (x0,y0)=0.5(xmax,ymax). The size of the circles represents the relative frequencies of different mutant subpopulations available at the beginning.