

Summary
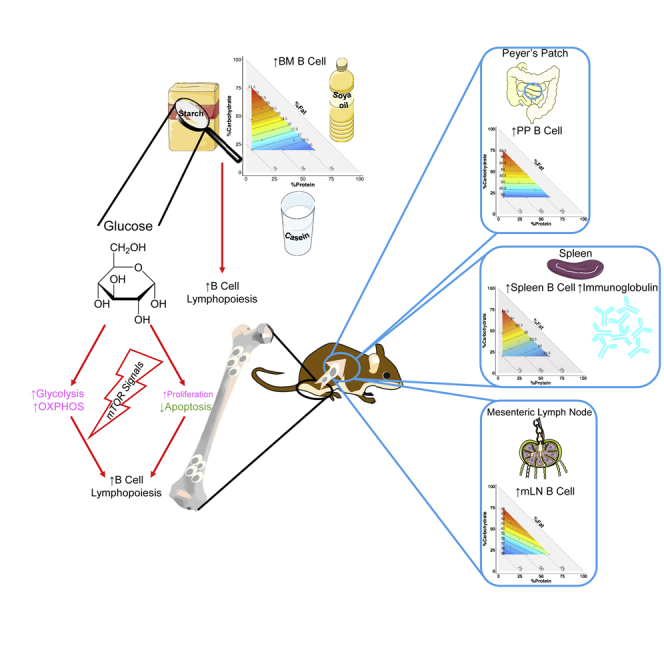
While diet modulates immunity, its impact on B cell ontogeny remains unclear. Using mixture modeling, a large-scale isocaloric dietary cohort mouse study identified carbohydrate as a major driver of B cell development and function. Increasing dietary carbohydrate increased B cell proportions in spleen, mesenteric lymph node and Peyer’s patches, and increased antigen-specific immunoglobulin G production after immunization. This was linked to increased B lymphopoiesis in the bone marrow. Glucose promoted early B lymphopoiesis and higher total B lymphocyte numbers than fructose. It drove B cell development through glycolysis and oxidative phosphorylation, independently of fatty acid oxidation in vitro and reduced B cell apoptosis in early development via mTOR activation, independently of interleukin-7. Ours is the first comprehensive study showing the impact of macronutrients on B cell development and function. It shows the quantitative and qualitative interplay between dietary carbohydrate and B cells and argues for dietary modulation in B cell-targeting strategies.
Subject areas: Biological sciences, Immunology, Cell biology, Developmental biology
Graphical abstract
Highlights
-
•
Dietary carbohydrates dynamically drive B cell lymphopoiesis and increase splenic B cells
-
•
Dietary glucose, but not fructose, affects B cell lymphopoesis
-
•
Dietary carbohydrates activate mTOR in B cells, particularly in early progenitors
-
•
Dietary carbohydrates increase plasma B cells and IgG response in immunized mice
Biological sciences; Immunology; Cell biology; Developmental biology
Introduction
Timely and appropriate defense against common existential dangers is a critical requisite of the immune response. Activation of the immune system exerts a significant energetic impost on various immune cells, requiring the uptake of amino acids, glucose, and fatty acids from the environment to supply this energy. Activation of different metabolic pathways within an immune cell has different consequences for its function (Tan et al., 2021). For example, mitochondrial respiration through oxidative phosphorylation (OXPHOS) promotes differentiation of anti-inflammatory regulatory T cells, while glycolysis favors that of pro-inflammatory Th17 T cells (O'Neill et al., 2016). Increased glucose uptake and glycolysis is also required for the activation and proliferation of B cells as well as their production of antibodies (Caro-Maldonado et al., 2014). Similarly, B cell lymphopoiesis is an energy-demanding process, with the highest demand for glucose at the early stages of B cell lymphopoiesis (Urbanczyk et al., 2018). Different subsets of B cells also possess unique metabolic profiles, with the more metabolically active B1 cells favoring glucose as the preferred substrate, while B2 cells preferentially utilize fatty acids. Within the B2 subset, marginal zone B cells appear to be reliant on mTOR/Akt signaling, while follicular zone B cells downregulate this pathway (Farmer et al., 2019).
Diet is the major source of energetic substrates and its manipulation can affect immune cell function. For example, a high-fat and low-carbohydrate ketogenic diet leads to inhibition of the anabolic mTOR pathway (McDaniel et al., 2011), limiting glycolysis to promote regulatory T cell development (Shi et al., 2011). How a ketogenic diet might affect B cells is unknown, however, and under high caloric conditions, high fat diet has been shown to impair both B cell differentiation in the bone marrow (BM) and their ability to produce antibody (Adler et al., 2014; Kosaraju et al., 2017). B cells play a central role in adaptive immunity through activating antigen-specific T cells and producing antibodies necessary to neutralize and eliminate pathogens. Their metabolic activity fluctuates throughout development from early progenitors to mature B cells. B cell lymphopoiesis occurs in the BM, where B-committed common lymphoid progenitors undergo differentiation sequentially into progenitor B cells, large precursor B cells, small precursor B cells, and immature B cells. Immature B cells either migrate to peripheral secondary lymphoid organs or remain in the BM to progress through early and late transitional B cells, early mature B cells, and finally into late mature B cells (Cariappa et al., 2007; Nagasawa, 2006).
B cell development is characterized by the regulated recombination of the B cell receptor (BCR) gene, which leads to the formation of functional BCRs (Nagasawa, 2006). Rapid cell renewal and vigorous protein biosynthesis are characteristic of very early B cell developmental stages, such as progenitor and large precursor B cells, which have high energy demands (Urbanczyk et al., 2018). The main metabolic pathway involved at these stages is glycolysis, which is driven by mTOR and HIF-1α activation, downstream of IL-7R signaling (Kojima et al., 2010; Stein et al., 2017; Yu et al., 2017). However, most focus has been on glycolysis, with the roles of other metabolic pathways such as OXPHOS or fatty acid oxidation less clearly understood. Moreover, how dietary macronutrients affect the B cell compartment is unknown. To date, studies investigating the impact of nutrition on B cells have mostly used high caloric and high-fat diets (Adler et al., 2014; Kosaraju et al., 2017). These induce obesity, a major confounding factor in establishing the relative importance of energetic macronutrients under physiological conditions. Hence, understanding how diet composition affects B cell development under basal isocaloric conditions is potentially valuable from both nutritional and therapeutic perspectives.
To address this question, we used a statistical modeling approach to investigate how macronutrient composition (carbohydrate, fat, and protein) affects peripheral B cells and B cell lymphopoiesis. To achieve this, we fed mice on one of 10 defined isocaloric diets with a broad range of each macronutrient (5–60% protein, 20–75% carbohydrate and 20–75% fat). Using the Scheffé mixture model (Scheffé, 1958), we found that carbohydrate was the main driver of B cell function and lymphopoiesis. Furthermore, we determined that the type of carbohydrate present in diet was also important, with glucose preferentially promoting B cell lymphopoiesis over fructose. Finally, we demonstrated that the mechanism behind this dependence involved both mTOR and GSK3. Together, our results suggest that dietary modulation, particularly by increasing carbohydrate, could be a novel strategy to boost B cell development and humoral immunity.
Results
Dietary carbohydrates modulate the number and proportion of peripheral B cells
While the impact of diet on the immune system is widely accepted, how dietary macronutrient composition affects B cell development is as yet unclear. To address this, mice were fed one of 10 isocaloric diets ad libitum for six weeks. Each diet had a defined ratio of protein (range: 5–60% by energy), carbohydrate (20–75%), and fat (20–75%), as detailed in Table S1. The 10 diets are designed to sufficiently sample the nutritional macronutrient landscape (Solon-Biet et al., 2014) with Diet 8 being the closest to the AIN93G formulation, a semi-purified normal chow diet, on which all these diets are based. The proportions of B220+ B cells in the spleen were then determined by flow cytometry, according to the gating strategy presented in Figure S1A.
To interrogate the relationship between macronutrient composition and splenic B cell proportion, we utilized an analytical framework involving mixture models (Scheffé, 1958). A linear mixture model was fitted, based upon experimentally determined splenic B cell proportion (n = 8 mice per group for each of the 10 diets), and the output of the model was represented on a right-angled mixture triangle (RMT) plot (Raubenheimer, 2011). The RMT plot allows us to visually interpret how changes in macronutrient composition drive a specific outcome variable, in this case, the proportion of B220+ B cells in the spleen (Figure 1A). In the RMT plot, the proportion of protein, carbohydrate, and fat in the diet are represented on the x-axis, y-axis, and the implicit-axis (hypotenuse), respectively. The response surface colored red within the nutritional space represents the highest proportion of B220+ cells, while the area in blue indicates the lowest proportion, with prismatically graded colors appearing between these extremes. Values on the isoline represent the predicted proportion (% B220+ of CD45+ cells). Further detail on the interpretation of the RMT plot is provided in Figure S2. Our modeling revealed a graded increase in the proportion of splenic B220+ B cells, with increasing carbohydrate content (Figure 1A). The dominating effect of carbohydrates was confirmed by values at the apices of the RMT triangle, corresponding to high-carbohydrate (HC; P5 C75 F20), high-protein (HP; P60 C20 F20), and high-fat (HF; P5 C20 F75) diets (Figure 1B). The highest proportion of splenic B cells was observed in mice fed on an HC diet (64.88% ± SEM 0.91), compared to mice fed on an HF (61.95% ± 1.25) or an HP diet (60.94% ± 0.84) (Figure S1B). Furthermore, a linear regression analysis validated a significant positive correlation between absolute dietary carbohydrate consumed and the proportion of splenic B cells, which was not observed for the other macronutrients (Figure 1C).
Figure 1.

High carbohydrate feeding increases peripheral B cells
(A) Contribution of macronutrient composition to proportion of splenic B220+ cells (n = 8 per diet, quantified by flow cytometry) was modeled with a mixture model and projected onto an RMT plot. 3-component mixture model represented on the RMT consists of carbohydrate (y-axis), protein (x-axis), and fat (implicit-axis), with splenic B cell proportion (number within isolines) as the response variables. Red and blue areas represent high and low experimental readouts respectively. Dots within the response surface correspond to 10 different diets used in experiments.
(B) Representative flow cytometry plot for splenocytes from mice fed on high protein (HP), high carbohydrate (HC) and high fat (HF) diets. Splenic B cells were assessed as B220+ cells based on gating strategy described in Figure S1A by flow cytometry.
(C) Linear regression analysis for the absolute energy intake from each macronutrient (protein, carbohydrate and fat) versus the B cell proportion in spleen. Each point represents averaged cage data.
(D) Contribution of macronutrient composition to B cell proportion in mesenteric lymph nodes (mLN) (n = 8 per diet, quantified using flow cytometry) was modeled with mixture model and projected onto an RMT plot.
(E) Linear regression analysis for the absolute energy intake from each macronutrient (protein, carbohydrate and fat) versus the B cell proportion in mLN. Each point represents averaged cage data.
(F) Contribution of macronutrient composition to B cell proportion in Peyer's Patches (PP) (n = 8 per diet, quantified using flow cytometry) was modeled with mixture model and projected onto an RMT plot.
(G) Linear regression analysis for the absolute energy intake from each macronutrient (protein, carbohydrate and fat) versus the B cell proportion in PP. Each point represents averaged cage data.
See also Figures S1–S4, and Table S1.
To determine if the impact of dietary carbohydrate intake on B cell proportion extends beyond the spleen, we analyzed other peripheral lymphoid organs. In both the mesenteric lymph nodes (mLN) and Peyer's patches, carbohydrate content in the diet was the major driver of B cell proportion (Figures 1D and 1F). Linear regression analyses also confirmed that only carbohydrate intake positively correlated with B cell proportions in both of these lymphoid organs (Figures 1E and 1G). This was statistically significant for mLN, while a strong trend was observed for Peyer's patches (p = 0.06). The absolute number of B cells in the mLN and Peyer's patches was driven by dietary carbohydrate and fat, respectively (Figure S1C). However, macronutrient composition was not a predictive factor of total B cell number in the spleen as the null model (the model by which macronutrient composition is assumed to have no impact on the outcome variable) was considered the better model, as determined by Akaike information criterion (AIC) testing (Figure S1C). Of note, B cells were not influenced by total energy intake or body weight (Figure S3) and mice fed on an HC diet have intermediate body weight and food intake compared to HF- and HP-fed mice (data not shown), suggesting that diet composition rather than energy intake was affecting the B cell compartment.
We observed that the impact of carbohydrate on the B cell phenotype is a slow process as a shorter feeding period of 3 weeks on an HC diet was not sufficient to change the B cell compartment to the same extent as 6 weeks (Figure S4A). To determine whether the effect of dietary feeding on the B cell compartment is a dynamic process, we fed mice on an HF diet for 6 weeks and then switched them to an HC diet for an additional 6 weeks. Mice switched from an HF to HC diet had similar B cell proportions compared to those maintained on an HC diet for 12 weeks (Figure S4B), suggesting that diet has a dynamic effect on the B cell compartment. To determine whether HC feeding affected particular subsets of B cells, we investigated the impact of diet on splenic marginal zone B cells, B1 cells and follicular B cells and found that the proportion and absolute numbers of marginal zone and proportion of B1 cells were higher in the spleen of HC fed mice, while diet did not affect follicular B cells (Figure S4C).
These results show that macronutrient composition, in particular, carbohydrate content, modulates the proportion of B cells in spleen and gut-related lymphoid organs dynamically. While carbohydrate was consistently the major driver of B cell proportion in all of these organs, protein, and fat had differential impacts on B cells in different compartments.
High carbohydrate diet promotes antigen-specific humoral immune responses
As dietary carbohydrate correlates with a higher proportion of B cells, we next determined whether HC feeding could affect antigen-specific immunoglobulin production as a readout of B cell function. Mice were fed on an HC, HP or HF diet for at least 4 weeks and immunized with KLH emulsified in CFA or CFA alone as control (Figure 2A). As expected, KLH immunized mice had significantly higher concentration of total and KLH-specific IgG, compared to control mice (Figures 2B and 2C). Furthermore, mice fed on HC had the highest levels of total and KLH-specific IgG of the three diets (Figures 2B and 2C), showing that HC feeding promotes functional B cells. The higher IgG production was linked to the higher proportion of plasma B cells in immunized HC fed mice (Figure 2D), rather than their increased activity, as polyclonal stimulation with LPS of B cells isolated from mice fed on the different diets had similar levels of IgG production (Figure 2E).
Figure 2.

High carbohydrate feeding stimulates B cell-mediated humoral responses upon immunization
(A) Experimental workflow for the immunization study.
(B) Scatter bar chart for serum total IgG from mice fed on high protein (HP), high carbohydrate (HC), or high fat (HF) diets and immunized with only CFA or CFA and KLH as determined by ELISA (n = 7–8 per group).
(C) Scatter bar chart for serum KLH-specific IgG from mice fed on HP, HC, and HF diets and immunized with only CFA, or CFA and KLH as determined by ELISA (n = 8 per group).
(D) Scatter bar chart for the proportion of splenic plasma cell (defined as B220lowCD138+ cells) from mice fed on either an HP, HC or HF diets determined by flow cytometry 10 days following immunization with CFA and KLH (n = 8 per diet).
(E) Scatter bar chart for the concentration of IgG from supernatant from LPS-stimulated B cells isolated from KLH-immunized mice fed on either an HP, HC, or HF diet. Data are represented as mean ± SEM. Differences between groups were analyzed by t test or two-way ANOVA; ∗p < 0.05; ∗∗p < 0.01; ∗∗∗p < 0.001; ∗∗∗∗p < 0.0001.
Thus, taken together, increased splenic B cell proportion under high dietary carbohydrate feeding conditions was associated with an increased functional antigen-specific response.
Carbohydrate-driven B cell increases are linked to increased B cell lymphopoiesis in the bone marrow
Expansion of B cells is either linked to their proliferation on antigen stimulation in germinal centers or due to increased lymphopoiesis in the BM. As we observed increased B cells in lymphoid tissues under homeostatic conditions (Figure 1), we hypothesized that HC feeding might promote B cell lymphopoiesis. To investigate this, we used the modeling method described in Figure 1. As in the periphery, mixture modeling revealed that carbohydrate was also the predominant driver of the proportion of total B cells in the BM, with protein also driving this phenotype to a lesser extent (Figure 3A). Indeed, HC feeding induced the highest proportion of total B cells in the BM (Figure 3B) and this was confirmed by linear regression analysis, with carbohydrate intake correlating significantly with B cell proportion in the BM (Figure 3C). Contrariwise, total B cell proportion was significantly inversely correlated with the amount of protein eaten (Figure 3C).
Figure 3.

High carbohydrate feeding increases bone marrow B cells
(A) Contribution of macronutrient composition to B cell proportion in bone marrow (BM) (n = 8 per diet, quantified using flow cytometry) was modeled with a mixture model and projected onto an RMT plot. 3-component mixture model represented on the RMT consists of carbohydrate (y-axis), protein (x-axis), and fat (implicit-axis), with BM B cell proportions (number within isolines) as the response variables. Red and blue areas represent high and low experimental readouts, respectively. Dots within the response surface correspond to 10 different diets used in experiments.
(B) Scatter bar chart for BM B cell proportion from mice fed on high protein (HP), high carbohydrate (HC), and high fat (HF) diets (n = 8 per diet).
(C) Linear regression analysis for the absolute energy intake from each macronutrient (protein, carbohydrate and fat) versus the B cell proportion in BM. Each point represents averaged cage data.
(D) Different B cell subsets were quantified by flow cytometry based on the gating strategy described in Figure S4 from mice fed on either an HP, HC or HF diet and visualized with two-dimensional t-distributed stochastic neighborhood embedding (t-SNE). Data are represented as mean ± SEM. Differences between groups were analyzed with t test; ∗p < 0.05; ∗∗p < 0.01.
See also Figure S5.
The BM is the site of B cell development, where common lymphoid progenitors commit to the B cell lineage and develop into immature B lymphocytes that either remain in the BM or emigrate into the peripheral circulation for eventual further maturation (Cariappa et al., 2007; Nagasawa, 2006). We observed that HC feeding increased the proportions of B cells at different stages of development (Figure 3D, gating strategy presented in Figure S5). Carbohydrate was the predominant macronutrient driving the proportion of progenitor B cells, late transitional and early mature B cells while protein impacted on the proportion of other subsets based on the isoline orientation (Figures 4 and S2). These phenotypes were also shown by linear regression analyses correlating macronutrient intake (protein, fat or carbohydrate) with B cell subsets (Figures S6A–S6C). The absolute numbers of total B cells and B cell at early developmental stages were also predominantly driven by carbohydrate in the BM (Figure S7).
Figure 4.

Dietary carbohydrate promotes B cell lymphopoiesis
Mixture models and representative t-SNE plots for mice fed on HP, HC, and HF diets for different B cell subsets in BM (progenitor, large precursor, small precursor, immature, early transitional, late transitional, early mature and late mature). See also Figures S6 and S7.
Collectively, these results show that high dietary carbohydrate promotes early B cell lymphopoiesis.
Dietary glucose but not fructose modulates B cell lymphopoiesis
Dietary carbohydrates mostly comprise starch and sucrose, which break down to yield glucose, and glucose and fructose, respectively. As we identified a quantitative effect of carbohydrates on B cell development, our next step was to determine the impact of qualitative changes in carbohydrates. To test this, we fed mice on diets with the recommended doses of carbohydrate (60%), of which 30% was starch and 70% was either glucose (Glc), fructose (Fru), or a mixture of fructose and glucose (Glc + Fru) (Table S2). Mice were fed on these diets for at least 4 weeks, and BM leukocytes were isolated and analyzed by flow cytometry. Mice fed on diets supplemented with glucose (Glc) had significantly higher proportions of total bone marrow B cells, compared to those supplemented with fructose (Fru) (Figure 5A). Analysis of developmental B cell subsets revealed that only early B cell differentiation stages were impacted, with the highest proportions and numbers of progenitor and large precursor B cells observed in mice fed on diets supplemented with glucose (Figures 5B–5D and S8A–S8O). These results suggest that not only the amount but also the type of carbohydrate present in diet affects B cell lymphopoiesis.
Figure 5.

Bone marrow B cell lymphopoiesis is fueled by glucose but not fructose
(A) Scatter bar chart for B cell proportion in BM from mice fed on Glc, Glc + Fru. and Fru diets as described in Table S2.
(B) Representative flow cytometry plot showing the proportions of progenitor, large precursor, and small precursor B cells in BM from mice fed on Glc, Glc + Fru, and Fru diets as described in Table S2. Numbers specified denoted the percentages within total BM leukocytes of the corresponding populations.
(C) Scatter bar chart for progenitor B cell proportion in BM from mice fed on Glc, Glc + Fru. and Fru diets as described in Table S2.
(D) Scatter bar chart for large precursor B cell proportion in BM from mice fed on Glc, Glc + Fru, and Fru diets as described in Table S2.
(E) Scatter bar chart for cell sizes of freshly isolated different B cell subsets in BM (n = 20), as determined by flow cytometry. FSC-A, forward scatter.
(F) Scatter bar chart for progenitor B cell proportion in freshly isolated BM leukocyte cultured under conditions of 0 mM Glucose, 1 mM Glucose, 2 mM Glucose, 2 mM Fructose, and 1 mM Glucose plus 1 mM Fructose for 24 hr.
(G) Scatter bar chart for large precursor B cell proportion in freshly isolated BM leukocyte cultured under conditions of 0 mM Glucose, 1 mM Glucose, 2 mM Glucose, 2 mM Fructose, and 1 mM Glucose plus 1 mM Fructose for 24 h. Data are represented as mean ± SEM. Differences between groups were analyzed with t test; ∗p < 0.05; ∗∗p < 0.01; ∗∗∗p < 0.001; ∗∗∗∗p < 0.0001.
B cell lymphopoiesis is highly energy demanding, with different energetic requirements at different stages (Kojima et al., 2010; Stein et al., 2017). Among the subsets, large B cell precursors have been shown to have the highest metabolic activity (Kojima et al., 2010; Stein et al., 2017). Forward-scatter (FSC-A) analysis by flow cytometry confirmed that both the progenitor and large precursor B cell sizes were significantly larger than the other subsets (Figure 5E), strongly suggesting their higher metabolic activity (Jellusova et al., 2017; Stein et al., 2017). A higher metabolic activity could explain why these subsets in particular were affected by the type of carbohydrate present in diets. IL-7 is considered to be a key mediator of B lymphopoiesis, promoting B cell survival and proliferation at early stages of development (Corfe and Paige, 2012). Incubation of BM leukocytes with glucose did not affect the expression of IL-7 receptor alpha chain CD127 in different B cell subsets (Figures S8P and S8Q), suggesting that the impact of glucose and carbohydrate in vivo was independent of IL-7 signaling. To test this hypothesis, we cultured BM leukocytes without IL-7 in the presence or absence of glucose or fructose. We found that the proportion of these subsets increased in media supplemented with glucose in a dose-dependent manner, while fructose had no effect (Figures 5F and 5G).
Together these results support a qualitative effect of carbohydrate on B cell lymphopoiesis, with glucose being a preferred substrate.
Glucose supports early B cell development through glycolysis and oxidative phosphorylation
Different metabolic pathways can be used to supply the energy necessary for cell survival and proliferation (Figure 6A). To determine which pathways mediate the effects of glucose on early B cells, we used a series of inhibitors to identify which metabolic pathway was preferentially involved. Glucose is the major substrate in the production of ATP by glycolysis. This yields pyruvate, which enters the tricarboxylic acid (TCA) cycle after its conversion into acetyl-CoA, subsequently leading to ATP production through OXPHOS.
Figure 6.

Glucose supports early B cell development through glycolysis and oxidative phosphorylation
(A) Schematics of the glucose-involved metabolic pathways under study.
(B) GSEA analysis on microarray data from murine progenitor, larger precursor and mature B cells showed enrichment in glycolysis pathway signaling (n = 5–6 for each subset). Scatter bar chart for progenitor and large precursor B cell proportion in freshly isolated BM leukocyte cultured with 2 mM Glucose in the presence/absence of glycolysis inhibitor 2DG (n = 8).
(C) GSEA analysis on microarray data from murine progenitor, larger precursor and mature B cells showed enrichment in oxidative phosphorylation pathway signaling (n = 5–6 for each subset). Scatter bar chart for progenitor and large precursor B cell proportion in freshly isolated BM leukocyte cultured with 2 mM Glucose in the presence/absence of electron transport inhibitor Rotenone (n = 8).
(D) GSEA analysis on microarray data from human progenitor, precursor and immature B cells showed enrichment in glycolysis pathway signaling (n = 6 for each subset).
(E) GSEA analysis on microarray data from human progenitor, precursor and immature B cells showed enrichment in oxidative phosphorylation pathway signaling (n = 6 for each subset). Data are represented as mean ± SEM. Differences between groups were analyzed with t test; ∗∗p < 0.01; ∗∗∗p < 0.001.
See also Figure S9.
Addition of the glycolysis inhibitor 2-deoxyglucose (2DG) decreased both the proportion of B cell progenitors and large precursors in the presence of glucose, suggesting that glucose is used through glycolysis (Figure 6B). Similarly, the inhibition of OXPHOS with rotenone (Figure 6C), and of ATP synthase with oligomycin (Figure S9A), impaired the effect of glucose on these subsets. These results suggest that both glycolysis and OXPHOS contribute to the effects of glucose on B cell lymphopoiesis. To confirm these finding, we performed GSEA of an open-source microarray dataset probing the transcriptomics of BM progenitors, large precursors, small precursors, immature and mature B cells (Hoffmann et al., 2002) (GEO: GSE13). We found that both genes involved in glycolysis (Figure 5B) and OXPHOS (Figure 5C) were enriched in progenitor and large precursor B cells compared to mature B cells, suggesting that early B cell subsets rely more on glycolysis and OXPHOS than later stages of differentiation. Similarly, GSEA for human B cell microarray (GEO: GSE14714) (Hystad et al., 2007) also confirmed enriched signals of glycolysis and OXPHOS in early stage B cells (Figures 6D and 6E).
Fatty acid metabolism is also an important source of energy for some immune subsets, including regulatory T cells and CD8+ memory T cells, and has been more recently described in germinal center B cells (Weisel et al., 2020). Acetyl-CoA produced from glycolysis can be used for fatty acid synthesis, in the process of lipogenesis. Glucose-dependent de novo lipogenesis has been shown to be critical for plasma B cell differentiation (Dufort et al., 2014). Consistent with this, we found that inhibition of lipogenesis with TOFA significantly decreased the impact of glucose on both B cell progenitors and large precursors (Figure S9B). Of note, β-oxidation, the conversion of fatty acids into acetyl-CoA, was not critical, as the addition of the fatty acid oxidation inhibitor etomoxir had no impact (Figure S9C).
In summary, glycolysis, OXPHOS and lipogenesis are important metabolic pathways in the early stages of B cell development.
Glucose protects early B cells from apoptosis through mTOR activation
Our next step was to determine whether glucose increased the proportion of progenitor and large precursor B cells through anti-apoptotic effects and/or via the modulation of their proliferation. Annexin V levels and Ki67 labeling were assessed by flow cytometry and used as a readout of apoptosis and proliferation, respectively, with Annexin V+ cells regarded as apoptotic and Ki67+ cells regarded as proliferative. While the addition of glucose significantly reduced the proportion of Annexin V+ cells within the progenitor and large precursor B cell populations (Figures 7A and 7B), it also increased the Ki67+ population in large precursor B cells (Figures 7C and 7D). These results suggest that glucose increase the proportion of early B cell subsets mainly through anti-apoptotic effects and potentially by promoting proliferation in large precursors. This is consistent with the fact that HC feeding did not significantly increase the proportion of Ki67+ cells in the different bone marrow B cell subsets in vivo compared to HF and HP feeding (data not shown), suggesting a predominant anti-apoptotic effect of HC on B cells.
Figure 7.

Glucose protected early B cells from apoptosis through activating mTOR signals
(A) Annexin V staining for progenitor B cells in freshly isolated BM leukocyte cultured in the presence/absence of glucose and the corresponding scatter bar chart for Annexin V positive proportions (n = 6).
(B) Annexin V staining for large precursor B cells in freshly isolated BM leukocytes cultured in the presence/absence of glucose and the corresponding scatter bar chart for Annexin V positive proportions (n = 6).
(C) Scatter bar charts for Ki67 positive proportion in progenitor B cell in freshly isolated BM leukocyte culture in the presence/absence of glucose (n = 6).
(D) Scatter bar charts for Ki67 positive proportion in large precursor B cell in freshly isolated BM leukocyte culture in the presence/absence of glucose (n = 6).
(E) Scatter bar chart for progenitor B cell proportion in freshly isolated BM leukocyte cultured with 2 mM Glucose in the presence/absence of mTOR inhibitor Rapamycin (n = 8).
(F) Scatter bar chart for large precursor B cell proportion in freshly isolated BM leukocyte cultured with 2 mM Glucose in the presence/absence of mTOR inhibitor Rapamycin (n = 8).
(G) Annexin V staining for progenitor B cells in freshly isolated BM leukocyte cultured with 2 mM Glucose in the presence/absence of mTOR inhibitor Rapamycin and the corresponding scatter bar chart for Annexin V positive proportion (n = 5).
(H) Annexin V staining for large precursor B cells in freshly isolated BM leukocyte cultured with 2 mM Glucose in the presence/absence of mTOR inhibitor Rapamycin and the corresponding scatter bar chart for Annexin V positive proportion (n = 5).
(I) Representative flow cytometry plot showing the positive proportion for phosphorylated ribosomal protein S6 (pS6+) in progenitor B cells in freshly isolated BM leukocyte cultured in DMEM solution supplemented with/without 2 mM Glucose for 1 hr. Numbers specified denoted the percentages within the corresponding parent populations.
(J) Representative flow cytometry plot showing the positive proportion for phosphorylated ribosomal protein S6 (pS6+) in large precursor B cells in freshly isolated BM leukocyte cultured in DMEM solution supplemented with/without 2 mM Glucose for 1 hr. Numbers specified denoted the percentages within the corresponding parent populations.
(K) Scatter bar chart for percentages of the positive proportions for phosphorylated ribosomal protein S6 (pS6+) in progenitor B cells in freshly isolated BM leukocyte cultured in DMEM solution supplemented with/without 2 mM Glucose for 1 hr (n = 6).
(L) Scatter bar chart for percentages of the positive proportions for phosphorylated ribosomal protein S6 (pS6+) in large precursor B cells in freshly isolated BM leukocyte cultured in DMEM solution supplemented with/without 2 mM Glucose for 1 hr (n = 6).
(M) Scatter bar chart for percentages of the positive proportions for phosphorylated ribosomal protein S6 (pS6+) in different B cell subsets from freshly isolated BM leukocyte (n = 3).
(N) GSEA analysis on microarray data from murine progenitor, large precursor and mature B cells showed enrichment in mTORC1 pathway signaling (n = 5–6 for each subset).
(O) GSEA analysis on microarray data from human progenitor, precursor and immature B cells showed enrichment in mTORC1 pathway signaling (n = 6 for each subset).
(P) A summary diagram for the potential impact of glucose toward early stage B cells. Data are represented as mean ± SEM. Differences between groups were analyzed with t test; ∗p < 0.05; ∗∗p < 0.01; ∗∗∗p < 0.001; ∗∗∗∗p < 0.0001.
See also Figures S10–S12.
Activation of the metabolic sensor mTOR has been shown to have anti-apoptotic effects in germinal center B cells (Jellusova et al., 2017). Consistent with this, we observed that pharmacological inhibition of mTOR with rapamycin in the presence of glucose reduced the proportion of progenitor and large precursor B cells, compared to cells stimulated with glucose only (Figures 7E and 7F), through pro-apoptotic effects rather than impacting cell proliferation (Figures 7G, 7H, and S10A). Ribosomal protein S6 (S6) are mTOR effector proteins phosphorylated when mTOR is activated (Ruvinsky and Meyuhas, 2006). Addition of glucose increases phospho-S6 in early B cell progenitors and large precursors, as shown by flow cytometry, confirming that the mTOR pathway was activated in presence of glucose (Figures 7I–7L). Both flow cytometry and GSEA analysis of open source microarrays datasets (Hoffmann et al., 2002; Hystad et al., 2007) (GEO: GSE13, GSE14714) show that mTORC1 pathway was preferentially activated in early B cells not only in mice but also in humans, suggesting that this mechanism is conserved in mammals (Figures 7M–7O). Consistently, we identified that pS6 was increased in progenitor and large precursor B cells after acute intraperitoneal administration of glucose (Figure S11), showing that glucose-induced mTOR activation in early B cell developmental stages in vivo. These effects of carbohydrate were also observed after 6 weeks under HC feeding conditions in which progenitor and large precursor B cells had higher pS6 compared to HF and HP diets (Figure S12).
Glycogen sensing Kinase 3 (GSK3) is a key metabolic sensor maintaining B cell homeostasis, activated under low glucose conditions. This kinase is also a downstream target of mTOR, as shown in germinal center B cells in which mTOR activation leads to GSK3 inhibition. Pharmacological inhibition of GSK3 with CHIR99021 rescued B cell survival in early progenitors and precursors stimulated with glucose in the presence of rapamycin (Figures S10B and S10C). This suggests GSK3 is an important downstream player in the glucose-mTOR axis. This was further confirmed by inhibiting GSK3 under zero-glucose conditions, where early B cell proportions and survival were rescued (Figures S10D and 10E). Taken together, these results suggest that the effect of glucose on B cell lymphopoiesis involves the inhibition of GSK3 by mTOR (Figure 7P), and that mTOR is a critical metabolic sensor at early stages of B cell development promoting B cell lymphopoiesis in particular, via an anti-apoptotic effect.
Discussion
In the present work, we highlight the key role for the dietary macronutrient carbohydrate on the B cell compartment using isocaloric diets. Previous dietary manipulations focused on energy dense diets resulting in obesity (Adler et al., 2014; Kosaraju et al., 2017), a major confounding factor in understanding the role of macronutrients on B cells. Isocaloric diets enriched in carbohydrate significantly increased peripheral B cell proportions in mice, which led to higher levels of antigen-specific IgG after immunization. This impact of carbohydrate on peripheral B cells occurred in parallel with increased B cell lymphopoiesis in BM. Interestingly, there was a preferential effect of glucose over fructose at the earliest stages of B cell lymphopoiesis through the promotion of cell survival rather than proliferation. The mechanisms were independent of IL-7 and involved the utilization of glucose through glycolysis and activation of mitochondrial OXPHOS as well as the modulation of metabolic sensor mTOR. These metabolic pathways are critical at early stages of development in both mice and humans. This work suggests that dietary manipulation could be used as a novel intervention to optimize efficacy of immunization or to restore B cell lymphopoiesis following immunosuppression.
B cells, like all immune cells, can be highly energetically demanding, depending on the stage of development and challenges encountered. In this work, we highlight that the carbohydrate glucose is the preferential dietary substrate for B cell development by reducing apoptosis and promoting cell survival. It is interesting to note that this was particularly true at early stages of development, where we observe highest glucose-induced mTOR activation both in vitro and in vivo. IL-7R signaling, required for B cell lymphopoiesis, also activates mTOR at early B cell development stages (Yu et al., 2017). Thus, high consumption of dietary carbohydrate could be a novel strategy to rescue B cell lymphopoiesis due to defect in IL-7 signaling typically in aging (Nguyen et al., 2017). Increased carbohydrate intake may also potentially enhance antibody responses, by supporting the glucose requirement of long-lived plasma cells for antibody glycosylation (Lam et al., 2016). Interestingly, the interaction between high carbohydrate with fat or protein contents conferred differential effects toward different B cell subsets, with high carbohydrate low protein diet predominantly driving most of the responses. This coincides with the beneficial influences from high carbohydrate low protein diet toward metabolic health and longevity (Solon-Biet et al., 2014). On the contrary, interventions reducing mTOR activation would reduce B cell lymphopoiesis, which is aligned with reports showing that caloric restriction or intermittent fasting, both of which inhibits mTOR activity, lead to reduced B cell progenitors in the BM and mature B cells in the periphery (Shushimita et al., 2014).
We also identified that increased B cell lymphopoiesis under high carbohydrate conditions lead to higher peripheral B cell numbers, in particular marginal zone B cells, and proportions of B1 cells in the spleen, which resulted in increased antigen-specific IgG release following KLH immunization. The reason for this specific effect of HC on splenic marginal zone B cells and B1 cells is unclear; it may be linked to the impact of HC on lymphopoiesis, but also to their specific metabolic demand, as B1 cells are highly glycolytic (Clarke et al., 2018; Daïen et al., 2021), while the metabolic activity of marginal zone B cells is not well understood. Dietary manipulation targeting B cells could thus be highly relevant in therapeutics by either optimizing immunization efficacy under high carbohydrate feeding conditions or by decreasing B cell function through low carbohydrate consumption in autoimmune diseases, such as multiple sclerosis or rheumatoid arthritis, where B cells play a central role in pathogenesis. The benefits of the ketogenic diet, consisting of minimal carbohydrate content, has been reported in inflammatory diseases in both animal models and humans (Ang et al., 2020; Bock et al., 2018), yet whether it is linked to reduced B lymphopoiesis remains unknown to our knowledge.
GSK3 is “functionally opposite” to mTOR as this enzyme gets activated under low glucose conditions and inhibited under high nutrient availability conditions. Inhibition of GSK3 might contribute to progenitor B cell survival by preventing Mcl-1 degradation (Baracho et al., 2014). Consistent with this, we observed that pharmacological inhibition of GSK3 rescued early B cell survival under glucose-deprived conditions. In contrast, deletion of GSK3 was previously shown to modulate the survival of germinal center B cells under low glucose conditions (Jellusova et al., 2017). GSK3 might thus have different effects on B cell survival depending on the stage of development and our study has specifically addressed its role in early B cell lymphopoiesis. Moreover, we also identified that GSK3 inhibition could rescue early progenitors from the effects of rapamycin, suggesting that the mTOR-GSK3 axis is important in early B cell lymphopoiesis. The key role of GSK3 and mTOR in hematopoiesis was highlighted at even earlier stages than progenitor and precursor B cells, as GSK3 inhibition was previously shown to promote early hematopoietic progenitors (Huang et al., 2009).
The fact that mTOR activation, as well as glycolysis, were similarly activated in early stages of human B cell lymphopoiesis suggests an evolutionarily conserved mechanism and that our results are thus likely to be of translational interest. This raises potential concerns about the side effects of treatment targeting mTOR, as well as GSK3, on B cell lymphopoiesis. Such treatments include lithium, a GSK3 inhibitor used as a mood stabilizer in bipolar disorder patients (Alda, 2015). While one study has shown that lithium could promote in vitro IgG and IgM release when added to peripheral blood mononuclear cells (Wilson et al., 1989), its impact on B cell lymphopoiesis has never been investigated to our knowledge. Similarly, mTOR inhibitors are widely used for the treatment of cancer (Hua et al., 2019) and obesity (Chang et al., 2009). However, there is limited knowledge of its potential adverse effects on B cell development. We also observed that mice fed on balanced diets, with fixed amounts of carbohydrates, had impaired B cell lymphopoiesis when the ratio of fructose to glucose was increased. If these results were validated in humans, high fructose intake in western-style diets might have detrimental effects beyond metabolic alteration with potential significant immune defects (Jaiswal et al., 2019). These diets are commonly associated with obesity, a condition known to alter the immune system and B cell lymphopoiesis (Adler et al., 2014; Trottier et al., 2012). Whether a high caloric diet can potentiate the effects of fructose remain to be determined.
To conclude, B cell development is tightly regulated by metabolic pathways, particularly glycolysis and OXPHOS, that maintain cell survival at early stages of lymphopoiesis in both mouse and human. Diet composition, which provides substrates to fuel these pathways can modulate B cell lymphopoiesis, with a high carbohydrate diet boosting B cell lymphopoiesis. This knowledge could lead to novel dietary recommendation to optimize the immune response with a high carbohydrate diet to increase B cell response during infection or immunization or low carbohydrate to dampen B cell responses in autoimmune diseases.
Limitations of the study
This work was performed in mice, and further validation will be required for translation to humans.
STAR★Methods
Key resources table
| REAGENT or RESOURCE | SOURCE | IDENTIFIER |
|---|---|---|
| Antibodies | ||
| Anti-mouse B220 BUV737 | BD Biosciences | Cat# 612839; RRID: AB_2738813 |
| Anti-mouse B220 BV510 | BioLegend | Cat# 103247; RRID: AB_2561394 |
| Anti-mouse B220 PE | BioLegend | Cat# 103208; RRID: AB_312993 |
| Anti-mouse B220 PerCP | BioLegend | Cat# 103233; RRID: AB_893355 |
| Anti-mouse CD117 BV421 | BioLegend | Cat# 105828; RRID: AB_11204256 |
| Anti-mouse CD11c FITC | BioLegend | Cat# 117306; RRID: AB_313775 |
| Anti-mouse CD138 PE/Cy7 | BioLegend | Cat# 142513; RRID: AB_2562197 |
| Anti-mouse CD138 PECF594 | BD Biosciences | Cat# 564606; RRID: AB_2738863 |
| Anti-mouse CD16/32 | BioLegend | Cat# 101320; RRID: AB_1574975 |
| Anti-mouse CD19 FITC | BioLegend | Cat# 115506; RRID: AB_313641 |
| Anti-mouse CD19 PE/Cy5 | BioLegend | Cat# 115510; RRID: AB_313645 |
| Anti-mouse CD1d PerCP/Cy5.5 | BioLegend | Cat# 123514; RRID: AB_2073523 |
| Anti-mouse CD21/35 APC/Cy7 | BioLegend | Cat# 123418; RRID: AB_1953275 |
| Anti-mouse CD23 APC | BioLegend | Cat# 101620; RRID: AB_2563439 |
| Anti-mouse CD24 BV605 | BioLegend | Cat# 101827; RRID: AB_2563464 |
| Anti-mouse CD43 PE/Cy7 | BioLegend | Cat# 143210; RRID: AB_2564349 |
| Anti-mouse CD45 BV650 | BD Biosciences | Cat# 563410; RRID: AB_2738189 |
| Anti-mouse CD45 BV785 | BioLegend | Cat# 103149; RRID: AB_2564590 |
| Anti-mouse CD95 APC | BioLegend | Cat# 152604; RRID: AB_2632899 |
| Anti-mouse GL-7 FITC | BioLegend | Cat# 144603; RRID: AB_2561696 |
| Anti-mouse IA/IE Pacific Blue | BioLegend | Cat# 107620; RRID: AB_493527 |
| Anti-mouse IgD BUV395 | BD Bioscience | Cat# 564274; RRID: AB_2738723 |
| Anti-mouse IgM APC/Cy7 | BioLegend | Cat# 406516; RRID: AB_10660305 |
| Anti-mouse MHC-II BV510 | BioLegend | Cat# 107636; RRID: AB_2734168 |
| Anti-rabbit IgG AF488 (Poly4064) | BioLegend | Cat# 406416; RRID: |
| Phospho-S6 Ribosomal Protein (Ser240/244) (D68F8) Rabbit mAb | Cell Signaling | Cat# 5364S; RRID: AB_10694233 |
| Chemicals, peptides, and recombinant proteins | ||
| 2-Deoxy-D-Glucose | Sigma-Aldrich | Cat# D8375 |
| 2-Mercaptoethanol | Gibco | Cat# 21985023 |
| CHIR99021 | Sigma-Aldrich | Cat# SML1046 |
| D-(+)-Glucose | Sigma-Aldrich | Cat# G8270 |
| DMEM | Sigma-Aldrich | Cat# D5030 |
| EDTA | Ajax Finechem | Cat# ACR14785 |
| Etomoxir | Sigma-Aldrich | Cat# E1905 |
| Foetal Bovine Serum | Bovogen | Cat# AFBS-500 |
| Freund’s Adjuvant, Complete | Sigma-Aldrich | Cat# F5881 |
| Fructose | Sigma-Aldrich | Cat# F3510 |
| Hemocyanin keyhole limpet | Sigma-Aldrich | Cat# H7017 |
| HEPES buffer | Gibco | Cat# 15630080 |
| L-glutamine | Sigma-Aldrich | Cat# G7513 |
| Lipopolysaccharide | InvivoGen | Cat# Tlrl-Eklps |
| Live/Dead Fixable Blue Dead Cell Stain Kit | Invitrogen | Cat# l34962 |
| Oligomycin | Sigma-Aldrich | Cat# 75351 |
| Penicillin-Streptomycin | Gibco | Cat# 15140122 |
| Phosphate-buffered saline | Gibco | Cat# 18912014 |
| Rapamycin | Sigma-Aldrich | Cat# R0395 |
| Red Blood Cell Lysis Buffer (10X) | BioLegend | Cat# 420301 |
| Rotenone | Sigma-Aldrich | Cat# R8875 |
| Sodium Pyruvate | Gibco | Cat# 11360070 |
| TOFA (5-tetradecyloxy-2-furoic acid) | Sigma-Aldrich | Cat# T6575 |
| Ultracomp Ebeads Compensation Beads | Invitrogen | Cat# 01-2222-42 |
| Critical commercial assays | ||
| Mouse IgG ELISA Quantitation Set | Bethyl Laboratories Inc | Cat# E90-131 |
| Annexin A5 FITC/7-AADKit | Beckman Coulter | Cat# IM3614 |
| Experimental models: Organisms/strains | ||
| Mus muculus (C57BL/6) | Australian Bioresource | JAX: 000664 |
| Mus muculus (C57BL/6) | Animal Resources Center | JAX: 000664 |
| Software and algorithms | ||
| Graphpad Prism v9 | GraphPad Software | RRID: SCR_008520 |
| R Project for Statistical Computing 3.6.1 | R Foundation | RRID: SCR_001905 |
| RStudio 1.3.1093 | RStudio | RRID: SCR_000432 |
| FlowJo v10 | FlowJo Inc. | RRID: SCR_008520 |
| Gene Set Enrichment Analysis | Broad Institute | RRID: SCR_003199 |
| Chemdraw | PerkinElmer | RRID: SCR_016768 |
| Other | ||
| Mouse diet – P60 C20 F20 | Specialty Feeds | SF17-188 |
| Mouse diet – P5 C75 F20 | Specialty Feeds | SF17-189 |
| Mouse diet – P5 C20 F75 | Specialty Feeds | SF17-190 |
| Mouse diet – P33 C47 F20 | Specialty Feeds | SF17-191 |
| Mouse diet – P33 C20 F47 | Specialty Feeds | SF17-192 |
| Mouse diet – P5 C47 F48 | Specialty Feeds | SF17-193 |
| Mouse diet – P14 C29 F57 | Specialty Feeds | SF17-194 |
| Mouse diet – P14 C57 F29 | Specialty Feeds | SF17-195 |
| Mouse diet – P42 C29 F29 | Specialty Feeds | SF17-196 |
| Mouse diet – P24 C38 F38 | Specialty Feeds | SF17-197 |
| Mouse diet - P20 C60 F20 – 30% starch 70% monosaccharide (100% Glucose +0% Fructose) | Specialty Feeds | SF18-111 |
| Mouse diet - P20 C60 F20 – 30% starch 70% monosaccharide (50% Glucose +50% Fructose) | Specialty Feeds | SF18-113 |
| Mouse diet - P20 C60 F20 – 30% starch 70% monosaccharide (0% Glucose +100% Fructose) | Specialty Feeds | SF18-115 |
Resource availability
Lead contact
Further information and requests for resources and reagents should be directed to and will be fulfilled by the lead contact, Laurence Macia (Laurence.macia@sydney.edu.au).
Materials availability
This study did not generate new unique reagents.
Data and code availability
All data reported in this paper will be shared by the lead contact upon request. This paper does not report original code; mixture model was generated based on the R package ‘mixexp’ which is publicly available: https://github.com/cran/mixexp. Any additional information required to reanalyze the data reported in this paper is available from the lead contact upon request.
Experimental model and subject details
Mice
6-week-old C57BL/6 male mice were purchased either from Australian BioResources or Animal Resources Center and were housed under specific-pathogen-free conditions at the Charles Perkins Centre and maintained in a temperature- and humidity-controlled environment. All animal experiments were approved by the University of Sydney Animal Ethics Committee (Protocol 1280, 1362 and 1527).
Diets
All diets were purchased from Specialty Feeds (Perth, Western Australia) and were formulated based on the normal rodent diet AIN-93G. For nutritional geometry analysis, 10 isocaloric diets (SF17-188 to SF17-197) encompassing a macronutrient range of 5-60% protein, 20-75% carbohydrate, and 20-75% fat were used (Table S1). For the study of the qualitative effects of carbohydrate, 3 diets with 20% protein, 60% carbohydrate and 20% fat were used (SF18-111, SF18-113 and SF18-115), with the carbohydrate component consisting of 30% starch and 70% monosaccharides with varying ratio of glucose and fructose (Table S2). All mice were maintained on experimental diets for at least 5 weeks, or as indicated in the Figure legends. Animals had ad-libitum access to water and food throughout the study.
KLH immunization
Mice were immunized subcutaneously with 50μg of keyhole limpet hemocyanin (KLH) antigen emulsified 1:1 in Complete Freund’s Adjuvant (CFA) and sacrificed 10 days post-immunization. Quantification of total plasma immunoglobulin G (IgG) was carried out using the Mouse IgG ELISA Quantitation Set following the manufacturer’s protocol. KLH-specific IgG was quantified as above, but 1μg/well KLH was used as capture instead.
In vivo glucose administration
To determine whether glucose can directly activate mTOR in B cells, mice were fasted for 4 hours prior to intraperitoneal administration of glucose at a final concentration of 2g/kg body weight. Animals were then culled 90min later for the determination of phospho-S6 by flow cytometry.
Methods details
Preparation of single-cell suspension from tissues
Single-cell suspension from spleen, mesenteric lymph nodes and Peyer’s patches were obtained by mechanical disruption and filtering through a 100μm cell strainer. Bone marrow leukocytes were obtained by flushing of the femur with ice-cold PBS and filtering through a 100μm cell strainer. RBC lysis was performed using 1X RBC lysis buffer. All samples were then resuspended in FACS buffer (2% FBS containing 1mM EDTA) before further processing.
Flow cytometry and data analyses
Single cell suspensions were prepared as described above and incubated with TruStain FcX anti-CD16/32 (93) for non-specific antibody blocking and LIVE/DEAD Fixable Blue Dead Cell Stain for dead cell exclusion. Cells were then stained with the pertinent fluorochrome-conjugated antibody cocktails as listed in the key resources table. For pS6 staining, the phosphor-S6 Ribosomal Protein (Ser240/244) (D68F8) Rabbit mAb (Cell Signaling) was used as primary, and anti-rabbit IgG AF488 (Poly4064) was used as secondary. The Annexin V assay was carried out with the Annexin A5 FITC/7-AAD Kit (Beckman Coulter), following the manufacturer’s protocol. Samples were acquired on an LSR II flow cytometer (Becton Dickinson, San Jose, CA) using the FACSDiva software. Data analysis was performed with FlowJo software (10.2).
Bone marrow leukocyte culture
Bone marrow leukocytes were isolated from mouse femur and seeded in 96-well plate at a concentration of 106 cells per well after red blood cell lysis. Cells were cultured in sugar-free complete DMEM media supplemented with 10% fetal bovine serum, 1 mM pyruvate, 2 mM L-glutamine, 10 mM HEPES buffer, 100 U/ml penicillin and 100 μg/ml streptomycin and 55 μM 2-Mercaptoethanol under various conditions as indicated in main manuscript and the Figure legends. For experiments studying the effects from sugar in culture, concentrations for glucose is 1 or 2 mM and 2 mM for fructose. For experiments probing different signaling pathways, glucose concentration was maintained at 2 mM, and inhibitor concentrations were selected, based on previous studies or manufacturer’s recommendations as follows: 2DG (0.5 mM), Oligomycin (1 μΜ), Rotenone (100 nM), Etomoxir (5 μM), TOFA (10 μg/ml), Rapamycin (10 nM), CHIR99021 (2.15 μM). For experiments investigating the effect of glucose towards mTOR activity, cells were first starved in PBS for 30 minutes to eliminate the basal level of ribosomal protein S6 phosphorylation, and then cultured in sugar-free complete DMEM media supplemented with 0 mM or 2 mM Glucose. Cultures were incubated in standard humidified conditions at 37 degree with 5% CO2 for 24 hours except for mTOR activity assay where 1-hour culture was performed.
Quantification and statistical analysis
Mixture modeling, bioinformatics, and statistical analysis
To analyze the effect of macronutrient compositions on outcome variables, multiple regression analyses, based on mixture models (Scheffé, 1958) (also known as Scheffé polynomials) were generated with the mixexp package (1.2.5) using R software (3.6.1). Four models, equivalent to the equations described by Lawson and Wilden (Lawson and Willden, 2016), and a null model, were fitted for each outcome variable. These models test for null, linear, quadratic and cubic interactive effects of macronutrient composition on outcome variables. The best model was selected based on Akaike information criterion (AIC), with the lowest AIC regarded as the most appropriate model (the simpler model was selected when AIC were within 2 points of difference of each other). A model with linear effects of macronutrients was favored for most outcome variables and was thus applied in this study and compared against the null model. It should be noted that this model is the same as the partition substation model widely used in nutritional epidemiological studies (Saner et al., 2020). For interpretation and visualization, predicted models were plotted as response surfaces onto a right-angled mixture triangle (RMT) (Raubenheimer, 2011).
For transcriptomics analyses, mouse and human microarray data were downloaded from Gene Expression Omnibus from previous studies (Hoffmann et al., 2002; Hystad et al., 2007). Data were analysed using Gene set enrichment analysis (GSEA) using the GSEA software (Subramanian et al., 2005) according to official protocols based on the Hallmark Gene with default settings.
The Mann-Whitney test or two-way ANOVA was applied for analysis of differences between means of groups from in vivo study, while a paired t-test was used for the analysis of results from in vitro experiments, using GraphPad Prism software (GraphPad Software, La Jolla, CA, USA). p values <0.05 were considered statistically significant.
Acknowledgments
We sincerely thank Kai Gao for discussion on bioinformatics analyses, the Sydney Cytometry Core Facility and the Laboratory Animal Services of the University of Sydney. Part of the components of figures were created using Servier Medical Art templates, which are licensed under a Creative Commons Attribution 3.0 Unported License; https://smart.servier.com. Funding: This project was funded by the Australian Research Council grant APP160100627. L.M and J.T are a’Beckett fellows. D.N. is a recipient of the Australian Government Research Training Program Scholarship (International).
Author contributions
J.T. and D.N. helped with the study design, did the experiments, and wrote the manuscript, J.A.W., D.A.C., G.V.P., J.T. participated to the experiments, C.I.D. gave some intellectual inputs, A.S. and M.R. helped with the bioinformatic analyses, S.J.S. helped with the study design, N.J.C.K. and L.M. designed the study and wrote the manuscript.
Declaration of interests
The authors declare no competing interests.
Published: August 20, 2021
Footnotes
Supplemental information can be found online at https://doi.org/10.1016/j.isci.2021.102835.
Contributor Information
Nicholas Jonathan Cole King, Email: nicholas.king@sydney.edu.au.
Laurence Macia, Email: laurence.macia@sydney.edu.au.
Supplementalinformation
References
- Adler B.J., Green D.E., Pagnotti G.M., Chan M.E., Rubin C.T. High fat diet rapidly suppresses B lymphopoiesis by disrupting the supportive capacity of the bone marrow niche. PLoS One. 2014;9:e90639. doi: 10.1371/journal.pone.0090639. [DOI] [PMC free article] [PubMed] [Google Scholar]
- Alda M. Lithium in the treatment of bipolar disorder: pharmacology and pharmacogenetics. Mol. Psychiatry. 2015;20:661–670. doi: 10.1038/mp.2015.4. [DOI] [PMC free article] [PubMed] [Google Scholar]
- Ang Q.Y., Alexander M., Newman J.C., Tian Y., Cai J., Upadhyay V., Turnbaugh J.A., Verdin E., Hall K.D., Leibel R.L. Ketogenic diets alter the gut microbiome resulting in decreased intestinal Th17 cells. Cell. 2020;181:1263–1275.e16. doi: 10.1016/j.cell.2020.04.027. [DOI] [PMC free article] [PubMed] [Google Scholar]
- Baracho G.V., Cato M.H., Zhu Z., Jaren O.R., Hobeika E., Reth M., Rickert R.C. PDK1 regulates B cell differentiation and homeostasis. Proc. Natl. Acad. Sci. U S A. 2014;111:9573–9578. doi: 10.1073/pnas.1314562111. [DOI] [PMC free article] [PubMed] [Google Scholar]
- Bock M., Karber M., Kuhn H. Ketogenic diets attenuate cyclooxygenase and lipoxygenase gene expression in multiple sclerosis. EBioMedicine. 2018;36:293–303. doi: 10.1016/j.ebiom.2018.08.057. [DOI] [PMC free article] [PubMed] [Google Scholar]
- Cariappa A., Chase C., Liu H., Russell P., Pillai S. Naive recirculating B cells mature simultaneously in the spleen and bone marrow. Blood. 2007;109:2339–2345. doi: 10.1182/blood-2006-05-021089. [DOI] [PubMed] [Google Scholar]
- Caro-Maldonado A., Wang R., Nichols A.G., Kuraoka M., Milasta S., Sun L.D., Gavin A.L., Abel E.D., Kelsoe G., Green D.R. Metabolic reprogramming is required for antibody production that is suppressed in anergic but exaggerated in chronically BAFF-exposed B cells. J. Immunol. 2014;192:3626–3636. doi: 10.4049/jimmunol.1302062. [DOI] [PMC free article] [PubMed] [Google Scholar]
- Chang G.-R., Chiu Y.-S., Wu Y.-Y., Chen W.-Y., Liao J.-W., Chao T.-H., Mao F.C. Rapamycin protects against high fat diet-induced obesity in C57BL/6J mice. J. Pharmacol. Sci. 2009;109:496–503. doi: 10.1254/jphs.08215fp. [DOI] [PubMed] [Google Scholar]
- Clarke A.J., Riffelmacher T., Braas D., Cornall R.J., Simon A.K. B1a B cells require autophagy for metabolic homeostasis and self-renewal. J. Exp. Med. 2018;215:399–413. doi: 10.1084/jem.20170771. [DOI] [PMC free article] [PubMed] [Google Scholar]
- Corfe S.A., Paige C.J. The many roles of IL-7 in B cell development; mediator of survival, proliferation and differentiation. Semin.Immunol. 2012;24:198–208. doi: 10.1016/j.smim.2012.02.001. [DOI] [PubMed] [Google Scholar]
- Daïen C.I., Tan J., Audo R., Mielle J., Quek L.E., Krycer J.R., Angelatos A., Duraes M., Pinget G., Ni D. Gut-derived acetate promotes B10 cells with antiinflammatory effects. JCI Insight. 2021;6:e144156. doi: 10.1172/jci.insight.144156. [DOI] [PMC free article] [PubMed] [Google Scholar]
- Dufort F.J., Gumina M.R., Ta N.L., Tao Y., Heyse S.A., Scott D.A., Richardson A.D., Seyfried T.N., Chiles T.C. Glucose-dependent de Novo lipogenesis in B lymphocytes. J. Biol. Chem. 2014;289:7011–7024. doi: 10.1074/jbc.M114.551051. [DOI] [PMC free article] [PubMed] [Google Scholar]
- Farmer J.R., Allard-Chamard H., Sun N., Ahmad M., Bertocchi A., Mahajan V.S., Aicher T., Arnold J., Benson M.D., Morningstar J. Induction of metabolic quiescence defines the transitional to follicular B cell switch. Sci.Signal. 2019;12:eaaw5573. doi: 10.1126/scisignal.aaw5573. [DOI] [PMC free article] [PubMed] [Google Scholar]
- Hoffmann R., Seidl T., Neeb M., Rolink A., Melchers F. Changes in gene expression profiles in developing B cells of murine bone marrow. Genome Res. 2002;12:98–111. doi: 10.1101/gr.201501. [DOI] [PMC free article] [PubMed] [Google Scholar]
- Hua H., Kong Q., Zhang H., Wang J., Luo T., Jiang Y. Targeting mTOR for cancer therapy. J. Hematol.Oncol. 2019;12:71. doi: 10.1186/s13045-019-0754-1. [DOI] [PMC free article] [PubMed] [Google Scholar]
- Huang J., Zhang Y., Bersenev A., O’Brien W.T., Tong W., Emerson S.G., Klein P.S. Pivotal role for glycogen synthase kinase-3 in hematopoietic stem cell homeostasis in mice. J. Clin. Invest. 2009;119:3519–3529. doi: 10.1172/JCI40572. [DOI] [PMC free article] [PubMed] [Google Scholar]
- Hystad M.E., Myklebust J.H., Bø T.H., Sivertsen E.A., Rian E., Forfang L., Munthe E., Rosenwald A., Chiorazzi M., Jonassen I. Characterization of early stages of human B cell development by gene expression profiling. J. Immunol. 2007;179:3662–3671. doi: 10.4049/jimmunol.179.6.3662. [DOI] [PubMed] [Google Scholar]
- Jaiswal N., Agrawal S., Agrawal A. High fructose-induced metabolic changes enhance inflammation in human dendritic cells. Clin. Exp. Immunol. 2019;197:237–249. doi: 10.1111/cei.13299. [DOI] [PMC free article] [PubMed] [Google Scholar]
- Jellusova J., Cato M.H., Apgar J.R., Ramezani-Rad P., Leung C.R., Chen C., Richardson A.D., Conner E.M., Benschop R.J., Woodgett J.R. Gsk3 is a metabolic checkpoint regulator in B cells. Nat. Immunol. 2017;18:303–312. doi: 10.1038/ni.3664. [DOI] [PMC free article] [PubMed] [Google Scholar]
- Kojima H., Kobayashi A., Sakurai D., Kanno Y., Hase H., Takahashi R., Totsuka Y., Semenza G.L., Sitkovsky M.V., Kobata T. Differentiation stage-specific requirement in hypoxia-inducible factor-1alpha-regulated glycolytic pathway during murine B cell development in bone marrow. J. Immunol. 2010;184:154–163. doi: 10.4049/jimmunol.0800167. [DOI] [PMC free article] [PubMed] [Google Scholar]
- Kosaraju R., Guesdon W., Crouch M.J., Teague H.L., Sullivan E.M., Karlsson E.A., Schultz-Cherry S., Gowdy K., Bridges L.C., Reese L.R. B cell activity is impaired in human and mouse obesity and is responsive to an essential fatty acid upon murine influenza infection. J. Immunol. 2017;198:4738–4752. doi: 10.4049/jimmunol.1601031. [DOI] [PMC free article] [PubMed] [Google Scholar]
- Lam W.Y., Becker A.M., Kennerly K.M., Wong R., Curtis J.D., Llufrio E.M., McCommis K.S., Fahrmann J., Pizzato H.A., Nunley R.M. Mitochondrial pyruvate import promotes long-term survival of antibody-secreting plasma cells. Immunity. 2016;45:60–73. doi: 10.1016/j.immuni.2016.06.011. [DOI] [PMC free article] [PubMed] [Google Scholar]
- Lawson J., Willden C. Mixture experiments in R using mixexp. J. Stat. Softw. 2016;72:1–20. [Google Scholar]
- McDaniel S.S., Rensing N.R., Thio L.L., Yamada K.A., Wong M. The ketogenic diet inhibits the mammalian target of rapamycin (mTOR) pathway. Epilepsia. 2011;52:e7–e11. doi: 10.1111/j.1528-1167.2011.02981.x. [DOI] [PMC free article] [PubMed] [Google Scholar]
- Nagasawa T. Microenvironmental niches in the bone marrow required for B-cell development. Nat. Rev. Immunol. 2006;6:107–116. doi: 10.1038/nri1780. [DOI] [PubMed] [Google Scholar]
- Nguyen V., Mendelsohn A., Larrick J.W. Interleukin-7 and immunosenescence. J. Immunol.Res. 2017;2017:4807853. doi: 10.1155/2017/4807853. [DOI] [PMC free article] [PubMed] [Google Scholar]
- O’Neill L.A.J., Kishton R.J., Rathmell J. A guide to immunometabolism for immunologists. Nat. Rev. Immunol. 2016;16:553–565. doi: 10.1038/nri.2016.70. [DOI] [PMC free article] [PubMed] [Google Scholar]
- Raubenheimer D. Toward a quantitative nutritional ecology: the right-angled mixture triangle. Ecol. Monogr. 2011;81:407–427. [Google Scholar]
- Ruvinsky I., Meyuhas O. Ribosomal protein S6 phosphorylation: from protein synthesis to cell size. Trends Biochem. Sci. 2006;31:342–348. doi: 10.1016/j.tibs.2006.04.003. [DOI] [PubMed] [Google Scholar]
- Saner C., Tassoni D., Harcourt B.E., Kao K.-T., Alexander E.J., McCallum Z., Olds T., Rowlands A.V., Burgner D.P., Simpson S.J. Evidence for protein leverage in children and adolescents with obesity. Obesity (Silver Spring) 2020;28:822–829. doi: 10.1002/oby.22755. [DOI] [PubMed] [Google Scholar]
- Scheffé H. Experiments with mixtures. J.R. Stat. Soc. B Methodol. 1958;20:344–360. [Google Scholar]
- Shi L.Z., Wang R., Huang G., Vogel P., Neale G., Green D.R., Chi H. HIF1alpha-dependent glycolytic pathway orchestrates a metabolic checkpoint for the differentiation of TH17 and Treg cells. J. Exp. Med. 2011;208:1367–1376. doi: 10.1084/jem.20110278. [DOI] [PMC free article] [PubMed] [Google Scholar]
- Shushimita S., de Bruijn M.J.W., de Bruin R.W.F., IJzermans J.N.M., Hendriks R.W., Dor F.J.M.F. Dietary restriction and fasting arrest B and T cell development and increase mature B and T cell numbers in bone marrow. PLoS One. 2014;9:e87772. doi: 10.1371/journal.pone.0087772. [DOI] [PMC free article] [PubMed] [Google Scholar]
- Solon-Biet S.M., McMahon A.C., Ballard J.W.O., Ruohonen K., Wu L.E., Cogger V.C., Warren A., Huang X., Pichaud N., Melvin R.G. The ratio of macronutrients, not caloric intake, dictates cardiometabolic health, aging, and longevity in ad libitum-fed mice. Cell Metab. 2014;19:418–430. doi: 10.1016/j.cmet.2014.02.009. [DOI] [PMC free article] [PubMed] [Google Scholar]
- Stein M., Dütting S., Mougiakakos D., Bösl M., Fritsch K., Reimer D., Urbanczyk S., Steinmetz T., Schuh W., Bozec A. A defined metabolic state in pre B cells governs B-cell development and is counterbalanced by Swiprosin-2/EFhd1. Cell Death Differ. 2017;24:1239–1252. doi: 10.1038/cdd.2017.52. [DOI] [PMC free article] [PubMed] [Google Scholar]
- Subramanian A., Tamayo P., Mootha V.K., Mukherjee S., Ebert B.L., Gillette M.A., Paulovich A., Pomeroy S.L., Golub T.R., Lander E.S. Gene set enrichment analysis: a knowledge-based approach for interpreting genome-wide expression profiles. Proc. Natl. Acad. Sci. U S A. 2005;102:15545–15550. doi: 10.1073/pnas.0506580102. [DOI] [PMC free article] [PubMed] [Google Scholar]
- Tan J., Ni D., Ribeiro R.V., Pinget G.V., Macia L. How changes in the nutritional landscape shape gut immunometabolism. Nutrients. 2021;13:823. doi: 10.3390/nu13030823. [DOI] [PMC free article] [PubMed] [Google Scholar]
- Trottier M.D., Naaz A., Li Y., Fraker P.J. Enhancement of hematopoiesis and lymphopoiesis in diet-induced obese mice. Proc. Natl. Acad. Sci. U S A. 2012;109:7622–7629. doi: 10.1073/pnas.1205129109. [DOI] [PMC free article] [PubMed] [Google Scholar]
- Urbanczyk S., Stein M., Schuh W., Jäck H.-M., Mougiakakos D., Mielenz D. Regulation of energy metabolism during early B lymphocyte development. Int. J. Mol. Sci. 2018;19:2192. doi: 10.3390/ijms19082192. [DOI] [PMC free article] [PubMed] [Google Scholar]
- Weisel F.J., Mullett S.J., Elsner R.A., Menk A.V., Trivedi N., Luo W., Wikenheiser D., Hawse W.F., Chikina M., Smita S. Germinal center B cells selectively oxidize fatty acids for energy while conducting minimal glycolysis. Nat. Immunol. 2020;21:331–342. doi: 10.1038/s41590-020-0598-4. [DOI] [PMC free article] [PubMed] [Google Scholar]
- Wilson R., Fraser W.D., McKillop J.H., Smith J., O’Reilly D.S., Thomson J.A. The “in vitro” effects of lithium on the immune system. Autoimmunity. 1989;4:109–114. doi: 10.3109/08916938909034365. [DOI] [PubMed] [Google Scholar]
- Yu M., Chen Y., Zeng H., Zheng Y., Fu G., Zhu W., Broeckel U., Aggarwal P., Turner A., Neale G. PLCγ-dependent mTOR signalling controls IL-7-mediated early B cell development. Nat. Commun. 2017;8:1457. doi: 10.1038/s41467-017-01388-5. [DOI] [PMC free article] [PubMed] [Google Scholar]
Associated Data
This section collects any data citations, data availability statements, or supplementary materials included in this article.
Supplementary Materials
Data Availability Statement
All data reported in this paper will be shared by the lead contact upon request. This paper does not report original code; mixture model was generated based on the R package ‘mixexp’ which is publicly available: https://github.com/cran/mixexp. Any additional information required to reanalyze the data reported in this paper is available from the lead contact upon request.