

Summary
Single-cell RNA sequencing (scRNA-seq) has become a revolutionary technology to characterize cells under different biological conditions. Unlike bulk RNA-seq, gene expression from scRNA-seq is highly sparse due to limited sequencing depth per cell. This is worsened by tossing away a significant portion of reads that attribute to gene quantification. To overcome data sparsity and fully utilize original reads, we propose scSimClassify, a reference-free and alignment-free approach to classify cell types with k-mer level features. The compressed k-mer groups (CKGs), identified by the simhash method, contain k-mers with similar abundance profiles and serve as the cells’ features. Our experiments demonstrate that CKG features lend themselves to better performance than gene expression features in scRNA-seq classification accuracy in the majority of experimental cases. Because CKGs are derived from raw reads without alignment to reference genome, scSimClassify offers an effective alternative to existing methods especially when reference genome is incomplete or insufficient to represent subject genomes.
Subject areas: bioinformatics, transcriptomics, algorithms
Graphical abstract
Highlights
-
•
Compressed k-mer groups (CKGs) are used to classify cell types without references
-
•
CKGs are competitive to gene expression features for cell type classification
-
•
CKGs are associated with genes sharing gene specific k-mers
Bioinformatics; Transcriptomics; Algorithms
Introduction
Cataloging cells is crucial for understanding the organization of cells, disease mechanisms, and even treatment respondences. Single-cell RNA sequencing (scRNA-seq) makes it possible to identify cell subpopulations by exploring the unique transcriptomic profile of each cell. Clustering is the most popularly used approach to partition cells based on transcriptome similarity in an unsupervised fashion (Andrews and Hemberg, 2018). However, this requires well-established knowledge of biomarkers for cell type annotation, as well as cell populations. Unfortunately, such information is often unavailable prior to the scRNA-seq experiments (Kiselev et al., 2019). Therefore, researchers turn to other machine learning approaches, such as supervised classification, to annotate cells automatically (Abdelaal et al., 2019).
Recently, Abdelaal et al. (Abdelaal et al., 2019) benchmarked 22 classification methods for scRNA-seq cell type identification. All of these classification approaches utilized gene expression profiles of individual cells as classification features. The study included many conventional classifiers such as support vector machine (SVM) and random forest (RF) in addition to a few recently developed single cell-specific classifiers including ACTINN (Ma and Pellegrini, 2020) and scPred (Alquicira-Hernandez et al., 2019). The study demonstrated the efficacy of the gene profile-based approach in cell type identification. In a different study, Arvind Iyer et al. (Iyer et al., 2020) classified cell types by naive Bayes, gradient boosting machine, and RF fitted with gene expression profiles to recognize circulating tumor cells of diverse phenotypes.
However, scRNA-seq data are notorious for its relatively low sequencing depth resulting in highly sparse gene expression across all cells (Yuan et al., 2017). To make things worse, read alignment to the reference genome often filters out many unmapped reads. It is not uncommon that about half of the reads are thrown out prior to the final analysis (Vieth et al., 2019). Note that not all unmapped reads are bad reads. Using standard reference genomes may eliminate reads representing significant variations in a particular subject, cell type, or disease genome. Last but not least, aligning read to the reference genome to derive a gene-cell count matrix is typically the most time-consuming step of the process.
To overcome these limitations, we develop a reference-free approach for cell type classification sidestepping read mapping step (Zielezinski et al., 2019; Shi and Yip, 2019). Specifically, it explores novel features derived from the entirety of the reads. Instead of using gene expression features derived from scRNA-seq reads, we use k-mers, often referred to as the genomic words, as features for classification. Intuitively, these genomic words can be extracted from reads in a scRNA-seq sample. Each of these “words” is associated with its own “frequency” or abundance, which is defined as the number of times that a k-mer appears in a sample. The change of gene/transcript expression will correspondingly affect the abundances of k-mers identifying them. Thus k-mers and their abundances can be used as features for classification due to their strong association with the expression of genes/transcripts. The advantage here is that k-mers can be easily derived from reads without alignment to references. In the meantime, the derived k-mer set also captures cell and subject-specific variations that do not fit standard reference genomes.
The challenge associated with k-mer based features is the huge set of unique k-mers, which can be in hundreds of millions depending on sequencing depth. However, a large set of features in the size of hundreds of millions is not a blessing for classification to achieve better accuracy and scalability. We observe that many k-mers may be expressed very similarly even across samples, such as a group of k-mers unique to the same gene/transcript. These k-mers are redundant to each other to represent the true k-mer feature space. Clustering is one of the popular unsupervised approaches to group similar objects (Jiang et al., 2004). Unfortunately, they are not feasible to group abundance profiles of k-mers due to the unknown number of clusters as well as high computational cost when dealing with a large number of k-mers directly. Various approaches have been developed in the past in the field of metagenomics classification to reduce the set of k-mer features, but they are restricted to applications with only case and control experiments. In this case, k-mers that can significantly differentiate case and control were selected for further classification (LaPierre et al., 2019; Wang et al., 2018). Unfortunately, such an approach cannot be easily applied as k-mer abundances in scRNA-seq cannot be set up as a two-group comparison. Often times, cell type classification is a multi-class classification problem with half a dozen or more cell types in a single experiment.
In this paper, we propose scSimClassify, a reference-free approach for cell type classification. The scSimClassify reduces the original k-mer feature space by partitioning it into subsets of k-mers with similar abundance profiles across a variety of cell types via an unsupervised approach. This is achieved by repurposing simhash (Charikar, 2002), an extremely fast and effective algorithm that can automatically detect similar items within a large set. We evaluate the performance of scSimClassify on scRNA-seq datasets generated from breast cancer tissues with tumor and immune cell populations, as well as blood samples for studying peripheral blood mononuclear cells (PBMCs) in COVID-19 and influenza patients. Our experiments demonstrate that scSimClassify can accurately identify cell types with the aggregated k-mer profiles (CKG features). We also find that the top-ranked CKG features are biologically meaningful in consistency with gene expression features. To the best of our knowledge, scSimClassify is the first reference-free method for multi-class cell type classification based on k-mer level information. Besides improving general classification accuracy, our approach also makes it possible to classify cell types with incomplete or even unknown references.
Results
Overview of our reference-free approach scSimClassify
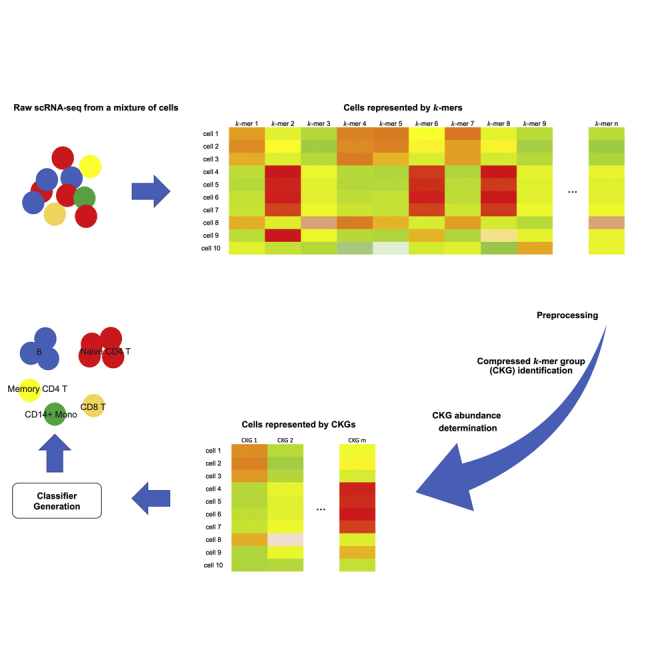
Figure 1 describes an overview of scSimClassify training steps for cell type classification. scSimClassify takes the real-value k-mer abundance matrix as the input. The matrix is assembled from cells sequenced by scRNA-seq and is preprocessed to filter out unreliable information. Here, we define k-mers sharing similar abundance profiles across cells in a training set as similar k-mers. To reduce the size of the input, simhash-based group generator (simGG) is implemented in three steps: (1) generate k-mers’ n-bit fingerprints, (2) group similar k-mers into a CKG based on k-mers’ fingerprints, and (3) determine CKG abundance matrix. Finally, scSimClassify uses the CKG abundance matrix for cell type classification. A more detailed description of our reference-free approach is provided in STAR Methods.
Figure 1.

An overview of scSimClassify training steps for cell type classification
(A) The k-mers and their abundances in individual cells are obtained as the original input. Preprocessing is applied to the original k-mer abundance matrix to filter out noises and systematic variations. Then, informative k-mers are selected based on their abundance variability.
(B1) In the first step of simGG, k-mer abundance vectors are converted to n-bit fingerprints through simhash (taking as an example).
(B2) In the second step of simGG, compressed k-mer groups (CKGs) are identified based on k-mers’ fingerprints. Each CKG contains a set of k-mers sharing the same fingerprint.
(B3) In the third step of simGG, the abundance of a CKG in a cell is determined by averaging abundances of k-mers following the removal of abundance outliers in the same group.
(C) Finally, a classifier is trained with the cells represented by CKG features. In this figure, colors of abundance matrices indicate the values of abundances.
Experimental configuration
The goal of our experiment was to evaluate scSimClassify for cell type classification using scRNA-seq data. Two datasets of similar cell types in breast cancer tissues and two datasets of PBMCs (Table S1) were used for evaluation.
Here, we compared the performance of CKG features and commonly used gene expression features (referred as GE in the following) in the application of cell type classification. We conducted thorough comparisons among numerous general purpose classifiers (RF, GBM, MLP and SVM) between the two types of features. Benchmarking gene expression based classification methods to automatically assign cell identities, Abdelaal et al. (Abdelaal et al., 2019) concluded that ACTINN (Ma and Pellegrini, 2020) and scPred (Alquicira-Hernandez et al., 2019) performed well on most datasets as single cell-specific classifiers. Thus they are also included for comparison.
Several variations of CKG features with different combinations of k-mer length, k and simhash fingerprint size, n were explored in this study. The k-mer length is either 16 or 21 (Dieffenbach et al., 1993), while fingerprint bit size for simhash can be either 16-bit or 32-bit. To investigate whether the reference genome is essential for the cell type classification, we generated two categories of k-mers as inputs, as listed in Table 1. The first category (on the left in Table 1) was generated without reference-based selection, containing k-mers derived from all the reads in scRNA-seq data; the second (on the right in Table 1) contained only k-mers derived from reads that can be mapped to the reference genome.
Table 1.
The nomenclature (id) of CKG feature variations with different combination of parameter values
| id | k | n | read type | id | k | n | read type |
|---|---|---|---|---|---|---|---|
| allk21n16 | 21 | 16 | all | mappedk21n16 | 21 | 16 | mapped |
| allk21n32 | 21 | 32 | all | mappedk21n32 | 21 | 32 | mapped |
| allk16n16 | 16 | 16 | all | mappedk16n16 | 16 | 16 | mapped |
| allk16n32 | 16 | 32 | all | mappedk16n32 | 16 | 32 | mapped |
The variations on the left are reference-free and take all k-mers to generate CKG features. The variations on the right only take k-mers that can be mapped to the reference genome to generate CKG features.
To evaluate the performance of multi-class classification on imbalanced data, we calculated accuracy, F1 score by the module in the scikit-learn library. Each class provided a weighted contribution to F1 score (Pedregosa et al., 2011).
Performance evaluation of intra-dataset cell type classification
In this experiment, we evaluated the scSimClassify's performance by training and testing subsets of cells included in the same scRNA-seq data. We named this an intra-dataset evaluation. The comparisons were made by reporting results from the following groups: (a) scSimClassify with general purpose classifier MLP, RF, GBM, and SVM. The features were GE, and 8 variations of CKGs (Table 1). (b) ACTINN, scPred with GE feature set. The stratified 5-fold cross-validation was used to select the best hyperparameter combination for each classifier and feature set in scSimClassify. For all pipelines, five independent repetitions of 5-fold cross-validation were performed to determine the classification results.
Comparison between GE and CKG features
We used two datasets, the Chuang's dataset (Chung et al., 2017), as well as PBMC3k data set (10x Genomics, 2016), to compare the performance of GE and CKE features in their ability for cell type identification. As reported in Table 2, the overall winner for Chuang's dataset is CKG feature classified by MLP, and CKG feature classified by SVM wins the best classification performance on PBMC3k data set. All the general purpose classifiers in scSimClassify outperform scRNA-seq specific classifier ACTINN and scPred trained with gene expression features. For each general classification model, using CKG features quite consistently improves the overall classification accuracy over GE features. This supports our hypothesis that k-mer level features without gene annotation are sufficient for cell classification.
Table 2.
Performance evaluation of intra-dataset cell type classification
| (A) Chuang's dataset | ||||
|---|---|---|---|---|
| Feature set | Accuracy | F1 | # Features | |
| MLP | GE | 0.938±0.017 | 0.936±0.018 | 11353±42 |
| allkn16 | 0.941±0.023 | 0.939±0.026 | 5323±488 | |
| allk21n32 | 0.94±0.025 | 0.938±0.027 | 12939±204 | |
| allk16n16 | 0.942±0.023 | 0.939±0.026 | 6213±564 | |
| allk16n32 | 0.942±0.025 | 0.94±0.026 | 14191±218 | |
| mappedk21n16 | 0.935±0.023 | 0.933±0.026 | 5248±542 | |
| mappedk21n32 | 0.935±0.025 | 0.933±0.027 | 12334±472 | |
| mappedk16n16 | 0.932±0.023 | 0.929±0.025 | 6117±544 | |
| mappedk16n32 | 0.934±0.022 | 0.932±0.024 | 13443±222 | |
| RF | GE | 0.916±0.022 | 0.906±0.027 | 11353±42 |
| allk21n16 | 0.916±0.024 | 0.906±0.028 | 5323±488 | |
| allk21n32 | 0.926±0.021 | 0.92±0.025 | 12939±204 | |
| allk16n16 | 0.895±0.029 | 0.881±0.035 | 6213±564 | |
| allk16n32 | 0.921±0.021 | 0.914±0.025 | 14191±218 | |
| mappedk21n16 | 0.915±0.026 | 0.906±0.031 | 5248±542 | |
| mappedk21n32 | 0.931±0.016 | 0.926±0.02 | 12334±472 | |
| mappedk16n16 | 0.892±0.025 | 0.877±0.031 | 6117±544 | |
| mappedk16n32 | 0.914±0.024 | 0.905±0.028 | 13443±222 | |
| GBM | GE | 0.925±0.019 | 0.92±0.022 | 11353±42 |
| allk21n16 | 0.911±0.025 | 0.906±0.026 | 5323±488 | |
| allk21n32 | 0.923±0.02 | 0.917±0.023 | 12939±204 | |
| allk16n16 | 0.915±0.022 | 0.91±0.026 | 6213±564 | |
| allk16n32 | 0.922±0.025 | 0.918±0.028 | 14191±218 | |
| mappedk21n16 | 0.92±0.023 | 0.914±0.027 | 5248±542 | |
| mappedk21n32 | 0.928±0.017 | 0.923±0.02 | 12334±472 | |
| mappedk16n16 | 0.918±0.021 | 0.912±0.024 | 6117±544 | |
| mappedk16n32 | 0.918±0.02 | 0.912±0.023 | 13443±222 | |
| SVM | GE | 0.94±0.017 | 0.938±0.018 | 11353±42 |
| allk21n16 | 0.94±0.025 | 0.937±0.029 | 5323±488 | |
| allk21n32 | 0.931±0.02 | 0.928±0.022 | 12939±204 | |
| allk16n16 | 0.938±0.025 | 0.934±0.028 | 6213±564 | |
| allk16n32 | 0.936±0.023 | 0.933±0.025 | 14191±218 | |
| mappedk21n16 | 0.936±0.024 | 0.934±0.027 | 5248±542 | |
| mappedk21n32 | 0.93±0.021 | 0.927±0.024 | 12334±472 | |
| mappedk16n16 | 0.937±0.022 | 0.933±0.025 | 6117±544 | |
| mappedk16n32 | 0.934±0.023 | 0.931±0.026 | 13443±222 | |
| ACTINN | GE | 0.906±0.024 | 0.9±0.026 | 24613±228 |
| scPred | GE | 0.896±0.025 | 0.919±0.024 | 38913 |
| (B) PBMC3k dataset | ||||
|---|---|---|---|---|
| Feature Set | Accuracy | F1 | # Features | |
| MLP | GE | 0.87±0.014 | 0.866±0.015 | 16115±18 |
| allk21n16 | 0.893±0.015 | 0.892±0.016 | 6691±364 | |
| allk21n32 | 0.892±0.014 | 0.892±0.014 | 8191±101 | |
| allk16n16 | 0.893±0.012 | 0.893±0.012 | 6299±353 | |
| allk16n32 | 0.891±0.013 | 0.891±0.013 | 7959±104 | |
| mappedk21n16 | 0.894±0.013 | 0.894±0.013 | 6645±372 | |
| mappedk21n32 | 0.89±0.013 | 0.89±0.013 | 8187±109 | |
| mappedk16n16 | 0.894±0.013 | 0.894±0.013 | 6275±352 | |
| mappedk16n32 | 0.893±0.012 | 0.892±0.012 | 7938±117 | |
| RF | GE | 0.856±0.016 | 0.856±0.016 | 16115±18 |
| allk21n16 | 0.879±0.01 | 0.876±0.01 | 6691±364 | |
| allk21n32 | 0.891±0.013 | 0.889±0.014 | 8191±101 | |
| allk16n16 | 0.881±0.012 | 0.877±0.013 | 6299±353 | |
| allk16n32 | 0.888±0.012 | 0.886±0.012 | 7959±104 | |
| mappedk21n16 | 0.883±0.013 | 0.879±0.014 | 6645±372 | |
| mappedk21n32 | 0.887±0.013 | 0.885±0.014 | 8187±109 | |
| mappedk16n16 | 0.884±0.011 | 0.881±0.012 | 6275±352 | |
| mappedk16n32 | 0.888±0.014 | 0.886±0.014 | 7938±117 | |
| GBM | GE | 0.879±0.01 | 0.874±0.011 | 16115±18 |
| allk21n16 | 0.887±0.012 | 0.885±0.012 | 6691±364 | |
| allk21n32 | 0.893±0.013 | 0.892±0.014 | 8191±101 | |
| allk16n16 | 0.887±0.011 | 0.884±0.011 | 6299±353 | |
| allk16n32 | 0.891±0.014 | 0.889±0.014 | 7959±104 | |
| mappedk21n16 | 0.889±0.013 | 0.887±0.014 | 6645±372 | |
| mappedk21n32 | 0.891±0.014 | 0.889±0.015 | 8187±109 | |
| mappedk16n16 | 0.889±0.013 | 0.888±0.013 | 6275±352 | |
| mappedk16n32 | 0.895±0.015 | 0.893±0.015 | 7938±117 | |
| SVM | GE | 0.888±0.014 | 0.885±0.014 | 16115±18 |
| allk21n16 | 0.895±0.014 | 0.894±0.014 | 6691±364 | |
| allk21n32 | 0.905±0.014 | 0.904±0.014 | 8191±101 | |
| allk16n16 | 0.894±0.013 | 0.894±0.014 | 6299±353 | |
| allk16n32 | 0.905±0.013 | 0.904±0.014 | 7959±104 | |
| mappedk21n16 | 0.894±0.015 | 0.894±0.015 | 6645±372 | |
| mappedk21n32 | 0.905±0.014 | 0.905±0.014 | 8187±109 | |
| mappedk16n16 | 0.897±0.013 | 0.896±0.013 | 6275±352 | |
| mappedk16n32 | 0.905±0.016 | 0.904±0.016 | 7938±117 | |
| ACTINN | GE | 0.856±0.014 | 0.856±0.015 | 12477±28 |
| scPred | GE | 0.87±0.018 | 0.89±0.017 | 32738 |
Comparison of intra-dataset cell type classification performance among scSimClassify using GE features and 8 variations of CKG features (listed in Table 1), as well as ACTINN and scPred with GE features. The mean and standard deviation are recorded for different evaluation metrics after five repetitions of 5-fold cross-validation. The best performances in each classifier are highlighted in bold.
Performance of variations of CKG features
In this experiment, we also conducted thorough comparisons of the 8 variations of CKG features to understand the effect of parameters n, k, and read types on the CKG performance.
CKG feature variations with different values of k
By fixing the size of fingerprints, classifiers, and read types, 21-mer CKG feature variations represent the same or better performance comparing with 16-mer CKG feature variations in 10 cases of 16 comparisons on both datasets. For example, the performance of allk21n16 is 2.1% better than allk16n16 for RF in accuracy in Chuang's dataset. It indicates that more unique k-mers lead to a finer resolution in representing gene diversity. This can ultimately result in better classification performance.
CKG feature variations with different values of n
While we fixed k-mer length, classifiers, and read types, the performances of CKG feature variations grouped by 32-bit fingerprints are better than 16-bit fingerprints in around two-thirds of 16 comparisons on both datasets. Theoretically, using the 32-bit fingerprints will generate more random hyperplanes to separate the original k-mer space, thus creating a more precise categorization of k-mer groups than 16-bit fingerprints. It eventually leads to more descriptive CKG features and better classification performances.
CKG feature variations with different read types
CKGs derived from k-mers of all reads outperform those from mapped reads in three-quarters of comparisons on Chuang's dataset and half of the comparisons on PBMC3k dataset. This suggests our reference-free approach is able to capture cell type relevant features for classification without preselecting k-mers from mapped reads. The k-mers from unmapped reads may contribute to the additional performance gain of our reference-free approach. Based on the performance comparison of variations of CKG features, we selected allk21n32 as CKG feature set in the following experiments.
Performance of highly variable features
Inferring highly variable features is a common step in current bioinformatics analysis (Brennecke et al., 2013). To evaluate the necessity of highly variable features in this study, we selected the top 2000 variable features with default settings of Seurat VST (Butler et al., 2018) for both GE and CKG (allk21n32) feature sets. Classification performance on intra-datasets with highly variable features is shown in the Table S2. Comparing classification performance based on highly variable features and all features (Table 2, Table S2), there is no clear winner for cell type classification from both datasets and both feature sets. The comparison results are classifier-dependent and dataset-dependent. Moreover, inferring a subset of features may exclude discriminant sources of variation across cells (Alquicira-Hernandez et al., 2019) and introduce feature selection parameters. Therefore we used all the features to classify cell types in this study.
Table 4.
The list of common genes of CKG’s gene annotation and GE
| (A) Chuang’s dataset | ||||||||||
|---|---|---|---|---|---|---|---|---|---|---|
| GBM | ABRACL | AGR3 | CASC3 | CD3D | CD3G | CD53 | CHI3L1 | COX6 | CTTN | CWC25 |
| ERBB2 | ESR1 | FABP7 | HLA-DRA | HSPB8 | LRMP | MIEN1 | MRPL45 | MSL1 | MT-ND2 | |
| NDUFC2 | NF1 | PI15 | PLEKHA5 | PPP1CB | PPP1R14C | PPP1R1B | PSMB3 | RAB3D | RGS13 | |
| RPL23 | S100A11 | SLC30A8 | TCEAL1 | TRBC2 | ||||||
| RF | CASC3 | CD3D | CTTN | ERBB2 | ESR1 | FXYD3 | HLA-DRA | KRT19 | MIEN1 | MRPL45 |
| MS4A | MSL1 | ORMDL3 | PI15 | PLEKHA5 | PPP1R14C | PPP1R1B | PSMB3 | RPL23 | SOX11 | |
| (B) PBMC3k dataset | |||||||||||
|---|---|---|---|---|---|---|---|---|---|---|---|
| GBM | AIF1 | CCL5 | CD14 | CD3D | CD74 | CD79A | CD79B | CFD | COTL1 | CST3 | CST7 |
| FCER1G | FCN1 | FTH1 | FTL | GABARAP | GNLY | GPX1 | GZMA | HLA-DRA | LGALS | LGALS2 | |
| LST1 | LYZ | NKG7 | RPS14 | RPS6 | S100A4 | S100A8 | S100A9 | TCL1A | TYMP | TYROBP | |
| RF | AIF1 | B2M | CD74 | FCGR3A | FTL | HLA-DRA | LYZ | NKG7 | S100A9 | TYROBP | |
Common genes identified as the top 10 most important genes selected from GE features and associated with the top 10 most important CKG features (allk21n32) in intra-dataset experiments under RF and GBM. The overlaps of common genes between RF and GBM are highlighted in bold.
Performance evaluation of inter-dataset cell type classification
In this experiment, we evaluated if scSimClassify trained with one scRNA-seq dataset may be applied to classify cell types in the other, which we referred to as inter-dataset classification.
We conducted two sets of inter-dataset experiments to predict shared cell types. In one experiment, Chuang's dataset was used as the training data and the trained model was applied to predict the cell types in Karaayvazr's dataset (Karaayvaz et al., 2018). These two data sets consist of cells from breast cancer tissues. In the other experiment, cell types of three PBMC sets, which were cells from a COVID-19 patient, a FLU patient, and a healthy donor in Lee's dataset (Lee et al., 2020), were identified based on the model trained on PBMC3k dataset. To obtain optimal hyperparameters for the target distribution, we randomly chose 20% and 80% of cells in the targeting sets for validation and testing, respectively. The validation set was used to grid search optimal hyperparameter combination (Feurer and Hutter, 2019). The GE and well-performing CKG feature set, allk21n32, suggested by intra-dataset, were used for inter-dataset classification.
Table 3 represents the performance of inter-dataset classification between Chuang's dataset and Karaayvazr's dataset with averaged results over 5 repetitions. Overall, SVM using CKGs (allk21n32) shows the highest accuracy for detecting cell types, followed by GBM and ACTINN with GE features. Again the CKG features show competitive performance to GE features in almost all metrics. For MLP, RF, and GBM, the CKG feature set (allk21n32) consistently outperforms GE features in all metrics. The scPred method failed to identify cells in this task even tuning the default parameters. Here, inter-dataset experiment shows a more pronounced performance gain using CKG features over GE features when compared to the performance on intra-data set experiment of the same configuration.
Table 3i.
Performance evaluation of inter-dataset cell type classification on breast cancer datasets
| Feature set | Accuracy | F1 | # Features | |
|---|---|---|---|---|
| MLP | GE | 0.69±0.045 | 0.69±0.045 | 11381 |
| allk21n32 | 0.764±0.039 | 0.764±0.039 | 12958 | |
| RF | GE | 0.803±0.007 | 0.803±0.007 | 11381 |
| allk21n32 | 0.828±0.003 | 0.828±0.003 | 12958 | |
| GBM | GE | 0.842±0.005 | 0.842±0.005 | 11381 |
| allk21n32 | 0.828±0.002 | 0.828±0.002 | 12958 | |
| SVM | GE | 0.692±0.007 | 0.692±0.007 | 11381 |
| allk21n32 | 0.872±0.003 | 0.872±0.003 | 12958 | |
| ACTINN | GE | 0.838±0.028 | 0.852±0.023 | 17061±36 |
Comparison of inter-dataset cell type classification performance among scSimClassify using GE and CKG (allk21n3) feature sets, as well as ACTINN with GE features. The classification models are trained on Chuang’s dataset and tested on Karaayvazr’s dataset. The mean and standard deviation are recorded for different evaluation metrics after five repetitions. The best performance in each classifier is highlighted in bold.
For PBMC inter-dataset classification (Figure 2), there is no winner feature set based on the results from three samples in Lee's dataset. However, for RF, using CKG features consistently improves the accuracy in comparison to using GE features. As for GBM, CKG features show relatively equivalent performance to GE features. As for MLP and SVM, CKG features outperform GE features in FLU sample.
Figure 2.

Performance evaluation of inter-dataset cell type classification on PBMC data sets
Comparison of CKG features (allk21n32) and GE features for inter-dataset PBMC classification. Each point in the scatterplot shows the accuracy using CKGs vs using GE. Three PBMC samples in Lee's dataset are used. Each cell in the sample is classified by four classifiers.
Biological interpretation of CKG features
In this section, we tried to identify the biological origin of important CKG features and assessed whether they were biologically meaningful.
A CKG was formed by k-mers sharing similar abundance profiles across cells. These k-mers might be from the same gene, genes sharing significant sequence similarity (such as gene families), or even co-regulated genes. Here, we defined that a CKG as a single-gene CKG if more than 90% of k-mers in it can be mapped to one and only one gene. For those CKGs from genes with shared subsequences or potential co-regulated genes, we defined them as multi-gene CKGs if at least 45% of k-mers in them can be mapped to each gene. Except for single-gene and multi-gene CKGs, we categorized the remaining CKGs in the CKG feature sets as unannotated CKGs. To identify the annotation for a CKG, we ran a blast search to determine each k-mers’ gene association against protein-coding reference transcriptome (hg19).
We generated CKG feature sets (allk21n32) from Chuang's and PBMC3k datasets respectively to investigate CKG annotation distribution. Ranking CKG feature importance by trained tree-based models (RF, GBM), we analyzed annotation distributions of top N of the most important CKGs in the feature sets by changing the value of N (Figure 3). Setting N as the number of CKGs in a feature set (the last stacked bar in Figure 3), it shows that 67% of CKGs are single-gene CKGs, 5% of them are multi-gene CKGs among feature set generated from Chuang's dataset, while the corresponding proportions for PBMC3k dataset are 80.7% and 7.1%, respectively. It supports that simGG is capable of statistically grouping k-mers from a gene or multiple genes. Most of the genes associated with multi-gene CKGs come from the same gene families sharing subsequences. As expected, the proportion of single-gene CKG increased while decreasing N and selecting a relatively small set of the most important CKG features. However, there still exist multi-gene and unannotated CKGs even when N is as small as 50. This indicates that, in addition to single-gene CKGs, both multi-gene and unannotated CKGs carry differentiate information for cell type classification.
Figure 3.

CKG's gene annotation distribution
Distributions of three categories of CKGs in terms of their association with known gene annotation among top N of the most important CKGs derived from RF and GBM models. The CKG feature sets (allk21n32) are generated by Chuang's dataset (A and C) and PBMC3k dataset (B and D), respectively. The last stacked bar shows category distribution of the whole CKG feature set (The datasets and classifiers are shown below bar plots).
We next analyzed the common genes shared within CKG's gene annotation and GE. Here we focused on exploring features with a significant contribution to the classification. The top 10 most important GE and CKG features were derived from tree-based models used in intra-dataset experiments. From five repetitions of 5-fold cross-validation on intra-dataset, we obtained 25 sets of classification models. For the top 10 most important GE features, its gene set consists of unique genes over 250 genes. For the top 10 most important CKGs (allk21n32), the gene set consists of unique genes over gene annotations of 250 CKGs.
Given a large proportion of common genes associated with the top 10 most important features in GE and CKGs derived from both RF and GBM (Table 4), we have the following observations. First, a large proportion of these genes are marker genes for each cell type classification task. For Chuang's dataset, numerous genes, such as PPP1R1B (Kotecha et al., 2019), FABP7(Liu et al., 2012), and ERBB2 (Tan and Yu, 2007), were reported by prior literature showing close associations with breast cancers (Kotecha et al., 2019; Liu et al., 2012; Tan and Yu, 2007; Shepherd et al., 2016; Dedes et al., 2010). For PBMC3k dataset, a set of common genes (CCL5, CD14, CD3D, CD79A, CFD, CST3, GNLY, LST1, LYZ, NKG7, S100A4, S100A8, S100A9, TCL1A) were identified as marker genes by Seurat scRNA-seq analysis pipeline (Butler et al., 2018). Secondly, the vast majority of common genes, as highlighted in bold, are shared by both RF and GBM classification models. This suggests that common genes from CKG gene annotations and GE can be consistently derived from tree-based models.
Discussion
This paper presents a reference-free classification method for cell type identification in scRNA-seq data. Our method leverages k-mer level features from the entirety of the reads for cell type classification without requiring the alignment of reads. This enables the utilization of full sequencing reads especially when the reference genome is unavailable or when the subject genome is highly mutated.
Our experiments on four datasets demonstrate that our proposed CKG features serve as competitive features to gene expression features for cell type classification, which are exhibited across a variety of classification models. This suggests that CKG features can be an effective alternative to gene expression features for cell type identification and can potentially be used in replacement of gene expression features.
In this study, we attempt to interpret CKGs using the k-mers associated with genes. We find that our method naturally groups k-mers originated from the same gene together. This allows us to annotate CKG features with known genes to assess their biological significance. The significant overlap of gene annotations of top-ranked CKG features with top-ranked genes from GE indicates our method is biologically meaningful. In addition, we demonstrate that CKGs without specific gene annotations are also discriminative for cell types.
Limitations of the study
To address limitations of current work, our future work will focus on four directions: (1) We plan to expand the current evaluation to include more scRNA-seq datasets for validation and benchmarking, especially sequencing data with poorly annotated genomes; (2) We will continue our effort in the biological interpretation of CKG features, including the unannotated CKGs' potential biological association with mutations and intergenic elements; (3) We will further optimize configuration parameters such as exploring even larger fingerprint size n to see if the performance gain will continue to improve or will plateau at a certain point. (4) We will conduct a thorough evaluation of scalability of both training and classification steps.
STAR★Methods
Key resources table
| REAGENT or RESOURCE | SOURCE | IDENTIFIER |
|---|---|---|
| Deposited data | ||
| Chuang's dataset | NCBI SRA | GSE75688 |
| Karaayvaz's dataset | NCBI SRA | GSE118389 |
| PBMC3k dataset | 10x Genomics | https://support.10xgenomics.com/single-cell-geneexpression/datasets/1.1.0/pbmc3k |
| Lee's dataset | NCBI SRA | GSE149689 |
| Software and algorithms | ||
| scSimClassify | This paper | https://github.com/digi2002/scSimClassify |
| Simhash | (Manku et al., 2007) | https://github.com/1e0ng/simhash |
Resource availability
Lead contact
Further information and requests for resources should be directed to and will be fulfilled by the lead contact, Jinze Liu (Jinze.Liu@vcuhealth.org).
Materials availability
This study did not generate new biological data.
Data and code availability
-
•
This paper analyzes existing, publicly available data. These accession numbers for the datasets are listed in the key resources table.
-
•
The current version of scSimClassify is implemented in python and can be found at https://github.com/digi2002/scSimClassify.
-
•
Any additional information required to reanalyze the data reported in this paper is available from the lead contact upon request.
Method details
Beginning from a k-mer abundance matrix, scSimClassify takes three main steps to build a classifier with CKG features. The major contribution of scSimClassify is the simhash-based group generator(simGG), which compresses k-mers with similar abundance profiles into groups. The compressed k-mer groups (CKGs) serve as the aggregated k-mer level features for cell type classification. In this section, we describe the workflow of scSimClassify as shown in Figure 1. The following table includes formal notations that will be used in this section.
Table: Formal notations in the method
| i | the index of a k-mer | d | the index of a cell |
| I | unique k-mers in a training set | I' () | unique informative k-mers in a training set |
| D | cells in a training set | the abundance of k-mer i in cell d | |
| a k-mer abundance vector, representing a k-mer i with abundances across cells in a training set |
a cell d represented with an abundance vector across k-mers in a training set |
||
| g | the index of a CKG | G | a set of CKGs |
Preprocessing and selection of informative k-mers
The counting of k-mer abundances in scRNA-seq reads of individual cells is carried out using jellyfish (Marçais and Kingsford, 2011). Only the canonical form of a k-mer sequence is kept, i.e., the lexicographical minimum of itself and its reverse complementary sequence. The original k-mer abundance matrix as shown in Figure 1A is further processed based on three principles: (1) normalize k-mer abundance within individual cells; (2) filter out k-mers with sparse expressions across cells in a training set; (3) select informative k-mers with high abundance variations across cells in a training set.
To allow for a fair comparison across cells with variable sequencing depth, we normalize the original k-mer abundance of each cell, i.e., , by the total number of sequenced reads in cell d.
Often, k-mers with sporadic expression across the cell populations may be unreliable due to sequencing errors. We define as the occurrence of k-mer , which is the number of nonzero entries in ℛi. A k-mer is removed if it appears in only a small percentage of cells in a training set, i.e., . The default setting for α is 10%.
Note that not all k-mers are equally important for classification purposes. For example, some k-mers from housekeeping genes may have very consistent abundances across all cells. Such k-mers may not be useful in differentiating cell types. We assume the abundance vector of an informative k-mer exhibits a high standard deviation. Let be the standard deviation of k-mer abundance vector . A k-mer is selected as an informative k-mer if its is among the top β% in k-mer set I. The default setting for β is 5. The set of informative k-mers I' () will be the input of the next step.
Simhash-based group generator(simGG)
As mentioned in Introduction, k-mers may originate from the same gene/transcript, sharing similar abundance profiles across cells. Such k-mers can be redundant to represent cells. Therefore, we want to group similar k-mers into CKGs based on their corresponding abundance vectors across cells in a training set. However, conventional clustering algorithms are not scalable due to the presence of a huge set of k-mers. Even k-means clustering can not be applied due to the lack of knowledge on the number of clusters.
In this study, we utilize the locality sensitive hashing (LSH) (Gionis et al., 1999), an approximate algorithm that is applicable to objects on a large scale, to detect similar k-mers. The underlying idea of LSH is to hash objects with similar features to similar hash values such that object similarity could be determined by comparing their corresponding hash values. Here, we adapt the simhash method (Charikar, 2002) to group k-mers sharing similar abundance vectors. Simhash was originally developed to identify documents with similar word vectors in a large corpus. The simhash method is one of LSH functions that can represent feature vectors of objects in the continuous space with n-bit fingerprints in a binary form. It has the property that the more similar the objects are, the smaller the Hamming distance between their fingerprints, and the higher probability that they share the same fingerprints. Our proposed simhash-based method, named simGG, has the following steps:
Step one: generate k-mers’ n-bit fingerprints
Given a point in space (in this case, a k-mer abundance vector), the simhash method generates an n-bit fingerprint by determining the point's relative location among n generated hyperplanes. Each bit of the fingerprint corresponds to a hyperplane. The bit's value is set to 1 if the point is above the corresponding hyperplane; otherwise, it is set to 0. Two points with the same n-bit fingerprint indicate that they are very close as none of the n hyperplanes is able to separate them. Therefore, using more hyperplanes (larger n) often result in a more accurate similarity estimation for k-mer abundance vectors as space is split into much smaller regions.
To speed up the performance and avoid storing hyperplanes, we implement the simhash method as the pseudocode given in Algorithm 1 (Sood and Loguinov, 2011). The steps to map a k-mer abundance vector ℛi (i∈I′) to an n-bit fingerprint start by initializing a temporary array with n zeros. Next, the algorithm generates an n-bit hash φd for each cell d in () with a consistent hashing mechanism md5 (Dobbertin, 1996). For each bit of , it decides to add or subtract , the abundance of k-mer i in cell d, to/from based on whether the j-th bit of φd is one or zero. After all the cells of are processed, jth bit in fingerprint is obtained by setting 1 if is positive, otherwise setting to 0. Therefore, a k-mer abundance vector is mapped to [0,] n-bit fingerprint values as shown in Figure 1B1 and 11B2.
Algorithm 1. Pseudocode of the simhash algorithm.
Procedure Simhash(ℛi)▹Simhash k-mer abundance vector ℛi
array of n zeros
for do Examine each cell
Hash(d) Compute n-bit hash
for to n do Iterate through each bit
if bit of then
else
end if
end for
end for
for j = 1 to n do ▹Revisit all bits
if then
else
end if
end for
end Procedure
Step two: identify compressed k-mer groups (CKGs)
Based on the property of simhash, two k-mers are considered similar if the Hamming distance between their corresponding fingerprints is very small. Considering the large scale of k-mers and similarity identification performance, we use the strictest measure to identify similar k-mers by checking if Hamming distance is zero or not(Williams and Giles, 2013). Thereby we do not need to compute Hamming distances of all pairs of k-mers’ fingerprints. We define a CKG as a group of similar k-mers if they share exactly the same fingerprint. An example of CKGs is provided in Figure 1B3.
To group similar k-mers, a naive clustering method takes time. In comparison, the complexity of simGG is bounded by . The algorithm first simhashes informative k-mer abundance vectors () to n-bit fingerprints with time complexity. This is followed by the identification of the k-mers with the same fingerprints through sorting with time complexity. Additionally, both of the steps in simGG can be executed in parallel computing (Grama et al., 2003), which may further reduces the running time.
Step three: determine CKGs' abundances in individual cells
In this step, the pre-built CKGs from a training set are used to aggregate k-mer abundances into CKGs' abundances for both training and test sets. In general, the abundances of k-mers belonging to the same CKG are similar in an individual cell, as shown in Figure 1B3. As a result, we can compress those k-mers’ abundances into a single abundance to represent the expression of a CKG in a cell. Given k-mers belonging to cell d and CKG g, we first filter out the outliers whose abundances fall outside of two standard deviations from the mean abundance and then average the abundances of the remaining k-mers as the abundance of CKG g for cell d. To characterize cell d with CKGs obtained from previous step, we iteratively determine the abundance of each CKG for cell d. As shown in Figures 1A and 1C, the feature size of individual cells is reduced from the original k-mer size to CKG feature size .
Classification algorithms
During the classification process, we adopt a variety of classification algorithms (Abdelaal et al., 2019; Iyer et al., 2020) to classify cell types with CKG features. These methods include random forest (RF) (Breiman, 1996), gradient boosting machine (GBM) (Natekin and Knoll, 2013), multilayer perceptron (MLP) (Hornik et al., 1989) and support vector machine (SVM) (Cortes and Vapnik, 1995). The four classifiers are selected to classify cell types with CKG features as they represent four branches of the general classification algorithms. RF and GBM are tree-based ensemble methods that randomly consider a subset of features to build the classifier. The difference between them is that RF builds trees independently, while GBM builds one tree at a time to correct decision trees that come before it. MLP is a kind of artificial neural networks that considers all the features to determine the data classes. SVM finds a plane with the maximum margin to separate two classes of data points. Benchmarking on these classifiers allows us to investigate how different CKG features perform on each type of the state-of-the-art classifiers.
Dataset description
We identified four datasets (Chuang, Karaayvaz, PBMC3k and Lee) for evaluation in our experiments. They vary in the number of cells, cell populations, and sequencing protocols (Table S1).
Both Chuang's and Karaayvaz's datasets were sequenced from breast cancer tissues using Smartseq-2 technology where full-length transcripts were sequenced within individual cells. Their associated experiments aimed at revealing the characteristics of breast cancer subtypes shaped by tumor cells and immune cells in the microenvironment (Chung et al., 2017; Karaayvaz et al., 2018). The Chuang's dataset (Chung et al., 2017) contains 317 epithelial breast cancer cells, 175 immune cells, and 23 stromal cells. The epithelial breast cancer cells are further divided into four subpopulations: 73 luminal A subtypes, 25 luminal B subtypes, 130 HER2 subtypes, and 89 triple-negative breast cancer (TNBC) subtypes. And 175 immune cells can be further classified into three categories: 83 B cells, 54 T cells, and 38 macrophages. In all, it consists of eight types of cells. The Karaayvaz's dataset (Karaayvaz et al., 2018) contains 1098 cells originated from five different cell type populations: 868 epithelial breast cancer cells, 94 stromal cells, 64 macrophages, 53 T cells, and 19 B cells. Both datasets share five common cell types: epithelial breast cancer cells, stromal cells, B cells, T cells, and macrophages, making it possible to classify cell types across datasets.
The PBMC3k and Lee's datasets are human PBMC datasets. They were sequenced by 10x genomics, which only sequenced the 3′-end of the transcripts and generate a relatively low number of reads. The scRNAseq data and its gene expression profiles from PBMC3k dataset are freely available from 10X Genomics (10x Genomics, 2016) with nine identified cell types. This is a well-analyzed dataset with the ground truth cell type assigned by Seurat clustering protocol (Butler et al., 2018). Lee's study performed scRNA-seq using PBMCs to identify factors associated with the development of severe COVID-19 infection. We randomly selected three samples from Lee's dataset. They were PBMCs from a healthy donor (HD), a patient with severe influenza (FLU), and a patient with COVID-19. Also, six shared cell types between PBMC3k and Lee's dataset made cross-dataset classification possible.
Classification feature generation
Gene expression data associated with the original scRNA-seq data from each dataset was downloaded from the GEO repository or 10X Genomics. We followed QC criteria as used in their original studies (Chung et al., 2017; Lee et al., 2020) to discard low-expressed or unexpressed genes.
We generated 8 variations of CKG featurs, containing k-mers derived from both all the reads and mapped reads in scRNA-seq data. To obtain mapped reads in Chuang's dataset, the scRNA-seq reads were aligned to human genome reference sequences (hg19) using the 2-pass mode of STAR (default parameters) (Dobin et al., 2013), following the same alignment procedure for gene expression quantification (Chung et al., 2017). As for PBMC3k dataset, we obtained read alignment information from the downloaded BAM file.
Due to different sequencing protocols, the average reads per cell on PBMC3k is around 69,000 reads per cell in comparison to over 10 million reads per cell in Chuang's dataset. Therefore we set the k-mer filtering threshold to be α = 0.5% to retain sufficient k-mers to generate CKG features in the PBMC3k dataset, comparing to the default setting of α = 10% as in Chuang's dataset.
Classifier configuration
We applied MLP, RF, GBM, and SVM to classify cells with each feature set. A grid search to identify optimal hyperparameter combination was performed for all classifiers. The hyperparameter searching space for RF and GBM was the maximum tree depth (2/6/10), number of estimators (10/50/100), and a maximum of features to look for best split (“sqrt”/“log”/“None”). SVM selected parameters from the type of kernel (linear/rbf) and the margin error controller (0.0001/0.001/0.01). The options for MLP were the number of the hidden layer (1/2) and the dropout rate (0.4/0.5/0.6). The number of neurons in each layer was the average of neuron numbers of its previous layer and output layer. RF, GBM and SVM were implemented via the scikit-learn library (Pedregosa et al., 2011), and the MLP was implemented in Keras (Gulli and Pal, 2017). We run ACTINN and scPred with their defaulting settings after downloading scripts or installing packages from their respective websites.
Acknowledgments
The work was supported in part by NIH R01 DK095662 to J.L. and by NIH 4R00LM013001 to Y.P.. We are particularly grateful for the assistance given by Dr. Yi Zhang.
Author contributions
J.L. conceived and directed the project. J.L. and Q.S. designed the methodology and the experiments. Q.S. implemented the algorithm and conducted the performance evaluation. J.L. and Q.S. drafted the paper. J.L., Y.P., and Q.S. reviewed, edited, and approved the final manuscript.
Declaration of interests
The authors declare no competing interests.
Published: August 20, 2021
Footnotes
Supplemental information can be found online at https://doi.org/10.1016/j.isci.2021.102855.
Supplemental information
References
- 10x Genomics, 2016. Pbmcs from a Healthy Donor, Single Cell Immune Profiling Dataset by Cell Ranger 1.1.0 .
- Abdelaal T., Michielsen L., Cats D., Hoogduin D., Mei H., Reinders M.J., Mahfouz A. A comparison of automatic cell identification methods for single-cell rna sequencing data. Genome Biol. 2019;20:1–19. doi: 10.1186/s13059-019-1795-z. [DOI] [PMC free article] [PubMed] [Google Scholar]
- Alquicira-Hernandez J., Sathe A., Ji H.P., Nguyen Q., Powell J.E. scpred: accurate supervised method for cell-type classification from single-cell rna-seq data. Genome Biol. 2019;20:1–17. doi: 10.1186/s13059-019-1862-5. [DOI] [PMC free article] [PubMed] [Google Scholar]
- Andrews T.S., Hemberg M. Identifying cell populations with scrnaseq. Mol. aspects Med. 2018;59:114–122. doi: 10.1016/j.mam.2017.07.002. [DOI] [PubMed] [Google Scholar]
- Breiman L. Bagging predictors. Mach. Learn. 1996;24:123–140. [Google Scholar]
- Brennecke P., Anders S., Kim J.K., Kołodziejczyk A.A., Zhang X., Proserpio V., Baying B., Benes V., Teichmann S.A., Marioni J.C. Accounting for technical noise in single-cell rna-seq experiments. Nat. Methods. 2013;10:1093. doi: 10.1038/nmeth.2645. [DOI] [PubMed] [Google Scholar]
- Butler A., Hoffman P., Smibert P., Papalexi E., Satija R. Integrating single-cell transcriptomic data across different conditions, technologies, and species. Nat. Biotechnol. 2018;36:411–420. doi: 10.1038/nbt.4096. [DOI] [PMC free article] [PubMed] [Google Scholar]
- Charikar M.S. Proceedings of the Thiry-Fourth Annual ACM Symposium on Theory of Computing. Association for Computing Machinery; 2002. Similarity estimation techniques from rounding algorithms; pp. 380–388. [Google Scholar]
- Chung W., Eum H.H., Lee H.O., Lee K.M., Lee H.B., Kim K.T., Ryu H.S., Kim S., Lee J.E., Park Y.H. Single-cell rna-seq enables comprehensive tumour and immune cell profiling in primary breast cancer. Nat. Commun. 2017;8:1–12. doi: 10.1038/ncomms15081. [DOI] [PMC free article] [PubMed] [Google Scholar]
- Cortes C., Vapnik V. Support-vector networks. Mach. Learn. 1995;20:273–297. [Google Scholar]
- Dedes K.J., Lopez-Garcia M.A., Geyer F.C., Lambros M.B., Savage K., Vatcheva R., Wilkerson P., Wetterskog D., Lacroix-Triki M., Natrajan R. Cortactin gene amplification and expression in breast cancer: a chromogenic in situ hybridisation and immunohistochemical study. Breast Cancer Res. Treat. 2010;124:653–666. doi: 10.1007/s10549-010-0816-0. [DOI] [PubMed] [Google Scholar]
- Dieffenbach C., Lowe T., Dveksler G. General concepts for pcr primer design. PCR Methods Appl. 1993;3:S30–S37. doi: 10.1101/gr.3.3.s30. [DOI] [PubMed] [Google Scholar]
- Dobbertin H. Vol. 96. Rump Session of Eurocrypt; 1996. pp. 71–82. (Cryptanalysis of md5 Compress). [Google Scholar]
- Dobin A., Davis C.A., Schlesinger F., Drenkow J., Zaleski C., Jha S., Batut P., Chaisson M., Gingeras T.R. Star: ultrafast universal rna-seq aligner. Bioinformatics. 2013;29:15–21. doi: 10.1093/bioinformatics/bts635. [DOI] [PMC free article] [PubMed] [Google Scholar]
- Feurer M., Hutter F. Hyperparameter optimization. In: Hutter F., Kotthoff L., Vanschoren J., editors. Automated Machine Learning. Springer; 2019. pp. 3–33. [Google Scholar]
- Gionis A., Indyk P., Motwani R. Vldb. Morgan Kaufmann Publishers Inc.; 1999. Similarity search in high dimensions via hashing; pp. 518–529. [Google Scholar]
- Grama A., Kumar V., Karypis G., Gupta A. Pearson Education; 2003. (Introduction to parallel computing). [Google Scholar]
- Gulli A., Pal S. Packt Publishing Ltd; 2017. Deep Learning with Keras. [Google Scholar]
- Hornik K., Stinchcombe M., White H. Multilayer feedforward networks are universal approximators. Neural Netw. 1989;2:359–366. [Google Scholar]
- Iyer A., Gupta K., Sharma S., Hari K., Lee Y.F., Ramalingam N., Yap Y.S., West J., Bhagat A.A., Subramani B.V. Integrative analysis and machine learning based characterization of single circulating tumor cells. J. Clin. Med. 2020;9:1206. doi: 10.3390/jcm9041206. [DOI] [PMC free article] [PubMed] [Google Scholar]
- Jiang D., Tang C., Zhang A. Cluster analysis for gene expression data: a survey. IEEE Trans. Knowl. Data Eng. 2004;16:1370–1386. [Google Scholar]
- Karaayvaz M., Cristea S., Gillespie S.M., Patel A.P., Mylvaganam R., Luo C.C., Specht M.C., Bernstein B.E., Michor F., Ellisen L.W. Unravelling subclonal heterogeneity and aggressive disease states in tnbc through single-cell rna-seq. Nat. Commun. 2018;9:1–10. doi: 10.1038/s41467-018-06052-0. [DOI] [PMC free article] [PubMed] [Google Scholar]
- Kiselev V.Y., Andrews T.S., Hemberg M. Challenges in unsupervised clustering of single-cell rna-seq data. Nat. Rev. Genet. 2019;20:273–282. doi: 10.1038/s41576-018-0088-9. [DOI] [PubMed] [Google Scholar]
- Kotecha S., Lebot M.N., Sukkarn B., Ball G., Moseley P.M., Chan S.Y., Green A.R., Rakha E., Ellis I.O., Martin S.G. Dopamine and camp-regulated phosphoprotein 32 kda (darpp-32) and survival in breast cancer: a retrospective analysis of protein and mrna expression. Sci. Rep. 2019;9:1–11. doi: 10.1038/s41598-019-53529-z. [DOI] [PMC free article] [PubMed] [Google Scholar]
- LaPierre N., Ju C.J.T., Zhou G., Wang W. Metapheno: a critical evaluation of deep learning and machine learning in metagenome-based disease prediction. Methods. 2019;166:74–82. doi: 10.1016/j.ymeth.2019.03.003. [DOI] [PMC free article] [PubMed] [Google Scholar]
- Lee J.S., Park S., Jeong H.W., Ahn J.Y., Choi S.J., Lee H., Choi B., Nam S.K., Sa M., Kwon J.S. Immunophenotyping of covid-19 and influenza highlights the role of type i interferons in development of severe covid-19. Sci. Immunol. 2020;5:eabd1554. doi: 10.1126/sciimmunol.abd1554. [DOI] [PMC free article] [PubMed] [Google Scholar]
- Liu R.Z., Graham K., Glubrecht D.D., Lai R., Mackey J.R., Godbout R. A fatty acid-binding protein 7/rxrβ pathway enhances survival and proliferation in triple-negative breast cancer. J. Pathol. 2012;228:310–321. doi: 10.1002/path.4001. [DOI] [PubMed] [Google Scholar]
- Ma F., Pellegrini M. Actinn: automated identification of cell types in single cell rna sequencing. Bioinformatics. 2020;36:533–538. doi: 10.1093/bioinformatics/btz592. [DOI] [PubMed] [Google Scholar]
- Manku G.S., Jain A., Das Sarma A. Proceedings of the 16th International Conference on World Wide Web - WWW ’07. Association for Computing Machinery; 2007. Detecting near-duplicates for web crawling; pp. 141–150. [Google Scholar]
- Marçais G., Kingsford C. A fast, lock-free approach for efficient parallel counting of occurrences of k-mers. Bioinformatics. 2011;27:764–770. doi: 10.1093/bioinformatics/btr011. [DOI] [PMC free article] [PubMed] [Google Scholar]
- Natekin A., Knoll A. Gradient boosting machines, a tutorial. Front. Neurorobot. 2013;7:21. doi: 10.3389/fnbot.2013.00021. [DOI] [PMC free article] [PubMed] [Google Scholar]
- Pedregosa F., Varoquaux G., Gramfort A., Michel V., Thirion B., Grisel O., Blondel M., Prettenhofer P., Weiss R., Dubourg V. Scikit-learn: machine learning in python. J. Mach. Learn. Res. 2011;12:2825–2830. [Google Scholar]
- Shepherd J.H., Uray I.P., Mazumdar A., Tsimelzon A., Savage M., Hilsenbeck S.G., Brown P.H. The sox11 transcription factor is a critical regulator of basal-like breast cancer growth, invasion, and basal-like gene expression. Oncotarget. 2016;7:13106. doi: 10.18632/oncotarget.7437. [DOI] [PMC free article] [PubMed] [Google Scholar]
- Shi C.H., Yip K.Y. K-mer counting with low memory consumption enables fast clustering of single-cell sequencing data without read alignment. bioRxiv. 2019;2019:723833. [Google Scholar]
- Sood S., Loguinov D. Proceedings of the 20th ACM International Conference on Information and Knowledge Management. Association for Computing Machinery; 2011. Probabilistic near-duplicate detection using simhash; pp. 1117–1126. [Google Scholar]
- Tan M., Yu D. Molecular mechanisms of erbb2-mediated breast cancer chemoresistance. Adv. Exp. Med. Biol. 2007;608:119–129. doi: 10.1007/978-0-387-74039-3_9. [DOI] [PubMed] [Google Scholar]
- Vieth B., Parekh S., Ziegenhain C., Enard W., Hellmann I. A systematic evaluation of single cell rna-seq analysis pipelines. Nat. Commun. 2019;10:1–11. doi: 10.1038/s41467-019-12266-7. [DOI] [PMC free article] [PubMed] [Google Scholar]
- Wang Y., Fu L., Ren J., Yu Z., Chen T., Sun F. Identifying group-specific sequences for microbial communities using long k-mer sequence signatures. Front. Microbiol. 2018;9:872. doi: 10.3389/fmicb.2018.00872. [DOI] [PMC free article] [PubMed] [Google Scholar]
- Williams K., Giles C.L. Proceedings of the 2013 ACM Symposium on Document Engineering. Association for Computing Machinery; 2013. Near duplicate detection in an academic digital library; pp. 91–94. [Google Scholar]
- Yuan G.C., Cai L., Elowitz M., Enver T., Fan G., Guo G., Irizarry R., Kharchenko P., Kim J., Orkin S. Challenges and emerging directions in single-cell analysis. Genome Biol. 2017;18:1–8. doi: 10.1186/s13059-017-1218-y. [DOI] [PMC free article] [PubMed] [Google Scholar]
- Zielezinski A., Girgis H.Z., Bernard G., Leimeister C.A., Tang K., Dencker T., Lau A.K., Röhling S., Choi J.J., Waterman M.S. Benchmarking of alignment-free sequence comparison methods. Genome Biol. 2019;20:1–18. doi: 10.1186/s13059-019-1755-7. [DOI] [PMC free article] [PubMed] [Google Scholar]
Associated Data
This section collects any data citations, data availability statements, or supplementary materials included in this article.
Supplementary Materials
Data Availability Statement
-
•
This paper analyzes existing, publicly available data. These accession numbers for the datasets are listed in the key resources table.
-
•
The current version of scSimClassify is implemented in python and can be found at https://github.com/digi2002/scSimClassify.
-
•
Any additional information required to reanalyze the data reported in this paper is available from the lead contact upon request.