

Abstract
CUGBP Elav‐like family member 2(CELF2) plays crucial roles in the development and activation of T cell. However, the impacts of CELF2 on tumour‐infiltrating immune cells (TIICs) and clinical outcomes of tumours remain unclear. In this study, we found that elevated CELF2 expression was markedly correlated with prolonged survival in multiple tumours, particularly in breast and lung cancers. Notably, CELF2 only impacted the prognosis of triple‐negative breast cancer (TNBC) with lymph node metastasis. Further investigation showed CELF2 expression was positively correlated with the infiltration abundance of dendritic cells (DCs), CD8+ T cells and neutrophils in breast invasive carcinoma (BRCA) and DCs in lung squamous cell carcinoma (LUSC). CELF2 also had strong correlations with markers of diverse TIICs such as T cells, tumour‐associated macrophages and DCs in BRCA and LUSC. Importantly, CELF2 was significantly associated with plenty of immune checkpoint molecules (ICMs) and outperformed five prevalent biomarkers including PD‐1, PD‐L1, CTLA‐4, CD8 and tumour mutation burden in predicting immunotherapeutic responses. Immunohistochemistry also revealed lower protein levels of CELF2 in TNBC and LUSC compared to normal tissues, and patients with high expression showed significantly prolonged prognosis. In conclusion, we demonstrated that increased CELF2 expression was closely related to better prognosis and superior TIIC infiltration and ICM expression, particularly in BRCA and LUSC. CELF2 also performed well in evaluating the immunotherapeutic efficacy, suggesting CELF2 might be a promising biomarker.
Keywords: CELF2, immune infiltration, immunotherapy, lung squamous cell carcinoma, prognosis, triple‐negative breast cancer
1. INTRODUCTION
With the change in disease spectrum, tumours have become a major threat to people's health in recent years, placing a heavy burden on global public health. The latest statistical report shows that in 2021, there will be more than 1,898,160 new cancer cases and 608,570 cancer deaths in the United States, which has become the leading cause of death in developed countries. Among them, the incidence of lung cancer ranks second and has becoming the number one killer in tumour‐related disease for both men and women. In terms of women, breast cancer is the most common tumour type, with the second highest mortality rate for a long time, after lung cancer. 1 Although the mortality rate of breast and lung cancer has decreased with the improvement of tumour diagnosis and treatment, the clinical outcomes remain unsatisfactory. For patients with lung cancer, the 5‐year survival rate is only 21%. Breast cancer exhibits a 5‐year survival rate of nearly 90%, while the 5‐year survival rate of distant metastatic breast cancer is only 28%. 1 Hence, a better understanding the specific mechanisms of breast and lung cancer oncogenesis and progression, as well as to find more accurate novel biomarkers that can be used for clinical and therapeutic management, is urgently needed.
Tumour microenvironment (TME) is the cellular environment for tumour cell growth, in which tumour‐infiltrating immune cells (TIICs), an important component, play a dominant role. 2 For example, tumour‐associated macrophages (TAMs) can exacerbate tumour progression by promoting tumour angiogenesis, metastasis and immune escape. 3 Dendritic cells (DCs) conduce to tumour metastasis by reducing CD8+ T‐cell cytotoxicity and enhancing regulatory T (Treg) cell responses. 4 , 5 The past decade has witnessed encouraging advances in immunotherapy represented by immune checkpoint inhibitors (ICIs) has revolutionized the therapeutic paradigm of most tumours, especially non‐small‐cell lung cancer, triple‐negative breast cancer (TNBC), advanced melanoma and bladder cancer. 6 , 7 , 8 , 9 While ICIs target the interactions between immune and tumour cells within the TME, certain alterations that occur in the TME can also affect the responsiveness to immunotherapy. 3 Recent studies have confirmed that key biological processes such as autophagy, hypoxia and ferroptosis, as well as some molecular alterations, can contribute to the immunotherapeutic efficacy and prognosis of cancer patients by affecting the distributions and interactions of distinct immune cell subsets in the TME. 10 , 11 , 12 , 13 To date, there are still few cancer patients who can benefit from immunotherapy, and thus, it is essential to explore additional therapeutic targets.
CELF (CUGBP Elav‐like family) proteins are RNA binding protein of shuttle nucleoplasm characterized by three RNA recognition motifs. In humans, CELF contains six known isoforms, CELF1 to CELF6, which are further divided into two subgroups according to their amino acid sequencing similarity. One group consists of CELF3‐6 and is largely restricted to neurons and a few other tissues. The other group includes CELF1 and CELF2, which are commonly expressed in most tissues, but are expressed differently during development and differentiation. 14 Previous studies have demonstrated that CELF2 could regulate multiple steps of RNA processing, such as pre‐mRNA splicing, RNA editing, polyadenylation, mRNA stability and translation. 14 , 15 Over the past decade, substantial studies have confirmed that CELF2 played a tumour suppressor role in breast cancer, lung cancer, hepatocellular carcinoma, gastric cancer, ovarian cancer, glioma and acute myeloid leukaemia, suggesting that it can be used as a candidate biomarker to predict cancer prognosis. 16 , 17 , 18 , 19 , 20 , 21 , 22 , 23 Additionally, CELF2 expression was significantly elevated in developing thymocytes and activated T cells and promoted T‐cell receptor expression and signalling through alternative splicing. 24 , 25 , 26 However, the comprehensive understanding of the impacts of CELF2 on the tumour immune microenvironment remains unknown.
Herein, we delineated the expression and prognostic landscape of CELF2 across human cancers. The relationships between CELF2 and TIICs as well as immune checkpoint molecules (ICMs) were further explored. In addition, we also recruited two immunotherapeutic cohorts and evaluated the power of CELF2 for predicting the responses to immunotherapy. Overall, our study provides a reference and direction for understanding the crucial role of CELF2 in the immune microenvironment of pan‐cancer, as well as reveals the potential mechanism thereby CELF2 affects anti‐tumour immunity and cancer immunotherapy.
2. METHODS
2.1. CELF2 expression across human cancers in Oncomine
Oncomine (https://www.oncomine.org/resource/login.html) is a web‐based data mining platform that assembles 86,733 samples and 715 gene expression data sets together. 27 The mRNA expression levels of CELF2 in various cancer types were detected using Oncomine database with the following conditions: p‐value: 0.001, fold change: 1.5, and gene rank: all.
2.2. Survival analysis in PrognoScan and Kaplan‐Meier plotter
The biological correlations between CELF2 expression and patient survival in pan‐cancer were evaluated via PrognoScan (http://dna00.bio.kyutech.ac.jp/PrognoScan/index.html) and Kaplan‐Meier plotter (http://kmplot.com/analysis/) 28 , 29 . The PrognoScan database is publicly available to assess the prognostic value of genes by meta‐analysing a large collection of published cancer microarray data. The Kaplan‐Meier plotter, which includes data from the Gene Expression Omnibus (GEO), The Cancer Genome Atlas (TCGA) and European Genome‐phenome Atlas (EGA), provides an easy way to explore the impact of 54,000 genes on survival in 21 human cancers, with a large cohort of breast (n = 7830), ovarian (n = 2190), lung (n = 3452) and gastric (n = 1440) cancers. We therefore evaluated the correlations between CELF2 expression and patient survival in breast, ovarian, lung and gastric cancers and further analysed the impacts of CELF2 expression on the outcomes of breast cancer patients with different clinicopathological characteristics. The hazard ratios (HR) with 95% confidence intervals (95% CI) and log‐rank p‐value (< 0.05 is considered to be significant) was also calculated.
2.3. Correlations between CELF2 expression and immune cell infiltration in TIMER
TIMER (https://cistrome.shinyapps.io/timer/) is a comprehensive resource that applies a deconvolution method to infer the abundance of TIICs from the TCGA database. 30 We analysed CELF2 expression level in different cancer types by the DiffExp module of TIMER. Afterwards, we explored the Spearman correlations between CELF2 expression and tumour purity as well as the abundance of six TIICs including B cells, CD4+ T cells, CD8+ T cells, neutrophils, macrophages and DCs in 32 cancers using the gene module of TIMER.
In addition, we also explored the correlations between CELF2 and several immune cell markers. The gene markers of TIICs including CD8+ T cells, T cells (general), B cells, monocytes, TAMs, M1 macrophages, M2 macrophages, neutrophils, natural killer (NK) cells, DCs, T‐helper 1 (Th1) cells, T‐helper 2 (Th2) cells, follicular helper T (Tfh) cells, T‐helper 17 (Th17) cells, Treg and exhausted T cells were referenced from previous studies. 31 , 32 , 33 In this part, we focused on analysing breast invasive carcinoma (BRCA) and lung squamous cell carcinoma (LUSC), with lung adenocarcinoma (LUAD) as a control. Finally, we further explored the correlations between CELF2 and ICMs in various cancer types using the Gene_Corr module of the TIMER2.0 website. 34 The ICMs were derived from previous studies. 35 , 36 Notably, the Spearman correlation coefficients presented in the heatmap were adjusted for tumour purity.
2.4. Gene correlation analysis in GEPIA
The online database GEPIA (http://gepia.cancer‐pku.cn/index.html) is an interactive analysis tool that contains RNA‐seq data from 9736 tumour and 8587 normal samples from the TCGA and Genotype‐Tissue Expression (GTEx) data set. 37 We used GEPIA to explore the relationships between CELF2 and TIIC‐related markers in BRCA, LUSC and LUAD. The Spearman method was applied to determine the correlation coefficient.
2.5. Evaluation of immunotherapeutic biomarkers
We finally recruited two immunotherapeutic cohorts: (1) a cohort of 38 metastatic melanoma patients treated with anti‐PD‐1 monoclonal antibody (GSE78220 cohort) 12 , 38 and (2) a cohort of 144 melanoma patients treated with anti‐PD‐1 monoclonal antibody (Van Allen cohort). 39 In addition, to explore the power of CELF2 as an immunotherapeutic biomarker, we evaluated the performance of CELF2 in predicting immunotherapy response in the two cohorts and further compared with five other well‐studied biomarkers, including PD‐1, PD‐L1, CTLA‐4, CD8 and tumour mutation burden (TMB). 40 , 41 , 42 We used the receiver operator characteristic (ROC) curves and the area under the ROC curve (AUC) to measure the predictive accuracy of different biomarkers for predicting the responses to immunotherapy.
2.6. Tissue microarray and immunohistochemistry staining
Human tissue microarrays of TNBC (BRC1601; Shanghai Superbiotek Pharmaceutical Technology, Shanghai, China) and LUSC (HLugS180Su02; Shanghai Outdo Biotechnology, Shanghai, China) were purchased. The clinical characteristics of 80 paired TNBC and 90 paired LUSC specimens were downloaded from the company websites. Immunohistochemistry (IHC) was performed using anti‐CELF2 (ab186430, 1:500) antibody. Staining percentage scores were classified as follows: 1 (1%–25%), 2 (26%–50%), 3 (51%–75%) and 4 (76%–100%), and staining intensity was scored 0 (signalless colour) to 3 (light yellow, brown and dark brown). The stained tissues were scored by three individuals blinded to the clinical parameters, and the IHC scores were determined by percentage and intensity scores.
2.7. Statistical analysis
Differential expression of CELF2 in TIMER was explored using the Wilcoxon rank‐sum test. The results produced by Oncomine were displayed with P‐value, fold change and gene rank. Survival was assessed using PrognoScan and Kaplan‐Meier plotter. The correlations between two continuous variables were evaluated by Spearman's correlation and statistical significance in TIMER, TIMER2.0 and GEPIA. The strength of the correlation was determined using the following guidelines for absolute values: 0.00–0.19, very weak; 0.20–0.39, weak; 0.40–0.59, moderate; 0.60–0.79, strong; and 0.80–1.00, very strong. Data processing, statistical analysis and plotting of the immunotherapy and tissue microarray cohorts were conducted in R 4.0.2 software. Kaplan‐Meier survival analysis was performed by survival R package, and the optimal cut‐off value was determined by survminer R package. The ROC curves were plotted by pROC R package. p < 0.05 was considered statistically significant.
3. RESULTS
3.1. The mRNA expression levels of CELF2 in pan‐cancer
We first analysed the expression levels of CELF2 mRNA in pan‐cancer using Oncomine database. The results demonstrated that CELF2 was significantly elevated in colorectal, gastric, kidney, leukaemia, liver and melanoma cancers relative to their matched normal tissues. In contrast, we also found that CELF2 was lower in bladder, brain and central nervous system, breast, head and neck, lung, lymphoma, ovarian, prostate and sarcoma cancers compared with normal tissues (Figure 1A). Detailed expression results of CELF2 in specific tumours are shown in Supplementary Table 1.
FIGURE 1.
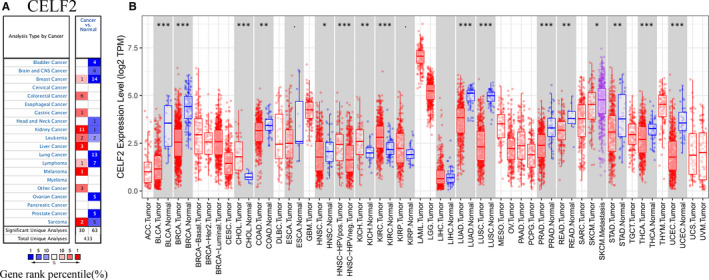
CELF2 expression levels in different types of human cancers. (A) Increased or decreased CELF2 in data sets of different cancers compared with normal tissues in Oncomine database. (B) Human CELF2 expression levels in different tumour types from the TCGA database were determined by TIMER (*p < 0.05, **p < 0.01, ***p < 0.001)
To further assess CELF2 expression in different cancer types, we used the TIMER tool to analyse RNA‐seq data from the TCGA database. We found that CELF2 expression was significantly down‐regulated in bladder urothelial carcinoma (BLCA), BRCA, colon adenocarcinoma (COAD), head and neck squamous cell carcinoma (HNSC), LUAD, LUSC, prostate adenocarcinoma (PRAD), rectum adenocarcinoma (READ), stomach adenocarcinoma (STAD), thyroid carcinoma (THCA) and uterine corpus endometrial carcinoma (UCEC) relative to their respective adjacent normal tissues. In contrast, significantly higher expression of CELF2 was only found in cholangiocarcinoma (CHOL), kidney chromophobe (KICH) and kidney renal clear cell carcinoma (KIRC). The differential CELF2 expression in tumours and adjacent normal tissue samples in the TCGA database is shown in Figure 1B.
3.2. Potential prognostic value of CELF2 in pan‐cancer
We next investigated the impact of CELF2 expression on the prognosis of different cancers using PrognoScan (Supplementary Table 2). The results revealed a significant correlation between CELF2 expression and the survival of patients with a variety of tumours, including blood, brain, breast, colorectal, eye, lung, ovarian, skin and soft tissue cancers. Representative survival curves for each tumour are shown in Figure 2A–L. Notably, there were 24 and 15 cohorts, respectively, that showed high expression of CELF2 as a protective factor in breast and lung cancer (Figure 2C–E, H–I, Supplementary Table 2). These results suggested that the expression of CELF2 had a non‐negligible impact on the prognosis of breast and lung cancers.
FIGURE 2.
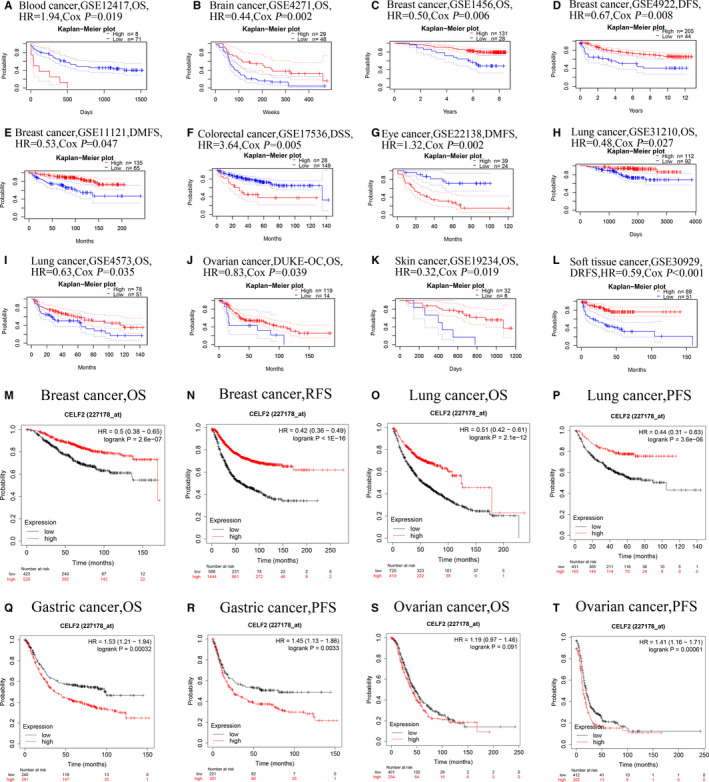
Representative Kaplan‐Meier survival curves comparing the high and low expression of CELF2 in multiple types of cancer in PrognoScan (A–L) and Kaplan‐Meier plotter database (M–T). (A, B) Survival curves of OS in blood cancer cohort (GSE12417, n = 79) and brain cancer cohort (GSE4271, n = 77). (C–E) Survival curves of OS (GSE1456, n = 159), DFS (GSE4922, n = 249) and DMFS (GSE11121, n = 200) in three breast cancer cohorts. (F) Survival curve of DSS in colorectal cancer cohort (GSE17536, n = 177). (G) Survival curve of DMFS in eye cancer cohort (GSE22138, n = 63). (H–I) Survival curves of OS in two lung cancer cohorts (GSE31210, n = 204; GSE4573, n = 129). (J–K) Survival curves of OS in ovarian cancer cohort (DUKE‐OC, n = 133) and skin cohort (GSE19234, n = 38). (L) Survival curve of DRFS in soft tissue cancer cohort (GSE30929, n = 140). (M, N) OS and RFS survival curves of breast cancer (n = 1879; n = 4929). (O, P) OS and PFS survival curves of lung cancer (n = 1925; n = 982). (Q, R) OS and PFS survival curves of gastric cancer (n = 875; n = 640). (S, T) OS and PFS survival curves of ovarian cancer (n = 1656; n = 1435). OS, overall survival; DFS, disease‐free survival; DMFS, distant metastasis‐free survival; DSS, disease‐specific survival; DRFS, distant relapse‐free survival; RFS, relapse‐free survival; PFS, progression‐free survival
After PrognoScan, we also used Kaplan‐Meier plotter database to evaluate the prognostic value of CELF2. The better prognosis in breast cancer (overall survival (OS): HR = 0.5, 95% CI = 0.38 to 0.65, log‐rank p = 2.6e‐7; relapse‐free survival (RFS): HR = 0.42, 95% CI = 0.36 to 0.49, log‐rank p < 1e‐16) and lung cancer (OS: HR = 0.51, 95% CI = 0.42 to 0.61, log‐rank p = 2.1e‐12; progression‐free survival (PFS): HR = 0.44, 95% CI = 0.31 to 0.63, log‐rank p = 3.6e‐6) was shown in patients with higher CELF2 expression (Figure 2M–P). In contrast, we found that increased CELF2 expression correlated with a dismal prognosis in gastric cancer (OS: HR = 1.53, 95% CI = 1.21 to 1.94, log‐rank p = 0.00032; PFS: HR = 1.45, 95% CI = 1.13 to 1.86, log‐rank p = 0.0033) and ovarian cancer (PFS: HR = 1.41, 95% CI = 1.16 to 1.71, log‐rank p = 0.00061) (Figure 2Q, R, T). However, despite the OS of ovarian cancer also presented this trend, it was not statistically significant (OS: HR = 1.19, 95% CI = 0.97 to 1.46, log‐rank p = 0.091; Figure 2S). Taken together, these results in PrognoScan and Kaplan‐Meier plotter simultaneously illustrated that CELF2 was related to its better survival in breast and lung cancers.
3.3. Elevated CELF2 expression impacted the prognosis of triple‐negative breast cancer patients with lymphatic metastasis
TNBC is a special type of breast cancer in which estrogen receptor (ER), progesterone receptor (PR) and human epidermal growth factor receptor 2 (HER2) are negative, which is characteristic by the lack of effective therapeutic targets, and a high degree of malignant, easy to metastasis and relapse. 43 As we found CELF2 was significantly down‐regulated in breast cancer, and its expression was closely related to better prognosis. To better understand the specific mechanism by which CELF2 affects prognosis in breast cancer, by integrating clinicopathological information from the Kaplan‐Meier plotter database, we explored the prognostic value of CELF2 in stratified populations. We found that CELF2 expression exerted a positive effect on both OS and RFS in breast cancer and was significantly correlated with ER, PR, HER2 status, subtype, grade, lymph node status and TP53 status of patients (Table 1). Specifically, high CELF2 expression was dramatically associated with prolonged OS and RFS in breast cancer patients with ER negative, PR negative, HER2 negative, lymph node positive and grade 3 (OS and RFS: HR <1 and p < 0.05). Meanwhile, we also found no significant correlations between CELF2 expression and OS or RFS in patients with ER positive (OS: HR = 0.52, p = 0.06), PR positive (RFS: HR = 0.67, p = 0.0744), lymph node negative (OS: HR = 0.68, p = 0.3503; RFS: HR = 0.65, p = 0.0261), grade 1 (OS: HR = 0.29, p = 0.2841; RFS: HR = 1.72, p = 0.3512) and grade 2 (OS: HR = 2.38, p = 0.1271). Considering the absence of OS in PR‐positive patients, we further evaluated the influence of CELF2 on distant metastasis‐free survival (DMFS) of PR‐positive patients and revealed that CELF2 expression was not significantly associated with DMFS (DMFS: HR = 0.62, p = 0.3571). Our results indicated that CELF2 played a protective role in TNBC patients with lymph node metastasis and higher grade, suggesting that CELF2 might affect the prognosis of TNBC patients through lymph node metastasis in these individuals.
TABLE 1.
Correlation of CELF2 mRNA expression and clinical prognosis in breast cancer with different clinicopathological factors by Kaplan‐Meier plotter
| Clinicopathological characteristics | Overall survival (n = 1879) | Relapse‐free survival (n = 4929) | ||||
|---|---|---|---|---|---|---|
| N | Hazard ratio | p value | N | Hazard ratio | p value | |
| ER status‐IHC | ||||||
| ER positive | 754 | 0.52 (0.26–1.04) | 0.06 | 2633 | 0.66 (0.49–0.87) | 0.0033 |
| ER negative | 520 | 0.48 (0.31–0.75) | 0.001 | 1190 | 0.58 (0.43–0.8) | 0.00063 |
| ER status‐array | ||||||
| ER positive | 1309 | 0.5 (0.34–0.74) | 0.00038 | 3768 | 0.42 (0.35–0.51) | <1e‐16 |
| ER negative | 570 | 0.5 (0.33–0.74) | 0.00047 | 1161 | 0.42 (0.33–0.54) | 3.1e‐12 |
| PR status‐IHC | ||||||
| PR positive | 156 | — | — | 926 | 0.67 (0.43–1.04) | 0.074 |
| PR negative | 291 | 0.43 (0.22–0.85) | 0.012 | 925 | 0.54 (0.38–0.76) | 0.00034 |
| HER2 status‐array | ||||||
| HER2 positive | 420 | 0.46 (0.28–0.76) | 0.0021 | 882 | 0.43 (0.32–0.59) | 2.6e‐08 |
| HER2 negative | 1459 | 0.51 (0.37–0.7) | 3.0e−05 | 4047 | 0.41 (0.34–0.49) | <1e‐16 |
| Intrinsic subtype | ||||||
| Basal | 404 | 0.51 (0.32–0.81) | 0.0035 | 846 | 0.37 (0.27–0.5) | 4.0e‐11 |
| Luminal A | 794 | 0.52 (0.32–0.87) | 0.010 | 2277 | 0.44 (0.35–0.56) | 1.1e‐11 |
| Luminal B | 515 | 0.41 (0.22–0.78) | 0.0048 | 1491 | 0.38 (0.28–0.51) | 1.3e‐10 |
| HER2+ | 166 | 0.44 (0.22–0.9) | 0.022 | 315 | 0.41 (0.23–0.75) | 0.0027 |
| Lymph node status | ||||||
| Lymph node positive | 452 | 0.5 (0.31–0.82) | 0.0047 | 1656 | 0.56 (0.44–0.71) | 1.6e‐06 |
| Lymph node negative | 726 | 0.68 (0.3–1.54) | 0.35 | 2368 | 0.65 (0.44–0.95) | 0.026 |
| Grade | ||||||
| 1 | 175 | 0.29 (0.03–3.23) | 0.28 | 397 | 1.72 (0.54–5.5) | 0.35 |
| 2 | 443 | 2.38 (0.75–7.5) | 0.13 | 1177 | 0.53 (0.32–0.9) | 0.016 |
| 3 | 586 | 0.53 (0.31–0.91) | 0.018 | 1300 | 0.5 (0.36–0.68) | 8.6e‐06 |
| TP53 status | ||||||
| Mutated | 130 | 3.04 (0.63–14.62) | 0.15 | 188 | 0.4 (0.2–0.79) | 0.0063 |
| Wild type | 197 | — | — | 273 | 2.25 (0.95–5.3) | 0.057 |
| Pietenpol subtype | ||||||
| Basal‐like1 | 103 | 0.36 (0.14–0.98) | 0.036 | 251 | 0.37 (0.21–0.66) | 0.00053 |
| Basal‐like2 | 58 | 2.25 (0.49–10.28) | 0.28 | 101 | 0.48 (0.23–1.01) | 0.047 |
| Immunomodulatory | 149 | 4.48 (0.97–20.74) | 0.036 | 300 | 0.54 (0.23–1.25) | 0.14 |
| Mesenchymal | 114 | 0.32 (0.12–0.84 | 0.015 | 211 | 0.38 (0.21–0.66) | 0.00043 |
| Mesenchymal stem‐like | 39 | 0.31 (0.1–0.98) | 0.035 | 81 | 0.38 (0.15–0.98) | 0.038 |
| Luminal androgen receptor | 116 | 0.28 (0.11–0.72) | 0.0052 | 253 | 0.31 (0.18–0.53) | 5.9e‐06 |
Bold values indicate p < 0.05.
3.4. CELF2 expression correlated with the immune infiltration in breast cancer and lung squamous cell carcinoma
Multiple studies have confirmed that CELF2 exerts tumour suppressive effects in most tumours, which is significantly increased in developing thymocytes and activated T cells, but its comprehensive understanding within the TME remains unknown. 16 , 17 , 18 , 19 , 20 , 21 , 22 , 23 , 24 , 25 , 26 Therefore, it is necessary to investigate the relationships between CELF2 expression and TIIC infiltration in the TME. In this study, we assessed the correlations of CELF2 expression with the abundance of TIICs in 39 tumour types from the TIMER database. A significant correlation was shown between CELF2 expression and tumour purity in 28 tumours (Figure 3 and Supplementary Figure 1). In addition, CELF2 expression was also significantly associated with infiltration levels of B cells in 25 cancers, CD4+ T cells in 29 cancers, CD8+ T cells in 33 cancers, macrophages and DCs in 29 cancers and neutrophils in 32 cancers (Figure 3 and Supplementary Figure 1).
FIGURE 3.

Correlations of CELF2 expression with immune infiltration levels in BRCA (breast invasive carcinoma), LUAD (lung adenocarcinoma) and LUSC (lung squamous cell carcinoma). (A) CELF2 expression is significantly negatively related to tumour purity and has moderate to strong positive correlations with infiltrating levels of CD8+ T cells, CD4+ T cells, macrophages, neutrophils and dendritic cells in BRCA, other than B cells. (B) CELF2 expression has very weak correlation with tumour purity and weak correlations with infiltrating levels of B cells, CD8+ T cells, CD4+ T cells, macrophages, neutrophils and dendritic cells in LUAD. (C) CELF2 expression is significantly negatively related to tumour purity and has moderate to strong positive correlations with infiltrating levels of B cells, CD8+ T cells, CD4+ T cells, macrophages, neutrophils and dendritic cells in LUSC
Given that CELF2 expression was significantly correlated with diverse levels of immune infiltration in most of cancer types and combined with the results of CELF2 expression and prognostic analysis in pan‐cancer, we selected subjects by setting the following criteria: (1) CELF2 was significantly up‐ or down‐regulated in Oncomine and TIMER database at the same time; (2) CELF2 had a consistent prognostic value in PrognoScan and Kaplan‐Meier plotter database; (3) CELF2 expression was negatively associated with tumour purity and correlated with more than two TIIC levels. Interestingly, we found that CELF2 expression was significantly related to a favourable prognosis and a high infiltration abundance of TIICs in breast and lung cancers. In BRCA, CELF2 expression had a significant moderate to strong positive correlation with the infiltration levels of B cells (r = 0.357, p = 1.14E‐30), CD8+ T cells (r = 0.643, p = 7.21E‐115), CD4+ T cells (r = 0.594, p = 1.03E‐92), macrophages (r = 0.485, p = 5.11E‐59), neutrophils (r = 0.677, p = 1.70E‐128) and DCs (r = 0.662, p = 5.18E‐121) (Figure 3A). Similarly, there were obviously positive correlations with the infiltration levels of B cells (r = 0.455, p = 1.53E‐25), CD8+ T cells (r = 0.468, p = 3.23E‐27), CD4+ T cells (r = 0.538, p = 6.32E‐37), macrophages (r = 0.511, p = 5.05E‐33), neutrophils (r = 0.51, p = 8.07E‐33) and DCs (r = 0.698, p = 2.20E‐70) in LUSC (Figure 3C). However, in LUAD, although the correlations between CELF2 with TIICs were also statistically significant, their correlations were very weak (Figure 3B). Of particular note where the correlation coefficients were greater than 0.6 between CELF2 with CD8+ T cells, DCs and neutrophils in BRCA, as well as DCs in LUSC, indicating CELF2 plays a crucial role in immune infiltration of these cells.
3.5. Expression correlations between CELF2 and immune marker sets
In view of the relationships between CELF2 expression and multiple TIIC infiltration levels in BRCA and LUSC, we further validated the correlations based on the marker gene sets of TIICs. We evaluated the correlations of CELF2 expression with marker levels in specific immune cell subsets, including CD8+ T cells, T cells (general), B cells, monocytes, TAMs, M1 and M2 macrophages, neutrophils, NK cells and DCs in BRCA and LUSC, using LUAD as a control (Table 2 and Figure 4). Considering the prominent role played by CELF2 during T‐cell development, we also focused on the correlations of CELF2 with different functional T cells such as Th1, Th2, Tfh, Th17, Treg and exhausted T cells. After adjusting for tumour purity, we found that CELF2 expression was still related to most of these marker sets, such as T‐cell markers (CD3E and CD2), monocyte markers (CD86 and CSF1R), TAM markers (CD68 and IL10), M2 macrophages markers (CD163 and MS4A4A) and DC markers (HLA‐DRA, HLA‐DPA1, NRP1 and ITGAX) in BRCA and LUSC (p < 0.0001 and r > 0.6; Figure 4A–J). In contrast, the majority of correlations between CELF2 and individual immune cell markers in LUAD were not statistically significant, and the rare statistically significant coefficients were also less than 0.3, suggesting a relatively weak correlations (Table 2 and Figure 4K–O).
TABLE 2.
Correlation analysis between CELF2 and relate genes and markers of immune cells in TIMER
| Description | Gene markers | BRCA | LUSC | LUAD | |||||||||
|---|---|---|---|---|---|---|---|---|---|---|---|---|---|
| None | Purity | None | Purity | None | Purity | ||||||||
| Cor | p | Cor | p | Cor | p | Cor | p | Cor | p | Cor | p | ||
| CD8+ T cell | CD8A | 0.605 | *** | 0.477 | *** | 0.595 | *** | 0.541 | *** | 0.21 | *** | 0.163 | ** |
| CD8B | 0.528 | *** | 0.392 | *** | 0.505 | *** | 0.483 | *** | 0.095 | 0.031 | 0.05 | 0.266 | |
| T cell (general) | CD3D | 0.573 | *** | 0.417 | *** | 0.605 | *** | 0.529 | *** | 0.167 | ** | 0.1 | 0.027 |
| CD3E | 0.62 | *** | 0.478 | *** | 0.687 | *** | 0.628 | *** | 0.318 | *** | 0.283 | *** | |
| CD2 | 0.621 | *** | 0.487 | *** | 0.677 | *** | 0.618 | *** | 0.295 | *** | 0.256 | *** | |
| B cell | CD19 | 0.447 | *** | 0.277 | *** | 0.521 | *** | 0.42 | *** | 0.196 | *** | 0.152 | ** |
| CD79A | 0.487 | *** | 0.312 | *** | 0.525 | *** | 0.422 | *** | 0.193 | *** | 0.151 | ** | |
| Monocyte | CD86 | 0.651 | *** | 0.58 | *** | 0.684 | *** | 0.631 | *** | 0.295 | *** | 0.247 | *** |
| CD115 (CSF1R) | 0.668 | *** | 0.58 | *** | 0.741 | *** | 0.698 | *** | 0.372 | *** | 0.335 | *** | |
| TAM | CCL2 | 0.496 | *** | 0.383 | *** | 0.506 | *** | 0.45 | *** | 0.138 | * | 0.09 | 0.045 |
| CD68 | 0.583 | *** | 0.512 | *** | 0.545 | *** | 0.476 | *** | 0.287 | *** | 0.247 | *** | |
| IL10 | 0.587 | *** | 0.504 | *** | 0.535 | *** | 0.479 | *** | 0.249 | *** | 0.19 | *** | |
| M1 macrophage | INOS (NOS2) | 0.234 | *** | 0.243 | *** | 0.15 | ** | 0.178 | *** | 0.154 | ** | 0.139 | * |
| IRF5 | 0.318 | *** | 0.25 | *** | 0.149 | ** | 0.126 | * | 0.155 | ** | 0.124 | * | |
| COX2 (PTGS2) | 0.491 | *** | 0.392 | *** | 0.086 | 0.056 | 0.024 | 0.6 | 0.066 | 0.135 | 0.073 | 0.105 | |
| M2 macrophage | CD163 | 0.598 | *** | 0.544 | *** | 0.703 | *** | 0.656 | *** | 0.378 | *** | 0.343 | *** |
| VSIG4 | 0.52 | *** | 0.442 | *** | 0.632 | *** | 0.577 | *** | 0.261 | *** | 0.22 | *** | |
| MS4A4A | 0.649 | *** | 0.567 | *** | 0.658 | *** | 0.602 | *** | 0.33 | *** | 0.284 | *** | |
| Neutrophils | CD66b (CEACAM8) | 0.02 | 0.502 | 0.045 | 0.157 | 0.167 | ** | 0.163 | ** | 0.287 | *** | 0.288 | *** |
| CD11b (ITGAM) | 0.535 | *** | 0.453 | *** | 0.715 | *** | 0.674 | *** | 0.344 | *** | 0.312 | *** | |
| CCR7 | 0.55 | *** | 0.391 | *** | 0.672 | *** | 0.614 | *** | 0.375 | *** | 0.346 | *** | |
| Natural killer cell | KIR2DL1 | 0.299 | *** | 0.204 | *** | 0.234 | *** | 0.191 | *** | 0.051 | 0.25 | 0.033 | 0.461 |
| KIR2DL3 | 0.303 | *** | 0.207 | *** | 0.312 | *** | 0.269 | *** | 0.073 | 0.099 | 0.03 | 0.511 | |
| KIR2DL4 | 0.338 | *** | 0.244 | *** | 0.252 | *** | 0.188 | *** | −0.057 | 0.198 | −0.102 | 0.024 | |
| KIR3DL1 | 0.38 | *** | 0.28 | *** | 0.421 | *** | 0.376 | *** | 0.12 | * | 0.09 | 0.045 | |
| KIR3DL2 | 0.408 | *** | 0.307 | *** | 0.352 | *** | 0.3 | *** | 0.098 | 0.027 | 0.041 | 0.358 | |
| KIR3DL3 | 0.201 | *** | 0.143 | *** | 0.106 | 0.017 | 0.093 | 0.042 | −0.012 | 0.785 | −0.034 | 0.451 | |
| KIR2DS4 | 0.285 | *** | 0.197 | *** | 0.291 | *** | 0.264 | *** | 0.117 | * | 0.085 | 0.058 | |
| Dendritic cell | HLA‐DPB1 | 0.572 | *** | 0.413 | *** | 0.781 | *** | 0.741 | *** | 0.394 | *** | 0.364 | *** |
| HLA‐DQB1 | 0.461 | *** | 0.327 | *** | 0.575 | *** | 0.51 | *** | 0.324 | *** | 0.291 | *** | |
| HLA‐DRA | 0.662 | *** | 0.559 | *** | 0.718 | *** | 0.668 | *** | 0.343 | *** | 0.304 | *** | |
| HLA‐DPA1 | 0.646 | *** | 0.535 | *** | 0.765 | *** | 0.725 | *** | 0.396 | *** | 0.368 | *** | |
| BDCA‐1 (CD1C) | 0.573 | *** | 0.428 | *** | 0.52 | *** | 0.42 | *** | 0.382 | *** | 0.351 | *** | |
| BDCA‐4 (NRP1) | 0.596 | *** | 0.518 | *** | 0.512 | *** | 0.441 | *** | 0.298 | *** | 0.285 | *** | |
| CD11c (ITGAX) | 0.622 | *** | 0.539 | *** | 0.695 | *** | 0.643 | *** | 0.319 | *** | 0.281 | *** | |
| Th1 | T‐bet (TBX21) | 0.584 | *** | 0.443 | *** | 0.687 | *** | 0.635 | *** | 0.278 | *** | 0.241 | *** |
| STAT4 | 0.671 | *** | 0.549 | *** | 0.654 | *** | 0.596 | *** | 0.281 | *** | 0.25 | *** | |
| STAT1 | 0.445 | *** | 0.417 | *** | 0.392 | *** | 0.347 | *** | 0.16 | ** | 0.129 | * | |
| IFN‐γ (IFNG) | 0.47 | *** | 0.357 | *** | 0.375 | *** | 0.328 | *** | 0.056 | 0.204 | 0.006 | 0.896 | |
| TNF‐α (TNF) | 0.313 | *** | 0.271 | *** | 0.293 | *** | 0.201 | *** | 0.136 | * | 0.077 | 0.086 | |
| Th2 | GATA3 | −0.246 | *** | −0.142 | *** | 0.391 | *** | 0.327 | *** | 0.227 | *** | 0.185 | *** |
| STAT6 | 0.223 | *** | 0.195 | *** | 0.226 | *** | 0.241 | *** | 0.394 | *** | 0.425 | *** | |
| STAT5A | 0.415 | *** | 0.311 | *** | 0.668 | *** | 0.62 | *** | 0.39 | *** | 0.363 | *** | |
| IL13 | 0.24 | *** | 0.185 | *** | 0.398 | *** | 0.367 | *** | 0.063 | 0.152 | 0.029 | 0.516 | |
| Tfh | BCL6 | 0.279 | *** | 0.277 | *** | 0.083 | 0.064 | 0.134 | * | 0.274 | *** | 0.276 | *** |
| IL21 | 0.372 | *** | 0.29 | *** | 0.39 | *** | 0.344 | *** | 0.105 | 0.017 | 0.082 | 0.068 | |
| Th17 | STAT3 | 0.36 | *** | 0.378 | *** | 0.355 | *** | 0.344 | *** | 0.444 | *** | 0.458 | *** |
| IL17A | 0.209 | *** | 0.124 | *** | 0.139 | * | 0.085 | 0.064 | 0.049 | 0.271 | 0.02 | 0.657 | |
| Treg | FOXP3 | 0.553 | *** | 0.46 | *** | 0.664 | *** | 0.603 | *** | 0.226 | *** | 0.188 | *** |
| CCR8 | 0.564 | *** | 0.512 | *** | 0.667 | *** | 0.613 | *** | 0.334 | *** | 0.308 | *** | |
| STAT5B | 0.349 | *** | 0.335 | *** | 0.371 | *** | 0.407 | *** | 0.434 | *** | 0.434 | *** | |
| TGFβ (TGFB1) | 0.446 | *** | 0.305 | *** | 0.182 | *** | 0.098 | 0.032 | 0.318 | *** | 0.289 | *** | |
| T‐cell exhaustion | PD‐1 (PDCD1) | 0.482 | *** | 0.325 | *** | 0.651 | *** | 0.592 | *** | 0.126 | * | 0.06 | 0.186 |
| CTLA‐4 | 0.529 | *** | 0.409 | *** | 0.626 | *** | 0.557 | *** | 0.21 | *** | 0.156 | ** | |
| LAG3 | 0.325 | *** | 0.227 | *** | 0.503 | *** | 0.448 | *** | 0.039 | 0.382 | −0.015 | 0.744 | |
| TIM‐3 (HAVCR2) | 0.624 | *** | 0.554 | *** | 0.709 | *** | 0.657 | *** | 0.276 | *** | 0.227 | *** | |
| GZMB | 0.47 | *** | 0.331 | *** | 0.463 | *** | 0.383 | *** | −0.03 | 0.491 | −0.101 | 0.025 | |
Abbreviations: BRCA, breast invasive carcinoma; Cor, R value of Spearman's correlation; LUAD, lung adenocarcinoma; LUSC, lung squamous cell carcinoma; None, correlation without adjustment; Purity, correlation adjusted by purity; TAM, tumour‐associated macrophage; Tfh, follicular helper T cell; Th, T‐helper cell; Treg, regulatory T cell.
*p < 0.01; **p < 0.001; *** p < 0.0001.
FIGURE 4.
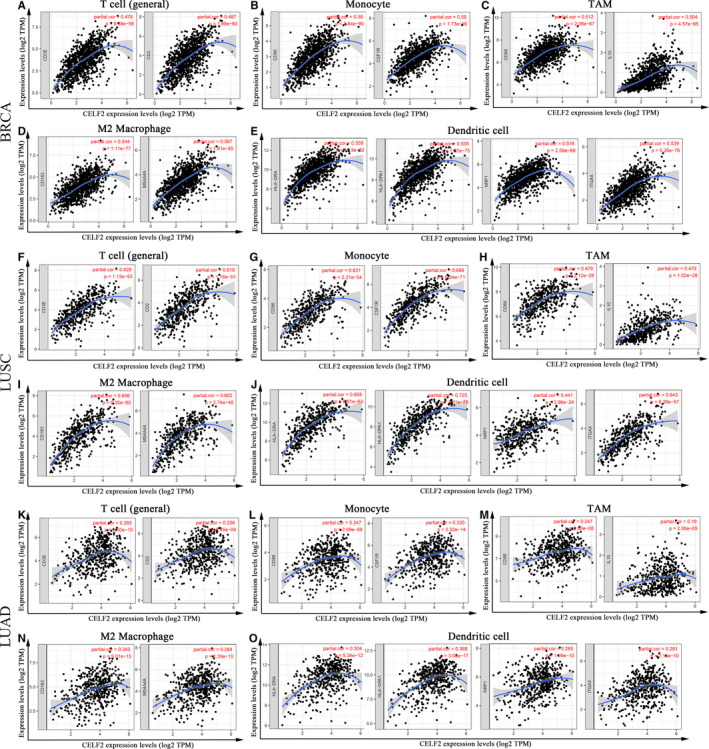
CELF2 expression correlated with immune marker sets in BRCA (breast invasive carcinoma), LUSC (lung squamous cell carcinoma) and LUAD (lung adenocarcinoma). Markers include CD3E and CD2 of T cell (general); CD86 and CSF1R of monocyte; CD68 and IL10 of TAM (tumour‐associated macrophage); CD163 and MS4A4A of M2 macrophage; HLA‐DRA, HLA‐DPA1, NRP1 and ITGAX of dendritic cell. (A–E) Scatterplots of correlations between CELF2 expression and gene markers of T cell (general) (A), monocyte (B), TAM (C), M2 macrophages (D) and dendritic cell (E) in BRCA. (F–J) Scatterplots of correlations between CELF2 expression and gene markers of T cell (general) (F), monocyte (G), TAM (H), M2 macrophages (I) and dendritic cell (J) in LUSC. (K–O) The LUAD as the control group showed that CELF2 expression has weak correlation with immune marker sets of T cell (general) (K), monocyte (L), TAM (M), M2 macrophages (N) and dendritic cell (O) in LUAD
We further assessed the relationships between CELF2 and these markers in BRCA, LUSC and LUAD using GEPIA, revealing similar correlations between CELF2 and T cell (general), monocyte, TAM, M2 macrophage and DC markers to those TIMER (Table 3). Previous studies have demonstrated that the proportion of TAMs in the TME and their polarization status have important effects on cancer growth, invasion, metastasis and drug resistance. 44 , 45 Our findings suggested that CELF2 might modulate BRCA and LUSC progression by affecting macrophage polarization. In addition, the above immune infiltration analysis revealed that elevated CELF2 expression had a strong correlation with increased CD8+ T cells, DCs and neutrophil infiltration in BRCA, and DC infiltration in LUSC. Consistently, the TIMER and GEPIA results also validated that DC markers such as HLA‐DRA, HLA‐DPA1, NRP1 and ITGAX were significantly correlated with CELF2. These results further indicated a strong relationship between CELF2 expression and DCs infiltration. Notably, the marker levels of Th1 (TBX21 and STAT4) and Treg (FOXP3 and CCR8) cells, which are primarily immunosuppressive, were also significantly associated with CELF2 expression. It has been shown that DCs promote tumour metastasis by decreasing CD8+ T‐cell cytotoxicity and enhancing Treg responses. 4 , 5 Recent studies have also showed that an autologous dendritic cell vaccine can kill breast cancer cells by polarizing the Th1 response, which raised new hopes for the treatment and prevention of breast cancer. 46 However, whether CELF2 mediates the progression and metastasis of BRCA and LUSC via affecting DC infiltration remains to be further investigated.
TABLE 3.
Correlation analysis between CELF2 and relate markers of T cell (general), monocyte, TAM, M2 macrophage and DC in GEPIA
| Description | Gene markers | BRCA | LUSC | LUAD | |||||||||
|---|---|---|---|---|---|---|---|---|---|---|---|---|---|
| Tumour | Normal | Tumour | Normal | Tumour | Normal | ||||||||
| Cor | p | Cor | p | Cor | p | Cor | p | Cor | p | Cor | p | ||
| T cell (general) | CD3D | 0.53 | *** | −0.48 | *** | 0.56 | *** | −0.33 | 0.019 | 0.1 | 0.021 | −0.16 | 0.23 |
| CD3E | 0.6 | *** | −0.45 | *** | 0.66 | *** | −0.1 | 0.48 | 0.27 | *** | 0.19 | 0.15 | |
| CD2 | 0.6 | *** | −0.38 | *** | 0.66 | *** | −0.052 | 0.72 | 0.25 | *** | 0.045 | 0.74 | |
| Monocyte | CD86 | 0.66 | *** | 0.59 | *** | 0.67 | *** | 0.18 | 0.2 | 0.29 | *** | −0.07 | 0.6 |
| CD115 (CSF1R) | 0.66 | *** | 0.49 | *** | 0.74 | *** | 0.27 | 0.063 | 0.37 | *** | 0.16 | 0.24 | |
| TAM | CCL2 | 0.48 | *** | 0.34 | ** | 0.5 | *** | −0.0066 | 0.96 | 0.15 | * | 0.14 | 0.29 |
| CD68 | 0.6 | *** | 0.59 | *** | 0.53 | *** | 0.18 | 0.2 | 0.31 | *** | 0.039 | 0.77 | |
| IL10 | 0.59 | *** | 0.62 | *** | 0.52 | *** | −0.14 | 0.33 | 0.24 | *** | 0.058 | 0.66 | |
| M2 macrophage | CD163 | 0.52 | *** | 0.61 | *** | 0.67 | *** | 0.25 | 0.085 | 0.27 | *** | 0.03 | 0.82 |
| VSIG4 | 0.5 | *** | 0.57 | *** | 0.64 | *** | 0.13 | 0.37 | 0.26 | *** | −0.15 | 0.27 | |
| MS4A4A | 0.64 | *** | 0.67 | *** | 0.65 | *** | 0.049 | 0.74 | 0.33 | *** | −0.17 | 0.21 | |
| Dendritic cell | HLA‐DPB1 | 0.58 | *** | −0.29 | * | 0.77 | *** | −0.17 | 0.24 | 0.37 | *** | −0.048 | 0.72 |
| HLA‐DQB1 | 0.34 | *** | −0.091 | 0.34 | 0.41 | *** | −0.13 | 0.36 | 0.23 | *** | 0.084 | 0.52 | |
| HLA‐DRA | 0.65 | *** | 0.044 | 0.64 | 0.71 | *** | −0.16 | 0.27 | 0.33 | *** | −0.27 | 0.038 | |
| HLA‐DPA1 | 0.64 | *** | 0.028 | 0.77 | 0.75 | *** | 0.25 | 0.078 | 0.39 | *** | 0.21 | 0.1 | |
| BDCA‐1 (CD1C) | 0.55 | *** | 0.069 | 0.47 | 0.49 | *** | −0.032 | 0.83 | 0.37 | *** | −0.2 | 0.13 | |
| BDCA‐4 (NRP1) | 0.62 | *** | 0.85 | *** | 0.5 | *** | 0.53 | *** | 0.34 | *** | 0.47 | ** | |
| CD11C (ITGAX) | 0.61 | *** | 0.11 | 0.26 | 0.63 | *** | 0.2 | 0.17 | 0.27 | *** | 0.13 | 0.34 | |
Abbreviations: BRCA, breast invasive carcinoma; LUAD, lung adenocarcinoma; LUSC, lung squamous cell carcinoma; Normal, correlation analysis in normal tissue of TCGA; TAM, tumour‐associated macrophage; Tumour, correlation analysis in tumour tissue of TCGA.
*p < 0.01; **p < 0.001; ***p < 0.0001.
3.6. Correlations between CELF2 expression and the responses to immunotherapy
The above showed that CELF2 expression was significantly associated with marker gene sets of T‐cell exhaustion, such as PD‐1, CTLA‐4 and TIM‐3, implying that CELF2 might play crucial roles in immune tolerance and immune evasion (Table 2). We further explored the relationships between CELF2 and ICMs, including BTLA, CD274, CD40, CD47, CD8A, CD8B, CTLA‐4, GZMB, TIM‐3 (HAVCR2), ICOS, IDO1, IFNG, LAG3, PDCD1, PDCD1LG2 and TIGIT. 12 , 35 , 36 The results revealed that CELF2 expression was significantly positively correlated with the expression of these molecules in BRCA and LUSC (Figure 5A). In addition, we also observed the significant correlations between CELF2 and ICM expression in urinary system tumours such as BLCA, KIRC and kidney renal papillary cell carcinoma (KIRP), as well as digestive system tumours such as esophageal carcinoma (ESCA), liver hepatocellular carcinoma (LIHC), pancreatic adenocarcinoma (PAAD) and STAD. These results suggested the possibility of CELF2 as a potential biomarker for ICI‐directed immunotherapies.
FIGURE 5.
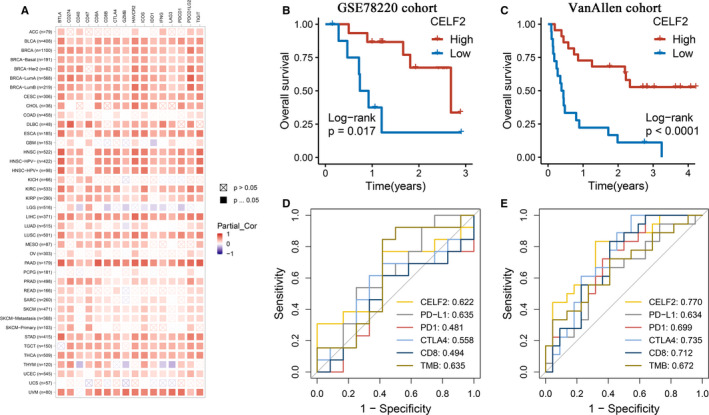
Correlations between CELF2 and immune checkpoint molecules (ICMs) as well as the responses to immunotherapy in a variety of tumours. (A) Spearman correlations between CELF2 expression and the expression of ICMs in different cancer types after adjusting for tumour purity. (B, C) Kaplan‐Meier survival analysis of high CELF2 and low CELF2 group in GSE78220 cohort (B) and Van Allen cohort (C). (D, E) The ROC curves and AUC values of CELF2 and five other biomarkers for predicting immunotherapeutic response in GSE78220 cohort (D) and Van Allen cohort (E)
To further investigate whether CELF2 could accurately predict the efficacy to immunotherapy, we enrolled two immunotherapeutic cohorts receiving anti‐PD‐1 therapy. Interestingly, patients with high CELF2 showed significantly prolonged OS in the two cohorts (Figure 5B,C). We then included the other five widely used immunotherapeutic biomarkers, including PD‐1, PD‐L1, CTLA‐4, CD8 and TMB. In the GSE78220 cohort of 38 patients, CELF2 (AUC = 0.622) showed similar predictive power as PD‐L1 (AUC = 0.635) and TMB (AUC = 0.635), better than CTLA‐4, CD8 and PD‐1 (AUC = 0.558, 0.494 and 0.481, respectively; Figure 5D). In addition, in another larger Van Allen cohort of 144 patients, the AUC of CELF2 reached 0.770, which was higher than that of CTLA‐4, CD8, PD‐1, TMB and PD‐L1 (AUC = 0.735, 0.712, 0.699, 0.672 and 0.634, respectively; Figure 5E). Overall, our study strongly confirmed that CELF2 could be used to evaluate prognosis and responses to immunotherapy in cancer patients and is superior to remaining prevalent biomarkers.
3.7. Experimental verification of CELF2 expression and prognosis in TNBC and LUSC tissue microarrays
The above analysis suggested that CELF2 has significant prognostic significance in TNBC and LUSC, and is closely related to the TME and immunotherapy efficacy. We further used TNBC (n = 80) and LUSC (n = 90) tissue microarrays combined with immunohistochemistry for experimental validation at the protein level. The results showed that the protein expression levels of CELF2 in TNBC and LUSC were significantly reduced compared with the normal tissues (Figure 6A–D). In the TNBC tissue microarray, 44 patients (55%) were classified as the high CELF2 expression group and 36 patients (45%) as the low CELF2 expression group according to the optimal cut‐off point of the pathological score, and survival analysis revealed that TNBC patients with high CELF2 expression had longer OS (p = 0.004; Figure 6E). Similarly, the results of LUSC tissue microarray also indicated that the OS of LUSC patients with high CELF2 expression was significantly prolonged (p = 0.0018; Figure 6F). Collectively, these two independent cohorts highlight the significant prognostic significance of CELF2 in TNBC and LUSC, and the potential possibility of being a candidate biomarker.
FIGURE 6.
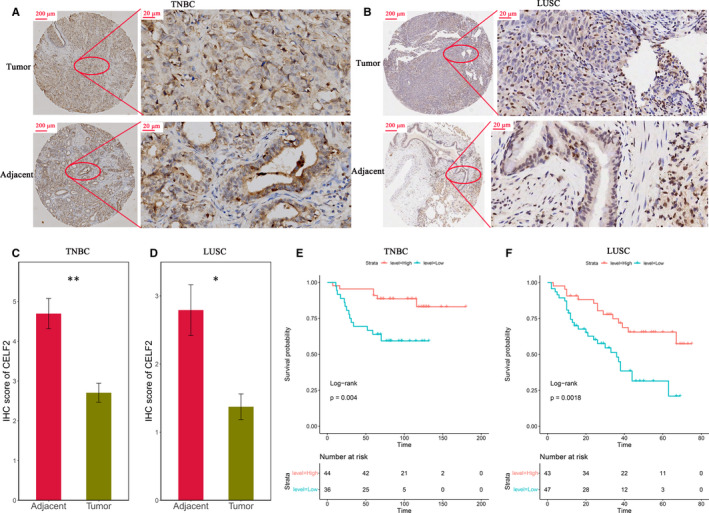
CELF2 was down‐regulated in triple‐negative breast cancer (TNBC) and lung squamous cell carcinoma (LUSC), as well as predicted better prognosis. (A, B) Representative immunohistochemistry (IHC) staining images of TNBC (A) and LUSC (B) tissue microarrays in tumour tissues and paired adjacent tissues (scale bar: 200 and 20 μm). (C, D) Analysis of IHC scores in TNBC (C) and LUSC (D) tissue microarrays according to CELF2 staining results. (E, F) Survival rates of tumour patients with high and low protein levels of CELF2 in TNBC (E) and LUSC (F) tissue microarrays. Kaplan‐Meier method was used to analyse the overall survival (*p < 0.05, **p < 0.01).
4. DISCUSSION
In this study, we systematically summarized the expression levels and prognostic value of CELF2 in diverse cancer types using Oncomine and TIMER database, revealing prominent differences between tumours and adjacent normal tissues. Oncomine analysis showed elevated CELF2 expression in colorectal, gastric, kidney, leukaemia, liver and melanoma cancers compared with matched normal tissues, whereas CELF2 expression was down‐regulated in bladder, brain and central nervous system, breast, head and neck, lung, lymphoma, ovarian, prostate and sarcoma cancers (Figure 1A). Based on the RNA‐seq data from the TCGA database, we found that CELF2 expression was significantly down‐regulated in BLCA, BRCA, COAD, HNSC, LUAD, LUSC, PRAD, READ, STAD, THCA and UCEC relative to their respective adjacent normal tissues, whereas significantly up‐regulated of CELF2 expression was only found in CHOL, KICH and KIRC (Figure 1B). The inconsistent results of the same cancer in different data sets may be due to the different approaches of data collection in different studies, or the fact that tumours at the same anatomical site contains various histological types in Oncomine database. However, in PrognoScan and Kaplan‐Meier plotter database, we consistently observed that increased CELF2 expression was associated with better prognosis in breast and lung cancer. Analysis using Kaplan‐Meier plotter indicated that elevated CELF2 expression correlated with significantly prolonged survival in both breast and lung cancer (Figure 2M–P). Similarly, there were 24 and 15 cohorts in PrognoScan database, respectively, that showed CELF2 could serve as a predictor of favourable prognosis in breast and lung cancers (Supplementary Table 2). This was consistent with our immunohistochemistry results (Figure 6). Furthermore, high CELF2 expression was associated with significantly prolonged OS and RFS of breast cancer patients with ER, PR and HER2 negative, lymph node metastasis and higher grade. Notably, CELF2 expression was much higher in basal‐like breast cancer (also known as TNBC) than in luminal and HER2 subtype (Figure 1B). Briefly, these findings supported that CELF2 was a potential prognostic biomarker in breast and lung cancers, and might influence TNBC development and metastasis.
Another key finding of this study was that CELF2 expression correlated with diverse levels of immune infiltration in multiple cancer types, and especially in BRCA and LUSC. Our results demonstrated strong positive relationships between CELF2 expression and the infiltration levels of DCs, CD8+ T cells and neutrophils in BRCA; meanwhile, CELF2 in LUSC was strongly positively correlated with DCs (Figure 3A,C). However, we found that CELF2 expression was weakly correlated with the levels of B cells, CD8+ T cells, CD4+ T cells, macrophages, neutrophils and DCs in LUAD (Figure 3B). These results indicated that CELF2 expression and the levels of immune infiltration were closely correlated in BRCA and LUSC, but not in LUAD. In addition, we simultaneously observed significant correlation between CELF2 and certain immunological markers using TIMER and GEPIA database, hinting that CELF2 could regulate TIIC infiltration and interaction within the TME in BRCA and LUSC (Tables 2 and 3). For example, the markers of monocytes (CD86 and CSF1R) and M2 macrophages (CD163 and MS4A4A) showed strong correlations with CELF2, while TAM markers (CCL2, CD68 and IL10) showed moderate correlations (Tables 2 and 3). These results revealed a potential role of CELF2 in modulating TAM polarization. Remarkably, immune infiltration and immune marker set analysis consistently showed a strong correlation between CELF2 and DCs in BRCA and LUSC (Figure 3A,C, Tables 2 and 3). Combined with the indispensable role of DCs in anti‐tumour immunity and the promising future of DC vaccines in tumour treatment, we are confident that clarifying the mechanism by which CELF2 interacts with DCs in the TME may provide a new target for immunotherapy. 46 , 47 , 48
Moreover, we further found that CELF2 in BRCA and LUSC were moderately to strongly correlated with the main immunosuppressive Th1 and Treg cell marker sets (TBX21 and STAT4; FOXP3 and CCR8) as well as T‐cell exhaustion markers (PD‐1, CTLA‐4 and TIM‐3) within the TME (Tables 2 and 3). These results might indicate that CELF2 could regulate T cell‐mediated immunity via Treg and Th1 cell in BRCA and LUSC. Given the lack of reliable diagnostic and prognostic biomarkers as well as therapeutic targets, TNBC and LUSC treatment remains challenging, whereas immunotherapy offers patients new hope. 7 , 8 A recent phase III clinical study on advanced TNBC showed that the levels of stromal tumour‐infiltrating lymphocytes (sTILs) were correlated with PD‐L1 status, and obvious improvements in the efficacy of immunotherapy were observed only in CD8+ and sTILs+ patients who were also PD‐L1+. 40 Of particular interest was the significant positive correlations between CELF2 and ICMs in BRCA, LUSC as well as digestive and urinary tumours (Figure 5A). Further exploration also demonstrated that CELF2 was more accurate than five prevalent indicators including PD‐1, PD‐L1, CTLA‐4, CD8 and TMB in predicting the responses to immunotherapy, hinting that CELF2 was a promising biomarker for selecting immunotherapy‐sensitive patients (Figure 5D,E).
To the best of our knowledge, our study is the first to systematically address the expression and prognostic landscape of CELF2, which plays an indispensable in RNA processing, and to explore its potential relationship with immune infiltration in pan‐cancer. Second, we comprehensively analysed a large amount of data from the multiple public databases and our two tissue microarrays and validated the results by integrating immune infiltration analysis and correlation analysis of immune marker sets to increase the reliability of our conclusions. Most importantly, we confirmed that CELF2 could effectively predict the prognosis and responses to immunotherapy in TNBC and LUSC patients, and had significant clinical translational value for TNBC and LUSC that owing poor prognosis due to lack of effective biomarkers and targets. Nevertheless, this study also had several limitations. For example, although we found that CELF2 expression was associated with the abundance of TIIC infiltration in BRCA and LUSC patients, we could not conclude whether CELF2 directly affected patient survival through immune infiltration. To overcome these limitations, future detailed molecular and cellular mechanistic studies of CELF2 and prospective studies including CELF2 expression, immune cells infiltration, and efficacy of immunotherapy in tumour patients will help provide clear answers.
In summary, elevated CELF2 expression is correlated with better prognosis and higher TIIC infiltration in a variety of tumours. Especially, for BRCA and LUSC, CELF2 may contribute to TAM polarization, participate in the interaction between DCs and TME, and regulate immune tolerance and immune escape through Treg and Th1 cells. Furthermore, we demonstrated that CELF2 is strongly correlated with ICMs in various tumours, and significantly outperforms five prevalent biomarkers in predicting the responses to immunotherapy. Therefore, CELF2 may be a crucial regulator of tumour immune cell infiltration and serve as a prognostic and immunotherapeutic biomarker in TNBC and LUSC.
CONFLICT OF INTEREST
The authors declare that they have no conflict of interest.
AUTHOR CONTRIBUTIONS
YLS, XWH, JZ and LFL: Research design. LBW and ZQL: Data mining and data analysis. LL, CGG and DCJ: Assistance with data mining and data analysis. LBW, ZQL and LFL: Writing the manuscript. LBW, ZQL, XWH and YLS: Editing and revision of the manuscript. All authors approved the final version of the manuscript.
ETHICAL APPROVAL
The procedures used in the present study were approved (approval no. YB M‑05‑02 V.2) by the Ethics Committee of the Shanghai Outdo Biotech Company, a member of the National Human Genetic Resources Sharing Service Platform (Shanghai, China) and were performed in accordance with the ethical standards of the Institutional and National Research Committee and with the Declaration of Helsinki. Written informed consent was acquired from all patients.
Supporting information
Supplementary Material
ACKNOWLEDGEMENT
This study was supported by the collaborative Innovation Major Project of Zhengzhou (Grant No. 20XTZX08017), National Natural Science Foundation of China (Grant Nos. 81870457 and 82002433), Science and Technology Project of Henan Provincial Department of Education (Grant No. 21A320036), Young and Middle‐aged Health Science and Technology Innovation Talents in 2020(Grant No. YXKC2020049) and Henan Province Medical Science and Technology Research Project Joint Construction Project (Grant Nos. LHGJ20190003 and LHGJ20190055).
Wang L, Liu Z, Liu L, et al. CELF2 is a candidate prognostic and immunotherapy biomarker in triple‐negative breast cancer and lung squamous cell carcinoma: A pan‐cancer analysis. J Cell Mol Med. 2021;25:7559–7574. 10.1111/jcmm.16791
Libo Wang and Zaoqu Liu contributed equally to this study.
Contributor Information
Lifeng Li, Email: lilifeng0317@163.com.
Jie Zhao, Email: jiezhaoz2016@163.com.
Xinwei Han, Email: fcchanxw@zzu.edu.cn.
Yuling Sun, Email: ylsun@zzu.edu.cn.
DATA AVAILABILITY STATEMENT
All data generated or analysed during this study are included in this article.
REFERENCES
- 1. Siegel RL, Miller KD, Fuchs HE, Jemal A. Cancer statistics, 2021. CA Cancer J Clin. 2021;71(1):7‐33. [DOI] [PubMed] [Google Scholar]
- 2. Paijens ST, Vledder A, de Bruyn M, Nijman HW. Tumor‐infiltrating lymphocytes in the immunotherapy era. Mol Immunol. 2020;18(4):842‐859. [DOI] [PMC free article] [PubMed] [Google Scholar]
- 3. Li X, Liu R, Su X, et al. Harnessing tumor‐associated macrophages as aids for cancer immunotherapy. Mol Cancer. 2019;18(1):177. [DOI] [PMC free article] [PubMed] [Google Scholar]
- 4. Sawant A, Hensel JA, Chanda D, et al. Depletion of plasmacytoid dendritic cells inhibits tumor growth and prevents bone metastasis of breast cancer cells. J Immunol. 2012;189(9):4258‐4265. [DOI] [PMC free article] [PubMed] [Google Scholar]
- 5. Sisirak V, Faget J, Gobert M, et al. Impaired IFN‐alpha production by plasmacytoid dendritic cells favors regulatory T‐cell expansion that may contribute to breast cancer progression. Cancer Res. 2012;72(20):5188‐5197. [DOI] [PubMed] [Google Scholar]
- 6. Jenkins RW, Fisher DE. Treatment of advanced melanoma in 2020 and beyond. J Invest Dermatol. 2021;141(1):23‐31. [DOI] [PMC free article] [PubMed] [Google Scholar]
- 7. Yang CY, Yang JC, Yang PC. Precision management of advanced non‐small cell lung cancer. Annu Rev Med. 2020;71:117‐136. [DOI] [PubMed] [Google Scholar]
- 8. Keenan TE, Tolaney SM. Role of immunotherapy in triple‐negative breast cancer. J Natl Compr Canc Netw. 2020;18(4):479‐489. [DOI] [PubMed] [Google Scholar]
- 9. Wu Z, Liu J, Dai R, Wu S. Current status and future perspectives of immunotherapy in bladder cancer treatment. Sci China Life Sci. 2021;64(4):512‐533. [DOI] [PubMed] [Google Scholar]
- 10. Jiang G‐M, Tan Y, Wang H, et al. The relationship between autophagy and the immune system and its applications for tumor immunotherapy. Mol Cancer. 2019;18(1):17. [DOI] [PMC free article] [PubMed] [Google Scholar]
- 11. Liu Z, Liu L, Lu T, et al. Hypoxia molecular characterization in hepatocellular carcinoma identifies one risk signature and two nomograms for clinical management. J Oncol. 2021;2021:1‐20. [DOI] [PMC free article] [PubMed] [Google Scholar]
- 12. Liu Z, Wang L, Liu L, et al. The identification and validation of two heterogenous subtypes and a risk signature based on ferroptosis in hepatocellular carcinoma. Front Oncol. 2021;11:619242. [DOI] [PMC free article] [PubMed] [Google Scholar]
- 13. Liu Z, Wang L, Guo C, et al. TTN/OBSCN ‘Double‐Hit’ predicts favourable prognosis, ‘immune‐hot’ subtype and potentially better immunotherapeutic efficacy in colorectal cancer. J Cell Mol Med. 2021;25(7):3239‐3251. [DOI] [PMC free article] [PubMed] [Google Scholar]
- 14. Dasgupta T, Ladd AN. The importance of CELF control: molecular and biological roles of the CUG‐BP, Elav‐like family of RNA‐binding proteins. Wiley Interdiscip Rev RNA. 2012;3(1):104‐121. [DOI] [PMC free article] [PubMed] [Google Scholar]
- 15. Chatrikhi R, Mallory MJ, Gazzara MR, et al. RNA binding protein CELF2 regulates signal‐induced alternative polyadenylation by competing with enhancers of the polyadenylation machinery. Cell Rep. 2019;28(11):2795‐2806.e3. [DOI] [PMC free article] [PubMed] [Google Scholar]
- 16. Piqué L, Martinez de Paz A, Piñeyro D, et al. Epigenetic inactivation of the splicing RNA‐binding protein CELF2 in human breast cancer. Oncogene. 2019;38(45):7106‐7112. [DOI] [PubMed] [Google Scholar]
- 17. Yeung YT, Fan S, Lu B, et al. CELF2 suppresses non‐small cell lung carcinoma growth by inhibiting the PREX2‐PTEN interaction. Carcinogenesis. 2020;41(3):377‐389. [DOI] [PMC free article] [PubMed] [Google Scholar]
- 18. Chang YS, Tu SJ, Chiang HS, et al. Genome‐wide analysis of prognostic alternative splicing signature and splicing factors in lung adenocarcinoma. Genes (Basel). 2020;11(11):1300. [DOI] [PMC free article] [PubMed] [Google Scholar]
- 19. Wu JZ, Jiang N, Lin JM, Liu X. STYXL1 promotes malignant progression of hepatocellular carcinoma via downregulating CELF2 through the PI3K/Akt pathway. Eur Rev Med Pharmacol Sci. 2020;24(6):2977‐2985. [DOI] [PubMed] [Google Scholar]
- 20. Wang J, Liu L, Sun Y, et al. miR‐615‐3p promotes proliferation and migration and inhibits apoptosis through its potential target CELF2 in gastric cancer. Biomed Pharmacother. 2018;101:406‐413. [DOI] [PubMed] [Google Scholar]
- 21. Guo Q, Wu Y, Guo X, et al. The RNA‐binding protein CELF2 inhibits ovarian cancer progression by stabilizing FAM198B. Mol Ther Nucleic Acids. 2021;23:169‐184. [DOI] [PMC free article] [PubMed] [Google Scholar]
- 22. Fan BO, Jiao BH, Fan FS, et al. Downregulation of miR‐95‐3p inhibits proliferation, and invasion promoting apoptosis of glioma cells by targeting CELF2. Int J Oncol. 2015;47(3):1025‐1033. [DOI] [PubMed] [Google Scholar]
- 23. Shi M, Yang R, Lin J, et al. LncRNA‐SNHG16 promotes proliferation and migration of acute myeloid leukemia cells via PTEN/PI3K/AKT axis through suppressing CELF2 protein. J Biosci. 2021;46(1):4. [PubMed] [Google Scholar]
- 24. Martinez NM, Agosto L, Qiu J, et al. Widespread JNK‐dependent alternative splicing induces a positive feedback loop through CELF2‐mediated regulation of MKK7 during T‐cell activation. Genes Dev. 2015;29(19):2054‐2066. [DOI] [PMC free article] [PubMed] [Google Scholar]
- 25. Mallory MJ, Jackson J, Weber B, Chi A, Heyd F, Lynch KW. Signal‐ and development‐dependent alternative splicing of LEF1 in T cells is controlled by CELF2. Mol Cell Biol. 2011;31(11):2184‐2195. [DOI] [PMC free article] [PubMed] [Google Scholar]
- 26. Mallory MJ, Allon SJ, Qiu J, et al. Induced transcription and stability of CELF2 mRNA drives widespread alternative splicing during T‐cell signaling. Proc Natl Acad Sci U S A. 2015;112(17):E2139‐E2148. [DOI] [PMC free article] [PubMed] [Google Scholar]
- 27. Rhodes DR, Kalyana‐Sundaram S, Mahavisno V, et al. Oncomine 3.0: genes, pathways, and networks in a collection of 18,000 cancer gene expression profiles. Neoplasia. 2007;9(2):166‐180. [DOI] [PMC free article] [PubMed] [Google Scholar]
- 28. Mizuno H, Kitada K, Nakai K, Sarai A. PrognoScan: a new database for meta‐analysis of the prognostic value of genes. BMC Med Genomics. 2009;2:18. [DOI] [PMC free article] [PubMed] [Google Scholar]
- 29. Nagy A, Lanczky A, Menyhart O, Gyorffy B. Validation of miRNA prognostic power in hepatocellular carcinoma using expression data of independent datasets. Sci Rep. 2018;8(1):9227. [DOI] [PMC free article] [PubMed] [Google Scholar]
- 30. Li T, Fan J, Wang B, et al. TIMER: a web server for comprehensive analysis of tumor‐infiltrating immune cells. Cancer Res. 2017;77(21):e108‐e110. [DOI] [PMC free article] [PubMed] [Google Scholar]
- 31. Siemers NO, Holloway JL, Chang H, et al. Genome‐wide association analysis identifies genetic correlates of immune infiltrates in solid tumors. PLoS One. 2017;12(7):e0179726. [DOI] [PMC free article] [PubMed] [Google Scholar]
- 32. Danaher P, Warren S, Dennis L, et al. Gene expression markers of tumor infiltrating leukocytes. J Immunother Cancer. 2017;5:18. [DOI] [PMC free article] [PubMed] [Google Scholar]
- 33. Sousa S, Maatta J. The role of tumour‐associated macrophages in bone metastasis. J Bone Oncol. 2016;5(3):135‐138. [DOI] [PMC free article] [PubMed] [Google Scholar]
- 34. Li T, Fu J, Zeng Z, et al. TIMER2.0 for analysis of tumor‐infiltrating immune cells. Nucleic Acids Res. 2020;48(W1):W509‐W514. [DOI] [PMC free article] [PubMed] [Google Scholar]
- 35. Qin S, Xu L, Yi M, Yu S, Wu K, Luo S. Novel immune checkpoint targets: moving beyond PD‐1 and CTLA‐4. Mol Cancer. 2019;18(1):155. [DOI] [PMC free article] [PubMed] [Google Scholar]
- 36. Marin‐Acevedo JA, Dholaria B, Soyano AE, Knutson KL, Chumsri S, Lou Y. Next generation of immune checkpoint therapy in cancer: new developments and challenges. J Hematol Oncol. 2018;11(1):39. [DOI] [PMC free article] [PubMed] [Google Scholar]
- 37. Tang Z, Li C, Kang B, Gao G, Li C, Zhang Z. GEPIA: a web server for cancer and normal gene expression profiling and interactive analyses. Nucleic Acids Res. 2017;45(W1):W98‐W102. [DOI] [PMC free article] [PubMed] [Google Scholar]
- 38. Hugo W, Zaretsky JM, Sun LU, et al. Genomic and transcriptomic features of response to anti‐PD‐1 therapy in metastatic melanoma. Cell. 2016;165(1):35‐44. [DOI] [PMC free article] [PubMed] [Google Scholar]
- 39. Liu D, Schilling B, Liu D, et al. Integrative molecular and clinical modeling of clinical outcomes to PD1 blockade in patients with metastatic melanoma. Nat Med. 2019;25(12):1916‐1927. [DOI] [PMC free article] [PubMed] [Google Scholar]
- 40. Emens LA, Molinero L, Loi S, et al. Atezolizumab and nab‐paclitaxel in advanced triple‐negative breast cancer: biomarker evaluation of the IMpassion130 Study. J Natl Cancer Inst. 2021. 10.1093/jnci/djab004 [DOI] [PMC free article] [PubMed] [Google Scholar]
- 41. Perez‐Ruiz E, Melero I, Kopecka J, Sarmento‐Ribeiro AB, Garcia‐Aranda M, De Las RJ. Cancer immunotherapy resistance based on immune checkpoints inhibitors: targets, biomarkers, and remedies. Drug Resist Updat. 2020;53:100718. [DOI] [PubMed] [Google Scholar]
- 42. Liu Z, Zhang Y, Shi C, et al. A novel immune classification reveals distinct immune escape mechanism and genomic alterations: implications for immunotherapy in hepatocellular carcinoma. J Transl Med. 2021;19(1):5. [DOI] [PMC free article] [PubMed] [Google Scholar]
- 43. Denkert C, Liedtke C, Tutt A, von Minckwitz G. Molecular alterations in triple‐negative breast cancer—the road to new treatment strategies. Lancet. 2017;389(10087):2430‐2442. [DOI] [PubMed] [Google Scholar]
- 44. Qiu SQ, Waaijer SJH, Zwager MC, de Vries EGE, van der Vegt B, Schroder CP. Tumor‐associated macrophages in breast cancer: innocent bystander or important player? Cancer Treat Rev. 2018;70:178‐189. [DOI] [PubMed] [Google Scholar]
- 45. Väyrynen JP, Haruki K, Lau MC, et al. The prognostic role of macrophage polarization in the colorectal cancer microenvironment. Cancer Immunol Res. 2021;9(1):8‐19. [DOI] [PMC free article] [PubMed] [Google Scholar]
- 46. Tomasicchio M, Semple L, Esmail A, et al. An autologous dendritic cell vaccine polarizes a Th‐1 response which is tumoricidal to patient‐derived breast cancer cells. Cancer Immunol Immunother. 2019;68(1):71‐83. [DOI] [PMC free article] [PubMed] [Google Scholar]
- 47. Antonios JP, Soto H, Everson RG, et al. PD‐1 blockade enhances the vaccination‐induced immune response in glioma. JCI Insight. 2016;1(10):e87059. [DOI] [PMC free article] [PubMed] [Google Scholar]
- 48. Wculek SK, Cueto FJ, Mujal AM, Melero I, Krummel MF, Sancho D. Dendritic cells in cancer immunology and immunotherapy. Nat Rev Immunol. 2020;20(1):7‐24. [DOI] [PubMed] [Google Scholar]
Associated Data
This section collects any data citations, data availability statements, or supplementary materials included in this article.
Supplementary Materials
Supplementary Material
Data Availability Statement
All data generated or analysed during this study are included in this article.