Abstract
As the field of metabolomics develops further, investigations of how the metabolome is affected following thermal injury may be helpful to inform diagnostics and guide treatments. In this study, changes to the metabolome were tested and validated in a murine burn injury model. After a 30% total body surface scald injury or sham procedure sera and skin biopsies were collected at 1, 2, 6, or 24 hr.
Burn-specific changes in the metabolome were detected compared to sham animals. The sera metabolome exhibited a more rapid response to burn injury than that of the skin and it peaked more proximal to injury (6 vs 24 hr). Progression of metabolic response in the skin was less synchronous and showed a higher overlap of the significantly modified metabolites (SMMs) among tested time-points. Top affected pathways identified by SMMs of skin included inositol phosphate metabolism, ascorbate and alderate metabolism, caffeine metabolism, and the pentose phosphate pathway. Future research is warranted in human and larger animal models to further elucidate the role of metabolomic perturbations and the pathophysiology following burn injury.
Burn injuries remain a global health problem, contributing to more than 180,000 deaths annually.1 In the United States, the number of deaths from burn injuries decreased from 9000 per year in the mid-1970s to less than 3800 per year in the early 2000s.2 With this reduction in mortality, innovation and research have pivoted to focus on the reduction of morbidity and improved outcomes in those suffering from thermal injury.
Driven largely by Herndon and colleagues a new focus on modulating metabolism with pharmacotherapy has led to practice advances and improved outcomes. Specifically, the use of propranolol with or without oxandrolone to blunt the hypermetabolic response has shown to decrease the length of critical illness,3 improve wound healing outcomes,4 reverse growth arrest,5 halt muscle wasting,6 and improve long-term outcomes such as scar phenotype.7
Clearly, the modulation of metabolism is important to long-term outcomes and more research is needed to better customize therapy on a patient-to-patient specific basis. Furthermore, we need to better understand how metabolism may need to be modulated at different specific timepoints after injury. Many phenotypic changes in critical illness can be traced to abnormal fluctuations at the molecular and cellular levels, therefore, a systems-level approach is an advantageous form of methodology. The accelerating technical improvements in measuring gene transcripts, proteins, metabolites, and microbe levels in patients’ samples at omics scale with high sensitivity,8 in combination with the ability to analyze large datasets are very effective in diagnostic markers discovery. Most of the success in this area has centered around genomics, likely due to the rapid evolution in gene sequencing and related analysis pipelines relative to proteomics and metabolomics. Although metabolomics is still less advanced and more complex relative to genomics or proteomics, it has contributed substantially to the fields of drug toxicity,9–12 diabetes,13–15 obesity,16–18 cardiovascular disease,19–21 cancer,22–25 aging,25–27 liver disease,28,29 trauma,30–33 infection with parasitic diseases,34–36 and other diseases.37 Applications of metabolomics to understand burn pathogenesis and identify markers of sepsis and organ failure are still limited.38,39
Mouse models have been used successfully to mimic many human diseases and advance therapeutics, benefiting from the close synteny of the murine and human genomes.40 Mouse models represent a superior alternative to rat models because of the widely available technological means and reagents to manipulate the mouse genome and generate specific knockout transgenic models or gene-specific knockdowns.41 To validate the proposed mouse burn model, a metabolomics approach was used to assess burn-induced changes. The role of data analysis and normalization methods were considered in assessing the differences in metabolomic changes among different specimens, with a special focus on differences between sera from blood circulation and skin biopsies. This report also discusses how to avoid some of the pitfalls which may be encountered during the analysis of metabolic data from mice.
MATERIALS AND METHODS
Burn Mouse Model
Twenty-four male C57BL/6 mice (The Jackson Laboratory, Bar Harbor, ME) aged 90–100 days (~40 g) were received and acclimated according to facility standard operating procedures. After regulatory review and approval of animal use, mice underwent a scald burn procedure that has been previously described.42 Briefly, animals were anesthetized using 2–5% isoflurane and transferred to a nose cone for maintenance (3–5% isoflurane). While under anesthesia, the animals were shaved using standard veterinary clippers and depilated by applying a commercial agent (Veet, Reckitt Benckiser Group. Berkshire, UK). After confirmation of a surgical plane of anesthesia, animals were subjected to a 30% total body surface area (TBSA) full-thickness scald burn by immersion in 100°C water. Burn size was controlled using a hollow cylindrical apparatus in which the mice were placed supine (7 s) or prone (2 s) with skin exposed through a window cut in the cylinder wall to the appropriate size to result in a 30% TBSA injury. Sham animals were handled the same way except they were submerged in 23°C water. Mice were resuscitated with Ringer’s lactate solution according to the Parkland Formula (≈2.4 ml) injected intraperitoneally (IP) and monitored until recovered to a sternal position where they received 0.05 mg/kg of buprenorphine for post-procedure analgesia. Once mice were ambulating, they were returned to their cages. Mice received another dose of Ringer’s lactate solution (2.4 ml) and buprenorphine 8 hr post-procedure.
Sample Collection and Preparation
While the animals were under anesthesia (3–5% isoflurane), blood was collected via cardiac puncture in a serum separator Microtainer tube (Becton Dickinson and Company, Franklin Lakes, NJ). Simultaneously, skin biopsies (4 mm diameter) were taken from burned and unburned areas of the dorsum on euthanasia. The procedure was performed at 1, 2, 6, and 24 hr after burn (n = 3 for all time points) and an equal number of mice had sham procedures, and samples were collected at 2, 6, and 24 hr. Biopsies and serum were also collected from three uninjured mice to be used as baseline comparators. A total of 24 mice were used for a total of 8 groups.
Metabolomics Procedure and Analysis
Metabolite Extraction and Derivatization
Serum (5 µl) was collected into an Eppendorf tube with 95 µl of 40% isopropyl alcohol (IPA), 25% methanol, and 35% water containing internal standards (4 nitrobenzoic acid and debrisoquine). The samples were vortexed and incubated on ice for 20 min. Chilled (−20°C) acetonitrile (100 µl) was added and then the samples were incubated at −20°C for 15 min followed by centrifugation at 13,000 rpm for 20 min at 4°C. The supernatant was transferred to mass spec vials for further analysis by mass spectrometry.
For skin samples, 150 µl of chilled 40% IPA, 25% methanol, and 35% water containing internal standards were added to the tissue sample in the Eppendorf vial. The samples were homogenized on ice (Roches, USA) and suspended in 150 µl of chilled (−20°C) acetonitrile, vortexed and incubated at −20°C for 30 min then centrifuged at 13,000 rpm for 20 min at 4°C. The supernatant was transferred to mass spec vials for further analysis by mass spectrometry.
Metabolite Separation by Gas Chromatography and Identification by Mass Spectrometry
Each sample (2 µl serum or 1 µl skin supernatant) was chromatographed on an Acquity BEH C18 1.7 µm, 2.1 mm × 50 mm column (Waters Corporation, Milford, MA). Leucine encephalin solution in 1:1 acetonitrile:water ([M+H] + = 556.2771 and [M−H] − = 554.2615) was used as a reference mass. A flow rate of 0.4 ml/min was used in chromatography and elution. The column was coupled to a Synapt G2-Si quadrupole time of flight mass spectrometer (Waters Corporation, Milford, MA). Electrospray was used for ionization. The data was acquired in centroid mode over a mass range of 50–1200 m/z and a resolution of 10–12,000.
Statistics and Bioinformatics Analysis
Internal normalized, positive and negative peaks were filtered for missing values and QC columns filters were applied. The remaining peaks were log-transformed for both positive and negative metabolites. PCA analysis was performed using R with the “prcomp” function on the log-transformed, normalized positive and negative peaks. A linear model fit was applied to normalized data and ebayes test was used to identify differentially expressed metabolites with contrast function at each time point as identified from comparing burn samples with baseline, shams controls with baseline, and burn samples with their respective sham controls. All significantly abundant metabolites from each comparison with P-value cutoff < .05 were selected from both the positive and negative peaks. Significant peaks were annotated using CEU mass mediator (CMM) (http://ceumass.jpg.uspceu.es/), a tool for searching metabolites in different databases including KEGG (http://www.kegg.jp/), HMDB, METLIN, and CHEMBI annotations. For pathway analysis, the significantly abundant metabolites were further filtered using part per million error (PPM) for observed mass over expected mass scores; anything < 2 ppm error was discarded. Pathway enrichment was performed using the Human Metabolome Database (HMDB) ID along with pathway topology analysis with relative betweenness centrality. The original P-value was calculated from the enrichment analysis, whereas the Holm P is the P-value adjusted by Holm-Bonferroni method.43 For comparative Venn analysis, all filtered significant annotated metabolites uniquely annotated with HMDB IDs (P < .05, ppm error < 2) were determined for each comparison or common across all comparison at each time point. All pathway analysis was done using Metaboanalyst. 4.0. (https://omictools.com/metaboanalyst-tool).
RESULTS
The study included four groups of burned mice (h1, h2, h6, and h24) and three groups of sham-control mice (h2, h6, and h24). All mice survived and completed the planned schedule. The study design is illustrated in Figure 1.
Figure 1.
Study Design. Mice, in groups of three, were sorted into eight groups: sham-treated (blue), untreated (C0), and burned mice (red). Serum samples and skin biopsies were collected at euthanasia at either hour 0 (untreated only; C0), 1 (burned only; G1), 2 (sham-treated [C2] and burned [G2]), 6 (sham-treated [C3] and burned [G3]), or 24 (sham-treated [C4] and burned [G4]).
Data Overview and Kinetics of Samples’ Metabolomes
The Mouse Metabolome Is Modulated after Burn Injury
Serum and skin metabolomes in sham-treated mice at h2, h6, and h24 showed significant modulations (P < .05; ppm error < 2) relative to the respective levels at baseline (BL) (Table 1). The number of metabolites showing significant change was larger in skin biopsies than in serum samples. The multiple correction testing was applied using the FDR method to call false discovery rates (FDR). There were only 89 metabolites at h6 time point that passed FDR < 0.1 threshold in serum samples from sham-treated animals when compared to baseline and none at h2 and h24, but the skin samples still exhibited large numbers (10, 458, and 1669 at h2, h6, and h24, respectively).
Table 1.
The number of significantly modulated metabolites (SMM) identified in serum samples and skin biopsies determined by comparing data from Sham-treated, Baseline (BL), or Burn-treated mice throughout all time points using different statistical thresholds
| Serum (6349) | Skin (7716) | ||||||
|---|---|---|---|---|---|---|---|
| Data Filter |
Timepoint (hr) |
Sham/BL | Burn/BL | Sham/burn | Sham/BL | Burn/BL | Sham/burn |
|
P < .05 and ppm error < 2 |
1 | NA | 1799 | NA | NA | 4456 | NA |
| 2 | 232 | 1449 | 1829 | 1790 | 5280 | 2754 | |
| 6 | 2094 | 890 | 792 | 861 | 6013 | 2577 | |
| 24 | 3260 | 4985 | 1693 | 6421 | 7879 | 3636 | |
| FDR < 0.1, P < .05, ppm error < 2 |
1 | NA | 57 | NA | NA | 205 | NA |
| 2 | 0 | 113 | 155 | 10 | 1656 | 1304 | |
| 6 | 89 | 200 | 176 | 458 | 3952 | 1199 | |
| 24 | 0 | 1960 | 205 | 1669 | 7771 | 2108 | |
| FDR < 0.05, P < .05, ppm error < 2 |
1 | NA | 54 | NA | NA | 9 | NA |
| 2 | 0 | 52 | 44 | 6 | 291 | 640 | |
| 6 | 31 | 158 | 105 | 29 | 2075 | 499 | |
| 24 | 0 | 456 | 116 | 982 | 6261 | 1292 | |
“0” indicates no SMMs were identified in that comparison with that particular statistical filter. “NA” indicates that the respective time point was not performed.
The Metabolic Changes Induced by Burn Are Larger than Those in the Background (Normalized to Baseline)
A P < .05; ppm error < 2 cutoff yielded a larger number of SMMs that showed a bidirectional trend in burn animals characterized by a decrease in serum samples between h1 and h6 followed by an increase at the later h24 time point (Table 1). The accuracy of these trends (normalized to baseline) was highlighted by the large number of metabolites showing modulated levels in sham-treated samples under the same conditions. Smaller numbers of metabolites passed the FDR threshold (FDR < 0.1 and 0.05) in serum samples and skin biopsies throughout the time points. Serum samples from sham-treated animals under the same statistical parameters showed changes in only a few to no metabolites across time points. The same increasing trend in the numbers of SMMs passed FDR in serum samples when data were normalized in burn relative to sham samples at the same time points (FDR < 0.1 or 0.05). Analysis of skin metabolome results under these conditions showed a larger number of SMMs relative to those found in serum with a mildly decreasing trend between h2 and h6, followed by a large increase between h6 and h24.
Analysis of Serum Metabolome
Data Overview
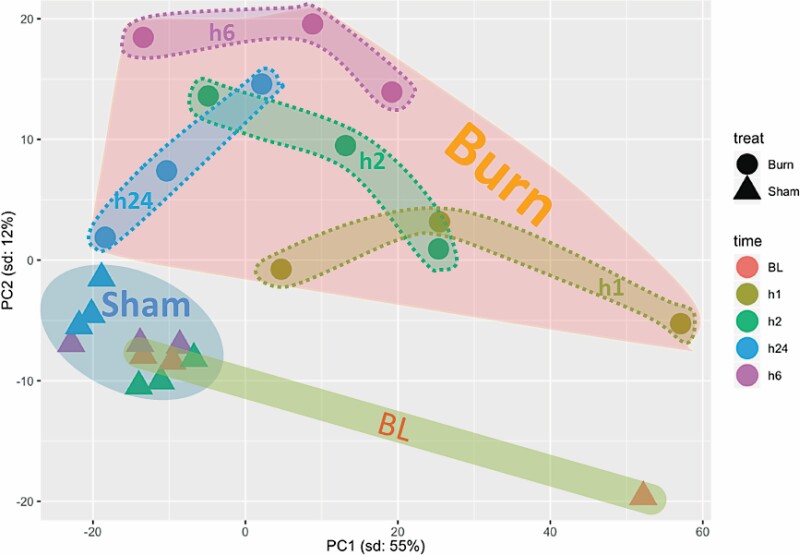
Principal component analysis of serum samples showed a clear clustering of sham-treated samples that were separate from burn samples at all time points. The identification of common clusters of all sham samples reinforces the high similarities within and among the different time points of these samples. Separation of sham samples from burn samples indicates significant metabolomic differences induced by burn injury. Differences among burn samples at different time points were larger than those distinguishing sham samples at each time point. This distribution suggests a temporal difference in the samples’ metabolomes. Furthermore, the metabolomic changes in burn samples seemed to increase from h1 to h2, reach peak difference at h6, and then decreased at h24. Burn samples at h24 showed the least variation compared to shams, as at that time point, the burn cluster was the closest to the cluster of sham-treated samples (Figure 2). This suggests a gradual return to normal metabolome levels.
Figure 2.
Principal component analysis of significantly (P < .05) modulated metabolites in serum samples from baseline (BL), sham-treated, or burned mice at different post-treatment time points. PC = principal component.
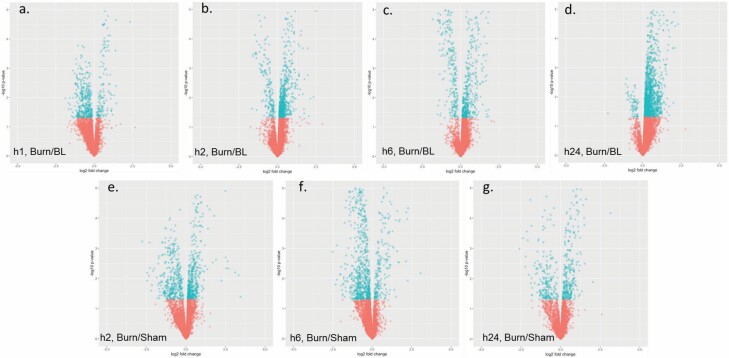
Positively charged SMMs (FDR < 0.05) were more prevalent in burn sera relative to negative ones (#PCMM > #NCMM at all time points) at all time points when data were normalized to BL (Table 2). When data were normalized to sham, the trend was maintained at all time points except for h24. Gross examination of the fold change distribution of SMMs through the different time-points showed a gradual change in the SMM distribution from burn samples from predominantly being at levels lower than baseline (BL) at h1, as evident by the negative log2 fold change, to higher levels than BL at h24 (positive log2 fold change) (Figure 3A–D). Normalization to samples from sham-treated animals at the same time point showed the same trend in burns but with ameliorated differences (Figure 3E–G). Although sera from sham-treated animals showed significant modulations in metabolites, these changes were smaller than those seen in burn animals regardless of the used reference (ie, normalization to baseline sera or sham-treated animals at the same time point) at h2 where the number of SMMs was larger than that in the burn-treated animals (Table 3). Later time points showed a decrease in SMMs in burned samples, in the contrary to the steady increase in SMMs in sham-treated animals.
Table 2.
Distribution of negatively and positively charged significantly modulated metabolites at different selection thresholds in serum samples
| P < .05 and ppm error < 2 | FDR < 0.1, P < .05 and ppm error < 2 | FDR < 0.05, P < .05 and ppm error < 2 | ||||||||||||||||
|---|---|---|---|---|---|---|---|---|---|---|---|---|---|---|---|---|---|---|
| Positive (3634) | Negative (2715) | Positive (3634) | Negative (2715) | Positive (3634) | Negative (2715) | |||||||||||||
| Time Points in hr |
Sham/ BL | Burn/ BL | Sham/ Burn | Sham/ BL | Burn/ BL | Sham/ Burn | Sham/ BL | Burn/ BL | Sham/ Burn | Sham/ BL | Burn/ BL | Sham/ Burn | Sham/ BL | Burn/ BL | Sham/ Burn | Sham/ BL | Burn/ BL | Sham/ Burn |
| 1 | NA | 726 | NA | NA | 1073 | NA | NA | 41 | NA | NA | 16 | NA | NA | 38 | NA | NA | 16 | NA |
| 2 | 181 | 262 | 642 | 51 | 1187 | 1187 | 0 | 103 | 44 | 0 | 10 | 111 | 0 | 48 | 43 | 0 | 4 | 1 |
| 6 | 876 | 431 | 428 | 1218 | 459 | 364 | 51 | 132 | 132 | 38 | 68 | 44 | 31 | 124 | 96 | 0 | 34 | 9 |
| 24 | 1608 | 3524 | 1071 | 1652 | 1461 | 622 | 0 | 1438 | 13 | 0 | 522 | 192 | 0 | 263 | 13 | 0 | 193 | 103 |
Figure 3.
Volcano plots illustrating quantitative modulations of the metabolome identified when comparing data of different groups and time points. Specifically, serum samples from burned mice euthanized at hour 1 (A), 2 (B), 6 (C), or 24 (D) were normalized to baseline (hour 0) and burned mice were compared to sham-treated controls from the same time point: 2 (E), 6 (F), or 24 (G) hours. Blue and red dots represent metabolites with P < or > .05, respectively.
Table 3.
Number of significantly (P < .05, ppm < 2, uniquely mapped to HMDB ID) modulated metabolites (SMMs) and pathways identified in sera after data was normalized to levels in baseline sera samples or sera from sham-treated animals at the same respective time-points
| Sera Source | Normalization Method | Time-Point | Number of SMMs | Number of Identified Pathways |
|---|---|---|---|---|
| Burned animals | Sham-treated animals’ sera | h2 | 1420 | 21 |
| h6 | 340 | 18 | ||
| h24 | 1141 | 35 | ||
| Baseline sera | h1 | 1292 | 27 | |
| h2 | 1269 | 22 | ||
| h6 | 548 | 38 | ||
| h24 | 2823 | 5 | ||
| Sham-treated animals | h2 | 108 | 0 | |
| h6 | 1045 | 22 | ||
| h24 | 1629 | 23 |
Qualitative Analysis
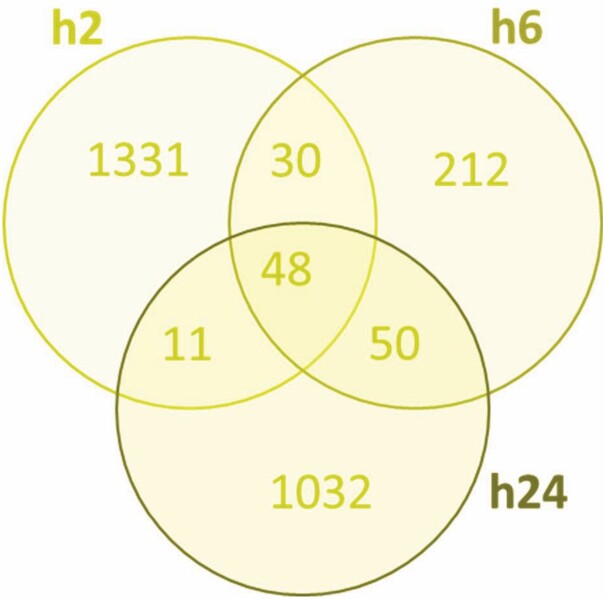
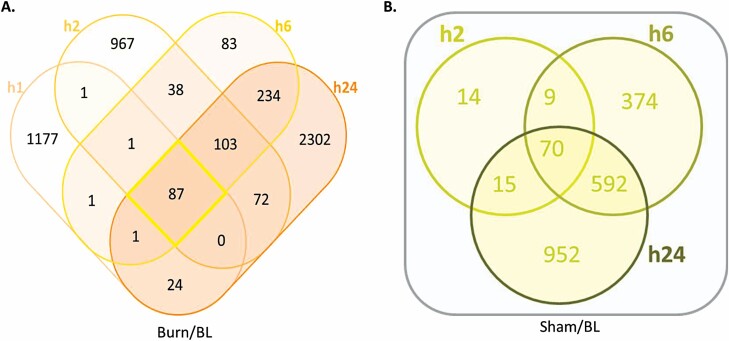
Adopting the data set of SMMs normalized at each time point to the respective sham-treated samples, a total of 2714 metabolites showed significant modulation at all time points, 48 (1.77%) of which were common across all three time points (Figure 4). Interestingly, about half of the SMMs (1331) were unique to the first time point (h2) while less than 8% were unique to h6 (212), suggesting a large but transient metabolomic response to burn occurring in serum early after injury and then rapidly decreasing by h6. Additionally, only 30 metabolites were identified in common between h2 and h6 (and not h24). The response at h6 involved 340 (212 SMMs unique to h6) metabolites and increased to 1141 (1032 unique) at h24 with only 50 SMMs common between the h6 and h24 (and not h2) time points (Figure 4). A similar trend of a large early metabolic response followed by a decrease at h6 and then a large increase at h24 was observed when data from burned animal samples were normalized to those from baseline (Figure 5). This trend was not seen in similarly normalized data from sera of sham-treated animals, in support of a correlation of this trend with the burn. Samples of sham-treated animals showed a smaller but steadily increasing number of SMMs from the h2 to h6 and h24 time points (Figure 5). Pathway analysis showed that almost half the number of SMMs in burn samples at h6 (normalized to baseline) resulted in double the number of pathways being affected by burn relative to sera of sham-treated animals at the same time point (Table 3). This finding supported a large metabolic change due to burn injury and confirmed a specific response to burn at h6.
Figure 4.
Venn diagram illustrating the distribution of serum metabolites showing significantly (P < .05, ppm < 2, and uniquely mapped HMDB ID) modulated levels in response to burn based on normalization to respective metabolite levels in sham-treated controls at 2, 6, and 24 hr.
Figure 5.
Venn diagrams showing the distribution of SMMs (P < .05, ppm < 2, and uniquely mapped HMDB ID) in sera from burned (A) or sham-treated (B) mice in the different time points after normalization to baseline levels from uninjured mice.
Pathway Analysis
Pathway analysis can be performed either by using all identified metabolites and then selecting the pathways showing low P-values and high impact numbers, or by using only prefiltered SMM lists which would reduce the number of metabolites included in the analysis but generate final pathway lists that do not require any selection criteria
Pathway Analysis Using Complete Sera SMM (P ≤ .05) Lists at Each Time Point
To identify the main metabolic pathways affected by burn, SMMs (FDR < 0.05) in sera from burned animals at h2, h6, and h24 relative to those of shams at the same time point (Burn/Sham) or relative to baseline (Burn/BL) were analyzed using Metaboanalyst. The numbers of pathways identified at each time point with the respective normalization method are presented in Table 3. The large difference in SMMs and pathways at h2 in Sham/BL vs Burn/BL or Burn/Sham show a clear early effect of burn on the serum metabolome. The larger number of pathways at h1 relative to h2 in Burn/BL suggests that burn effects have peaked at some time earlier than h2 (Table 3). Lack of correlation between the number of SMMs and the resulting pathways suggests time point-specific and burn-mediated metabolic changes. Twenty-three pathways were commonly identified (Table 4) by the analysis of the SMM lists in Burn/Sham (all 3 time points), Burn/BL (4 time points), and Sham/BL (3 time points). A total of 9 time points were included in the analysis because the h2 time point in Sham/BL did not contain a sufficient number of SMMs for analysis. Many of the pathways identified in sera from burn animals (Burn/Sham-BL) showed some level of altered activity (Sham/BL) by the procedure in at least one time point. Out of the 23 pathways, 3 were found in all time points and 19 were common in at least 8 time points (Table 4). Analysis identified 18 pathways only in burn samples, 14 of which occurred at h6 regardless of the normalization method (ie, Burn/Sham or Burn/BL). The Amino Sugar Metabolism pathway was found only at h6 when burn data were normalized to sham (Burn/Sham) and 4 other pathways (Table 5) were identified at h24 only when data were normalized to baseline (Burn/BL) (Table 5). The identification of different overlapping lists of pathways depending on the normalization method underscores the importance of using the correct reference in metabolomic studies and highlights the dynamic nature of metabolomes and their sensitivity to environmental factors and animal handling. Biologically, the identification of Mitochondrial beta-oxidation of Long, Medium, and Short Chained Saturated Fatty Acid pathways indicates a direct effect of burn on fatty acid processing throughout all time points (Table 5). This finding was supported further by the identification of the Fatty Acid Elongation Pathway at h24. Similarly, several pathways related to B vitamin metabolism including, Nicotinate and Nicotinamide Metabolism, Pantothenate, and CoA Biosynthesis, Riboflavin metabolism, and Thiamine metabolism pathways were identified in burn sera samples at h6 using both normalization methods (Table 5). Because of the overlap in pathways identification between sham and burn samples, additional analyses were performed using presorted SMM lists as follows:
Table 4.
Distribution of pathways identified from the analysis of SMMs at all time points using sera from burn animals normalized to sham or baseline, or sera from sham-treated animals normalized to baseline (9 time points total)
| Pathways common in burn and sham sera | Out of 9 Time-Points | |
|---|---|---|
| 1 | Arginine and proline metabolism | 9 |
| 2 | Glycine and serine metabolism | |
| 3 | Tryptophan metabolism | |
| 4 | Alanine metabolism | 8 |
| 5 | Aspartate metabolism | |
| 6 | Beta-alanine metabolism | |
| 7 | Bile acid biosynthesis | |
| 8 | Glucose-alanine cycle | |
| 9 | Glutamate metabolism | |
| 10 | Glutathione metabolism | |
| 11 | Histidine metabolism | |
| 12 | Methionine metabolism | |
| 13 | Propanoate metabolism | |
| 14 | Pyrimidine metabolism | |
| 15 | Pyruvaldehyde degradation | |
| 16 | Pyruvate metabolism | |
| 17 | Selenoamino acid metabolism | |
| 18 | Spermidine and spermine biosynthesis | |
| 19 | Urea cycle | |
| 20 | Phospholipid biosynthesis | 6 |
| 21 | Plasmalogen synthesis | 4 |
| 22 | Phenylalanine and tyrosine metabolism | 4 |
| 23 | Sphingolipid metabolism | 2 |
Table 5.
List of burn-specific metabolic pathways identified in serum from the analysis of total significantly (P < .05, ppm < 2, uniquely mapped to HMDB ID) modulated metabolites
| Seq # | Time Point | Normalization Method | Pathway |
|---|---|---|---|
| 1 | h2, h6 | Sham | Mitochondrial beta-oxidation of long chain saturated fatty acids |
| h6, h24 | BL | ||
| 2 | h6 | Sham and Baseline | Mitochondrial beta-oxidation of medium chain saturated fatty acids |
| 3 | Mitochondrial beta-oxidation of short chain saturated fatty acids | ||
| 4 | Nicotinate and nicotinamide metabolism | ||
| 5 | Pantothenate and CoA biosynthesis | ||
| 6 | Riboflavin metabolism | ||
| 7 | Thiamine metabolism | ||
| 8 | Phenylacetate metabolism | ||
| 9 | Ammonia recycling | ||
| 10 | Butyrate metabolism | ||
| 11 | Cysteine metabolism | ||
| 12 | Purine metabolism | ||
| 13 | Pentose phosphate pathway | ||
| 14 | Sham | Amino sugar metabolism | |
| 15 | h24 | Baseline | Fatty acid elongation in mitochondria |
| 16 | Phosphatidylinositol phosphate metabolism | ||
| 17 | Steroid biosynthesis | ||
| 18 | Steroidogenesis |
Details noted include the time point(s) in which a specific pathway was identified, as well as the normalization method (ie, relative to sham-treated and/or baseline samples).
Pathway Analysis of SMMs Common to All Time Points in Burn/BL or Burn/Sham and Sham/BL
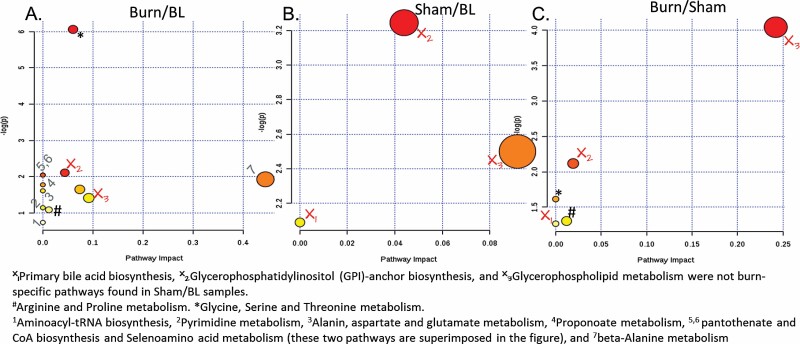
Another pathway analysis was performed for common SMMs (P < .05) at all time points of burn samples after normalization to sham results at each respective time point (Burn/Sham), which included 48 metabolites (Figure 6). The identified pathways were cross-examined with the results of a similar analysis of the 87 and 70 metabolites common to all time points in the Burn/BL and Sham/BL groups, respectively (Figure 5). Five pathways were identified from the common Burn/Sham SMMs, though 3 of these 5 pathways were eliminated because they were also common with the Sham/BL SMMs. The two remaining pathways were the Glycine, Serine, and Threonine metabolism pathway and the Arginine and Proline metabolism pathway (Figure 6). Burn correlation of these two pathways was supported further by their appearance among the 14 pathways identified in the analysis of the 87 SMMs common to all time points of Burn/BL metabolites.
Figure 6.
Modulated metabolic pathways throughout all time points (by analysis of common SMMs). Two pathways were found to be specifically affected in all burn sera during the first 24 hr post-injury. X = pathway not specific to burn, # Arginine and Proline metabolism, * Glycine, Serine, and Threonine metabolism. Numbered pathways in (A) are found only in Burn/BL. Color from yellow to red decreasing P-value. Size increases by increasing pathway impact. The scale is independent for each panel in the figure.
Pathway Analysis of SMMs Unique to h2, h6, and h24 Sera from Sham-Treated Mice Normalized to Baseline (Sham/BL) and from Sera of Burned Mice Normalized to Sham (Burn/Sham) or Baseline (Burn/BL)
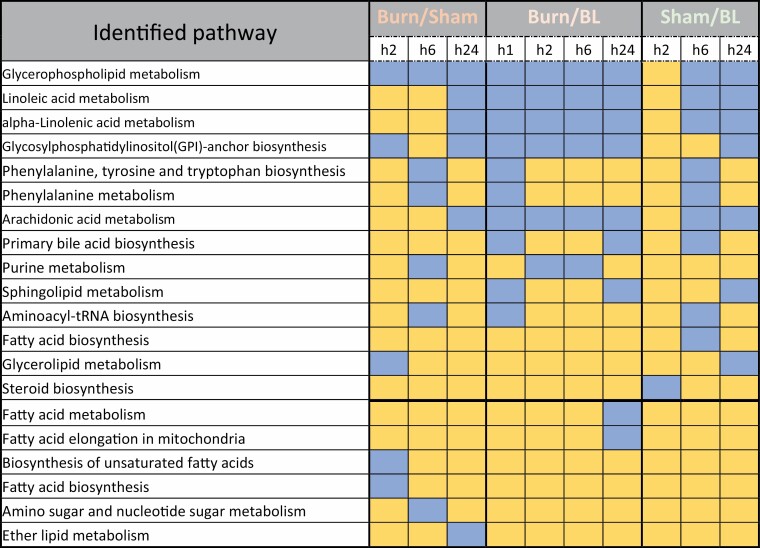
To identify time point-specific pathways, lists of the 1331, 212, and 1032 unique SMMs obtained at the h2, h6, and h24 time points, respectively, after normalization of burned to sham-treated results, were analyzed separately (Figure 4). Interestingly, the Glycerophospholipid metabolism pathway was identified in all time points even though the analysis started with mutually exclusive lists of SMMs (Figure 7). Similarly, the Glycosylphosphatidylinositol (GPI)-anchor biosynthesis pathway was identified in both the h2 and h24 time points. However, a similar approach to the analysis of the unique SMM lists of Burn/BL and Sham/BL identified both these pathways across samples and time points. Subtracting all the pathways identified in the Sham/BL analysis from that of Burn/Sham and Burn/BL (Figure 7), what remained was the Fatty acid metabolism and Fatty acid elongation in mitochondria pathways at h24 of Burn/BL, the Biosynthesis of unsaturated fatty acids and Fatty acid biosynthesis pathways at h2 of Burn/Sham, the Amino sugar and nucleotide sugar metabolism pathways at h6 of Burn/Sham, and the Ether lipid metabolism pathway at h24 of Burn/Sham. These results are consistent with previous findings of modulated fatty acid processing by burn injuries.44
Figure 7.
List of pathways identified from the analysis of significantly (P < .05, ppm < 2 and uniquely mapped HMDB ID) modulated metabolites unique to each time point in sera of burned mice after normalization to metabolite levels in sham-treated mice (Burned/Sham), and in burned or sham-treated mice after normalization to metabolite levels in baseline sera (Burned/BL and Sham/BL). Blue color indicates a modulated pathway at the corresponding time point and yellow color indicates the absence of the pathway.
Analysis of Skin Biopsies Metabolome
Data Overview
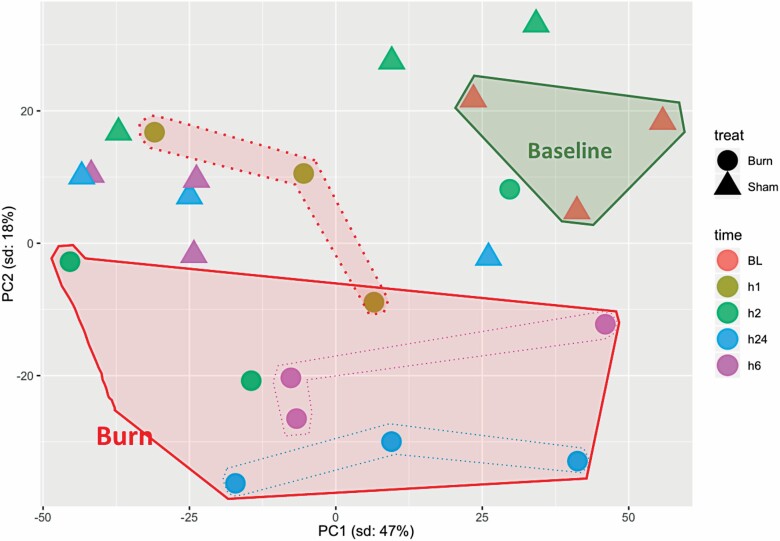
Principal component analysis (PCA) data of skin biopsies did not exhibit as distinct of clustering as the sera samples (Figure 8). Biopsies from sham-treated mice were closer to baseline biopsies than those of burned mice. Gross examination of PCA showed that the largest variations within sham-treated biopsies occurred at h2 while biopsies at h6 and h24 clustered closer together, separate from BL. These trends indicate that metabolomes of sham-treated mice skin were affected least, but varyingly within the h2 group, at the beginning of the experiment (h2) and the variations gradually increased with time to a status more different from that of BL by h24. The distribution of burned skin biopsies indicated increasing deviations of burned tissue metabolomes from those of sham-treated and BL which were clear by h2 and later time points (Figure 8).
Figure 8.
Principal component analysis of significantly modulated metabolites in skin biopsies from baseline (BL), sham-treated, and burned mice at different post-treatment time points. PC = principal component.
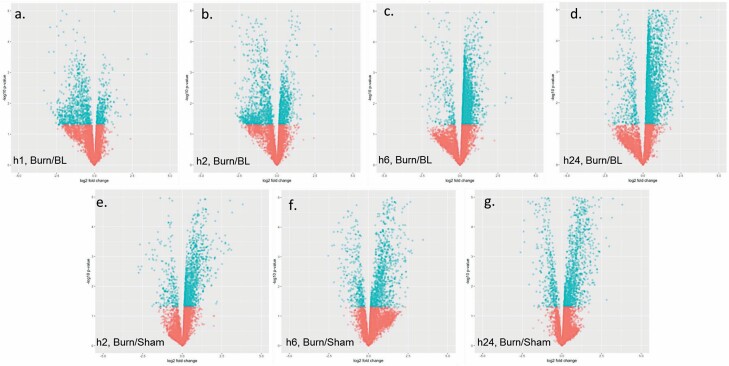
At all time points in all statistical filters, positively charged metabolites were higher than negatively charged metabolites except for the h1 Burn/BL and h6 Burn/Sham time points at FDR < 0.05 (Table 6). Whether the switch in the predominance of change between the early and late phases of the skin metabolic response to burn is consistent and valuable biologically remains to be established using a better time-resolved study. Examining the distribution of SMMs (Burn/BL) using a volcano plot indicated a shift from downregulation in h1 and h2, to upregulation at h6 and h24 (Figure 9A–D). When the SMMs were normalized to sham-treated equivalents, it appears most SMMs are upregulated throughout the experiment (Figure 9E–G). This finding underscores the highly dynamic nature of the mice metabolome and the importance of the appropriate normalization method. The use of sham-treated animals at each time point is likely to provide a more accurate presentation of burn-induced changes while minimizing potential interference from the model itself and the highly active mouse metabolism.
Table 6.
Distribution of negatively and positively charged significantly modulated metabolites at different selection thresholds in skin biopsies
| P < .05 and ppm error < 2 | FDR < 0.1, P < .05 and ppm error < 2 | FDR < 0.05, P < .05 and ppm error < 2 | ||||||||||||||||
|---|---|---|---|---|---|---|---|---|---|---|---|---|---|---|---|---|---|---|
| Positive (4296) | Negative (3422) | Positive (4296) | Negative (3422) | Positive (4296) | Negative (3422) | |||||||||||||
| Time Points in hr |
Sham/BL | Burn/BL | Sham/Burn | Sham/BL | Burn/BL | Sham/Burn | Sham/BL | Burn/BL | Sham/Burn | Sham/BL | Burn/BL | Sham/Burn | Sham/BL | Burn/BL | Sham/Burn | Sham/BL | Burn/BL | Sham/Burn |
| 1 | NA | 3769 | NA | NA | 687 | NA | NA | 152 | NA | NA | 53 | NA | NA | 2 | NA | NA | 7 | NA |
| 2 | 1064 | 4394 | 1774 | 726 | 886 | 980 | 4 | 1333 | 718 | 6 | 323 | 586 | 0 | 225 | 253 | 6 | 66 | 387 |
| 6 | 193 | 4796 | 1301 | 668 | 1217 | 1276 | 95 | 3145 | 752 | 363 | 807 | 447 | 1 | 1534 | 285 | 28 | 541 | 214 |
| 24 | 5573 | 6184 | 2388 | 848 | 1695 | 1248 | 1370 | 6105 | 1291 | 299 | 1666 | 817 | 790 | 4982 | 718 | 192 | 1279 | 574 |
Figure 9.
Volcano plots illustrating quantitative modulations of the metabolome identified when comparing data of different groups and time points. Specifically, skin biopsies from burned mice euthanized at hour 1 (A), 2 (B), 6 (C), or 24 (D) were normalized to baseline (hour 0) and burned mice were normalized to sham-treated controls from the same time point: 2 (E), 6 (F), or 24 (G) hours. Blue and red dots represent metabolites with P < or > .05, respectively.
Qualitative Analysis
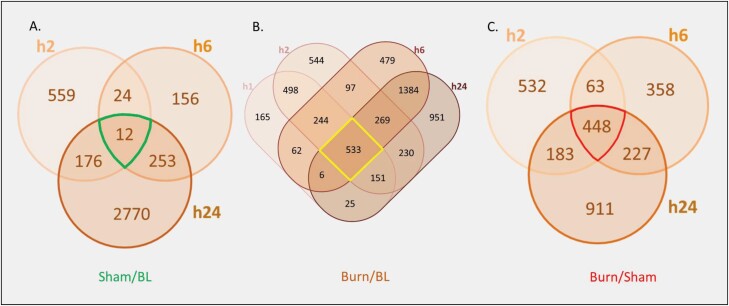
Data passing a statistical threshold of FDR < 0.05 were selected for subsequent analysis because of the lowest number of SMMs in sham-treated animals as well as reduced background noise due to experimental limitations at this threshold, especially at the h2 and h6 time points (Table 1). A total of 2722 SMMs were identified in skin biopsies throughout all time points and ~16.5% were common among all time points (Figure 10C). The largest number of SMMs was identified at h24. Distribution of SMMs during the experimental time points of Burn/Sham samples (Table 1) suggested an early, large metabolic change that decreased at h6 and then increased at a later time point. This change was consistent with the trend observed in serum samples, but with lesser intensity. A study with additional time points beyond h24 will be needed to determine the peak metabolic response window for burn injury.
Figure 10.
Venn diagrams showing the distribution of significantly (P < .05, ppm < 2 and uniquely mapped to HMDB ID) modulated metabolites throughout the different time points. Metabolome results from skin biopsies of sham-treated animals (A) and burned animals (B) normalized to baseline, and burned animals normalized to levels from sham-treated animals at the same time point (C).
Pathway Analysis Using Complete Skin SMM (P < .05) Lists at Each Time Point
Similar to the sera pathway analyses, lists of SSMs (P < .05) from burned animal biopsies obtained by normalization to sham-treated animals or BL biopsies were used to identify the affected pathways in burned and sham-treated animals. The non-linear relationship between the number of pathways and the number of SMMs in burn relative to sham or BL indicates a specific metabolic modulation by burn. This modulation is more pronounced at h6 in Burn/Sham biopsies where fewer SMMs produced more pathways relative to h2 (Table 7). A total of 57 unique pathways were identified in all skin biopsies from Burn/Sham, Burn/BL, and Sham/BL. To capture burn-specific pathways only, the lists of pathways from analysis of burn SMMs were cross-referenced with those from sham-treated animals and common pathways were eliminated. Out of 57 identified pathways, 11 were found specific to burn biopsies (Table 8). Four of the 11 pathways were found in all 7 time points from both normalizations (ie, 4 Burn/BL time points and 3 Burn/Sham time points), while the remaining 7 pathways were found in 3, 4, and 5 time points. Interestingly, 10 of the 11 pathways were found at the h24 time point, suggesting that the peak metabolomic change in skin occurs at later time points relative to that in serum (Table 8). The results introduce carbohydrate metabolism as a major affected function by burn as the inositol phosphate metabolism, ascorbate and aldarate metabolism, and the pentose phosphate pathways were amongst the top four pathways in burn animal skin biopsies at all time points relative to sham-treated and baseline animal samples.
Table 7.
Number of significantly (P < .05, ppm < 2 and uniquely mapped to HMDB ID) modulated metabolites in skin biopsies at study time points using normalization to levels in baseline or biopsies from sham-treated animals at the same time point
| Skin source | Normalization method | time-point | Number of SMMs | Number of identified pathways |
|---|---|---|---|---|
| Burned animals | Sham-treated mice skin | h2 | 1226 | 37 |
| h6 | 1096 | 41 | ||
| h24 | 1769 | 51 | ||
| Baseline skin | h1 | 1664 | 39 | |
| h2 | 2546 | 45 | ||
| h6 | 3054 | 46 | ||
| h24 | 3549 | 56 | ||
| Sham-treated animals | h2 | 771 | 29 | |
| h6 | 445 | 21 | ||
| h24 | 3211 | 43 |
The number of correlated pathways from SMMs are also listed.
Table 8.
Burn-specific pathways found in skin biopsies from burn animals and not in sham-treated animals using complete lists of SMMs (P < .05, ppm < 2 and uniquely mapped to HMDB ID) at each time point after normalization to BL or to results from sham-treated biopsies at the same time point
| Number of Time-Points at Which Pathway Was Found | |||
|---|---|---|---|
| Order of Predicted Impact (Highest on Top) | Pathway Name | Normalized to Sham (3 Total) | Normalized to BL (4 Total) |
| 1 | Caffeine metabolism | 3 | 4 |
| 2 | Inositol phosphate metabolism | 3 | 4 |
| 3 | Ascorbate and aldarate metabolism | 3 | 4 |
| 4 | Pentose phosphate pathway | 3 | 4 |
| 5 | Histidine metabolism | 2 | 3 |
| 6 | Nicotinate and nicotinamide metabolism | 2 | 3 |
| 7 | Terpenoid backbone biosynthesis | 3 | 2 |
| 8 | One carbon pool by folate | 1 | 3 |
| 9 | Folate biosynthesis | 2 | 1 |
| 10 | Cysteine and methionine metabolism | 1 | 2 |
| 11 | Taurine and hypotaurine metabolism | 2 | 1 |
Pathway Analysis of SMMs Common to All Time Points in Burn/BL or Burn/Sham and Sham/BL
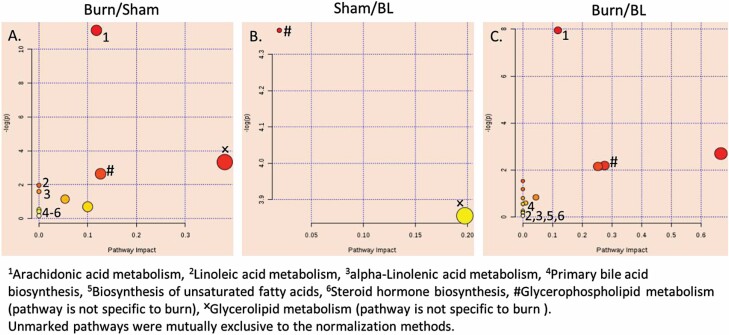
To identify skin metabolic pathways steadily affected by burn at all tested time points, common SMMs at all time points in sham-treated and burned mice normalized to either BL or sham-treated mice were used in a separate pathway analysis (Figure 10) and a total of 21 pathways were identified in all experimental arms. Only two pathways, namely, the Glycerophospholipid and the Glycerolipid metabolism pathways, were identified in sham-treated biopsies. The former pathway was also found in burn biopsies regardless of the normalization method or time point, while the latter was common with the Burn/Sham but not in Burn/BL biopsies. The small number of SMMs common to all sham time points underscores the highly dynamic nature of the mice metabolome (Figure 10A) and they produced two pathways (Figure 11B) unlikely related to burn injury but seem to be part of the endogenous metabolomic changes or changes induced by the model. Arachidonic acid metabolism, Linoleic acid metabolism, Alpha-linoleic acid metabolism, Primary bile acid biosynthesis, Biosynthesis of unsaturated fatty acids, and Steroid hormone biosynthesis were all identified only in burn biopsies regardless of the normalization method (Figure 11A and C). The Porphyrin and chlorophyll metabolism and Steroid biosynthesis pathways were found only in Burn/Sham and not Burn/BL biopsies (Figure 11A). Several other pathways including Valine, leucine, and isoleucine biosynthesis/degradation and Histidine, sphingolipid, tyrosine, and purine metabolism were identified only in Burn/BL biopsies. The expected rapid metabolic changes in this animal model are supported by these results.
Figure 11.
Modulated metabolic pathways in skin biopsies throughout all time points by analysis of SMMs (P < 0.05, ppm < 2 and uniquely mapped to HMDB ID) common to all time-points from burned samples after normalization to levels in sham-treated animals at the same time point (A), or from sham-treated (B) or burned mice (C) normalized to baseline (BL). Six pathways were found to be specifically affected in all burn skin during the first 24 hr post-injury regardless of the normalization method. Color from yellow to red by decreased P-value. Size increases by increasing pathway impact. The scale is independent for each panel in the figure.
Pathway Analysis of SMMs Unique to h2, h6, and h24 Skin Biopsies from Sham-Treated Normalized to Baseline (Sham/BL) and from Burned Skin Biopsies Normalized to Sham (Burn/Sham) or Baseline (Burn/BL)
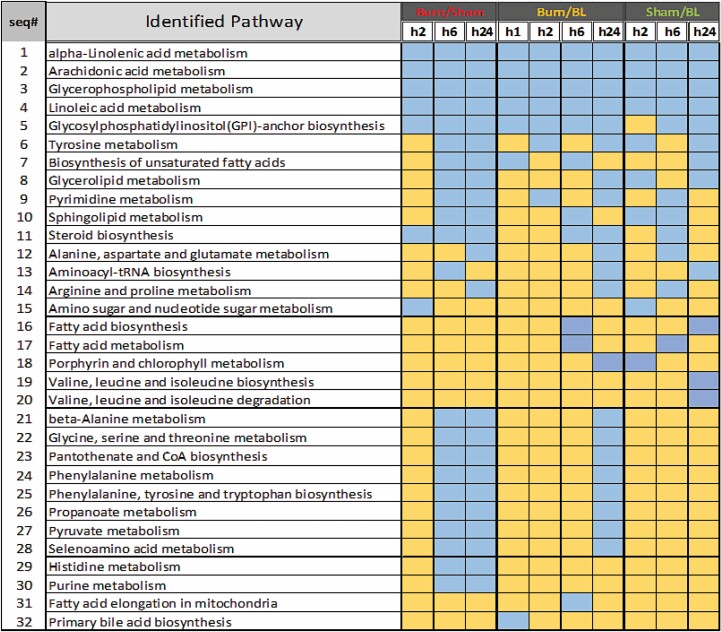
To determine if a burn-specific pathway was activated at one or more time points and affected by time point-specific SMMs, lists of SMMs unique to each time point in sham-treated and burn biopsies using both normalization methods (ie, Burn/Sham and Burn/BL) were analyzed separately (Figure 12). Analysis identified 32 pathways amongst all biopsies. Twelve of these 32 pathways were specific to burn, most of which (10 pathways) appeared at later time points (h6 and h24), especially when data were normalized to sham-treated animals. These results support a delayed burn-specific metabolic response. More importantly, many of the burn-specific pathways from analysis of common SMMs were also captured in the analysis of the time point-specific SMMs, including the Alpha-linoleic acid metabolism, Arachidonic acid metabolism, Linoleic acid metabolism, Biosynthesis of unsaturated fatty acids, and Steroid hormone biosynthesis.
Figure 12.
Pathways from analysis of SMMs (P < .05, ppm < 2 and uniquely mapped to HMDB ID) unique to each time point in biopsies of skin from burned mice after normalization to same metabolites levels in sham-treated mice (Burned/Sham), and in burned or sham-treated mice after normalization to metabolites levels in baseline (Burned/BL and Sham/BL). Blue color indicates a modulated pathway at the corresponding time point and yellow color indicates the absence of the pathway.
DISCUSSION
A mouse model can be adopted to study metabolome modulations induced by burn. However, special attention should be given to the rapid metabolism of mice and translating observations to humans.45 Results from the animal model used in this work show modulations in metabolites levels due to burn injuries, however, these modulations were associated with changes in the sham-treated animals at P values < .05. The number of SMMs in sham-treated animals was larger than that from thermally injured animals at some time points (eg, h6, P < .05), but the levels of variation and functional impacts were larger in burn animals. The use of stringent cutoffs to reduce noise introduced from the high sensitivity of the animal in response to the preparative steps for the model and inclusion of internal controls for each time point is essential to generate reliable results (Table 1). Assessment of rapid metabolic changes46 in the background of data by using the control sham-treated group at each time point is essential when using mouse metabolic models. Variations in sham-treated mice seen here demonstrate the net sum of multiple metabolome-modulating factors from the known mice fast metabolism46 and environmental factors related to unavoidable procedure steps, which involves temperature changes,47 animal handling,46,48 use of injectables,48,49 hair removal, use of topical antiseptics,49 and the asynchronous time of procedure performance which coincides with varied metabolomic states due to known effects of circadian clock on metabolism.50–53 Additional precautions in analyzing data by starting with sublists of SMMs prepared by subtracting SMMs found in sham-treated animals, or cross-examining pathways after analysis of complete data sets to exclude pathways identified in sham-treated animals were essential to ensuring the robustness of results.
Metabolites that were significantly modulated in both sample types (ie, sera and skin biopsies) from burned animals were more pleiotropic and play a role in multiple biological functions relative to those observed in samples from sham-treated animals. This was evidenced by a consistently larger number of pathways generated by smaller numbers of SMMs in samples from burned relative to sham-treated animals. A non-steady temporal trend in metabolome modulation was observed in samples from burned animals. This was represented by a large transient metabolomic response to burn during the early phase after injury (h2) then a rapid decrease by h6 followed by an increase later at h24. This variation in animals’ responses to burn was clearer in sera than skin samples especially when normalized to sham-treated animals of the same time point. The small number of time points and the fairly short observation duration after injury in this work limit the ability to characterize a real-time pattern of metabolome response to burn injury, however, it indicates a multiphasic one and rules out a steadily increasing or decreasing pattern. The immediate inflammatory response in burn samples and background variations introduced by the circadian clock51–53 are likely to contribute to these results especially that some of the used time points here coincided with late-night scheduling.
Complete or partial lists of SMMs that included unique SMMs to each time point or common among all time points were used to identify corresponding pathways. Resultant pathway lists were compared and pathways that were found in sham-treated animal samples were excluded to identify burn-specific pathways. This approach increases data reliability at the expense of eliminating pathways that are modulated in burn and sham-treated samples differently (eg, a pathway that is more intensely or reversely modulated via the inclusion of more metabolites, or steeper/opposite regulation mode of SMMs will be excluded). Results in sera showed that burn induces metabolic changes included different types of vitamin B as well as beta-oxidative degradation of fatty acids (serum, Table 5) after injury. The role of B vitamins in burn and recovery are understudied and remains to be investigated. Modulation of beta-oxidative degradation of different sizes of fatty acids is consistent with the documented mitochondrial dysfunction with implications on oxidative stress, metabolic, and inflammatory status.54–56 The identified disruption of fatty acid metabolism in this work is a likely contributor in the burn-induced oxidative stress, reactive oxygen species accumulation, and energy production shortage. Consistent with known burn-induced hypermetabolic responses,57 which are associated with altered carbon and nitrogen metabolism,58 the arginine and proline metabolism, and glycine serine and threonine metabolism pathways were modulated in sera of burned animals at all time points. Increased rate of arginine disposal has been reported in severely burned patients.59 In agreement with previous findings of modulated fatty acid processing by burn injuries,57 biosynthesis of unsaturated fatty acids, fatty acid biosynthesis, amino sugar and nucleotide sugar metabolism, and ether lipid metabolism were modulated by burn injury at one of the three tested time points (h2, h6, or h24).
Burn injury introduced changes to the skin metabolome which were slower, larger, and less synchronous in terms of affected pathways than those seen in sera. Overall, skin PCA results confirmed a burn-induced metabolome change and showed a wider varying effect on skin metabolome by the model preparation steps and normal tissue functions and properties. The magnitude and level of metabolome separation and the ability to detect these differences seemed to be more challenging in skin biopsies relative to those in sera. This was likely due to more complicated sample collection, preservation, variation, and processing steps; however, the PCA still indicated a clear, burn-induced variation in the metabolomes of animals’ skin which warranted advanced data analysis. The nonlinear relationship between the SMMs number and the number of corresponding pathways was also observed in the skin. This finding underscores the level of burn-specificity of SMMs lists. Ten out of the 11 burn-specific pathways from the analysis of complete SMMs lists were found in the h24 time point suggesting a different response peak for skin and sera. The nature of matrices and component differences between skin and blood might be contributing to the metabolic response difference in these two types of tissue, and while blood is a milieu that pools metabolites secreted from internal organs in response to hormones and other stimulating agents, the majority of skin metabolites are synthesized or received from blood circulation. The Glycerophospholipid metabolism pathway was common to all time points in all experiment-arms suggesting a greater possibility of association with the animal model itself. The small number of SMMs common to all sham time points underscores the highly dynamic nature of the mice metabolome in skin. Analysis of common SMMs in all time points in skin biopsies introduced the arachidonic acid metabolism, linoleic acid metabolism, alpha-linolenic acid metabolism, primary bile acid biosynthesis, biosynthesis of unsaturated fatty acids, and steroid hormone biosynthesis as burn-specific modulated pathways during all time points. Interestingly, all of these pathways, except for the primary bile acid biosynthesis, were identified in sham-treated biopsies in at least one time point when lists of time point-specific SMMs were used in pathway analysis. This commonality suggests a more synchronous metabolic activity in sham-treated uninjured animals relative to burned animals. Further investigation is needed to identify the cause of this asynchronousity in burned-tissue metabolism and its impact on wound healing, especially when these results are integrated with the genomics of burn tissue and molecules known to be active during phases of wound healing.
In conclusion, data from this work validate the use of mice in studying metabolomic changes associated with burn and highlight factors that require additional attention during study design and data analysis. In addition, the data shows that metabolome changes induced by burn vary in the kinetics of response, the magnitude of effect, and affected pathways based on the type of tissue or selected samples (sera vs skin). The phasic response observed in this work calls for longer study duration with more frequent animal sampling to enable a better resolution and more precise characterization of the burn response.
Funding: This work was funded by in part by an intramural grant from MedStar Graduate Medical Education.
Conflicts of interest statement: No conflict of interest is declared.
REFERENCES
- 1. World Health Organization. Burns: Key facts. 2018, March 6, accessed 14 January 2019; Available from: https://www.who.int/news-room/fact-sheets/detail/burns.
- 2. Burns and Traumatic Injury. 2010, accessed 14 January 2019; Available from: https://report.nih.gov/nihfactsheets/Pdfs/BurnsandTraumaticInjury(NIGMS).pdf.
- 3. Ahmad A, Herndon DN, Szabo C. Oxandrolone protects against the development of multiorgan failure, modulates the systemic inflammatory response and promotes wound healing during burn injury. Burns 2019;45:671–81. [DOI] [PubMed] [Google Scholar]
- 4. Pereira CT, Herndon DN. The pharmacologic modulation of the hypermetabolic response to burns. Adv Surg 2005;39:245–61. [DOI] [PubMed] [Google Scholar]
- 5. Herndon DN, Voigt CD, Capek KD, et al. Reversal of growth arrest with the combined administration of oxandrolone and propranolol in severely burned children. Ann Surg 2016;264:421–8. [DOI] [PMC free article] [PubMed] [Google Scholar]
- 6. Chao T, Porter C, Herndon DN, et al. Propranolol and oxandrolone therapy accelerated muscle recovery in burned children. Med Sci Sports Exerc 2018;50:427–35. [DOI] [PMC free article] [PubMed] [Google Scholar]
- 7. Herndon D, Capek KD, Ross E, et al. Reduced postburn hypertrophic scarring and improved physical recovery with yearlong administration of oxandrolone and propranolol. Ann Surg 2018;268:431–41. [DOI] [PMC free article] [PubMed] [Google Scholar]
- 8. Bjerrum JT, Nielsen OH, Wang YL, Olsen J. Technology insight: metabonomics in gastroenterology—basic principles and potential clinical applications. Nat Clin Pract Gastroenterol Hepatol 2008;5:332. [DOI] [PubMed] [Google Scholar]
- 9. Wishart DS. Applications of metabolomics in drug discovery and development. Drugs R D 2008;9:307–22. [DOI] [PubMed] [Google Scholar]
- 10. Nicholls AW, Holmes E, Lindon JC, et al. Metabonomic investigations into hydrazine toxicity in the rat. Chem Res Toxicol 2001;14:975–87. [DOI] [PubMed] [Google Scholar]
- 11. Beger RD, Sun J, Schnackenberg LK. Metabolomics approaches for discovering biomarkers of drug-induced hepatotoxicity and nephrotoxicity. Toxicol Appl Pharmacol 2010;243:154–66. [DOI] [PubMed] [Google Scholar]
- 12. Keun HC. Metabonomic modeling of drug toxicity. Pharmacol Ther 2006;109:92–106. [DOI] [PubMed] [Google Scholar]
- 13. Chen P, Liu J. Metabonomics and diabetes mellitus. Adv Ther 2007;24:1036–45. [DOI] [PubMed] [Google Scholar]
- 14. Wang‐Sattler R, Yu Z, Herder C, et al. Novel biomarkers for pre‐diabetes identified by metabolomics. Mol Syst Biol 2012;8:615. [DOI] [PMC free article] [PubMed] [Google Scholar]
- 15. Zhang AH, Qiu S, Xu HY, Sun H, Wang XJ. Metabolomics in diabetes. Clin Chim Acta 2014;429:106–10. [DOI] [PubMed] [Google Scholar]
- 16. Gulston MK, Titman CM, Griffin JL. Applications of metabolomics to understanding obesity in mouse and man. Biomark Med 2007;1:575–82. [DOI] [PubMed] [Google Scholar]
- 17. Li H, Xie Z, Lin J, et al. Transcriptomic and metabonomic profiling of obesity-prone and obesity-resistant rats under high fat diet. J Proteome Res 2008;7:4775–83. [DOI] [PubMed] [Google Scholar]
- 18. Serkova NJ, Jackman M, Brown JL, et al. Metabolic profiling of livers and blood from obese Zucker rats. J Hepatol 2006;44:956–62. [DOI] [PubMed] [Google Scholar]
- 19. Giovane A, Balestrieri A, Napoli C. New insights into cardiovascular and lipid metabolomics. J Cell Biochem 2008;105:648–54. [DOI] [PubMed] [Google Scholar]
- 20. Lewis GD, Asnani A, Gerszten RE. Application of metabolomics to cardiovascular biomarker and pathway discovery. J Am Coll Cardiol 2008;52:117–23. [DOI] [PMC free article] [PubMed] [Google Scholar]
- 21. Mayr M, Madhu B, Xu Q. Proteomics and metabolomics combined in cardiovascular research. Trends Cardiovasc Med 2007;17:43–8. [DOI] [PubMed] [Google Scholar]
- 22. Armitage EG, Barbas C. Metabolomics in cancer biomarker discovery: current trends and future perspectives. J Pharm Biomed Anal 2014;87:1–11. [DOI] [PubMed] [Google Scholar]
- 23. Rantalainen M, Cloarec O, Beckonert O, et al. Statistically integrated metabonomic-proteomic studies on a human prostate cancer xenograft model in mice. J Proteome Res 2006;5:2642–55. [DOI] [PubMed] [Google Scholar]
- 24. Vermeersch KA, Styczynski MP. Applications of metabolomics in cancer research. J Carcinog 2013;12:9. [DOI] [PMC free article] [PubMed] [Google Scholar]
- 25. Williams RE, Lenz EM, Rantalainen M, Wilson ID. The comparative metabonomics of age-related changes in the urinary composition of male Wistar-derived and Zucker (fa/fa) obese rats. Mol Biosyst 2006;2:193–202. [DOI] [PubMed] [Google Scholar]
- 26. Mäkinen VP, Ala-Korpela M. Metabolomics of aging requires large-scale longitudinal studies with replication. Proc Natl Acad Sci U S A 2016;113:E3470. [DOI] [PMC free article] [PubMed] [Google Scholar]
- 27. Mishur RJ, Rea SL. Applications of mass spectrometry to metabolomics and metabonomics: detection of biomarkers of aging and of age-related diseases. Mass Spectrom Rev 2012;31:70–95. [DOI] [PubMed] [Google Scholar]
- 28. Amathieu R, Triba MN, Goossens C, et al. Nuclear magnetic resonance based metabolomics and liver diseases: Recent advances and future clinical applications. World J Gastroenterol 2016;22:417–26. [DOI] [PMC free article] [PubMed] [Google Scholar]
- 29. Raman M, Ahmed I, Gillevet PM, et al. Fecal microbiome and volatile organic compound metabolome in obese humans with nonalcoholic fatty liver disease. Clin Gastroenterol Hepatol 2013;11:868–75.e1. [DOI] [PubMed] [Google Scholar]
- 30. D’alessandro A, Nemkov T, Moore HB, et al. Metabolomics of trauma-associated death: shared and fluid-specific features of human plasma vs lymph. Blood Transfus 2016;14:185–94. [DOI] [PMC free article] [PubMed] [Google Scholar]
- 31. Ghosh S, Dey DK. A unified modeling framework for metabonomic profile development and covariate selection for acute trauma subjects. Stat Med 2008;27:3776–88. [DOI] [PMC free article] [PubMed] [Google Scholar]
- 32. Parent BA, Seaton M, Sood RF, et al. Use of metabolomics to trend recovery and therapy after injury in critically ill trauma patients. JAMA Surg 2016;151:e160853. [DOI] [PMC free article] [PubMed] [Google Scholar]
- 33. Song T, Zhu Y, Zhang P, et al. Integrated proteomics and metabolomic analyses of plasma injury biomarkers in a serious brain trauma model in rats. Int J Mol Sci 2019;20:922. [DOI] [PMC free article] [PubMed] [Google Scholar]
- 34. Ning M, Wei P, Shen H, et al. Proteomic and metabolomic responses in hepatopancreas of whiteleg shrimp Litopenaeus vannamei infected by microsporidian Enterocytozoon hepatopenaei. Fish Shellfish Immunol 2019;87:534–45. [DOI] [PubMed] [Google Scholar]
- 35. Okuma Y, Morikawa K, Tanaka H, et al. Prospective exosome-focused translational research for afatinib study of non-small cell lung cancer patients expressing EGFR (EXTRA study). Thorac Cancer 2019;10:395–400. [DOI] [PMC free article] [PubMed] [Google Scholar]
- 36. Weiner J 3rd, Maertzdorf J, Sutherland JS, et al. ; GC6-74 consortium . Metabolite changes in blood predict the onset of tuberculosis. Nat Commun 2018;9:5208. [DOI] [PMC free article] [PubMed] [Google Scholar]
- 37. French CD, Willoughby RE, Pan A, et al. NMR metabolomics of cerebrospinal fluid differentiates inflammatory diseases of the central nervous system. PLoS Negl Trop Dis 2018;12:e0007045. [DOI] [PMC free article] [PubMed] [Google Scholar]
- 38. Liu XR, Zheng XF, Ji SZ, et al. Metabolomic analysis of thermally injured and/or septic rats. Burns 2010;36:992–8. [DOI] [PubMed] [Google Scholar]
- 39. Rech MA, Mosier MJ, McConkey K, et al. Outcomes in burn-injured patients who develop sepsis. J Burn Care Res 2019;40:269–73. [DOI] [PMC free article] [PubMed] [Google Scholar]
- 40. Peltonen L, McKusick VA. Genomics and medicine. Dissecting human disease in the postgenomic era. Science 2001;291:1224–9. [DOI] [PubMed] [Google Scholar]
- 41. Speakman JR. Measuring energy metabolism in the mouse - theoretical, practical, and analytical considerations. Front Physiol 2013;4:34. [DOI] [PMC free article] [PubMed] [Google Scholar]
- 42. Walker HL, Mason AD Jr. A standard animal burn. J Trauma 1968;8:1049–51. [DOI] [PubMed] [Google Scholar]
- 43. Holm S. A simple sequentially rejective multiple test procedure. Scand J Stat 1979;6:65–70. [Google Scholar]
- 44. Clark A, Imran J, Madni T, Wolf SE. Nutrition and metabolism in burn patients. Burns Trauma 2017;5:11. [DOI] [PMC free article] [PubMed] [Google Scholar]
- 45. Demetrius L. Of mice and men. When it comes to studying ageing and the means to slow it down, mice are not just small humans. EMBO Rep 2005;6 Spec No:S39–44. [DOI] [PMC free article] [PubMed] [Google Scholar]
- 46. Perrin MR, Richardson EJ. Factors affecting average daily metabolic rate of the fat mouse Steatomys pratensis (Dendromurinae). J Thermal Biol 2005;30:103–9. [Google Scholar]
- 47. Škop V, Guo J, Liu N, et al. Mouse thermoregulation: introducing the concept of the thermoneutral point. Cell Rep 2020;31:107501. [DOI] [PMC free article] [PubMed] [Google Scholar]
- 48. Slupe AM, Kirsch JR. Effects of anesthesia on cerebral blood flow, metabolism, and neuroprotection. J Cereb Blood Flow Metab 2018;38:2192–208. [DOI] [PMC free article] [PubMed] [Google Scholar]
- 49. Chamberlain M, Koutsogiannaki S, Schaefers M, Babazada H, Liu R, Yuki K. The differential effects of anesthetics on bacterial behaviors. PLoS One 2017;12:e0170089. [DOI] [PMC free article] [PubMed] [Google Scholar]
- 50. Chew RM, Lindberg RG, Hayden P. Circadian rhythm of metabolic rate in pocket mice. J Mammal 1965;46:477–94. [PubMed] [Google Scholar]
- 51. Maury E. Off the clock: from circadian disruption to metabolic disease. Int J Mol Sci 2019;20:1597. [DOI] [PMC free article] [PubMed] [Google Scholar]
- 52. Ray S, Reddy AB. Cross-talk between circadian clocks, sleep-wake cycles, and metabolic networks: dispelling the darkness. Bioessays 2016;38:394–405. [DOI] [PMC free article] [PubMed] [Google Scholar]
- 53. Bailey SM, Udoh US, Young ME. Circadian regulation of metabolism. J Endocrinol 2014;222:R75–96. [DOI] [PMC free article] [PubMed] [Google Scholar]
- 54. Zang Q, Maass DL, White J, Horton JW. Cardiac mitochondrial damage and loss of ROS defense after burn injury: the beneficial effects of antioxidant therapy. J Appl Physiol (1985) 2007;102:103–12. [DOI] [PMC free article] [PubMed] [Google Scholar]
- 55. Szczesny B, Brunyánszki A, Ahmad A, et al. Time-dependent and organ-specific changes in mitochondrial function, mitochondrial DNA integrity, oxidative stress and mononuclear cell infiltration in a mouse model of burn injury. PLoS One 2015;10:e0143730. [DOI] [PMC free article] [PubMed] [Google Scholar]
- 56. Padfield KE, Astrakas LG, Zhang Q, et al. Burn injury causes mitochondrial dysfunction in skeletal muscle. Proc Natl Acad Sci U S A 2005;102:5368–73. [DOI] [PMC free article] [PubMed] [Google Scholar]
- 57. Clark A, Imran J, Madni T, Wolf SE. Nutrition and metabolism in burn patients. Burns Trauma 2017;5:11. [DOI] [PMC free article] [PubMed] [Google Scholar]
- 58. Izamis ML, Sharma NS, Uygun B, et al. In situ metabolic flux analysis to quantify the liver metabolic response to experimental burn injury. Biotechnol Bioeng 2011;108:839–52. [DOI] [PMC free article] [PubMed] [Google Scholar]
- 59. Yu YM, Ryan CM, Castillo L, et al. Arginine and ornithine kinetics in severely burned patients: increased rate of arginine disposal. Am J Physiol Endocrinol Metab 2001;280:E509–17. [DOI] [PubMed] [Google Scholar]


