

Abstract
Identifying the tissue-specific molecular signatures of active regulatory elements is critical to understand gene regulatory mechanisms. Here, we identify transcription start sites (TSS) using cap analysis of gene expression (CAGE) across 57 human pancreatic islet samples. We identify 9,954 reproducible CAGE tag clusters (TCs), ∼20% of which are islet specific and occur mostly distal to known gene TSS. We integrated islet CAGE data with histone modification and chromatin accessibility profiles to identify epigenomic signatures of transcription initiation. Using a massively parallel reporter assay, we validated the transcriptional enhancer activity for 2,279 of 3,378 (∼68%) tested islet CAGE elements (5% false discovery rate). TCs within accessible enhancers show higher enrichment to overlap type 2 diabetes genome-wide association study (GWAS) signals than existing islet annotations, which emphasizes the utility of mapping CAGE profiles in disease-relevant tissue. This work provides a high-resolution map of transcriptional initiation in human pancreatic islets with utility for dissecting active enhancers at GWAS loci.
Introduction
Genome-wide association studies (GWAS) for complex diseases such as type 2 diabetes (T2D) have identified hundreds of signals associated with disease risk; however, most of these lie in non-protein-coding regions and the underlying mechanisms are still unclear (1). T2D GWAS variants are highly enriched to overlap islet-specific enhancer regions, which suggests that these variants affect gene expression (2–4). Many GWAS signals are marked by numerous single nucleotide polymorphisms (SNPs) in high linkage disequilibrium (LD), which makes identifying causal SNPs extremely difficult using genetic information alone.
For delineating regulatory elements, profiling histone modifications such as the enhancer-associated H3 lysine 27 acetylation (H3K27ac) (5,6) and the promoter-associated H3 lysine 4 trimethylation (H3K4me3) (6,7), among others, can be useful. However, the identified regions typically span hundreds of base pairs (bp). Profiling transcription factor (TF)-accessible chromatin regions can identify the functional DNA bases with these broad regulatory elements in pancreatic islets (1,4,8–12). Integrating other epigenomic data such as DNA methylation and chromatin looping has been valuable in identifying biological mechanisms (4,13,14). Transcription is a robust predictor of enhancer activity, and a subset of enhancers are transcribed into enhancer RNA (eRNA) (15,16). eRNAs are nuclear, short, mostly unspliced, 5′ capped, usually nonpolyadenylated, and usually bidirectionally transcribed (15,17,18). Therefore, identifying the location of transcription initiation can pinpoint active enhancer regulatory elements in addition to active promoters.
Genome-wide sequencing of 5′-capped RNAs with cap analysis of gene expression (CAGE) can detect transcription start sites (TSS) (15,17). CAGE can be applied on RNA samples from hard-to-acquire biological tissue such as islets and does not require live cells that are imperative for other TSS profiling techniques such as a variation of global run-on sequencing (GRO-seq) called GRO-cap (19–21). The functional annotation of the mammalian genome (FANTOM) project (22) has generated a CAGE expression atlas across 573 primary cell types and tissues, including the pancreas. However, pancreatic islets that secrete insulin and are relevant for T2D and related traits constitute only ∼1% of the pancreas tissue. Therefore, a pancreas TSS map may not accurately represent the islet TSS landscape. To date, there are no publicly available CAGE data sets for islet tissue. Here, we present a CAGE-based TSS map of pancreatic islets with enhancer validation using a massively parallel reporter assay (MPRA). Finally, we integrate our data with existing epigenomic data sets to reveal molecular signatures of noncoding islet elements and their role in T2D and related traits.
Research Design and Methods
Sample Collection and CAGE Library Preparation
We processed 71 human pancreatic islet samples obtained from unrelated organ donors (Supplementary Table 1) received from the Integrated Islet Distribution Program, the National Disease Research Interchange, and Prodo Laboratories. We prewarmed islets to 37°C in shipping media for 1–2 h before harvest. Total RNA from 2,000–3,000 islet equivalents was extracted and purified with Trizol (Life Technologies). RNA quality was confirmed with Bioanalyzer 2100 (Agilent); samples with RNA integrity number >6.5 were prepared for CAGE sequencing. We sent 1 μg total RNA per sample to DNAFORM (Kanagawa, Japan), where CAGE libraries were generated. The library preparation included polyA-negative selection and size selection (<1,000 bp) in an attempt to enrich for the short and nonpolyadenylated eRNA transcripts. Stranded CAGE libraries were generated for each islet sample with use of the no-amplification nontagging CAGE libraries for Illumina next-generation sequencers (nAnT-iCAGE) protocol (23). Each islet CAGE library was barcoded and was pooled into 24-sample batches and sequenced over multiple lanes of HiSeq 2000. All procedures followed ethics guidelines of the National Institutes of Health (NIH).
CAGE Data Processing
We trimmed adapter sequences and mapped the reads to hg19, performed unique molecular identifier–based deduplication, and identified TSS. We selected 57 islet samples with strandedness measures >0.85 calculated from Quality of RNA-seq Tool-Set (QoRTS) (24) for all downstream analyses. We identified tag clusters (TCs) in each sample in a strand-specific manner using paraclu (25), allowing single bp TCs (“singletons”) if supported by more than two tags. We identified a “consensus” set of reproducible islet TCs by merging TCs on each strand across samples and retaining segments supported by a conservative threshold of 10 samples (Supplementary Fig. 1). We then filtered out regions blacklisted by the Encyclopedia of DNA Elements (ENCODE) consortium. The TC coordinates for the selected threshold and a more lenient threshold of 5 are shared in Supplementary Table 2.
We downloaded the FANTOM CAGE-TSS data for 118 tissues (https://fantom.gsc.riken.jp/5/datafiles/latest/basic/human.tissue.hCAGE/) (22) and called TCs using paraclu (25) with the same parameters as described above.
Overlap Enrichment Between Annotations
Enrichment for overlap between islet TCs and various annotations was calculated with the Genomic Association Tester (GAT) tool (26). GAT randomly samples segments from the genomic workspace and computes the expected overlaps. We used 10,000 GAT samplings for each enrichment run and obtained empirical P values.
Experimental Validation Using MPRA
We generated a barcoded plasmid library of N = 7,188 islet CAGE elements (198 bp flanked by 16 bp anchors) to test in the MPRA. We electroporated 50 μg of library into 25 million 832/13 rat insulinoma cells in three biological replicates, harvested the cells 24 h later, and isolated total RNA. We mapped the bar codes corresponding to each CAGE element in the MPRA plasmid using PCR and sequencing. We sequenced the input DNA bar code library along with three cDNA barcode libraries. We quantified bar code counts while accounting for sequencing errors using the sequence clustering algorithm Starcode (https://github.com/gui11aume/starcode) (27) and removed PCR duplicates using the unique molecular identifier (https://github.com/parkerlab/starr-seq-analysis-pipeline). We selected N = 3,446 quantifiable CAGE elements, which had at least two bar codes each with at least 10 DNA counts. We used MPRAnalyze (version 1.3.1) (https://github.com/yoseflab/mpranalyze) (28) to model DNA and RNA counts in negative binomial generalized linear models to quantify enhancer activities. To estimate the null in our experiment, within MPRAnalyze, we conservatively assume that the mode of the distribution of transcription activity estimates is the center of the null distribution. Therefore, values lower than the mode are used to estimate the null variance.
Least Absolute Shrinkage and Selection Operator Regression
We modeled the CAGE element MPRA z scores as a function of TF motif occurrences within the element using least absolute shrinkage and selection operator (LASSO) regression. We identified 540 nonredundant motifs (Supplementary Information) and scanned for these in the hg19 reference using Find Individual Motif Occurrences (FIMO) (29). For each CAGE element, we considered the inverse-normalized (RNOmni package, version 0.7.1) FIMO −log10 (P value) of each motif occurrence as motif “scores.” We again inverse normalized the scores for each TF motif across the CAGE elements so that the regression coefficients would be comparable across motifs. The LASSO regression was run with use of the glmnet package (v2.0-16) with parameter α = 1.
Functional GWAS Analyses and Fine Mapping
We used fgwas (version 0.3.6) (30) to compute enrichment of GWAS and expression quantitative trait loci (eQTL) data in TC-related and other annotations. We obtained summary data for T2D GWAS (1) and islet eQTL (31) and lymphoblastoid cell line eQTL (32) and organized summary statistics as required by fgwas. For eQTL data, we selected SNP-gene associations for eGenes identified at 1% false discovery rate (FDR) and included a unique “SEGNUMBER” for each eGene. We used fgwas with default parameters for enrichment analyses and included the “-fine” flag for eQTL analyses.
We performed conditional analyses using the “-cond” option where the enrichment parameters for the first annotation were modeled and fixed the maximum likelihood values. An additional parameter for the second annotation was included and estimated.
To reweight GWAS summary data based on functional annotation overlap, we used the -print option while including multiple annotations in the model that were individually enriched or depleted. We included islet active TSS, active enhancer, quiescent and polycomb repressed chromatin states, and Assay for Transposable-Accessible Chromatin with high-throughput sequencing (ATAC-seq) peaks with or without TCs.
Data and Resource Availability
We submitted islet CAGE data to the database of Genotypes and Phenotypes (dbGaP) (phs001188.v2.p1) and MPRA data to Gene Expression Omnibus (GEO) (GSE137693). A UCSC Genome Browser session is available from https://genome.ucsc.edu/s/arushiv/cage_2021. Scripts are shared on GitHub (https://github.com/ParkerLab/islet_cage), and the processed data files are at Zenodo (https://zenodo.org/record/3524578).
Results
The CAGE Landscape in Human Pancreatic Islets
We performed CAGE in 71 human pancreatic islet total RNA samples obtained from unrelated organ donors (Supplementary Table 1). Selecting 57 high-quality sample’s, we identified a consensus set of 9,954 reproducible TCs (median length of 176 bp) (Supplementary Fig. 2 and Supplementary Table 2), spanning a total genomic territory of ∼2.4 Mb. As a resource, Supplementary Table 3 includes the islet TC identified to be the closest to a known gene TSS (GENCODE Human Release 19 [GENCODE V19]) (33). To explore the chromatin landscape underlying islet TCs, we overlaid publicly available chromatin immunoprecipitation sequencing data for five histone modifications (Supplementary Table 4) integrated into 11 distinct chromatin states using ChromHMM (34) (Supplementary Fig. 3 and Supplementary Information), along with bulk and single nucleus ATAC-seq data in islets (10,12). Figure 1A shows an example islet TC in the intronic region of the ST18 gene that overlaps the islet active TSS chromatin state and an ATAC-seq peak. Importantly, this region does not overlap any annotated TSS on the basis of conservative definitions from coding/noncoding/pseudogene genes in both GENCODE V19, the official hg19 release, and GENCODE V33 lifted over to hg19 (V33lift37). The regulatory activity of this element was validated by the VISTA Enhancer Browser in an in vivo reporter assay in mouse embryos (35).
Figure 1.
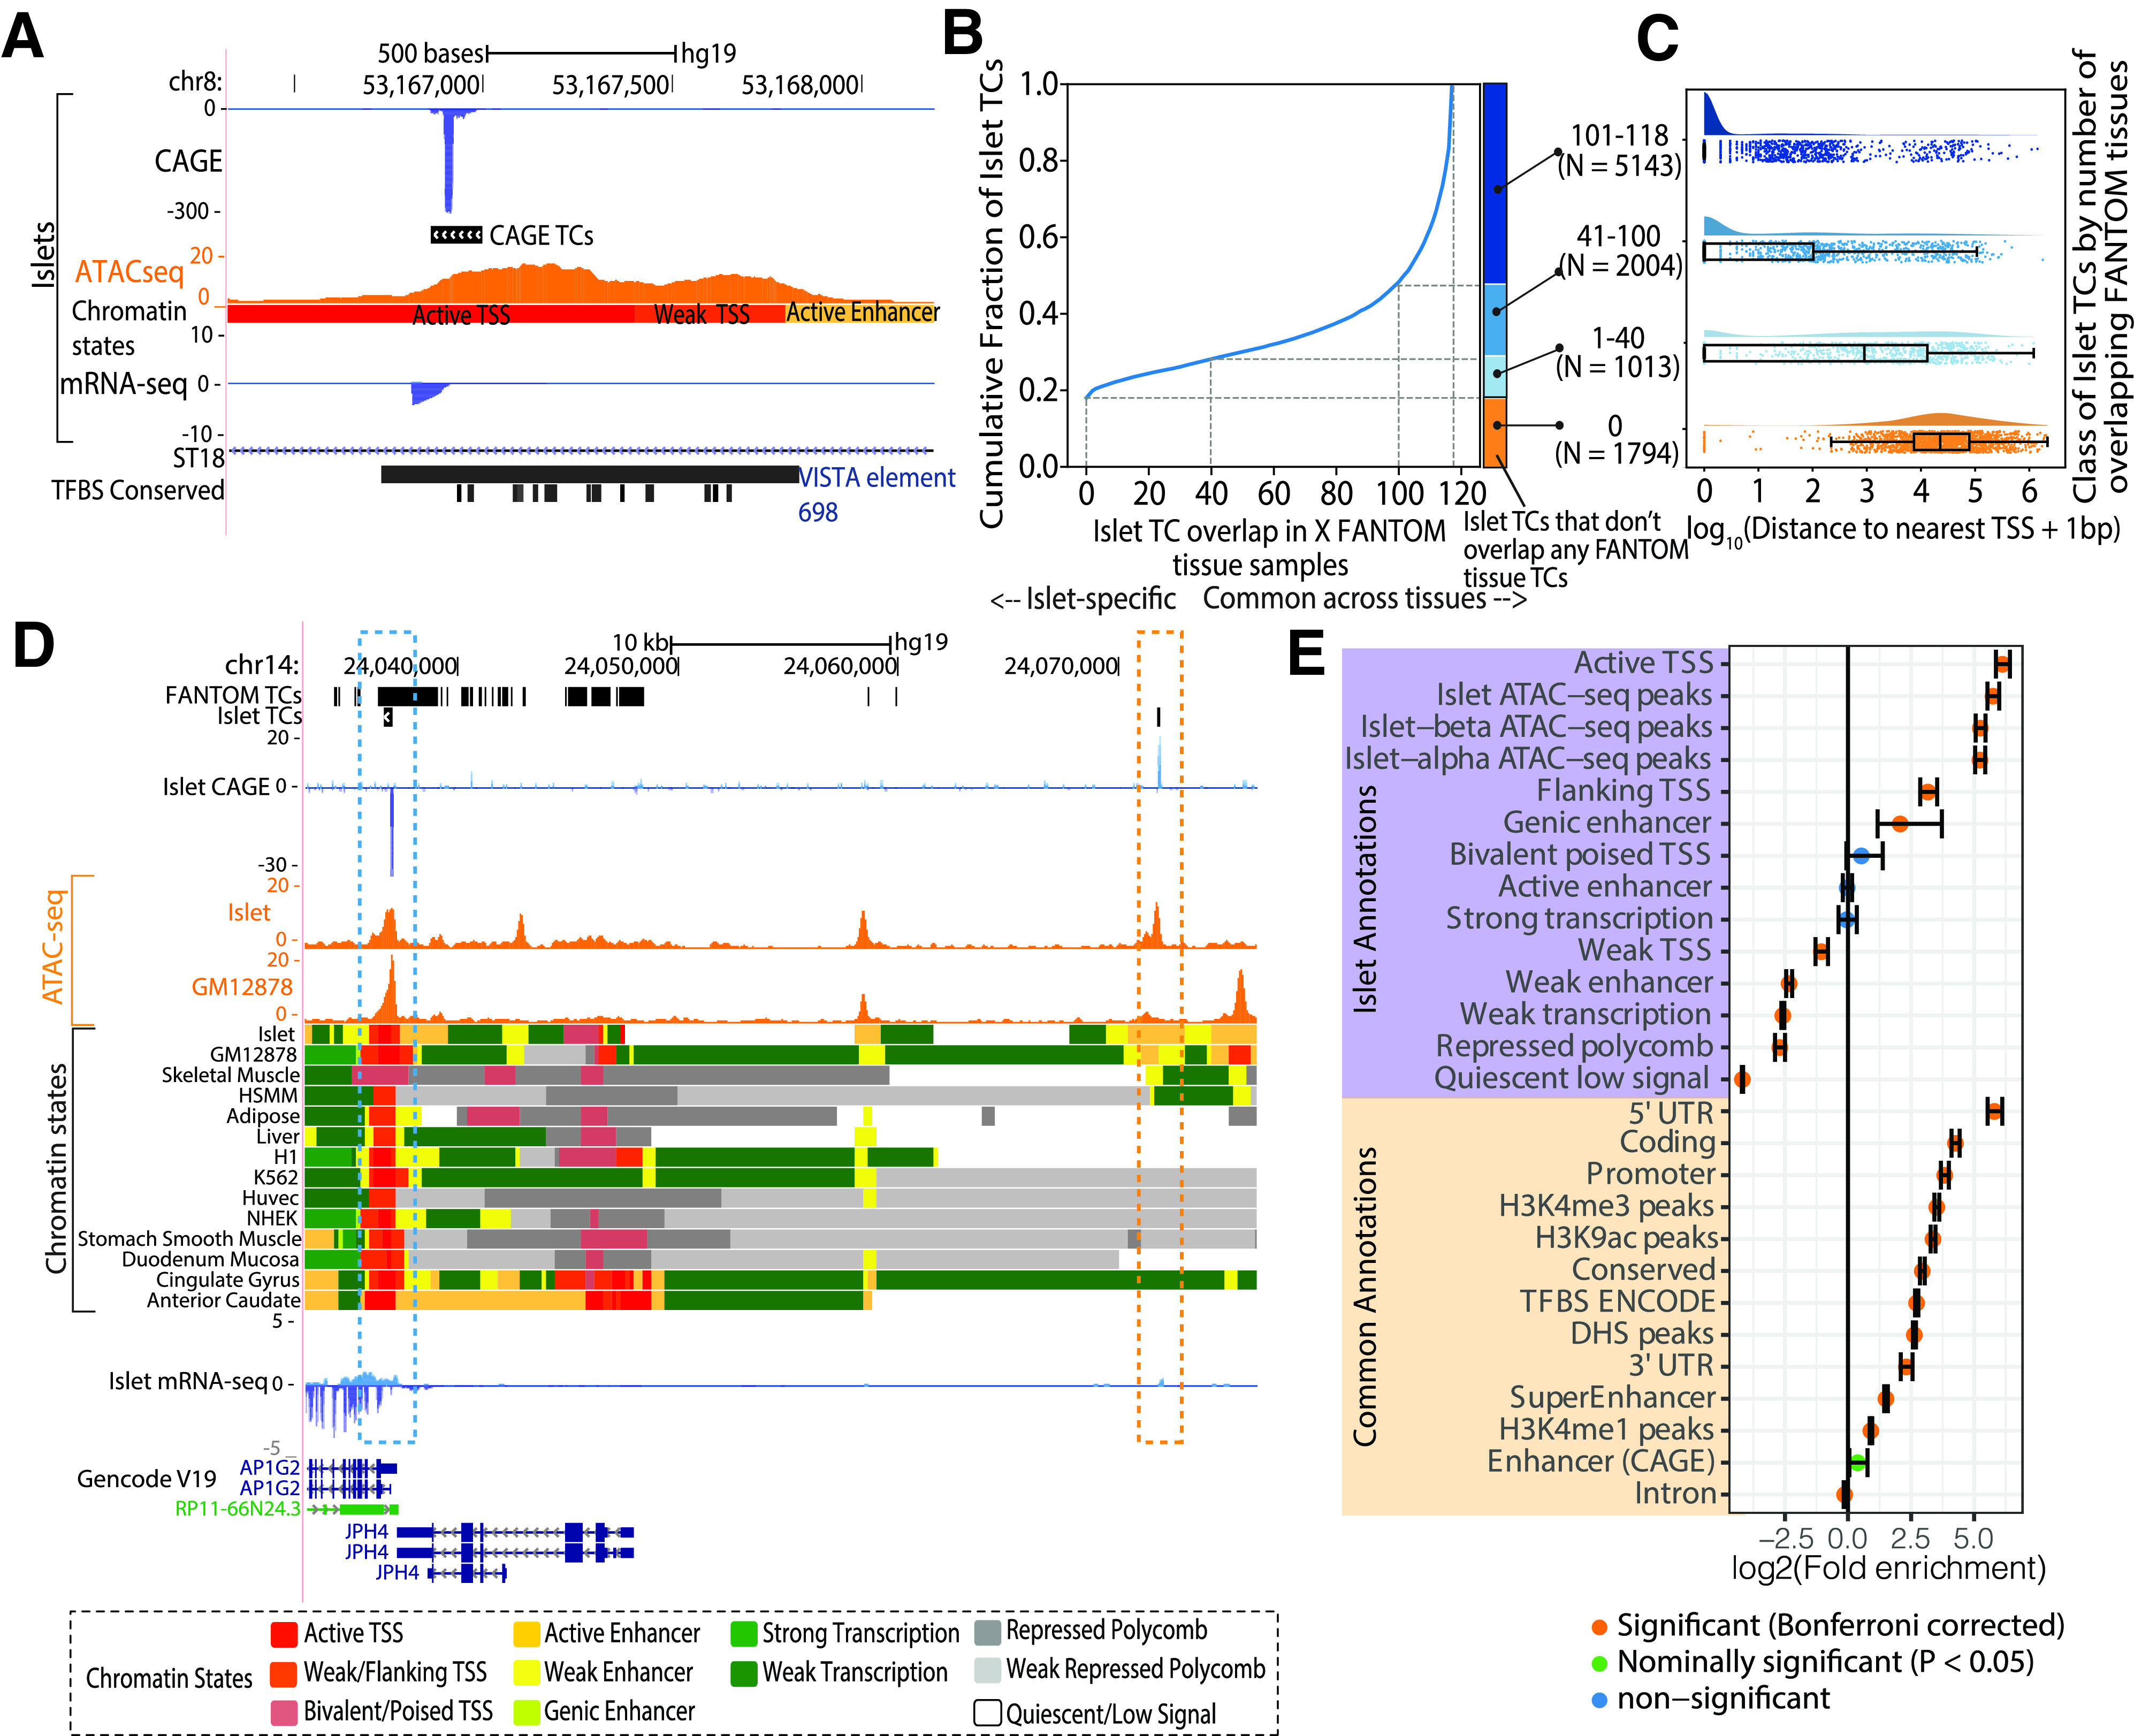
Islet CAGE TC identification. A: Genome browser view of the intronic region of the ST18 gene as an example locus where an islet TC overlaps an islet ATAC-seq peak and active TSS chromatin state. This TC also overlaps an enhancer element, which was validated by the VISTA Enhancer Browser (35). Also shown is the human-mouse-rat conserved TF binding site (TFBS) track from the TRANSFAC matrix database (51). B: Cumulative fraction of islet TC segments overlapping with TCs identified in X number of FANTOM tissues. C: Distribution of the log10(distance to the nearest known protein-coding gene TSS + 1 bp) with classification of islet TC segments by the number of FANTOM tissues where TCs overlap. Number of TC segments in each category is shown in parentheses. D: Genome browser view of an example locus near the AP1G2 gene that highlights an islet TC (blue box) that is also identified in FANTOM tissues (FANTOM TCs track is a dense depiction of TCs called across 118 human tissues), occurs in a ATAC-seq peak region in both islets and GM12878 (ATAC-seq track), and overlaps active TSS chromatin states across numerous tissues. Another islet TC (orange box) ∼34 kb distal to the AP1G2 gene is not identified as a TC in other FANTOM tissues and occurs in an islet ATAC-seq peak and a more islet-specific active enhancer chromatin state region. E: Enrichment of islet TCs to overlap islet chromatin state and other common annotations. Error bars represent the 95% CIs. Bonferroni correction accounted for 40 total annotations. HSMM, human skeletal muscle myoblasts; Huvec, Human umbilical vein endothelial cells; mRNA-seq, mRNA sequencing; NHEK, normal human epidermal keratinocytes; UTR, untranslated region.
We next compared our islet CAGE data with FANTOM CAGE data available for 118 human tissues (22). Islet TCs showed the highest overlap with pancreas (Supplementary Fig. 4). Approximately 20% of islet TCs were unique to islets (N = 1,974 with no overlap in any FANTOM tissue), whereas ∼60% of islet TCs were shared across ≥60 FANTOM tissues (Fig. 1B). With categorizing of islet TC segments by the number of FANTOM tissues in which they overlap TCs (colored bars in Fig. 1B), islet-specific TCs (0 overlap with FANTOM) occurred farthest from known TSS (Fig. 1C). We highlight an example locus where an islet TC in the AP1G2 gene occurs in active TSS chromatin states across multiple tissues and overlaps shared ATAC-seq peaks in islet and the lymphoblastoid cell line GM12878 (36) (Fig. 1D, blue box). TCs across FANTOM tissues are identified in this region (Fig. 1D, FANTOM TCs track). The islet TC segment (Fig. 1D, blue box) overlaps TCs in 88 FANTOM tissues. Another islet TC ∼34 kb away, however, occurs in a region lacking gene annotations and overlaps a more islet-specific active enhancer chromatin state and ATAC-seq peak (Fig. 1D, orange box). This region was not identified as a TC in any of the 118 analyzed FANTOM tissues. At other islet-relevant loci such as the potassium channel subfamily K gene KCNK16 TSS, we observe TCs in islets but not in any other FANTOM tissues (Supplementary Fig. 5). Collectively, these results highlight that CAGE profiling in islets identifies islet-specific sites of transcription initiation, including at TSS-distal enhancers.
We computed the enrichment of islet TCs in islet annotations such as chromatin states and ATAC-seq peaks (identified in bulk islets and in islet α- and β-cells [10,12]) and other “common” annotations including annotations aggregated across multiple cell types using GAT (26). Islet TCs were highly enriched to overlap islet active TSS chromatin states (fold enrichment = 69.72, P value = 1e−04) (Fig. 1E and Supplementary Table 5), as expected, since the transcription initiation sites would likely resemble the “active TSS” chromatin state. TCs identified in FANTOM tissues that also had publicly available chromatin data (37) were also overwhelmingly enriched to overlap active TSS chromatin states in the corresponding tissue, which demonstrates how our protocol yielded CAGE profiles comparable with existing data (Supplementary Fig. 6). Islet-specific TCs were more enriched for islet active enhancer chromatin states (Supplementary Fig. 7). Islet TCs were enriched in bulk islet and islet α- and β-cell ATAC-seq peaks (for all three annotations, fold enrichment >37.58, P value = 1e−04) (Fig. 1E), signifying that the identified transcription initiation sites constitute TF-accessible chromatin.
Aggregated CAGE signal over ATAC-seq narrow peak summits highlighted a bidirectional pattern of transcription initiation flanking the ATAC-seq peak summit (Fig. 2A). Conversely, anchoring in the islet TC centers showed that the ATAC-seq signal summit lies upstream (relative to CAGE strand) of the TC center (Fig. 2B). Islet TF footprint motifs (binding sites supported by islet ATAC-seq data and TF DNA-binding motifs) (10) were more enriched to overlap the 500 bp TC upstream region compared with the 500 bp downstream region relative to TCs (Fig. 2C and Supplementary Table 6). These observations show that, as expected, the region just upstream of the TC is highly accessible where more TF binding events occur and indicate the high quality of our islet TC map.
Figure 2.
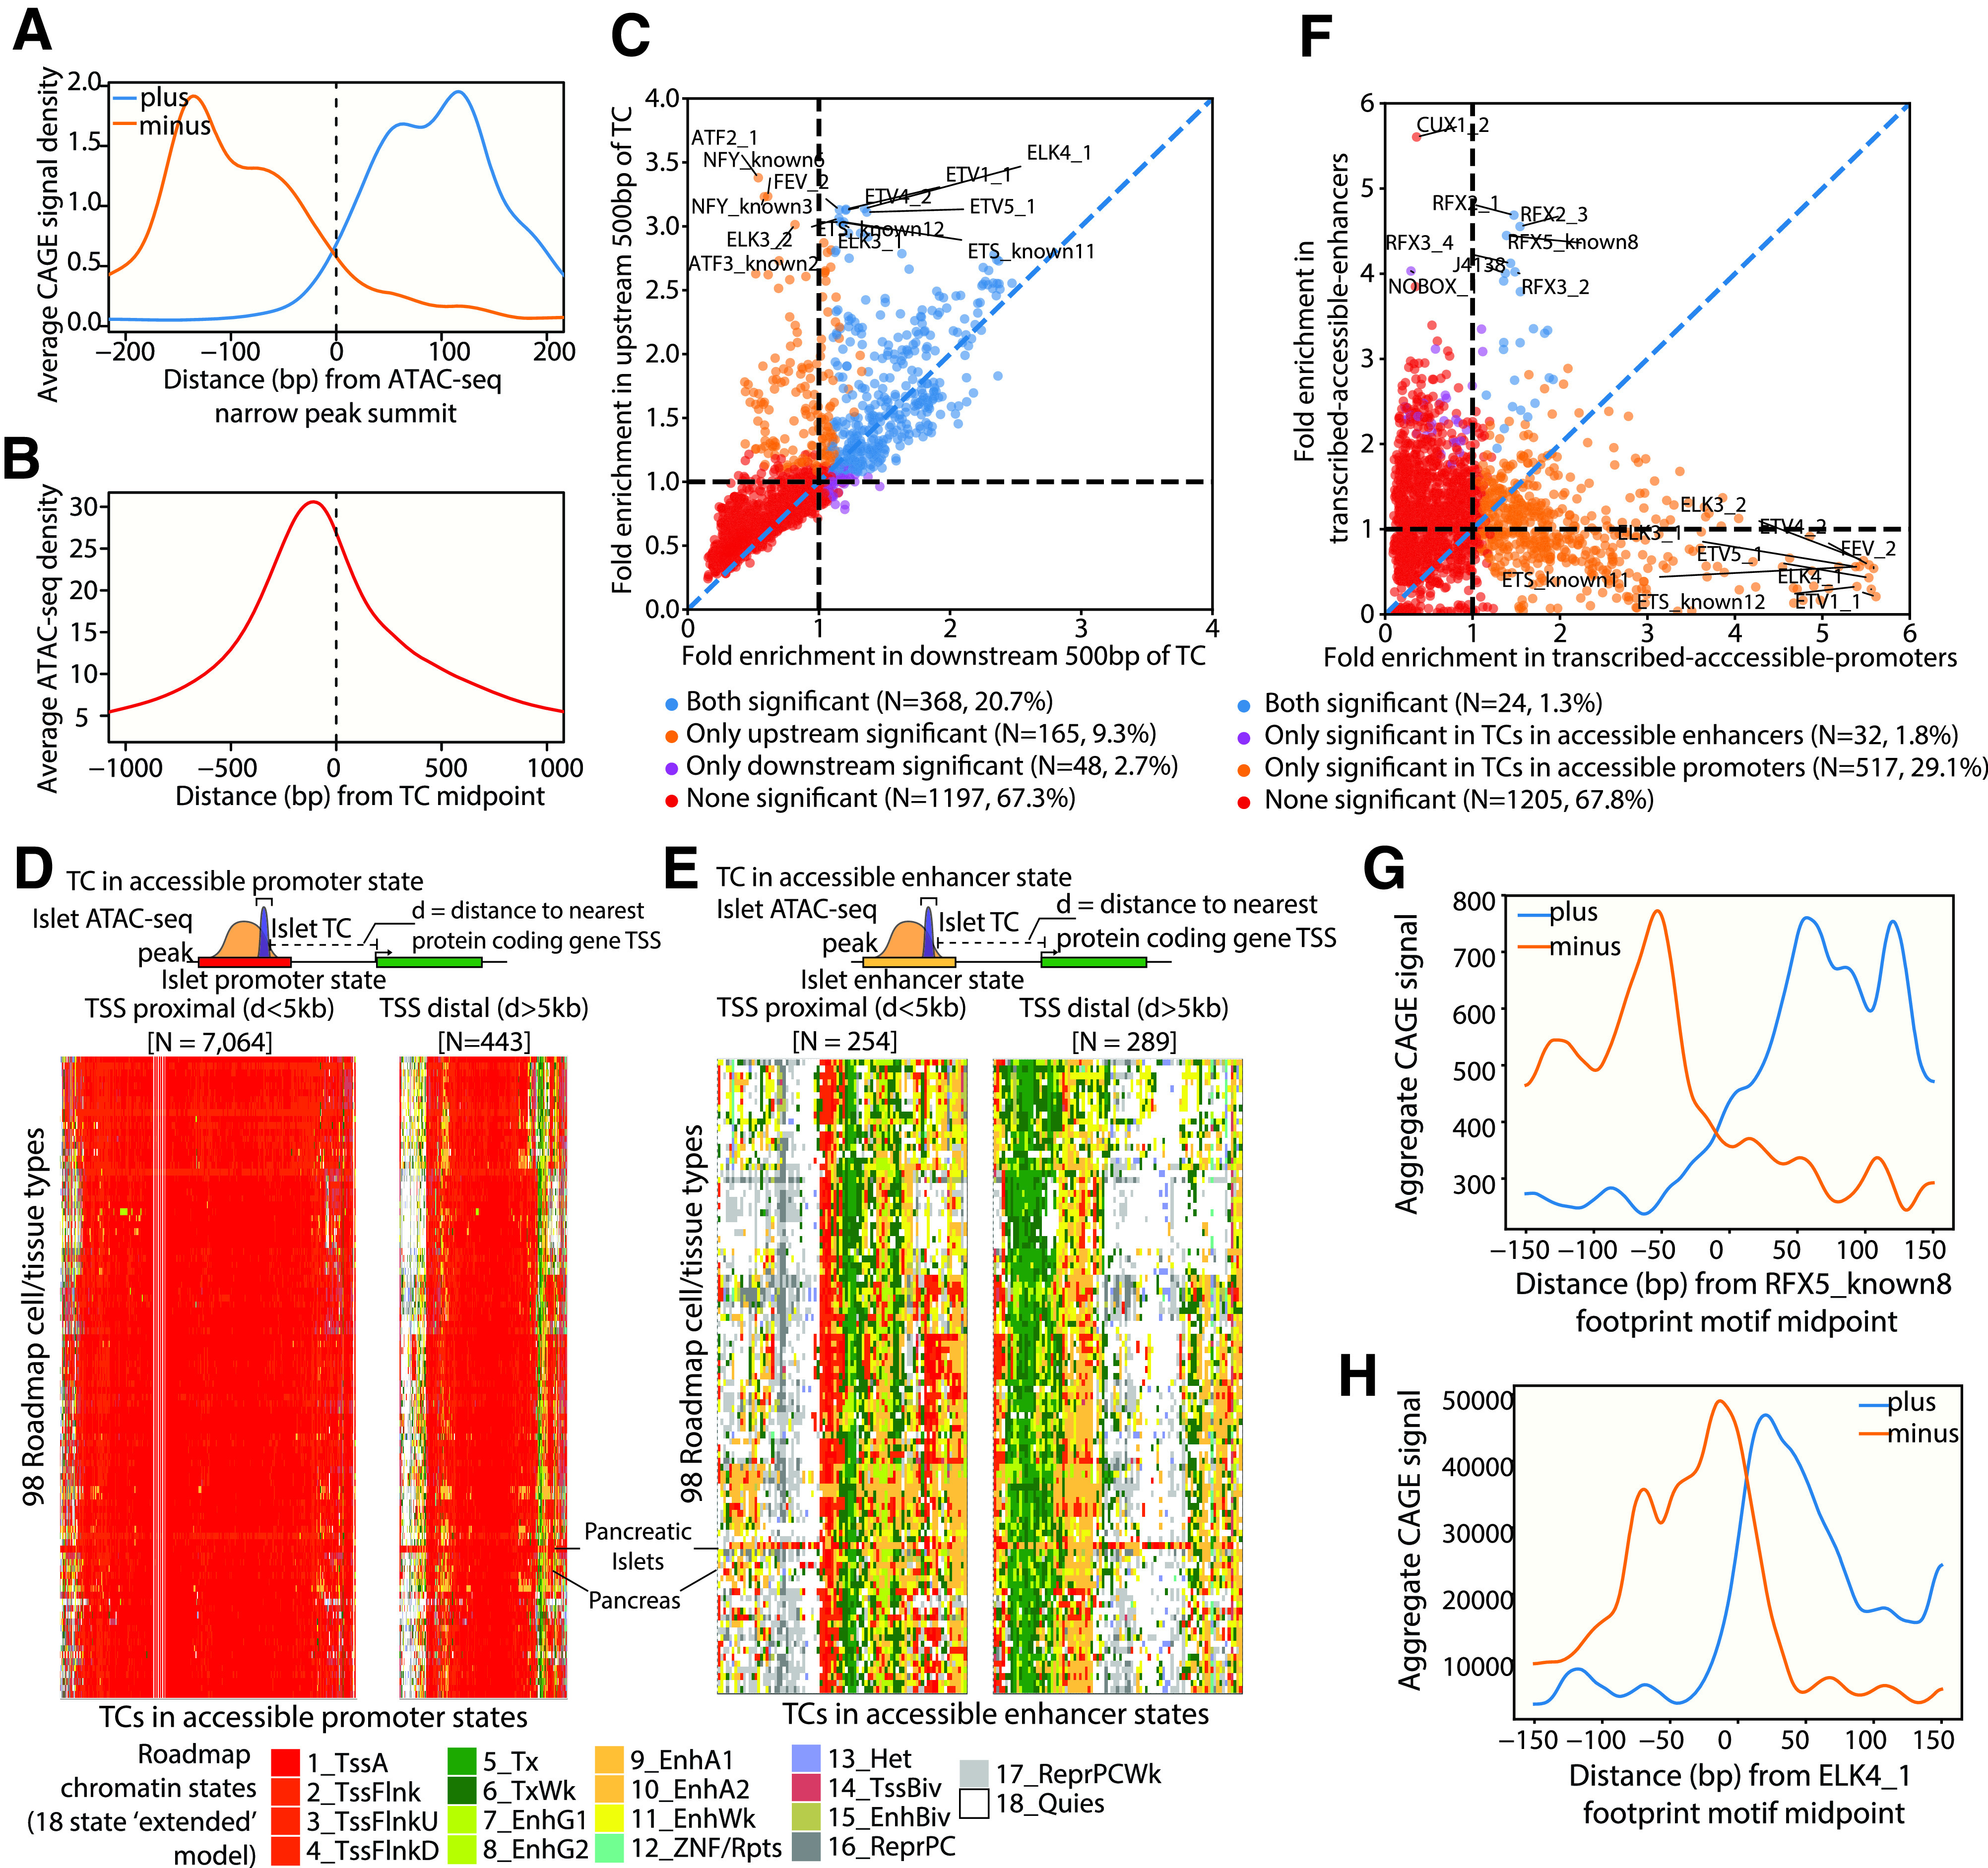
Integrating Islet CAGE TCs with other epigenomic information reveals characteristics of transcription initiation. A: Aggregate CAGE profiles over ATAC-seq peak summits. B: Aggregate ATAC-seq profile over TC midpoints. C: Enrichment of TF footprint motifs to overlap 500 bp upstream region (y-axis) vs. 500 bp downstream region (x-axis) of islet TCs. Colors denote whether a TF footprint motif was significantly enriched (5% FDR correction, Benjamini-Yekutieli method) to overlap only upstream regions, only downstream regions, both, or none. D: Chromatin state annotations across 98 Roadmap Epigenomics cell types (18-state “extended model”) (37) for TC segments that occur in islet promoter chromatin states (11-state model) and overlap ATAC-seq peaks. These segments were segregated into those occurring 5 kb proximal (left) (N = 7,064 TC segments) and distal (right) (N = 443 TC segments) to known protein-coding gene TSS (GENCODE V19). E: Chromatin state annotations across 98 Roadmap Epigenomics cell types (18-state extended model) for TC segments that occur in islet enhancer chromatin states (11-state model) and overlap ATAC-seq peaks, segregated into those occurring 5 kb proximal (left) (N = 254 TC segments) and distal (right) (N = 289 TC segments) to known protein-coding gene TSS. Note that the heat map widths in D and E are scaled to aid in interpretability. F: Enrichment of TF footprint motifs to overlap TCs occurring in accessible enhancer chromatin states (y-axis) vs. TCs occurring in accessible promoter chromatin states (x-axis). Colors denote whether a TF footprint-motif was significantly enriched (5% FDR correction, Benjamini-Yekutieli method) to overlap only TCs in accessible enhancer regions, only TCs in accessible promoter regions, both, or none. G: Aggregate CAGE profiles centered and oriented relative to RFX5_known8 footprint motifs occurring in 5 kb TSS distal regions. H: Aggregate CAGE profiles centered and oriented relative to ELK4_1 footprint motifs.
We next compared the characteristics of TCs that occur in accessible regions of two main regulatory classes: promoters and enhancers. We considered TCs in ATAC-seq peaks in promoter (active, weak, or flanking TSS) versus enhancer (active, weak, or genic enhancer) chromatin states either 5 kb proximal or distal from the nearest protein-coding genes (GENCODE V19). We then explored the chromatin landscape at these regions across 98 Roadmap Epigenomics cell types using the 18-state “extended model” (37). TSS proximal islet TCs in accessible promoter states (N = 7,064 segments) were nearly ubiquitously identified as promoter states across Roadmap Epigenomics cell types (Fig. 2D, left). A subset of TSS distal islet TCs in accessible islet promoter states (N = 443 segments) were more specific for pancreatic islets (Fig. 2D, right). In contrast, islet TCs in accessible islet enhancer states, both proximal (N = 254 segments) and distal (N = 289 segments) to known gene TSS, more specifically overlapped enhancer states in islets (Fig. 2E). Such specificity was not observed for whole pancreas (Fig. 2D and E), which highlights differences in the chromatin architecture underlying islet TCs in islets versus pancreas.
Footprint motifs for the regulatory factor X (RFX) TF family were enriched to overlap both enhancer and promoter states; however, the fold enrichment in enhancers was considerably higher in comparison with promoters (for five different motifs: enhancer, >4.0-fold; promoter, 1.3- to 1.5-fold; P value = 1e−4) (Fig. 2F and Supplementary Table 7). TCs in accessible promoter regions were highly enriched to overlap footprint motifs of the E26 transformation-specific (ETS) TF family (Fig. 2F). We observed divergent aggregate CAGE profiles over TF footprint motifs enriched in enhancers, e.g., RFX5_known8 footprint motifs in 5 kb TSS distal regions and ELK4_1 motifs (Fig. 2G and H). These results highlight the characteristics of transcription initiation sites based on the underlying chromatin context.
Experimental Validation of Transcribed Regions
We experimentally validated the enhancer activity of islet CAGE-profiled regions. Self-transcribing active regulatory region sequencing (STARR-seq) is an MPRA technique where candidate elements are cloned downstream of the core promoter into a reporter gene’s (e.g., GFP) 3′-untranslated region, and enhancer activity of the elements leads to reporter mRNA transcription harboring the candidates’ sequences (38–40). We generated a library of 7,188 candidate CAGE elements (198 bp each) and used a modified MPRA approach, cloning the elements 3′ to the GFP polyA signal and cloning a random 16-bp bar code into the GFP 3′ region so that each candidate enhancer element is represented by multiple transcribed barcodes. We transfected the MPRA libraries into the rat β-cell insulinoma (INS1 832/13) cell line in triplicate, extracted DNA and RNA, and sequenced the bar codes as the reporter readout. After quality control procedures (Research Design and Methods) we identified 3,378 quantifiable CAGE elements. We observed high correlations between the normalized sum of RNA counts of the CAGE element bar codes across the three biological replicates (Pearson r = 0.97) (Supplementary Fig. 8). We modeled the RNA and DNA bar code counts in generalized linear models (Supplementary Table 8) and observed that ∼68% (N = 2,279) of the quantifiable CAGE elements showed significant enhancer activity (5% FDR) (Fig. 3A, top), a large fraction of which occurred in promoter states (Fig. 3A, bottom). CAGE elements in promoter states showed higher MPRA activity compared with the elements in enhancer states (Wilcoxon rank sum test P = 1.02 × 10⁻⁶) (Fig. 3B). CAGE elements overlapping ATAC-seq peaks showed higher enhancer activities than elements not in ATAC-seq peaks (Wilcoxon rank sum test P = 5.50 × 10⁻¹⁶) (Fig. 3C), and elements 5 kb proximal to protein-coding gene TSS showed higher enhancer activities then TSS distal elements (Wilcoxon rank sum test P = 5.38 × 10⁻⁹) (Fig. 3D). These results are consistent with results of a recent MPRA study in GM12878 (41).
Figure 3.
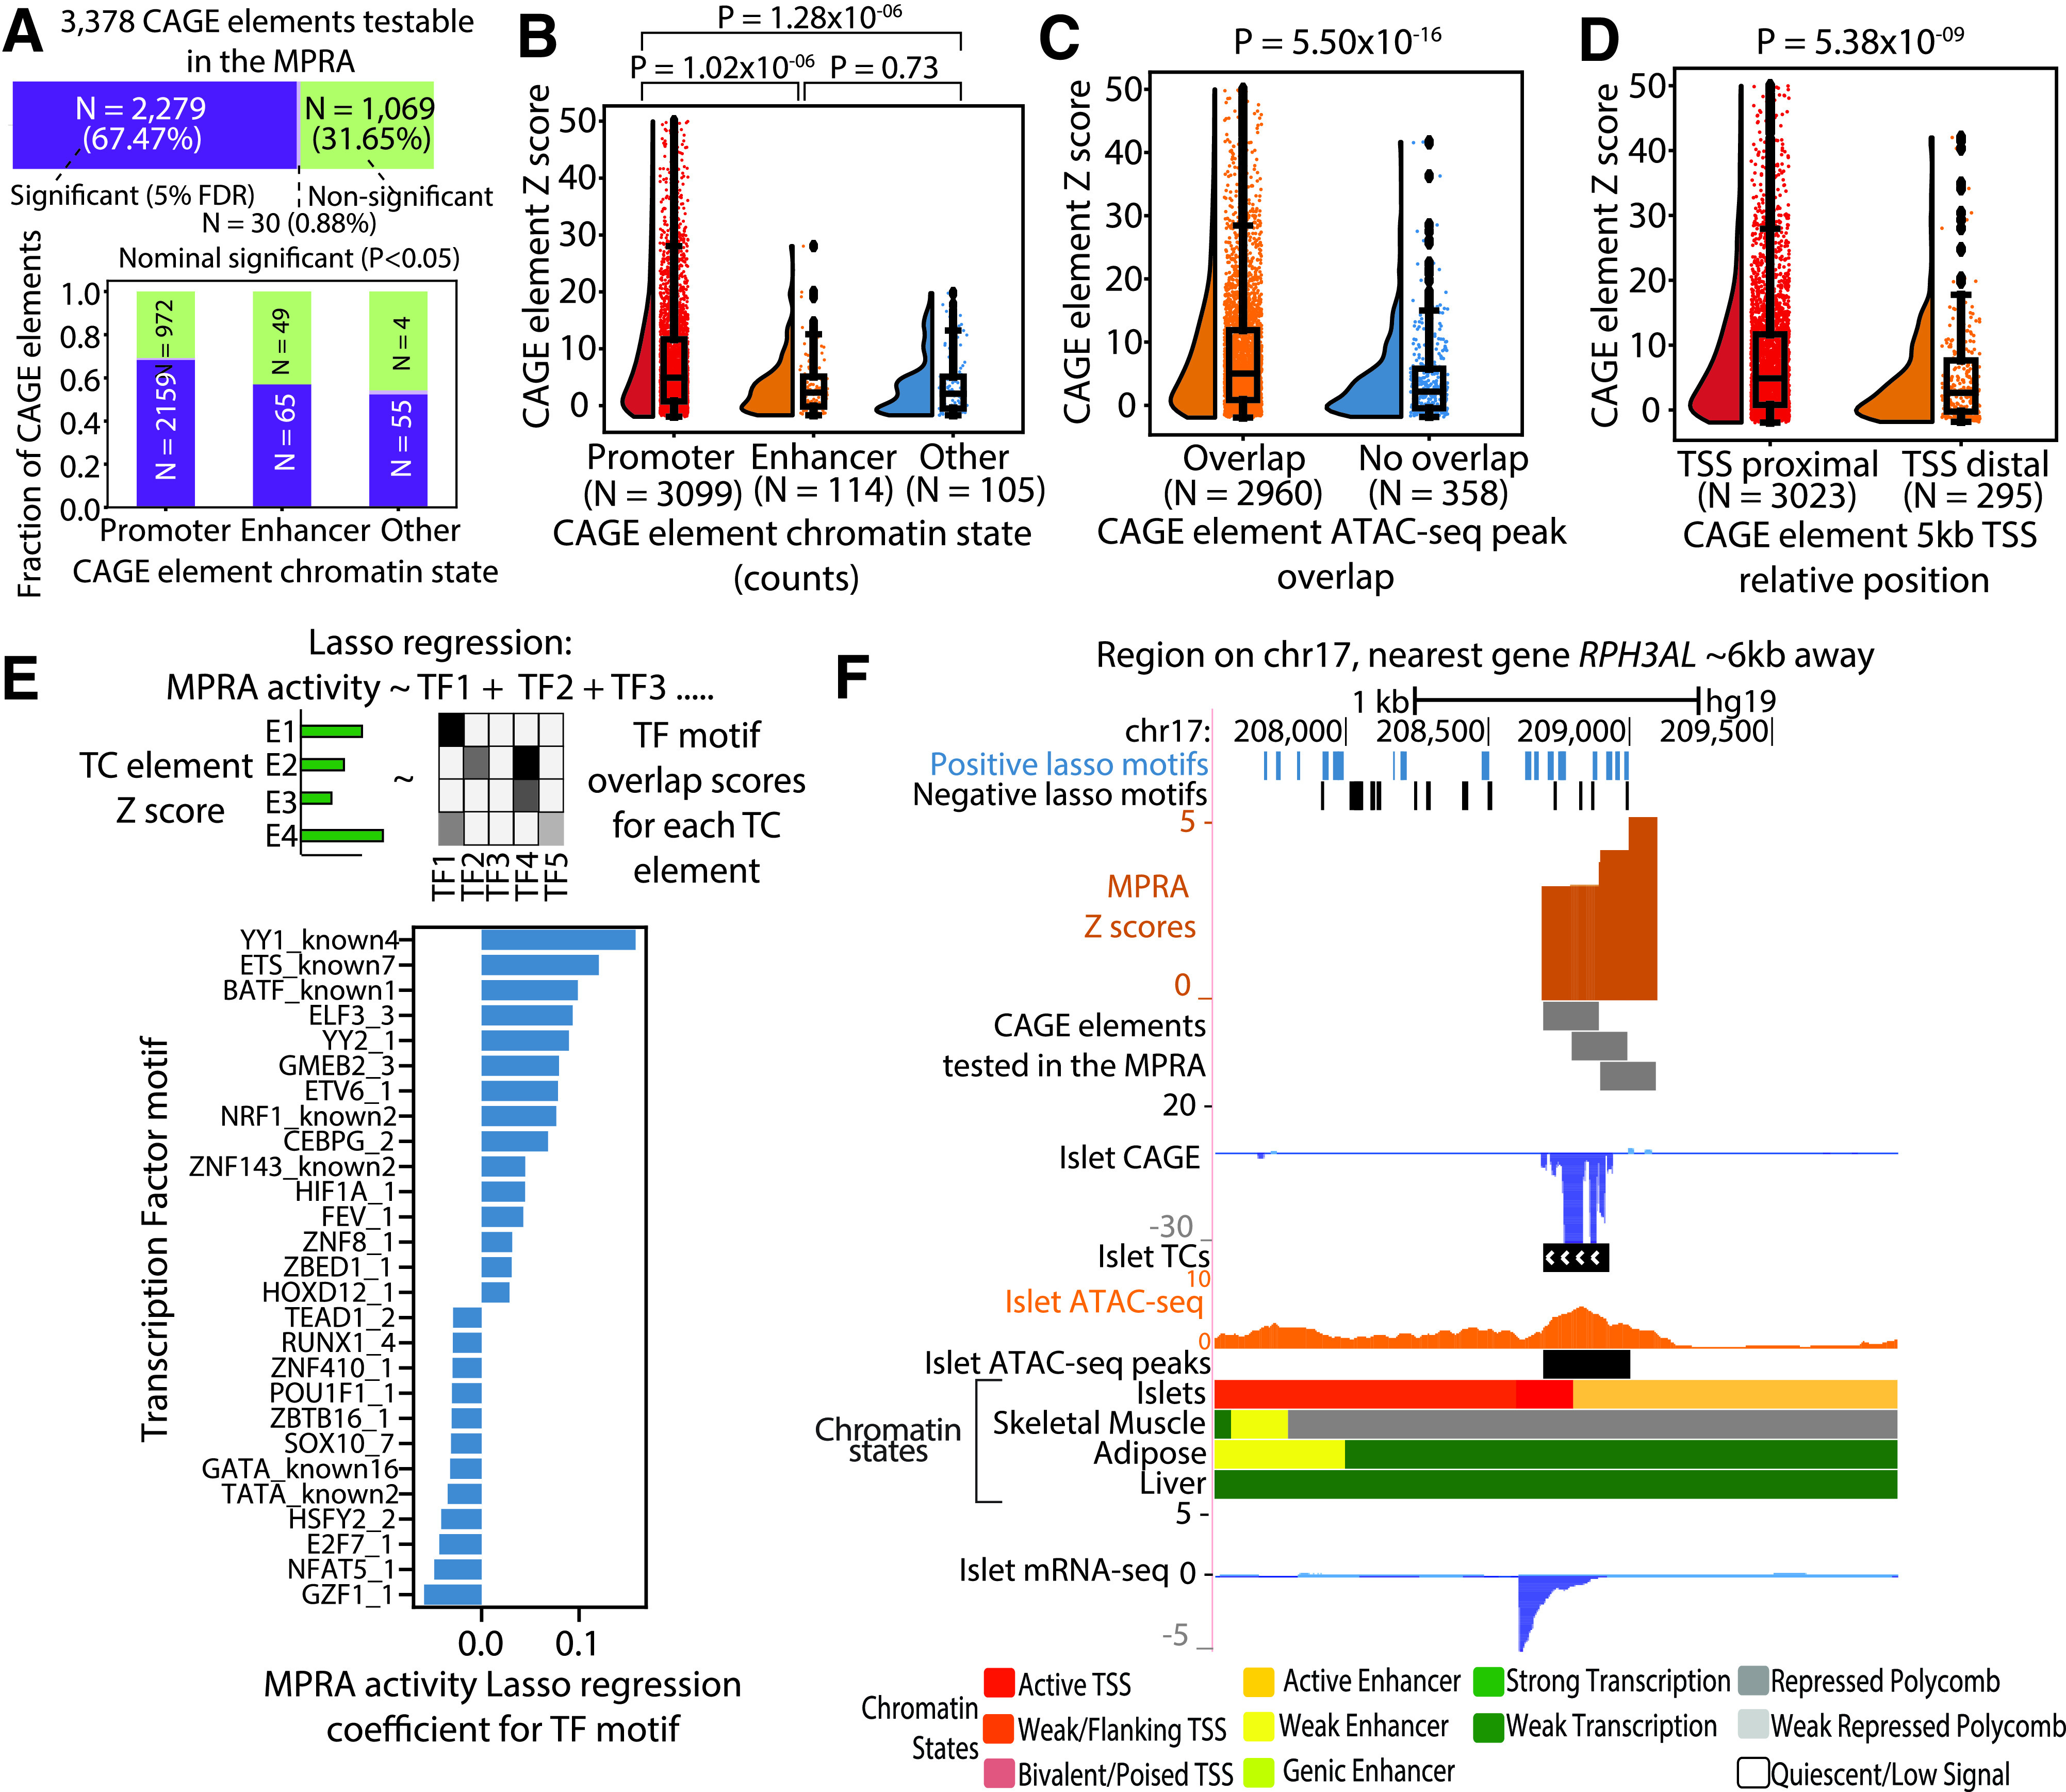
Experimental validation of CAGE elements with MPRA. A: Top, number and fraction of CAGE elements that show significant (5% FDR), nominal (P < 0.05), or nonsignificant transcriptional activity in the MPRA performed in rat β-cell insulinoma (INS1 832/13) cell line model; bottom, proportion of CAGE elements overlapping promoter (active, weak, or flanking TSS), enhancer (active, weak, or genic enhancer), or other chromatin states that showed significant transcriptional activity in the MPRA. B: MPRA activity z scores for CAGE elements overlapping in promoter, enhancer, or other chromatin states. C: MPRA activity z scores for CAGE elements that overlap ATAC-seq peak vs. CAGE elements that do not overlap peaks. D: MPRA activity z scores for CAGE elements based on position relative to known protein-coding gene TSS (5 kb TSS proximal or distal) E: Top, an overview of the LASSO regression model to predict the MPRA activity z scores of CAGE elements as a function of the TF motif scan scores within the element; bottom, top 30 TF motifs with nonzero coefficients from the model. F: An example locus on chr17, where the nearest gene, RPH3AL, lies ∼6 kb away, and an islet TC overlaps active TSS and enhancer chromatin states and an ATAC-seq peak. Elements overlapping this TC showed significant transcriptional activity in the MPRA. The CAGE profile coincides with an islet mRNA profile that is detected despite no known gene annotation in the region and despite the fact that the nearest protein-coding gene is ∼6 kb away. Also shown are occurrences of TF motifs with positive or negative LASSO regression cofficients from the analysis in E. mRNA-seq, mRNA sequencing.
We next aimed to identify the biological-relevant sequence-based features of active CAGE elements by modeling MPRA enhancer activity as a function of TF motif instances using linear regression. Since many TF motifs are correlated, we used the LASSO procedure, which shrinks some regression coefficients to zero, resulting in a simpler model. We modeled CAGE element MPRA z scores on TF motif scores in the element (Fig. 3E and Supplementary Table 9). TF motifs from the ETS family showed positive LASSO coefficients, indicating that these sequence elements are associated with high enhancer activity. These motifs were also enriched to occur in TCs in accessible promoter regions (Fig. 2F). NRF-1 motif showed a positive coefficient; β-cell–specific Nrf1-knockout mice have shown decreased glucose-stimulated insulin secretion (42). TF motifs with negative LASSO coefficients such as ZBTB16 and GZF1 have been shown to act as repressors (43,44). In Fig. 3F, we highlight an islet TC overlapping an islet ATAC-seq peak, active TSS, and enhancer states for which we tested three tiled elements. All three elements showed significant transcriptional activity in our assay (z score >2.94, P values <0.001). Overall, there was a significant positive correlation (Pearson r = 0.64, P = 1 × 10⁻⁹) between TF motif LASSO coefficient and TF footprint motif enrichment in TCs, indicating a strong correspondence between CAGE TC profiling and active enhancer activity measured from the MPRA (Supplementary Fig. 9).
TCs Augment Functional Annotations in GWAS Fine Mapping
We asked whether islet TCs supplement our understanding of T2D GWAS (1) or islet eQTL (31). We classified genomic annotations as 1) chromatin states, 2) accessible regions within the chromatin states, and 3) TCs in accessible regions within the chromatin states. TCs in accessible enhancers were highly enriched for T2D GWAS loci, with use of the Bayesian hierarchical model in fgwas (30) (Fig. 4A, left, and Supplementary Table 10) and logistic regression in GWAS analysis of regulatory or functional information enrichment with LD correction (GARFIELD) (45) (Supplementary Fig. 10). TCs in accessible enhancers were highly enriched to overlap islet eQTL (Fig. 4A, right) but not eQTL in unrelated lymphoblastoid cell lines (32) (Supplementary Fig. 11).
Figure 4.
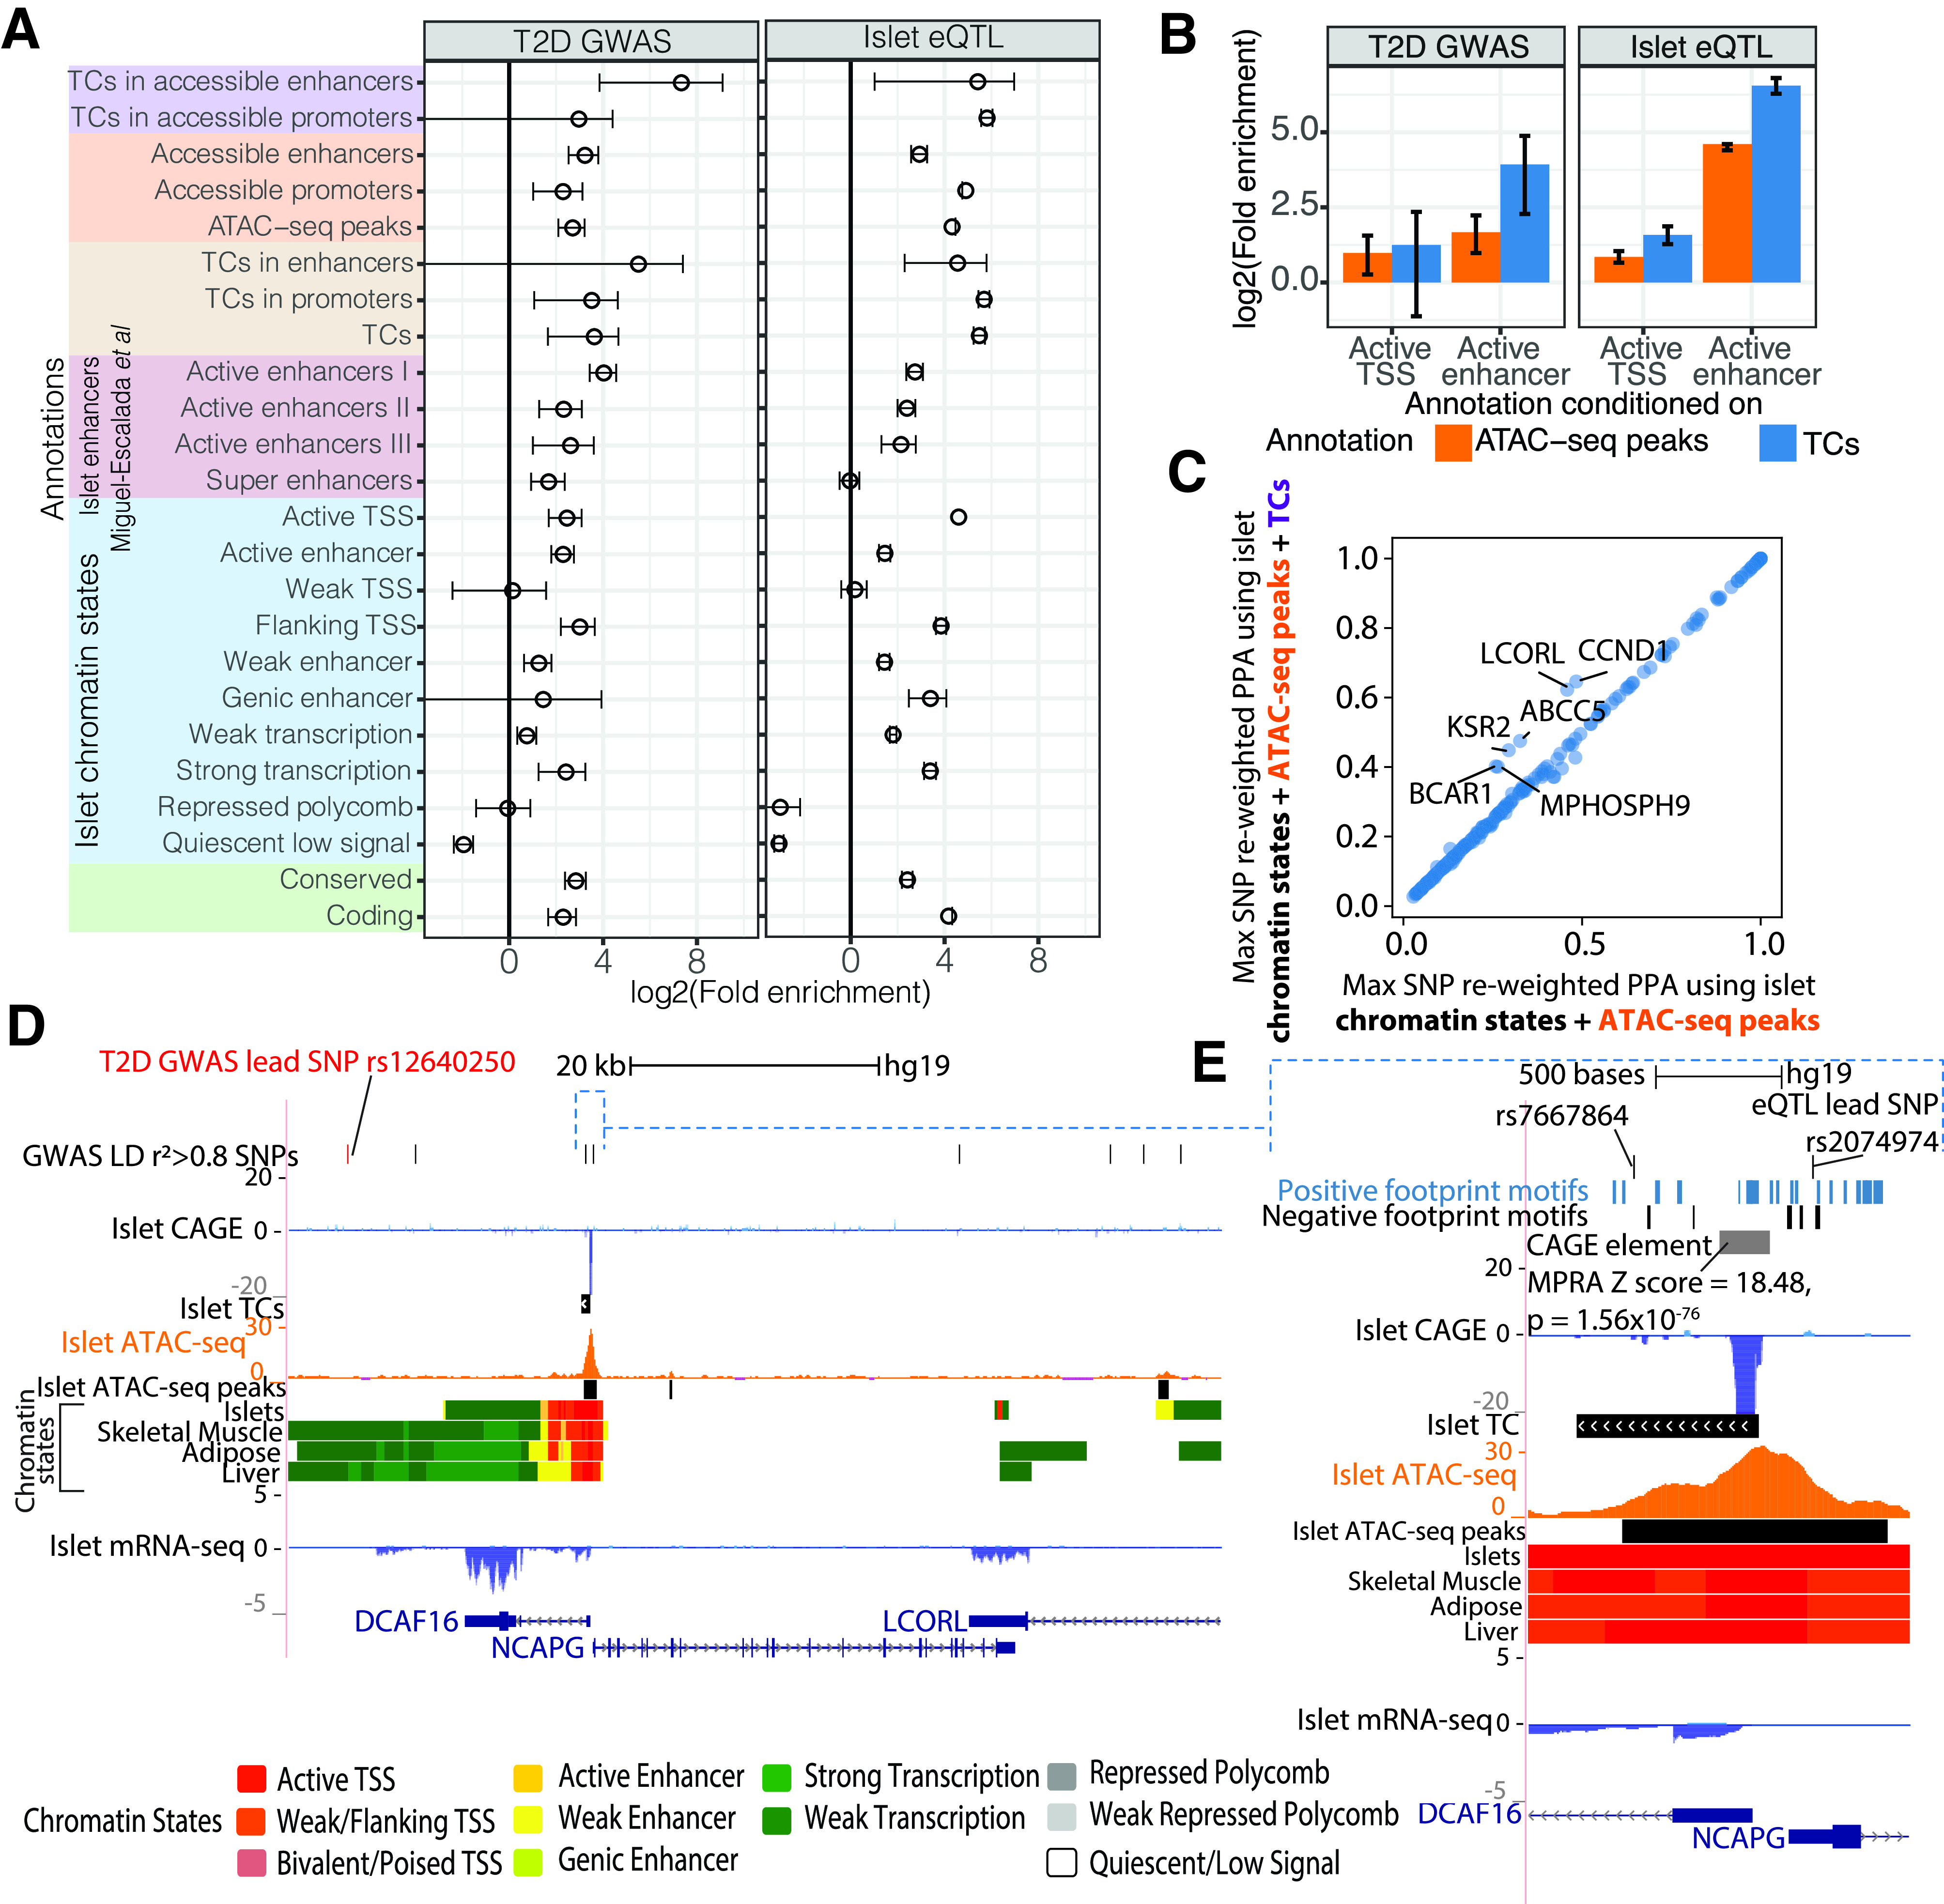
Islet TCs supplement functional understanding of GWAS and eQTL associations and help nominate causal variants. A: Enrichment of T2D GWAS (left) or islet eQTL (right) loci in annotations that comprise different levels of epigenomic information, including chromatin state, ATAC-seq, and TCs. Annotations that we defined using combinations of these data sets are depicted with different colors on the y-axis. Enrichment was calculated with fgwas (30) using summary statistics from GWAS (left) (1) or islet eQTL (right) (10). Error bars denote the 95% CI. Enhancers = active/weak/genic enhancer chromatin states, and promoters = active/weak/flanking TSS chromatin states. Other islet annotations were obtained from 14. B: fgwas conditional enrichment analysis testing the contribution of islet TC or ATAC-seq peak annotations after conditioning on histone-only based annotations such as active TSS and active enhancer chromatin states in islets. C: Maximum (Max) SNP PPA per T2D (BMI-unadjusted) GWAS locus after functional reweighting using a model with islet chromatin states and ATAC-seq peak annotations (x-axis) or chromatin states, ATAC-seq peaks, and TC annotations (y-axis). D: The LCORL T2D GWAS locus showing SNPs in the 99% credible set from genetic fine mapping. This locus comprises genes DCAF16, NCAPG, and LCORL. The lead GWAS SNP is labeled in red, along with LD r2 > 0.8 proxy SNPs in the top track. Also shown are CAGE, TC, ATAC-seq, and chromatin state tracks. E: Browser shot of the DCAF16 and NCAPG promoter regions where rs7667864 and eQTL lead SNP rs2074974 overlap an ATAC-seq peak. An overlapping CAGE element showed significant activity in the MPRA. Also shown are TF motifs with positive or negative coefficients from the MPRA LASSO regression analysis.
TCs showed higher conditional enrichment over enhancer states to broad and length-matched ATAC-seq peaks (Fig. 4B and Supplementary Fig. 12) for T2D GWAS and higher conditional enrichment over enhancer and promoter states versus broad and length-matched ATAC-seq peaks for islet eQTL (Fig. 4B and Supplementary Fig. 12). Functional reweighting of T2D GWAS (1) with islet chromatin states, ATAC-seq peaks, and TCs in fgwas resulted in higher maximal SNP posterior probability of association (PPA) at many loci compared with maximal SNP PPAs from genetic fine mapping alone (Supplementary Fig. 13), consistent with other studies (1,30). Including TCs along with chromatin states and ATAC-seq achieved higher maximal reweighted SNP PPAs than chromatin state and ATAC-seq data, suggesting that TCs add valuable information in fine mapping (Fig. 4C and Supplementary Table 11). We highlight one such GWAS locus named LCORL (lead SNP rs12640250, P value = 3.7 × 10⁻⁸). The 99% genetic credible set at this locus includes 74 variants (1), with lead SNP rs12640250 PPA = 0.15 (Supplementary Fig. 14A). Functional reweighting using islet TCs, chromatin states, and ATAC-seq peaks resulted in 44 SNPs in the 99% credible set, where rs7667864 (genetic PPA = 0.12, LD r2 0.97 with the lead GWAS SNP) obtained the maximum reweighted PPA = 0.62 (Supplementary Fig. 14B). This SNP overlaps an ATAC-seq peak and a TC in islets (Fig. 4D and E). The eQTL lead SNP rs2074974 (genetic PPA = 0.026, LD r2 = 0.96 with lead GWAS SNP) occurs upstream of the TC and overlaps the ATAC-seq peak and obtained a reweighted PPA = 0.096 (Fig. 4E). An element overlapping this TC showed significant activity in our MPRA (z score = 18.48, P value = 1.56 × 10−76), and several TF motifs that showed positive MPRA LASSO regression coefficients also occur in this region (Fig. 4E). These analyses demonstrate that transcription initiation sites demarcate active regulatory elements in islets, and this information can be useful in fine mapping and prioritizing GWAS variants.
Discussion
Our work shows that islet CAGE TCs mark active, specific, and relevant islet regulatory elements. A large proportion of TCs overlapped the active TSS chromatin state. Using an MPRA, we validated the enhancer activity of 2,279 CAGE elements. Our results show that sequences associated with native promoter chromatin landscapes can show strong enhancer activity when cloned downstream of a reporter gene in an episomal MPRA paradigm.
Several ETS family footprint motifs were highly enriched in transcribed and accessible promoter regions, and these motifs were also strong predictors of the elements’ activity in the MPRA. ETS family TFs are found in all metazoans and contain the conserved ETS DNA-binding domain and can recruit acetyl transferases or deacetylases to modulate transcription (46). The regulatory potential of ETS motifs has been described before in MPRAs (47). A previous islet eQTL study demonstrated that for eQTL SNPs (eSNPs) occurring in ETS footprint motifs, the preferred bases in the motifs were significantly more often associated with increased expression of the target gene (31). RFX footprint motifs were highly enriched to overlap transcribed and accessible enhancer regions. RFX TFs contain the X-box DNA-binding motif and are involved in cellular specialization and terminal differentiation (48). T2D GWAS risk alleles were previously shown to confluently disrupt RFX footprint motifs (10). The concordance of our findings with these orthogonal studies highlights the robustness of our islet TC map.
A small fraction of TCs (0.4%) overlapped with the enhancer chromatin states. Since gene-distal transcripts are more unstable, some enhancers may be actively transcribed but fall below the limits of detection of CAGE. It is plausible that CAGE profiling using total RNA from whole islet preps, as we have performed, would comprise more stable promoter-associated RNA transcripts and have a lesser representation of weaker transcripts originating from enhancer regions. Recent technologies such as native elongating transcript-cap analysis of gene expression (NET-CAGE) show promise in more efficiently identifying more unstable transcripts from fixed tissues (49). We note that CAGE-based enhancer calls represent only the most transcriptionally active subset of enhancers in the genome. The Roadmap Epigenomics Consortium used DNase I hypersensitivity sequencing and histone modification chromatin immunoprecipitation sequencing to identify 2,328,936 enhancers across 127 cell types (37), whereas the FANTOM5 Consortium in their extensive catalog of CAGE enhancers identified 43,011 enhancers across 808 CAGE libraries (432 primary cell, 135 tissue, and 241 cell lines) (15). CAGE profiling therefore has several advantages and limitations when compared with other epigenomic modalities. While CAGE identifies transcription initiation at bp resolution, the technique can be limited to a subset of most active elements. Alternatively, integrating three-dimensional chromatin interaction data with other epigenomic profiles can identify active regulatory elements; however, the resolution is generally limited.
Previously, we showed that genetic variants in more cell type–specific enhancer regions have lower effects on gene expression than the variants occurring in more ubiquitous promoter regions (31,50). This finding is consistent with our observation that enhancer chromatin states comprised a smaller proportion of active transcription initiation sites and lower enhancer activities relative to promoter chromatin state regions. The basal transcription initiation landscape could change under stimulatory conditions where relevant enhancers help orchestrate a response.
Our work demonstrates that islet CAGE elements can help GWAS fine mapping in addition to other relevant epigenomic information such as chromatin states and chromatin accessibility. Identifying target genes remains a challenging task where overlaying dense eQTL maps and correlating transcription initiation in enhancers with gene TSS while also leveraging chromatin conformation data would be useful in future studies.
Article Information
Acknowledgments. The authors thank Sally A. Camper, Mats Ljungman, Cristen J. Willer, and Parker laboratory members (University of Michigan) for their feedback.
Funding. The authors acknowledge support from the University of Michigan Rackham Predoctoral Fellowship (to A.V.); National Human Genome Research Institute, NIH, grant T32 HG00040 (to P.O.); American Diabetes Association (ADA) grant 1-18-ACE-15 (to M.L.S.); NIH intramural support from project ZIA-HG000024 (to F.S.C.); ADA Pathway to Stop Diabetes grant 1-14-INI-07; and National Institute of Diabetes and Digestive and Kidney Diseases, NIH, grants 1UM1DK126185-01 and R01 DK117960 (to S.C.J.P.).
Duality of Interest. No potential conflicts of interest relevant to this article were reported.
Author Contributions. A.V. designed and performed analyses and wrote and edited the manuscript. Y.K. performed the MPRA experiments. C.W. performed the LASSO regression. M.R.E. processed the islet samples. N.N., R.D.A., P.O., and J.O.K. contributed to analyses. Y.K., V.R.E., C.W., R.D.A., and P.O. wrote sections of the manuscript. M.L.S., F.S.C., J.O.K., and S.C.J.P. contributed to designing the study. R.D.A., P.O., F.S.C., and S.C.J.P. edited the manuscript. S.C.J.P. supervised all aspects of the study. S.C.J.P. is the guarantor of this work and, as such, had full access to all the data in the study and takes responsibility for the integrity of the data and the accuracy of the data analysis.
Footnotes
This article contains supplementary material online at https://doi.org/10.2337/figshare.14394707.
References
- 1. Mahajan A, Taliun D, Thurner M, et al. Fine-mapping type 2 diabetes loci to single-variant resolution using high-density imputation and islet-specific epigenome maps. Nat Genet 2018;50:1505–1513 [DOI] [PMC free article] [PubMed] [Google Scholar]
- 2. Parker SCJ, Stitzel ML, Taylor DL, et al.; NISC Comparative Sequencing Program; National Institutes of Health Intramural Sequencing Center Comparative Sequencing Program Authors; NISC Comparative Sequencing Program Authors . Chromatin stretch enhancer states drive cell-specific gene regulation and harbor human disease risk variants. Proc Natl Acad Sci U S A 2013;110:17921–17926 [DOI] [PMC free article] [PubMed] [Google Scholar]
- 3. Quang DX, Erdos MR, Parker SCJ, Collins FS. Motif signatures in stretch enhancers are enriched for disease-associated genetic variants. Epigenetics Chromatin 2015;8:23. [DOI] [PMC free article] [PubMed] [Google Scholar]
- 4. Thurner M, van de Bunt M, Torres JM, et al. Integration of human pancreatic islet genomic data refines regulatory mechanisms at type 2 diabetes susceptibility loci. eLife 2018;7:e31977. [DOI] [PMC free article] [PubMed] [Google Scholar]
- 5. Creyghton MP, Cheng AW, Welstead GG, et al. Histone H3K27ac separates active from poised enhancers and predicts developmental state. Proc Natl Acad Sci U S A 2010;107:21931–21936 [DOI] [PMC free article] [PubMed] [Google Scholar]
- 6. Zhou VW, Goren A, Bernstein BE. Charting histone modifications and the functional organization of mammalian genomes. Nat Rev Genet 2011;12:7–18 [DOI] [PubMed] [Google Scholar]
- 7. Mikkelsen TS, Ku M, Jaffe DB, et al. Genome-wide maps of chromatin state in pluripotent and lineage-committed cells. Nature 2007;448:553–560 [DOI] [PMC free article] [PubMed] [Google Scholar]
- 8. Fadista J, Vikman P, Laakso EO, et al. Global genomic and transcriptomic analysis of human pancreatic islets reveals novel genes influencing glucose metabolism. Proc Natl Acad Sci U S A 2014;111:13924–13929 [DOI] [PMC free article] [PubMed] [Google Scholar]
- 9. van de Bunt M, Manning Fox JE, Dai X, et al. Transcript expression data from human islets links regulatory signals from genome-wide association studies for type 2 diabetes and glycemic traits to their downstream effectors. PLoS Genet 2015;11:e1005694. [DOI] [PMC free article] [PubMed] [Google Scholar]
- 10. Varshney A, Scott LJ, Welch RP, et al.; NISC Comparative Sequencing Program . Genetic regulatory signatures underlying islet gene expression and type 2 diabetes. Proc Natl Acad Sci U S A 2017;114:2301–2306 [DOI] [PMC free article] [PubMed] [Google Scholar]
- 11. Roman TS, Cannon ME, Vadlamudi S, et al.; National Institutes of Health Intramural Sequencing Center (NISC) Comparative Sequencing Program . A type 2 diabetes–associated functional regulatory variant in a pancreatic islet enhancer at the ADCY5 locus. Diabetes 2017;66:2521–2530 [DOI] [PMC free article] [PubMed] [Google Scholar]
- 12. Rai V, Quang DX, Erdos MR, et al. Single-cell ATAC-Seq in human pancreatic islets and deep learning upscaling of rare cells reveals cell-specific type 2 diabetes regulatory signatures. Mol Metab 2020;32:109–121 [DOI] [PMC free article] [PubMed] [Google Scholar]
- 13. Greenwald WW, Li H, Benaglio P, et al. Subtle changes in chromatin loop contact propensity are associated with differential gene regulation and expression. Nat Commun 2019;10:1054. [DOI] [PMC free article] [PubMed] [Google Scholar]
- 14. Miguel-Escalada I, Bonàs-Guarch S, Cebola I, et al. Human pancreatic islet three-dimensional chromatin architecture provides insights into the genetics of type 2 diabetes. Nat Genet 2019;51:1137–1148 [DOI] [PMC free article] [PubMed] [Google Scholar]
- 15. Andersson R, Gebhard C, Miguel-Escalada I, et al. An atlas of active enhancers across human cell types and tissues. Nature 2014;507:455–461 [DOI] [PMC free article] [PubMed] [Google Scholar]
- 16. Mikhaylichenko O, Bondarenko V, Harnett D, et al. The degree of enhancer or promoter activity is reflected by the levels and directionality of eRNA transcription. Genes Dev 2018;32:42–57 [DOI] [PMC free article] [PubMed] [Google Scholar]
- 17. Kim T-K, Hemberg M, Gray JM, et al. Widespread transcription at neuronal activity-regulated enhancers. Nature 2010;465:182–187 [DOI] [PMC free article] [PubMed] [Google Scholar]
- 18. Melgar MF, Collins FS, Sethupathy P. Discovery of active enhancers through bidirectional expression of short transcripts. Genome Biol 2011;12:R113. [DOI] [PMC free article] [PubMed] [Google Scholar]
- 19. Core LJ, Waterfall JJ, Lis JT. Nascent RNA sequencing reveals widespread pausing and divergent initiation at human promoters. Science 2008;322:1845–1848 [DOI] [PMC free article] [PubMed] [Google Scholar]
- 20. Core LJ, Martins AL, Danko CG, Waters CT, Siepel A, Lis JT. Analysis of nascent RNA identifies a unified architecture of initiation regions at mammalian promoters and enhancers. Nat Genet 2014;46:1311–1320 [DOI] [PMC free article] [PubMed] [Google Scholar]
- 21. Lopes R, Agami R, Korkmaz G. GRO-seq, a tool for identification of transcripts regulating gene expression. Methods Mol Biol 2017;1543:45–55 [DOI] [PubMed] [Google Scholar]
- 22. Forrest AR, Kawaji H, Rehli M, et al.; FANTOM Consortium and the RIKEN PMI and CLST (DGT) . A promoter-level mammalian expression atlas. Nature 2014;507:462–470 [DOI] [PMC free article] [PubMed] [Google Scholar]
- 23. Murata M, Nishiyori-Sueki H, Kojima-Ishiyama M, Carninci P, Hayashizaki Y, Itoh M. Detecting expressed genes using CAGE. Methods Mol Biol 2014;1164:67–85 [DOI] [PubMed] [Google Scholar]
- 24. Hartley SW, Mullikin JC. QoRTs: a comprehensive toolset for quality control and data processing of RNA-Seq experiments. BMC Bioinformatics 2015;16:224. [DOI] [PMC free article] [PubMed] [Google Scholar]
- 25. Frith MC, Valen E, Krogh A, Hayashizaki Y, Carninci P, Sandelin A. A code for transcription initiation in mammalian genomes. Genome Res 2008;18:1–12 [DOI] [PMC free article] [PubMed] [Google Scholar]
- 26. Heger A, Webber C, Goodson M, Ponting CP, Lunter G. GAT: a simulation framework for testing the association of genomic intervals. Bioinformatics 2013;29:2046–2048 [DOI] [PMC free article] [PubMed] [Google Scholar]
- 27. Zorita E, Cuscó P, Filion GJ. Starcode: sequence clustering based on all-pairs search. Bioinformatics 2015;31:1913–1919 [DOI] [PMC free article] [PubMed] [Google Scholar]
- 28. Ashuach T, Fischer DS, Kreimer A, Ahituv N, Theis FJ, Yosef N. MPRAnalyze: statistical framework for massively parallel reporter assays. Genome Biol 2019;20:183. [DOI] [PMC free article] [PubMed] [Google Scholar]
- 29. Grant CE, Bailey TL, Noble WS. FIMO: scanning for occurrences of a given motif. Bioinformatics 2011;27:1017–1018 [DOI] [PMC free article] [PubMed] [Google Scholar]
- 30. Pickrell JK. Joint analysis of functional genomic data and genome-wide association studies of 18 human traits. Am J Hum Genet 2014;94:559–573 [DOI] [PMC free article] [PubMed] [Google Scholar]
- 31. Viñuela A, Varshney A, van de Bunt M, et al. Genetic variant effects on gene expression in human pancreatic islets and their implications for T2D. Nat Commun 2020;11:4912. [DOI] [PMC free article] [PubMed] [Google Scholar]
- 32. Battle A, Brown CD, Engelhardt BE; GTEx Consortium; Laboratory, Data Analysis &Coordinating Center (LDACC)—Analysis Working Group; Statistical Methods groups—Analysis Working Group; Enhancing GTEx (eGTEx) groups; NIH Common Fund; NIH/NCI; NIH/NHGRI; NIH/NIMH; NIH/NIDA; Biospecimen Collection Source Site—NDRI; Biospecimen Collection Source Site—RPCI; Biospecimen Core Resource—VARI; Brain Bank Repository—University of Miami Brain Endowment Bank; Leidos Biomedical—Project Management; ELSI Study; Genome Browser Data Integration &Visualization—EBI; Genome Browser Data Integration &Visualization—UCSC Genomics Institute, University of California Santa Cruz; Lead analysts; Laboratory, Data Analysis &Coordinating Center (LDACC); NIH program management; Biospecimen collection; Pathology; eQTL manuscript working group . Genetic effects on gene expression across human tissues. Nature 2017;550:204–21329022597 [Google Scholar]
- 33. Harrow J, Frankish A, Gonzalez JM, et al. GENCODE: the reference human genome annotation for The ENCODE Project. Genome Res 2012;22:1760–1774 [DOI] [PMC free article] [PubMed] [Google Scholar]
- 34. Ernst J, Kellis M. Discovery and characterization of chromatin states for systematic annotation of the human genome. Nat Biotechnol 2010;28:817–825 [DOI] [PMC free article] [PubMed] [Google Scholar]
- 35. Visel A, Minovitsky S, Dubchak I, Pennacchio LA. VISTA Enhancer Browser--a database of tissue-specific human enhancers. Nucleic Acids Res 2007;35(Suppl. 1):D88–D92 [DOI] [PMC free article] [PubMed] [Google Scholar]
- 36. Buenrostro JD, Giresi PG, Zaba LC, Chang HY, Greenleaf WJ. Transposition of native chromatin for fast and sensitive epigenomic profiling of open chromatin, DNA-binding proteins and nucleosome position. Nat Methods 2013;10:1213–1218 [DOI] [PMC free article] [PubMed] [Google Scholar]
- 37. Kundaje A, Meuleman W, Ernst J, et al.; Roadmap Epigenomics Consortium . Integrative analysis of 111 reference human epigenomes. Nature 2015;518:317–330 [DOI] [PMC free article] [PubMed] [Google Scholar]
- 38. Melnikov A, Murugan A, Zhang X, et al. Systematic dissection and optimization of inducible enhancers in human cells using a massively parallel reporter assay. Nat Biotechnol 2012;30:271–277 [DOI] [PMC free article] [PubMed] [Google Scholar]
- 39. Arnold CD, Gerlach D, Stelzer C, Boryń ŁM, Rath M, Stark A. Genome-wide quantitative enhancer activity maps identified by STARR-seq. Science 2013;339:1074–1077 [DOI] [PubMed] [Google Scholar]
- 40. Neumayr C, Pagani M, Stark A, Arnold CD. STARR-seq and UMI-STARR-seq: assessing enhancer activities for genome-wide-, high-, and low-complexity candidate libraries. Curr Protoc Mol Biol 2019;128:e105. [DOI] [PMC free article] [PubMed] [Google Scholar]
- 41. Wang X, He L, Goggin SM, et al. High-resolution genome-wide functional dissection of transcriptional regulatory regions and nucleotides in human. Nat Commun 2018;9:5380. [DOI] [PMC free article] [PubMed] [Google Scholar]
- 42. Zheng H, Fu J, Xue P, et al. CNC-bZIP protein Nrf1-dependent regulation of glucose-stimulated insulin secretion. Antioxid Redox Signal 2015;22:819–831 [DOI] [PMC free article] [PubMed] [Google Scholar]
- 43. Xiao G-Q, Li F, Unger PD, et al. ZBTB16: a novel sensitive and specific biomarker for yolk sac tumor. Mod Pathol 2016;29:591–598 [DOI] [PubMed] [Google Scholar]
- 44. Morinaga T, Enomoto A, Shimono Y, et al. GDNF-inducible zinc finger protein 1 is a sequence-specific transcriptional repressor that binds to the HOXA10 gene regulatory region. Nucleic Acids Res 2005;33:4191–4201 [DOI] [PMC free article] [PubMed] [Google Scholar]
- 45. Iotchkova V, Ritchie GRS, Geihs M, et al.; UK10K Consortium . GARFIELD classifies disease-relevant genomic features through integration of functional annotations with association signals. Nat Genet 2019;51:343–353 [DOI] [PMC free article] [PubMed] [Google Scholar]
- 46. Sharrocks AD. The ETS-domain transcription factor family. Nat Rev Mol Cell Biol 2001;2:827–837 [DOI] [PubMed] [Google Scholar]
- 47. Ernst J, Melnikov A, Zhang X, et al. Genome-scale high-resolution mapping of activating and repressive nucleotides in regulatory regions. Nat Biotechnol 2016;34:1180–1190 [DOI] [PMC free article] [PubMed] [Google Scholar]
- 48. Sugiaman-Trapman D, Vitezic M, Jouhilahti E-M, et al. Characterization of the human RFX transcription factor family by regulatory and target gene analysis. BMC Genomics 2018;19:181. [DOI] [PMC free article] [PubMed] [Google Scholar]
- 49. Hirabayashi S, Bhagat S, Matsuki Y, et al. NET-CAGE characterizes the dynamics and topology of human transcribed cis-regulatory elements. Nat Genet 2019;51:1369–1379 [DOI] [PubMed] [Google Scholar]
- 50. Varshney A, VanRenterghem H, Orchard P, et al. Cell specificity of human regulatory annotations and their genetic effects on gene expression. Genetics 2019;211:549–562 [DOI] [PMC free article] [PubMed] [Google Scholar]
- 51. Matys V, Kel-Margoulis OV, Fricke E, et al. TRANSFAC and its module TRANSCompel: transcriptional gene regulation in eukaryotes. Nucleic Acids Res 2006;34:D108–D110 [DOI] [PMC free article] [PubMed] [Google Scholar]