
Figure 4.
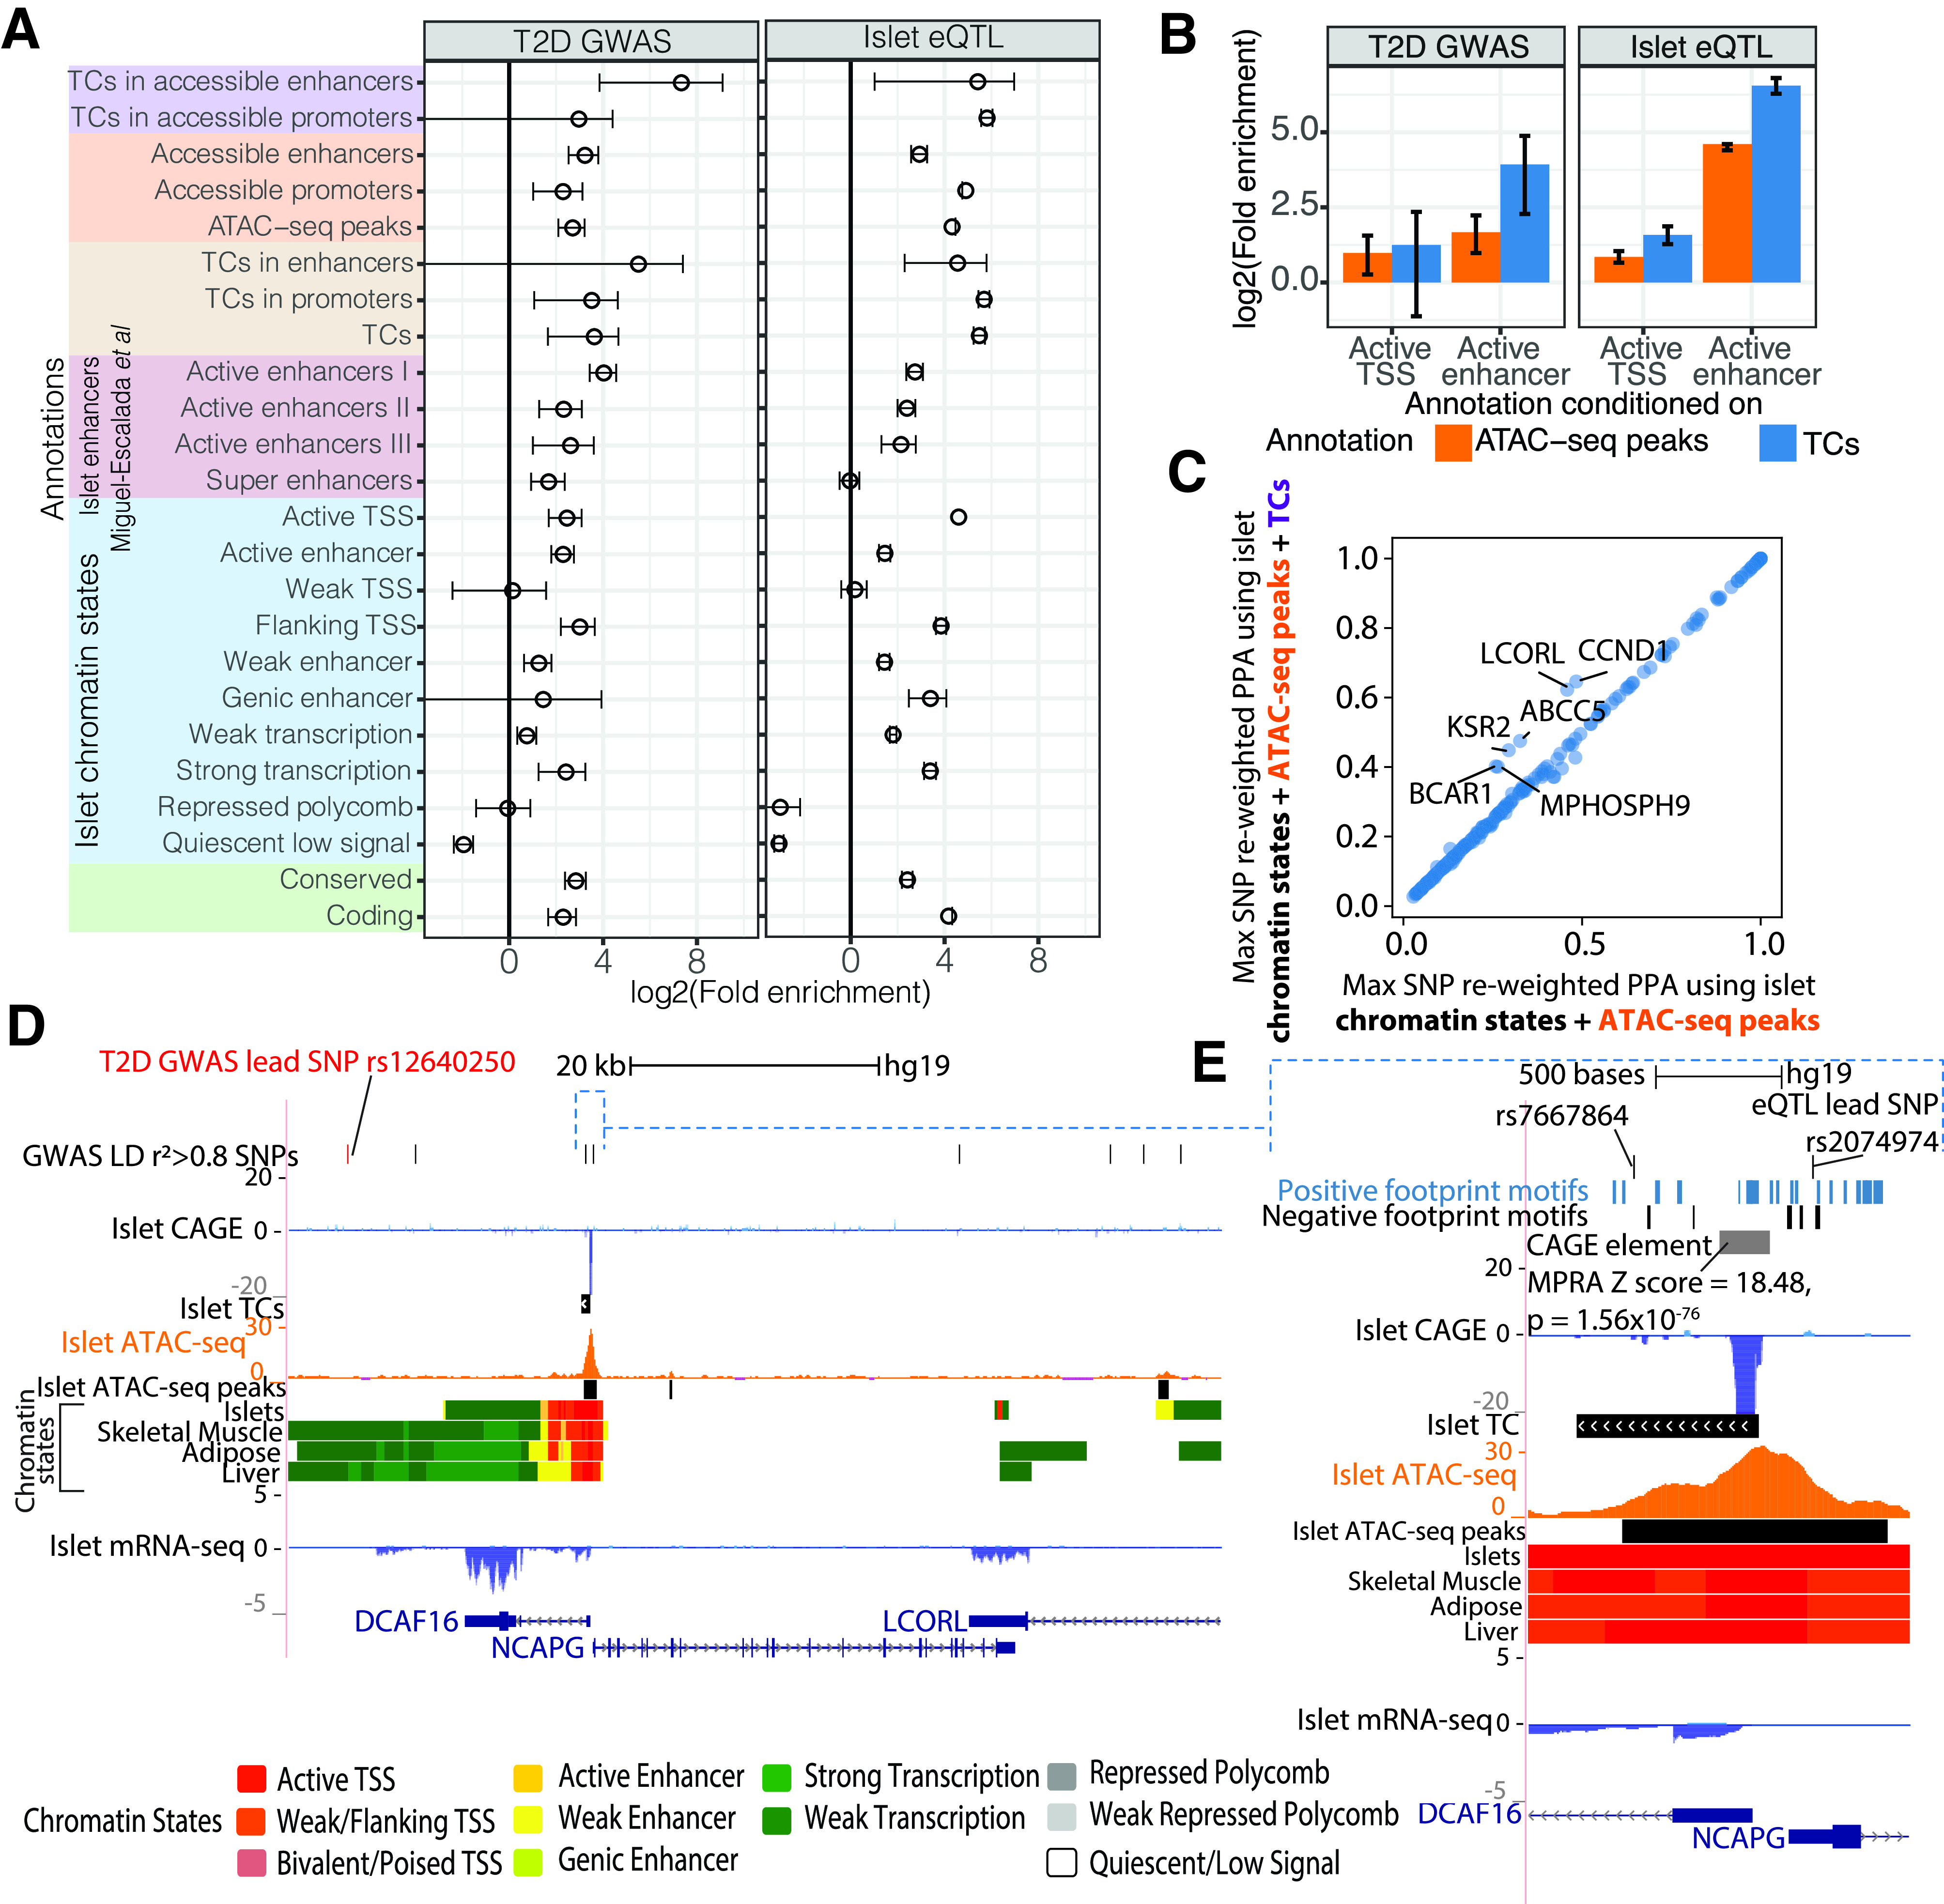
Islet TCs supplement functional understanding of GWAS and eQTL associations and help nominate causal variants. A: Enrichment of T2D GWAS (left) or islet eQTL (right) loci in annotations that comprise different levels of epigenomic information, including chromatin state, ATAC-seq, and TCs. Annotations that we defined using combinations of these data sets are depicted with different colors on the y-axis. Enrichment was calculated with fgwas (30) using summary statistics from GWAS (left) (1) or islet eQTL (right) (10). Error bars denote the 95% CI. Enhancers = active/weak/genic enhancer chromatin states, and promoters = active/weak/flanking TSS chromatin states. Other islet annotations were obtained from 14. B: fgwas conditional enrichment analysis testing the contribution of islet TC or ATAC-seq peak annotations after conditioning on histone-only based annotations such as active TSS and active enhancer chromatin states in islets. C: Maximum (Max) SNP PPA per T2D (BMI-unadjusted) GWAS locus after functional reweighting using a model with islet chromatin states and ATAC-seq peak annotations (x-axis) or chromatin states, ATAC-seq peaks, and TC annotations (y-axis). D: The LCORL T2D GWAS locus showing SNPs in the 99% credible set from genetic fine mapping. This locus comprises genes DCAF16, NCAPG, and LCORL. The lead GWAS SNP is labeled in red, along with LD r2 > 0.8 proxy SNPs in the top track. Also shown are CAGE, TC, ATAC-seq, and chromatin state tracks. E: Browser shot of the DCAF16 and NCAPG promoter regions where rs7667864 and eQTL lead SNP rs2074974 overlap an ATAC-seq peak. An overlapping CAGE element showed significant activity in the MPRA. Also shown are TF motifs with positive or negative coefficients from the MPRA LASSO regression analysis.