

Abstract
BACKGROUND:
Fish oil enriched in omega-11 long-chain monounsaturated fatty acids (LCMUFA; C20:1 and C22:1 isomers combined) have shown lipid-lowering and atheroprotective effects in animal models.
OBJECTIVE:
To perform a first-in-human trial of LCMUFA-rich saury fish oil supplementation to test its safety and possible effect on plasma lipids.
METHODS:
A double-blind, randomized cross-over clinical trial was carried out in 30 healthy normolipidemic adults (BMI <25 kg/m2; mean TG, 84 mg/dL). Treatment periods of 8 weeks were separated by an 8-week washout period. Subjects were randomized to receive either 12 g of saury oil (3.5 g of LCMUFA and 3.4 g of omega-3 FAs) or identical capsules with control oil (a mixture of sardine and olive oil; 4.9 g of shorter-chain MUFA oleate and 3 g of omega-3 FAs).
RESULTS:
Saury oil supplementation was safe and resulted in LDL particle counts 12% lower than control oil (P <0.001). Saury oil also had a minor effect on increasing HDL particle size (9.8 nm vs 9.7 nm; P <0.05) based on a linear mixed effect model. In contrast, control oil, but not saury oil, increased LDL-C by 7.5% compared to baseline (P <0.05). Saury oil had similar effects compared to control oil on lowering plasma TG levels, VLDL and TG-rich lipoprotein particle counts (by ~16%, 25% and 35%, respectively; P <0.05), and increasing HDL-C and cholesterol efflux capacity (by ~6% and 8%, respectively; P <0.05) compared to baseline.
CONCLUSION:
Saury oil supplementation is well tolerated and has beneficial effects on several cardiovascular parameters, such as LDL particle counts, HDL particle size, and plasma TG levels.
Keywords: Saury oil, long-chain monounsaturated fatty acid, omega-3 fatty acids, lipoprotein subfractions, triglycerides, LDL, HDL
Introduction
Numerous animal and human studies have shown that consumption of polyunsaturated fish oils, unlike saturated fatty acids, have favorable effects on plasma lipids, as well as on endothelial function, inflammation, thrombosis and arrhythmia1. Most of these favorable effects have been attributed to omega-3 fatty acids (FAs), namely eicosapentaenoic acid (EPA, C20:5 n-3) and docosahexaenoic acid (DHA, C22:6 n-3). Fish oils, however, also contain varying amounts of other unusual types of FA not commonly found in other food sources. For example, fish oils derived from saury2, pollock3 and herring4 are all enriched in long-chain monounsaturated fatty acids (LCMUFA), with carbon chain length longer than C18 (i.e., C20:1 and C22:1 isomers combined). LCMUFA are primarily derived from the diet, because FAs longer than 18 carbons are inefficiently synthesized by most mammals, including man. Compared to well-studied omega-3-rich fish oils, there is limited knowledge about the relationship between LCMUFA-rich fish oil consumption and cardiovascular disease (CVD) risk. The original epidemiologic studies of Eskimos that first established a link between omega-3 FAs consumption and athero-protection also showed a possible role for LCMUFA in promoting cardiovascular health5,6. More recently, the Physician’s Health Study showed a strong inverse association between red blood cell LCMUFA levels and CVD events, even after adjusting for omega-3 levels7. A limited number of human nutrition studies on the consumption of crude marine oils rich in LCMUFA, such as marine mammal oils8,9, herring10 and pollock oils11, have shown favorable effects on the plasma lipoprotein profile and other CVD risk factors, but whether these beneficial effects are due to LCMUFA or some other component in these crude oils is not known.
In various mouse models, we found that dietary supplementation with a highly purified concentrate of LCMUFA, but not olive oil enriched in shorter-chain MUFA oleate (C18:1 n-9), improved the plasma lipid profile, reduced inflammation and atherosclerosis12,13,14. LCMUFA, a MUFA family member, is not very abundant in most diets compared with oleate, the most commonly consumed naturally occurring MUFA. Olive oil, the major source of dietary oleate, has been shown in several studies to decrease triglycerides (TG) and raise high density lipoprotein cholesterol (HDL-C)15. Whether LCMUFA would have a similar or different effect than oleic acid on lipid metabolism is not known.
Saury fish (Cololabis adocetus) are widespread in the Eastern Pacific and considered to be a pelagic, tropical oceanodromous fish. They are widely consumed in Asian countries, and contain a large amount of LCMUFA, particularly C20:1 n-11 (cis-9-eicosenoic acid) and C22:1 n-11 (cis-11-docosenoic acid), in addition to omega-3 EPA and DHA. Consumption of saury fish was associated with lower post-prandial lipids and glucose16, but no previous human studies have investigated the effect of supplementation of LCMUFA-rich fish oil produced from saury fish on plasma lipoproteins or other cardiovascular risk markers. In the present study, we perform a first-in-human trial to investigate the safety of LCMUFA-rich fish oil prepared from saury fish in healthy normolipidemic subjects. We also compared the effect of LCMUFA-rich fish oil supplementation on plasma lipids and lipoproteins to a control oil enriched in olive oil but containing similar amount of omega-3 FAs.
Materials and Methods
Study design
The study was a randomized, double-blind, cross-over, intervention study (Fig. 1). The baseline assessments consisted of a screening and an enrollment visit. After randomization, eligible subjects received an 8-week supply of control fish oil or saury oil. Subjects were instructed to take 12 capsules (4 capsules, 3 times a day, after meals) per day for 8 weeks and were scheduled to return for a second visit. After an 8-week wash-out period, subjects returned for a third visit for a second 8-week supply of the other dietary supplement. The fourth and final visit occurred 8 weeks after starting the second fish oil supplementation. Compliance was checked by 7-day dietary records and pill counting at baseline and at the end of each intervention arm. Dietary records by each subject were reviewed by nutrition staff for accuracy and analyzed using Nutrition Data Systems for Research software 2016-2018 (NDSR, Minneapolis, MN). Subjects were counseled to maintain their usual lifestyle and diets during the 24-week period of the study.
Figure 1.
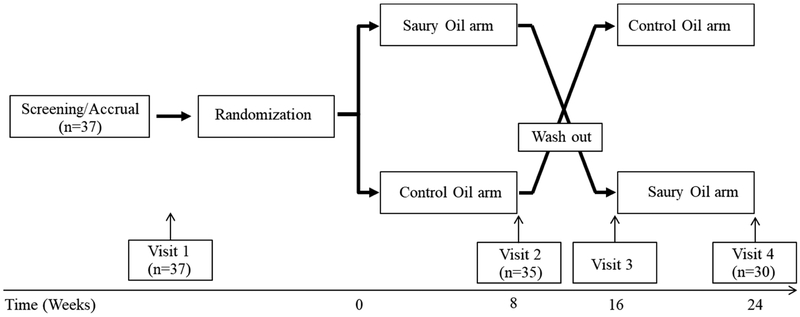
Study design. Participants were screened through an exclusion/inclusion questionnaire, baseline laboratory tests and a pregnancy test for females. Once eligibility was confirmed, subjects were randomized and received an 8-week supply of control fish oil or saury oil for 8 weeks. After an 8 week wash-out period, subjects received a second 8-week supply of the dietary supplement for the second arm of the study.
Intervention
Food-grade purified saury oil and sardine oil were provided by Nippon Suisan Kaisha Ltd. (Tokyo, Japan). Food-grade olive oil was obtained from DSP Gokyo Food & Chemical Co., Ltd. (Osaka, Japan). The control oil was a mixture of sardine oil and olive oil (1:1, vol/vol) matched to the total omega-3 EPA/DHA and MUFA content in saury oil. The FA profile of the control and saury oil were determined by gas chromatography (Japan Food Research Laboratories, Tokyo, Japan) (Table 1). The content of total saturated fatty acids (SFA), MUFA, and polyunsaturated fatty acid (PUFA) are comparable in the control and saury oils, except that the MUFA type is different. Control oil is enriched in shorter-chain MUFA oleate, whereas saury oil is enriched in LCMUFA. In addition, although the total contents of EPA and DHA are comparable in two fish oil supplements (2.5 g in control oil and 2.2 g in saury oil), the ratio of EPA to DHA is different: 2.2 in control oil and 0.5 in the saury oil supplement. The taste and physical appearance of the two types of fish oil supplements were similar. Participants received 12 g, split into three times per day, of control oil (oleate: 4.9 g; omega-3 FAs: 3 g) or saury oil (LCMUFA: 3.5 g; omega-3 FAs: 3.4 g).
Table 1.
Fatty acid content per day from consumption of control or saury oil supplement
| FA (g/day) | Control oil# | Saury oil |
|---|---|---|
| C14:0 | 0.28 | 0.81 |
| C16:0 | 0.95 | 1.34 |
| C16:1 n-7 | 0.55 | 0.32 |
| C18:0 | 0.26 | 0.20 |
| C18:1 n-9 | 4.92 | 0.62 |
| C18:2 n-6 | 0.53 | 0.20 |
| C18:3 n-3 | 0.10 | 0.19 |
| C20:1 n-11 | 0.01 | 1.23 |
| C20:1 n-9 | 0.06 | 0.32 |
| C20:1 n-7 | 0.01 | 0.02 |
| C20:4 n-6 | 0.09 | 0.08 |
| C20:5 n-3 | 1.71 | 0.76 |
| C22:1 n-11 | 0.03 | 1.85 |
| C22:1 n-9 | 0.01 | 0.08 |
| C22:1 n-7 | 0.00 | 0.03 |
| C22:6 n-3 | 0.78 | 1.41 |
| Total SFA | 1.56 | 2.48 |
| Total MUFA | 5.83 | 4.60 |
| Total LCMUFA* | 0.11 | 3.52 |
| Omega-3 EPA+DHA | 2.49 | 2.17 |
| Total omega-3 PUFA | 3.01 | 3.37 |
| Total omega-6 PUFA | 0.63 | 0.29 |
FA: fatty acid; SFA: saturated fatty acids; MUFA: monounsaturated fatty acid; PUFA: polyunsaturated fatty acids; EPA: eicosapentaenoic acid (C20:5 n-3); DHA: docosahexaenoic acid (C22:6 n-3).
Control oil: a mixture of sardine oil and olive oil (1:1; vol/vol)
LCMUFA: a sum of C20:1 and C22:1 isomers
Subjects
Thirty-seven healthy volunteers (mean age 34.8 ± 12.5 years), with a mean BMI of 24.3 ± 3.4, were recruited from June 2017 through March 2018 at the National Institutes of Health (NIH) (Bethesda, MD, USA) (Table 2). Eligible subjects were healthy with no history of chronic disease. Participants that consumed any source of fish oil more than three times per week were excluded. Other inclusion/exclusion criteria are provided in Supplemental Table 1. Out of 37 participants recruited for the study, 30 completed both arms of the study and also completed all clinical and laboratory tests. Study approval was granted by the National Heart, Lung and Blood Institute Institutional Review Board in keeping with the Declaration of Helsinki. All study participants submitted written informed consent prior to enrollment and received financial compensation (ClinicalTrial.gov registration ID: NCT03043365).
Table 2.
Characteristics of recruited subjects
| Parameters | Measures (n=37) |
|---|---|
| Demographics and medical history | |
| Age (years) | 34.8 ± 12.5 |
| Male sex, n (%) | 15 (40.5) |
| Female sex, n (%) | 22 (59.5) |
| Ethnicity, n (%) | |
| White | 19 (51.4) |
| Black | 7 (18.9) |
| Asian | 11 (29.7) |
| Body mass index (kg/m2) | 24.3 ± 3.4 |
| Clinical and laboratory values | |
| Systolic BP (mmHg) | 118.9 ± 12.6 |
| Diastolic BP (mmHg) | 70.6 ± 9 |
| TC (mg/dL) | 176 ± 45.7 |
| TG (mg/dL) | 83.8 ± 49.1 |
| HDL-C (mg/dL) | 62.2 ± 18.4 |
| LDL-C (mg/dL) | 97.2 ± 44.6 |
| ApoA-I (mg/dL) | 155.1 ± 31.1 |
| ApoB (mg/dL) | 88.7 ± 32.4 |
| hsCRP (mg/L) | 2.4 (0.5-3.0) |
| HOMA-IR | 1.9 (1.1- 2.4) |
| Insulin (μU/mL) | 8.3 ± 5.2 |
| Glucose (mg/dL) | 92.6 ± 8.4 |
| HbA1C (%) | 5 ± 0.5 |
| AST (U/L) | 21.5 ± 12.5 |
| ALT (U/L) | 18.4 ± 9.5 |
| TSH (μlU/mL) | 2.1 ± 1.4 |
| Uric Acid (mg/dL) | 5.4 ± 1.3 |
| Creatinine (mg/dL) | 0.9 ± 0.2 |
| RBC (M/uL) | 4.6 ± 0.5 |
| WBC (K/uL) | 5.6 ± 1.5 |
N/A: Not applicable; BP: blood pressure; TC: total cholesterol; TG: triglycerides; HDL-C: HDL cholesterol; LDL-C: LDL cholesterol; hsCRP: high-sensitivity C-reactive protein; HOMA-IR: homeostatic model assessment of insulin resistance; HbA1C: hemoglobin A1c; AST: aspartate aminotransferase; ALT: alanine aminotransferase; TSH: thyroid-stimulating hormone; RBC: red blood cells; WBC: white blood cells. Data represented as mean ± SD (n = 37) or interquartile range (IQR) for parametric and non-parametric variables respectively and as n (%) for categorical variables.
Biochemical measurements
Peripheral blood was collected after overnight fasting in EDTA tubes. Plasma was immediately stored at − 80°C until further analysis without being exposed to any additional freeze-thaw cycles. Traditional lipid parameters included plasma total cholesterol (TC), HDL-C and TG levels that were measured using enzymatic methods (Roche Diagnostics, Indianapolis, IN, USA). Low density lipoprotein cholesterol (LDL-C) was calculated by the Friedewald equation. ApoA-I and apoB were measured by automated turbidometric immunoassays (Roche Diagnostics, Indianapolis, IN, USA). Direct HDL-C, LDL-C, apoE-containing HDL-C (ApoE-HDL), TG-rich LDL (LDL-TG) and small dense LDL (sdLDL) were measured by a homogenous assay (Denka Seiken Co, Ltd, Tokyo, Japan)17. All lipid measurements were conducted on a Cobas 6000 automatic analyzer (Roche Diagnostics, Indianapolis, IN, USA). Plasma oxidized LDL (oxLDL) (U/L) was determined by ELISA (Mercodia, Uppsala, Sweden).
Lipoprotein particle profiles were measured using an automated Vantera clinical NMR analyzer (Labcorp, Burlington, NC, USA). Mean HDL, LDL and very-low-density lipoprotein (VLDL) particle size (HDL-Z, LDL-Z, and VLDL-Z) and lipoprotein particle counts (HDL-P, LDL-P, and VLDL-P) were calculated using the LipoProfile-3 algorithm. Lipoprotein (HDL, LDL and triglyceride-rich lipoproteins (TRL-P)) particle size subclass distributions were calculated, using the LipoProfile-4 algorithm. Total TRL-P includes VLDL and chylomicrons, whereas very small TRL-P is defined as the subclass containing intermediate-density lipoprotein (IDL) particles.
The HDL cholesterol efflux capacity assay was performed in duplicate with J774 cells 18. Briefly, 3 x 10⁵ J774 cells/well were plated and radiolabeled with 2 μCi of 3H-cholesterol/mL. ATP-binding cassette transporter A1 (ABCA1) was up-regulated by a 16-hour pre-incubation with 0.3 mmol/L 8-(4-chlorophenylthio)-cAMP. Cells were washed and 2.8% apoB-depleted plasma was added to the efflux medium for 4 hours. Cholesterol efflux was calculated by using the following formula: (μCi of 3H-cholesterol in media containing 2.8% apoB-depleted subject plasma-μCi of 3H-cholesterol in plasma-free media / μCi of 3H-cholesterol in media containing 2.8% apoB-depleted pooled control plasma-μCi of 3H-cholesterol in pooled control plasma-free media). The pooled plasma was obtained from five healthy adult volunteers. Insulin, glucose, and high sensitivity C-reactive protein (hsCRP) measurements were performed on a Cobas 6000 automatic analyzer (Roche Diagnostics, Indianapolis, IN, USA) in the NIH Clinical Center. The HOMA-IR index was used to estimate the degree of insulin resistance (HOMA-IR = fasting glucose [mg/dl] * fasting insulin [mU/ml]/405).
Vascular function assessment
The heart rate (HR), blood pressure (BP), cardio-ankle vascular index (CAVI) and ankle-brachial index (ABI) were measured with the VaSera VS-1500N vascular screening system (Fukuda Denshi Co. Ltd, Tokyo, Japan)19. These vascular function indices were measured in the morning after 10 minutes of rest with cuffs applied to the bilateral upper and lower extremities with the subject in the supine position. The CAVI score was estimated from the brachial and ankle pulse wave forms, according to the manufacturer’s instructions. Electrocardiography, phonocardiography and BP measurements were performed simultaneously. The stiffness parameter was calculated by the following equation: CAVI = In (Ps/Pd) × 2p/ΔP × PWV2, where Ps is the SBP, Pd is the DBP, p is the blood viscosity, ΔP is Ps-Pd and PWV is the pulse wave velocity from the aortic origin to the ankle via femoral artery. ABI was measured based on the SBP for both the upper (brachial artery) and lower (tibial artery) and was calculated by dividing the ankle SBP by the brachial SBP.
Statistical Methods
Unless otherwise indicated, all data are presented as the mean ± SD for parametric variables or the median (IQR) for non-parametric variables, and as number (%) for categorical variables. Skewness and kurtosis measures were used to assess normality and log transformations to make residuals closer to normal were employed, although they did not affect the significance of any results. P-values were derived from a paired students t-test for parametric variables and the Mann-Whitney U test for non-parametric variables. Comparisons with baseline were performed by Wilcoxon signed-rank test.
Comparisons between saury and control oils with adjustment for period and arm effects was achieved by applying a linear mixed effect model to the differences from each baseline for each biological parameter. The model uses all four measures on each subject and a random subject effect to allow for the multiple measures. No arm or period effects, however, were found in any measured parameters, except for HDL-P and white blood cell concentrations, which showed a relatively minor period effect (P <0.05). Analyses were performed using Stata/IC 12.0 (StataCorp LP, College Station, TX, USA) and R 3.5.2 (R Core Team https://www.R-project.org/). P <0.05 was considered statistically significant.
Power calculation for sample size was based on previously published changes in plasma TG levels (i.e., an approximately 19% decrease) in response to approximately 2.2 g/day of omega-3 fish oil interventions in normolipidemic adults20-25. With a sample size of 30 subjects, and 2-tailed tests, we estimated that with a sample size of 30 that we have enough power (0.80) to detect a ≥ 10% difference in TG levels between baseline and fish oil interventions at the P ≤ 0.05 significance level.
Results
Study population
Baseline characteristics of the study participants are shown in Table 1. The mean age was 34.8 years and 60% of the subjects were females. About half the population was white. The mean BMI of the study population was under 25 kg/m2, with a mean TG of 83.8 mg/dL and a mean LDL-C of 97.2 mg/dL. Hence, the study population was considered to be a healthy young adult population, with a relatively normal lipid profile.
Safety and tolerability
Supplementation with 12 g saury oil split into three times a day (3.5 g of LCMUFA and 3.4 g of omega-3 fatty acids), was well tolerated. Out of 37 subjects recruited, a total of 7 participants did not complete the study for the following reasons: mild GI discomfort (grade I; n = 1, on control oil supplement), mild nausea (grade I; n = 1, on saury oil supplement), exacerbation of pre-existing acne (n = 1, on saury supplement), unrelated medical condition (n = 1, on saury oil supplement), and lost to follow-up or declined further participation (n = 3). There were no apparent differences in routine clinical laboratory test results before and after saury oil intervention, except for a small decrease in WBC (10%; P <0.05), which still remained within the normal range (Table 3). Similarly, the control fish oil was also well tolerated and did not significantly change routine clinical laboratory test results except for a small decrease in plasma creatinine (4.7%; P <0.05). The 7-day dietary records showed that fish oil supplementations did not influence the mean intake of daily energy or individual nutrients, including fat, carbohydrate, protein, alcohol, cholesterol, total fiber, or the individual fatty acid content of the diet, during the study (Supplemental Table 2).
Table 3.
Various biomarkers for CVD before (baseline) and after a 8-week ingestion of control or saury oil supplement
| Baseline (n=30) | Control oil (n=30) | Saury oil (n=30) | ||||
|---|---|---|---|---|---|---|
| Mean | SD/IQR | Mean | SD/IQR | Mean | SD/IQR | |
| Clinical and laboratory values | ||||||
| hsCRP (mg/L) (0 – 4.99) |
2.4 | 0.5-3.0 | 1.4 | 0.4-2.2 | 1.6 | 0.3-2.3 |
| AST (U/L) (0 – 32) |
21.9 | 13.8 | 20.6 | 6.2 | 20.9 | 6.3 |
| ALT (U/L) (0 – 33) |
18.2 | 9.9 | 18 | 6.9 | 19.8 | 12.3 |
| TSH (μlU/mL) (0.27 – 4.20) |
2.1 | 1.4 | 2.2 | 1.3 | 2.1 | 1.1 |
| Uric Acid (mg/dL) (2.4 – 5.8) |
5.5 | 1.2 | 5.3 | 1.3 | 5.5 | 1.4 |
| Creatinine (mg/dL) (0.51 – 0.95) |
0.86 | 0.14 | 0.82 | 0.15 ** | 0.85 | 0.15 # |
| RBC (M/uL) (3.93 – 5.22) |
4.6 | 0.4 | 4.6 | 0.4 | 4.6 | 0.4 |
| WBC (K/uL) (3.98 – 10.04) |
5.7 | 1.5 | 5.4 | 1.8 | 5.1 | 1.3 * |
| Glucose (mg/dL) (74 - 99) |
92 | 7.5 | 94.2 | 9 * | 92.8 | 12.7 |
| HbA1C (%) (4 - 6) |
4.9 | 0.4 | 5 | 0.5 | 5 | 0.4 |
| Insulin (μU/mL) (2.6 – 24.9) |
7.1 | 3.3 | 8.6 | 3.5 ** | 9.6 | 4.7 *** |
| HOMA IR | 2 | 1.09- 2.40 | 2.4 | 1.11- 2.95 | 1.8 | 1.08-2.44 |
| Vascular parameters | ||||||
| L-ABI | 1.03 | 0.09 | 1 | 0.09 * | 1.03 | 0.09 # |
| R-ABI | 1.05 | 0.07 | 1.02 | 0.07 * | 1.04 | 0.08 |
| L-CAVI | 6.5 | 1.1 | 6.4 | 1 | 6.6 | 1.1 |
| R-CAVI | 6.6 | 1.1 | 6.5 | 1 | 6.6 | 1.1 |
| Systolic BP (mmHg) (120 - 140) |
117.7 | 12.6 | 114.7 | 9.1 | 115.9 | 9.7 |
| Diastolic BP (mmHg) (80 - 90) |
69.5 | 8.8 | 68 | 10.1 | 67.4 | 7.6 |
| Heart rate (bpm) | 67.7 | 11.8 | 66.1 | 9.3 | 69.5 | 13 |
hsCRP: high-sensitivity C-reactive protein; AST: aspartate aminotransferase; ALT: alanine aminotransferase; TSH: thyroid-stimulating hormone; RBC: red blood cells; WBC: white blood cells; HbA1C: hemoglobin A1c; HOMA-IR: homeostatic model assessment of insulin resistance; L-ABI: left ankle-brachial index; R-ABI: right ankle-brachial index; L-CAVI: left cardio-ankle vascular index; R-CAVI: right cardio-ankle vascular index; BP: blood pressure. Brackets indicate clinical reference ranges. Data represented as mean ± SD (n = 30) or interquartile range (IQR) for parametric and non-parametric variables respectively.
P <0.05
P <0.01
P <0.001 compared with baseline
P <0.05 compared with control oil intervention.
Characterization of lipid/lipoprotein profile on supplements
As shown in Table 4, both fish oil supplements significantly decreased TG levels by approximately 16% (P <0.05) compared to baseline. In addition, the TG-lowering effect of the fish oil supplements was more prominent in the subgroup of participants in the higher TG-tertiles: supplementation with control oil decreased TG by 69% (P <0.05) compared with baseline in the high TG-tertile group, and saury oil decreased TG by 32% (P <0.05) compared with baseline in the medium TG-tertile group. There were no changes in TG levels between fish oil supplementation and baseline in the low TG-tertile group (Fig. 2A). Supplementation with either fish oil slightly but significantly increased TC by 4.3% (P <0.05) on average compared to baseline. Control oil, but not saury oil, significantly elevated calculated LDL-C by 7.5% (P <0.05) compared to baseline, although there was no significant difference between control and saury oil (P = 0.17) (Table 4). In addition, NMR-based measurement also showed that control oil, but not saury oil, significantly increased LDL-C by 8.5% (P <0.05) (baseline vs. control oil vs. saury oil: 103.5 ± 44.4 vs. 112.2 ± 45.2 vs. 104.9 ± 51.9 mg/dL). The homogenous direct LDL-C assay also indicated a similar trend and a non-significant increase in LDL-C by 7.1% (P = 0.66) was observed with the control oil when compared to baseline (baseline vs. control oil vs. saury oil: 112.5 ± 53.1 vs. 120.5 ± 53.8 vs. 119 ± 60.2 mg/dL). Furthermore, the increase in LDL-C due to control oil supplementation was accompanied by a significant increase in sdLDL by 12% (P <0.05) compared to baseline. There were no changes in oxLDL and LDL-TG on either fish oil supplementation.
Table 4.
Lipoprotein biomarker values before (baseline) and after a 8-week ingestion of control or saury oil supplement
| Baseline (n=30) | Control oil (n=30) | Saury oil (n=30) | ||||
|---|---|---|---|---|---|---|
| Mean | SD | Mean | SD | Mean | SD | |
| Lipid/Lipoprotein profile | ||||||
| TG (mg/dL) | 64.3 | 26.2 | 52 | 21.1 * | 56.1 | 26.5 * |
| TC (mg/dL) | 174.8 | 48.6 | 184.3 | 45.6 * | 181.7 | 50.9 * |
| LDL-C (mg/dL) | 95.5 | 47.5 | 102.7 | 45.2 * | 98.6 | 50.6 |
| sdLDL (mg/dL) | 26.5 | 15.4 | 29.7 | 16.4 * | 29 | 17.9 |
| oxLDL (U/L) | 73.3 | 24.8 | 75.3 | 24.8 | 72.9 | 26.1 |
| LDL-TG (mg/dL) | 14.6 | 6.4 | 14.4 | 6.3 | 14.7 | 5.7 |
| HDL-C (mg/dL) | 64.4 | 18 | 67.9 | 16.9 * | 68.7 | 19.7 * |
| ApoE-HDL (mg/dL) | 5.9 | 1.9 | 6.3 | 1.7 * | 6.5 | 2.1 * |
| Apolipoproteins | ||||||
| ApoA-I (mg/dL) | 155.6 | 30.5 | 158.3 | 26.3 | 156.1 | 30.4 |
| ApoB (mg/dL) | 85.97 | 33.6 | 91.4 | 31.1 * | 89 | 33.8 |
TG: triglycerides; TC: total cholesterol; LDL-C: LDL cholesterol; sdLDL: small dense LDL; oxLDL: oxidized LDL; LDL-TG: TG concentration in LDL; HDL-C: HDL cholesterol; ApoE-HDL: ApoE-containing HDL. Data represented as mean ± SD (n = 30).
P <0.05
P <0.01 compared with baseline. No statistical difference were detected in all the reported parameters between the control and saury oil supplements based on a linear mixed effect model.
Figure 2.
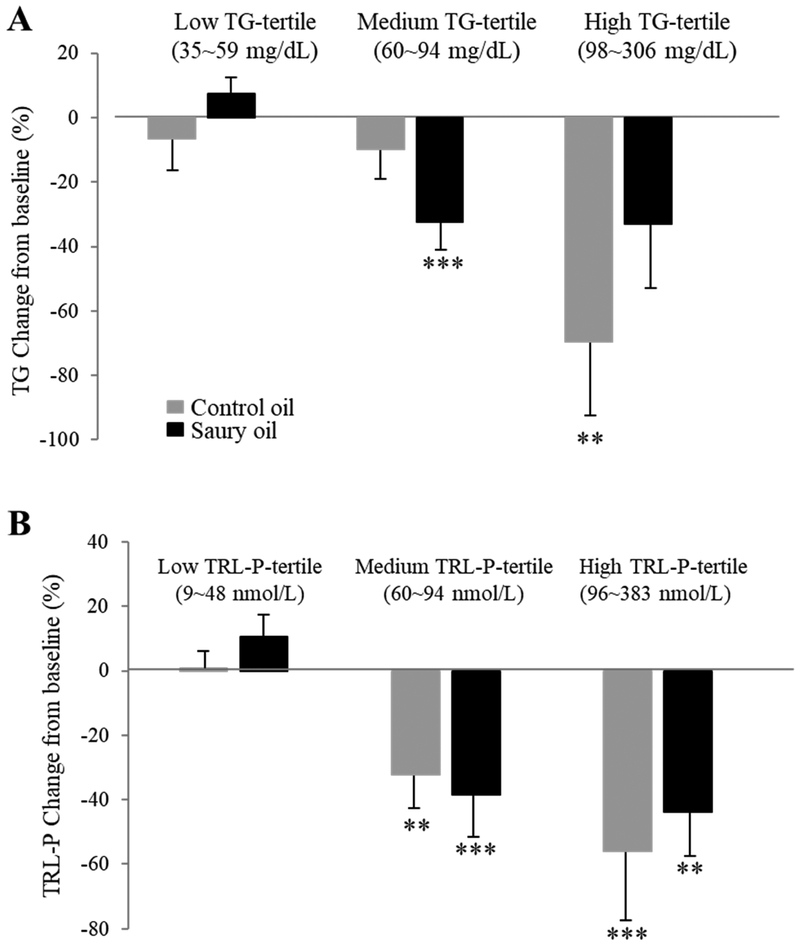
Mean percentage change of TG (A) and TRL-P (B) at low, medium, and high levels (tertiles) from baseline after fish oil supplementations for 8 weeks. TG: triglycerides; TRL-P: triglyceride-rich lipoprotein. Data represented as mean ± SD (n = 30). **P <0.01, ***P <0.001 compared with baseline.
In terms of HDL, both fish oil supplementations increased HDL-C (Roche direct assay) by approximately 6.2% (P <0.05) on average compared to baseline (Table 4). The HDL-C-increasing effect of both fish oils was further confirmed with a second direct HDL-C assay (Denka): HDL-C was increased by 5.4% (P <0.05) in the control oil group and by 7.6% (P <0.01) in the saury oil group compared with baseline (baseline vs. control oil vs. saury oil: 63.4 ± 16.5 vs. 66.8 ± 15.1 vs. 68.2 ± 17.8 mg/dL). Both oil supplements increased apoE-HDL-C levels by approximately 8.5% (P <0.05) as compared to baseline. There were no differences, however, in total plasma apoA-I levels due to either fish oil supplement. Control oil, but not saury oil, significantly increased plasma apoB levels by 6.3% (P <0.05) compared to baseline.
NMR-determined lipoprotein subclass profile on supplements
NMR spectroscopy was performed to further examine the effect of the two supplements on lipid and lipoprotein profiles. In general, the observed lipoprotein changes obtained by routine lipid and lipoprotein tests were consistent with the NMR assay, but additional changes were noted in the lipoprotein subclass size distributions. In particular, both fish oil supplementations significantly decreased VLDL-P by approximately 25% (P <0.05) (Fig. 3B) and reduced TRL-P, including small- and very small-TRL-P, by approximately 35% (P <0.05) compared to baseline (Fig. 3C), although there were no differences in VLDL-Z before and after either fish oil supplementation (Fig. 3A). Both fish oil supplements decreased TRL-P by ~50% (P <0.01) in the highest TRL-P-tertile group, and by about 35% (P <0.01) in the medium TRL-P-tertile group compared to baseline. There were no changes in TRL-P with either supplement in the low TRL-P tertile group (Fig. 2B). For LDL-P subclasses, in line with changes seen in LDL-C, the control oil significantly increased levels of LDL-P by 12% (P <0.001) compared with saury oil, although there were no differences in LDL size subclasses or in LDL-Z (Fig. 4A, B).
Figure 3.
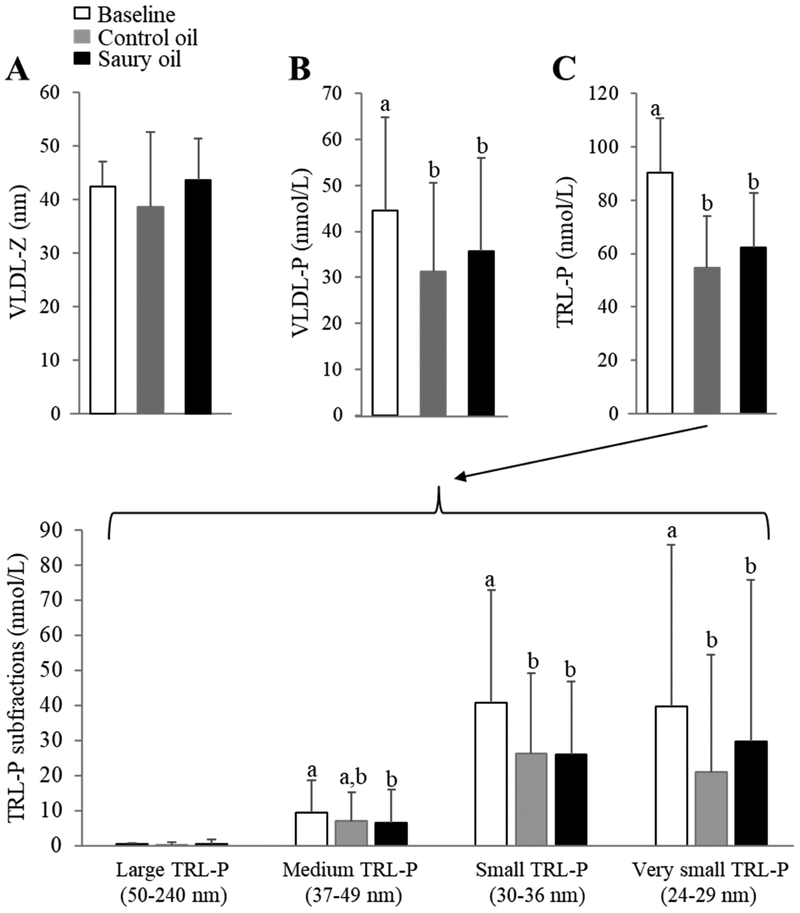
NMR-determined VLDL and TRL-P subclass before (baseline) and after an 8-week ingestion of control or saury oil supplement. (A) VLDL-Z diameters; (B) VLDL-P levels; (C) overall measure of TRL-P levels (upper panel) and TRL-P subfractions (large-, medium-, small-, and very small-TRL-P; lower panel). VLDL-Z: VLDL particle size; VLDL-P: VLDL particle number; TRL-P: TG-Rich Lipoprotein Particle. Data represented as mean ± SD (n = 30). Labeled means without a common letter differ (P <0.05).
Figure 4.
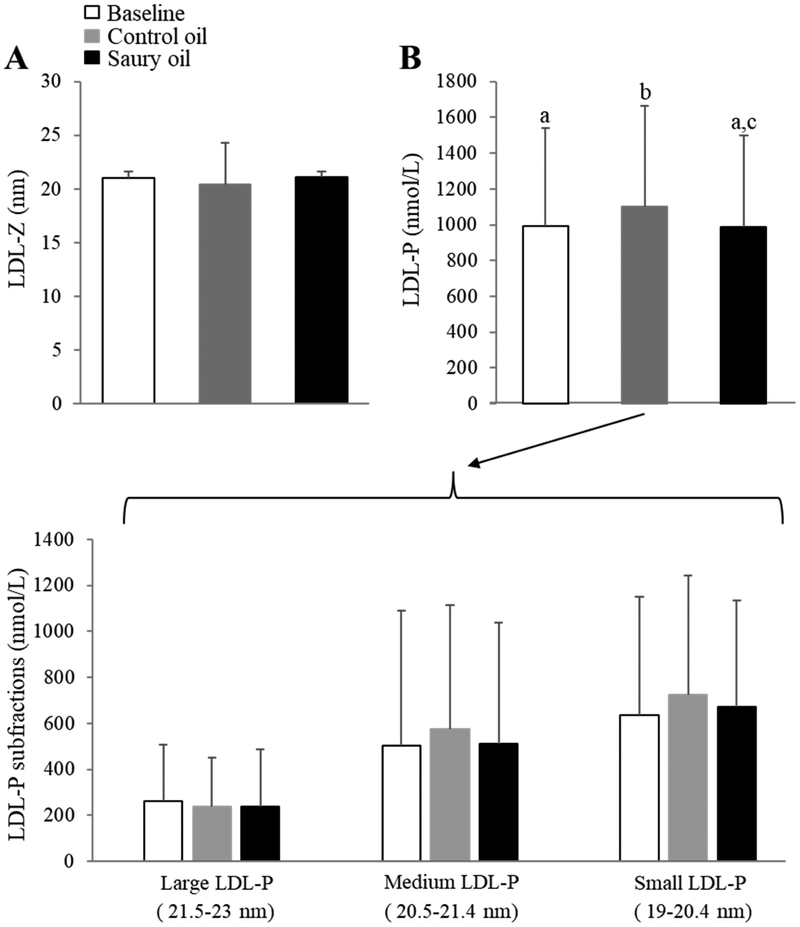
NMR-determined LDL subclass profile before (baseline) and after an 8-week ingestion of control or saury oil supplement. (A) LDL-Z diameters; (B) overall measure of LDL-P levels (upper panel) and LDL-P subfractions (large-, medium-, and small-LDL-P; lower panel). LDL-Z: LDL particle size; LDL-P: LDL particle number. Data represented as mean ± SD (n = 30). Labeled means without a common letter differ (P <0.05).
In terms of HDL-P subclasses, the increase in HDL-C levels after fish oil interventions corresponded to a greater increase in HDL-Z (P <0.05) with saury oil than with control oil (Fig. 5A). Although there were no differences in total HDL-P levels after either fish oil supplementation (Fig. 5B), both fish oils led to a significant increase in large-HDL-P levels (P <0.05) and a decrease in medium- and small-HDL-P levels (P <0.05) (Fig. 5C). In particular, both fish oil supplements increased the HDL-P5 subfraction (large-HDL-P) by 56% on average (P <0.05), and decreased the HDL-P3 subfraction (medium-HDL-P) by 25% (P <0.05) and HDL-P2 (small-HDL-P) by 17% (P <0.05). Assessment of the HDL function by ex vivo cholesterol efflux assay revealed that both oil supplementations significantly increased cholesterol efflux capacity by approximately 7.6% (P <0.05) compared to the baseline (Fig. 5D).
Figure 5.
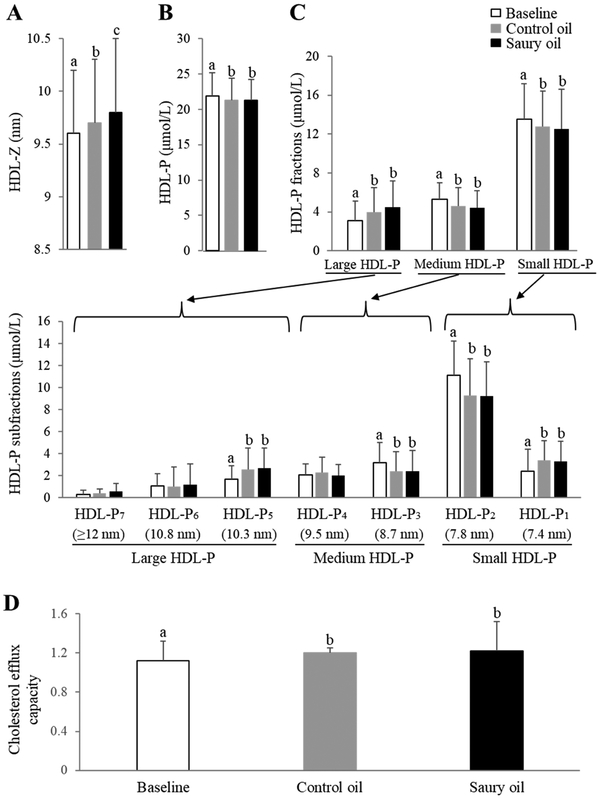
NMR-determined HDL subclass profile (A-C) and cholesterol efflux capacity (D) before (baseline) and after an 8-week ingestion of control or saury oil supplement. (A) HDL-Z diameters; (B) overall measure of HDL-P levels; (C) levels of HDL-P fractions (large-, medium-, and small-HDL-P; upper panel) and further separated HDL subfractions by diameter (HDL-P1~7; lower panel); (D) ex vivo cholesterol efflux capacity in J774 cells. HDL-Z: HDL particle size; HDL-P: HDL particle number; HDL-P1~7: HDL subspecies fraction 1~7 based on particle diameter. Data represented as mean ± SD (n = 30). Labeled means without a common letter differ (P <0.05).
Other risk CVD risk factors and biomarkers
As shown in Table 3, neither fish oil intervention changed high-sensitive CRP (hsCRP) plasma levels. The control fish oil increased glucose by 2.4% (P <0.05) and both fish oils increased insulin levels by 28% on average (P <0.05) compared to baseline, but insulin values still remained within the reference range. There were no significant changes for either fish oil on HbA1C or the calculated HOMA-IR index. In terms of vascular function parameters, there were no significant changes in the CAVI index, blood pressure or heart rate with either fish oil intervention, except for ankle-brachial index, which was decreased by approximately 3% (P <0.05) symmetrically after the control oil treatment.
Discussion
Fish consumption is widely believed to confer cardiovascular benefits26 based on the inverse association between fish intake, a major food source of omega-3 EPA/DHA27, and CVD. However, a recent meta-analysis involving nearly 78000 individuals failed to show that omega-3 supplements were associated with reductions in cardiovascular events28. This finding raises the issue of whether other nutritional components, besides omega-3 FAs in fish, such as LCMUFA, could account for the inverse association between fish consumption and CVD5-14. In the present study, we examine for the first time the safety and potential effect of purified saury oil, rich in LCMUFA, on lipid and lipoprotein metabolism in healthy adults. It is important to note that although we tried to match the total MUFA and omega-3 FA content of the control oil and saury oil by using a blend of oils from sardine and olive oil in making the control oil, there were still some relatively minor differences in their specific fatty acid levels. For example, the content of DHA in the saury oil supplement is ~81% higher and the content of EPA is ~56% lower than that in the control oil. We, therefore, cannot exclude the possibility that the observed treatment differences in the control oil and saury oil could be due to not only differences in LCMUFA but also to other fatty acid differences in the two supplements, which will have to be addressed in the future.
Supplementation with saury fish oil was found to be safe and well-tolerated at a dose of 3.5 g of LCMUFA and 2.2 g of omega-3 EPA/DHA per day. Neither fish oil supplement caused significant clinical or laboratory changes. In general, except for mild nausea in one subject, the saury oil treatment was well tolerated. We also demonstrated for the first time that supplementation with saury oil in normolipidemic non-obese volunteers leads to decreased TG levels even though at baseline all subjects except two had TG <150 mg/dL. In addition, changes in the lipoprotein particle subclass profiles (i.e., LDL-P and HDL-Z) were observed on saury oil compared with the control fish oil that contained a similar level of omega-3 and total MUFA, suggesting a possible unique beneficial effect of LCMUFA-rich fish oil on these lipid parameters. The main known effects of marine omega-3 (EPA/DHA) oils on lipids and lipoproteins are decreased plasma TG levels through reduction of hepatic VLDL-TG production29. The recent REDUCE-IT clinical trial found that 2 g of highly purified EPA twice a day lowers TG from baseline by 45% and approximately doubles the reduction in CVD events for those patients that are also on a statin30. In normolipidemic to borderline hyperlipidemic healthy individuals, a meta-analysis showed that 1-5 g/day consumption of EPA/DHA supplements resulted in a highly variable reduction of TG ranging between 4–51%31. In other studies, lower doses of EPA/DHA supplements (1.6-3 g/day) resulted on average in a 19 ± 10% decrease in TG levels in normolipidemic (TG: 110 ± 44 mg/dL) adults20-25. Overall, these findings are in agreement with ours: control and saury oil supplementations containing ~2.2 g of EPA/DHA decreased plasma TG levels by ~16% on average. Concomitant with decreased TG levels, both fish oil supplements also decreased the levels of potentially atherogenic TRL-P. Our analysis revealed that the decline in TG and TRL-P levels due to fish oil supplements was greater in subjects with higher baseline TG levels, which is in agreement with previous reports that individuals with higher baseline TG respond more strongly to omega-3 fish oil supplementation32.
Both fish oil supplements, which contain the same overall level of omega-3 FAs, increased plasma HDL-C levels. A meta-analysis had previously found that omega-3 consumption increased HDL-C, whereas dietary MUFA, such as oleate, did not greatly affect HDL-C levels33. The HDL-C increasing effect of LCMUFA-rich saury oil, therefore, appears to be unique to this type of MUFA. In line with previous reports, a 10-week intervention study using marine oils found that circulating LCMUFA positively correlated with HDL-C levels. In addition, LCMUFA-rich whale oil also increased HDL-C8. In another cross-over study, a salmon blend fish oil enriched in LCMUFA had a stronger effect in increasing HDL2 compared with tuna fish oil, although the omega-3 levels were comparable between the two fish oils, suggesting a possible favorable impact of LCMUFA on HDL size11.
Not only HDL-C levels, but also cholesterol efflux capacity, a functional measure of HDL34, was also altered by both fish oil supplements, despite no change in apoA-I levels. Previous human studies have indicated a possible beneficial effect of omega-3 treatment on CEC, which is thought to occur due to a remodeling of HDL35. Furthermore, our previous rodent studies have shown a favorable role of dietary LCMUFA, but not oleate-rich olive oil, on increasing CEC, possibly by activating the PPAR signaling pathway and remodeling of the HDL proteome13,14. Both fish oils also increased plasma levels of apoE-HDL, a minor HDL subclass that is thought to be cardioprotective by several mechanisms, including inhibition of arterial stiffening and improvement of reverse cholesterol transport through promoting cholesterol efflux36,37. Furthermore, NMR analyses of lipoprotein particle subclasses revealed that both fish oils improved HDL particle size subclasses. HDL size subfractions are known to vary in their cardioprotective propterties38,39. Compared to small-HDL-P, large-HDL-P appears to have more cardioprotective functions, possibly accounting for the inverse relationship between large-HDL-P and CVD40. In the current study, both fish oil supplements decreased small-HDL-P levels, and increased large-HDL-P levels compared to baseline. In addition, although a small but statistically greater change in HDL-Z was observed with saury oil compared to the control oil, there were no differences in each HDL-P subfraction with different particle size between the two fish oil supplements. This may be due to the fact that the overall measure of HDL-Z is usually a more reliable measurement than the individual HDL subfractions. The size differences in HDL between the two fish oil supplements is also relatively small and of unknown clinical significance. To further verify the effect of LCMUFA on HDL subtractions and metabolism, a larger sample size will likely be needed in a future follow-up study.
In terms of LDL, supplementation of control oil, but not saury oil, significantly increased plasma levels of both LDL-C and apoB compared to baseline. It is important to note that we used 3 different methods to measure LDL-C change: the Friedwald equation, an NMR-based (Vantera) measurement, and a homogenous (Denka) direct assay of LDL-C. Although all methods showed similar LDL-C-increasing effect (~7-8.5%) of control oil compared with baseline, the Direct method did not show significant difference between baseline and either oil treatment. This may possibly be explained by the fact that direct LDL-C assays can have a significant bias in some patients, depending on their lipid composition41, which may have contributed to the overall variation of the result for the direct assay and the lack of statistical significance. Furthermore, NMR-based measurement of LDL subfractions revealed that control oil significantly increased the overall particle number of LDL (LDL-P) compared to saury oil. It is known that marine omega-3, in particular DHA, can modestly raise LDL-C levels and increase mean LDL particle size42,43. Although the total omega-3 content in both fish oil supplements were similar, and the dose of DHA in saury oil was 81% higher than that in control fish oil, saury oil supplementation did not increase LDL-P and sdLDL, both of which have been shown to be strongly related to CVD44. It is also noteworthy that sdLDL levels were not significantly different between the two fish oil supplements (P = 0.32), perhaps due to relatively low values of sdLDL in healthy subjects in the current study. Further studies in hyperlipidemic individuals with elevated sdLDL will be necessary to better determine the effect of saury oil on sdLDL levels in plasma. Our previous animal studies12,13 revealed a LDL-C-decreasing effect of purified LCMUFA. The two fish oil supplements did not appear to alter LDL size subfractions, although the medium and small subfractions did show trends that mimicked the overall difference. The lack of statistical significance in the subfractions most likely relates to the greater analytical imprecision of the size subfractions compared to LDL-P. Future studies using highly purified LCMUFA oil, however, are needed to investigate the direct effect of LCMUFA on lipoprotein metabolism in hyperlipidemic patients. Previous animal and human studies from our group12-14 and others1 have also shown that dietary LCMUFA or omega-3 may possibly improve inflammation and/or glucose metabolism, but neither of the two fish oils used in our current study changed hsCRP, HOMA-IR, or vascular CAVI parameters. The fact that all the subjects recruited in the current study were relatively healthy with low hsCRP and normal insulin sensitivity could possibly explain the lack of an effect observed in this study.
Study strengths and limitations
Strengths of the present study include randomized double-blind design, and the use of a placebo supplement matched in fatty acid profile (i.e, total SFA, MUFA, and omega-3 PUFA), as well as the taste and appearance. Furthermore, there were no major changes in lifestyle and dietary factors during the study. Limitations include the relatively small sample size, short duration, and single dose design. In crossover studies there is also always the potential for carry-over effects, but a relatively long washout period of 8 weeks and the analysis of the data by a linear mixed effect model should help minimize this issue. Future studies on saury oil should include a red blood cell fatty acid composition analysis to control for differences in absorption and metabolism of different FAs by subjects, and to better monitor compliance and the effectiveness of the washout period. In addition, it is also important to note that the participants in the current study were relatively healthy, with a normal lipoprotein profile, thus limiting our ability to fully assess the impact of saury oil supplementation on patients with dyslipidemia.
Conclusion
A saury fish oil supplement that is enriched in omega-11 LCMUFA and omega-3 PUFAs was shown to be safe and well-tolerated in this first human study. Saury oil was found to have some possible benefits on the lipid and lipoprotein profile in healthy subjects, but these findings need to be further verified in larger numbers of other patient populations.
Supplementary Material
Acknowledgements
Conceived and designed the experiments: Z.-H.Y., M.A., R.S., and A.R. Performed the experiments: Z.-H.Y., M.A., A.S., A.C., M.S., M.P., M.S., S.Y., C.L., K.D., N.M., Analyzed the data: Z.-H.Y., M.A., A.S., J.T., A.C., Wrote the manuscript: Z.-H.Y., M.A., A.S., A.C., and A.R. The authors declare no conflict of interest. The authors are thankful to all staff of Outpatient 7 clinics at the NIH Clinical Center (Warren Grant Magnuson Clinical Center) in particular to Farahnaz Hassanshahi, Sr. CRN, OCN/BMTCRN, Team Lead; Roumiana Nenkova-Dimtcheva, Sr. CRN, OCN, Clinical Educator; Elizabeth Wendell, RN, MS, OCN, Nurse Manager, for their help in this study. We are also thankful to Dana Smith, Protocol Navigator, Adriana Byrnes, Ph.D., Head of Regulatory Support. The authors would like to thank Nippon Suisan Kaisha Ltd. for supplying fish oil supplement capsules. We wish to thank Hiroko Miyahara, Hideaki Yamaguchi, Yuji Hirouchi and Masashi Katayama, for their technical assistance. We thank Dr. Edward Neufeld and Dr. Lita Freeman for proofreading the manuscript. In addition, we thank the volunteers that participated in the study. This work was supported by the Intramural Research Program of the National Heart, Lung and Blood Institute (NHLBI) and the Office of Dietary Supplements (ODS) Research Scholars Program at the National Institutes of Health.
Abbreviations:
- CVD
cardiovascular disease
- DHA
docosahexaenoic acid
- EPA
eicosapentaenoic acid
- FA
fatty acid
- HDL
high-density lipoprotein
- LCMUFA
long-chain monounsaturated fatty acid
- LDL
low-density lipoprotein
- MUFA
monounsaturated fatty acid
- TC
total cholesterol
- TG
triglyceride
- TRL-P
TG-rich lipoproteins
- VLDL
very-low-density lipoprotein
Footnotes
Publisher's Disclaimer: This is a PDF file of an unedited manuscript that has been accepted for publication. As a service to our customers we are providing this early version of the manuscript. The manuscript will undergo copyediting, typesetting, and review of the resulting proof before it is published in its final form. Please note that during the production process errors may be discovered which could affect the content, and all legal disclaimers that apply to the journal pertain.
References
- 1.Ruxton CH, Reed SC, Simpson MJ: The health benefits of omega-3 polyunsaturated fatty acids: a review of the evidence. J Hum Nutr Diet. 2004;17:449–459 [DOI] [PubMed] [Google Scholar]
- 2.Ota T, Takagi T, Kosaka S: Changes in lipids of young and adult saury cololabis saira (Pisces). Mar Ecol Prog Ser. 1980;3:11–17 [Google Scholar]
- 3.Bailey KM, Powers DM, Quattro JM, Villa G, Nishimura A, Traynor JJ, Walters G. Population Ecology and Structural Dynamics of Walleye Pollock (Theragra chalcogramma). In: Dynamics of the Bering Sea. 1999;581–614. [Google Scholar]
- 4.Aidos I, van der Padt A, Luten JB, Boom RM: Seasonal changes in crude and lipid composition of herring fillets, byproducts, and respective produced oils. J Agric Food Chem. 2002;50:4589–4599. [DOI] [PubMed] [Google Scholar]
- 5.Bang HO, Dyerberg J, Sinclair HM: The composition of the Eskimo food in north western Greenland. Am J Clin Nutr. 1980;33:2657–2661. [DOI] [PubMed] [Google Scholar]
- 6.Dyerberg J, Bang HO, Hjorne N: Fatty acid composition of the plasma lipids in Greenland Eskimos. Am J Clin Nutr. 1975;28:958–966. [DOI] [PubMed] [Google Scholar]
- 7.Matsumoto C, Matthan NR, Lichtenstein AH, Gaziano JM, Djoussé L: Red blood cell MUFAs and risk of coronary artery disease in the Physicians' Health Study. Am J Clin Nutr. 2013;98:749–754. [DOI] [PMC free article] [PubMed] [Google Scholar]
- 8.Osterud B, Elvevoll E, Barstad H, Brox J, Halvorsen H, Lia K, Olsen JO, Olsen RL, Sissener C, Rekdal O, Vognild E: Effect of marine oils supplementation on coagulation and cellular activation in whole blood. Lipids. 1995;30:1111–1118. [DOI] [PubMed] [Google Scholar]
- 9.Conquer JA, Cheryk LA, Chan E, Gentry PA, Holub BJ: Effect of supplementation with dietary seal oil on selected cardiovascular risk factors and hemostatic variables in healthy male subjects. Thromb Res. 1999;96:239–250. [DOI] [PubMed] [Google Scholar]
- 10.Lindqvist H, Langkilde AM, Undeland I, Rådendal T, Sandberg AS: Herring (Clupea harengus) supplemented diet influences risk factors for CVD in overweight subjects. Eur J Clin Nutr. 2007;61:1106–1113. [DOI] [PubMed] [Google Scholar]
- 11.Childs MT, King IB, Knopp RH: Divergent lipoprotein responses to fish oils with various ratios of eicosapentaenoic acid and docosahexaenoic acid. Am J Clin Nutr. 1990;52:632–639. [DOI] [PubMed] [Google Scholar]
- 12.Yang ZH, Miyahara H, Mori T, Doisaki N, Hatanaka A: Beneficial effects of dietary fish-oil-derived monounsaturated fatty acids on metabolic syndrome risk factors and insulin resistance in mice. J Agric Food Chem. 2011;59:7482–7489 [DOI] [PubMed] [Google Scholar]
- 13.Yang ZH, Bando M, Sakurai T, Chen Y, Emma-Okon B, Wilhite B, Fukuda D, Vaisman B, Pryor M, Wakabayashi Y, Sampson M, Yu ZX, Sakurai A, Zarzour A, Miyahara H, Takeo J, Sakaue H, Sata M, Remaley AT: Long-chain monounsaturated fatty acid-rich fish oil attenuates the development of atherosclerosis in mouse models. Mol Nutr Food Res. 2016;60:2208–2218. [DOI] [PMC free article] [PubMed] [Google Scholar]
- 14.Yang ZH, Gordon SM, Sviridov D, Wang S, Danner RL, Pryor M, Vaisman B, Shichijo Y, Doisaki N, Remaley AT: Dietary supplementation with long-chain monounsaturated fatty acid isomers decreases atherosclerosis and alters lipoprotein proteomes in LDLr−/− mice. Atherosclerosis. 2017;262:31–38. [DOI] [PMC free article] [PubMed] [Google Scholar]
- 15.Mozaffarian D, Clarke R: Quantitative effects on cardiovascular risk factors and coronary heart disease risk of replacing partially hydrogenated vegetable oils with other fats and oils. Eur J Clin Nutr: 2009;63:22–33. [DOI] [PubMed] [Google Scholar]
- 16.Yang ZH, Miyahara H, Takeo J, Katayama M: Ingestion of a single serving of saury alters postprandial levels of plasma n-3 polyunsaturated fatty acids and long-chain monounsaturated fatty acids in healthy human adults. Lipids Health Dis. 2012;11:95. [DOI] [PMC free article] [PubMed] [Google Scholar]
- 17.Takahashi Y, Ito Y, Wada N, Nagasaka A, Fujikawa M, Sakurai T, Shrestha R, Hui SP, Chiba H: Development of homogeneous assay for simultaneous measurement of apoE-deficient, apoE-containing, and total HDL-cholesterol. Clin Chim Acta. 2016;454:135–142. [DOI] [PubMed] [Google Scholar]
- 18.Mehta NN, Li R, Krishnamoorthy P, Yu Y, Farver W, Rodrigues A, Raper A, Wilcox M, Baer A, DerOhannesian S, Wolfe M, Reilly MP, Rader DJ, VanVoorhees A, Gelfand JM: Abnormal lipoprotein particles and cholesterol efflux capacity in patients with psoriasis. Atherosclerosis. 2012;224:218–221. [DOI] [PMC free article] [PubMed] [Google Scholar]
- 19.Shirai K, Utino J, Otsuka K, Takata M: A novel blood pressure-independent arterial wall stiffness parameter; cardio-ankle vascular index (CAVI). J Atheroscler Thromb. 2006;13:101–107. [DOI] [PubMed] [Google Scholar]
- 20.Christensen JH, Christensen MS, Dyerberg J, Schmidt EB: Heart rate variability and fatty acid content of blood cell membranes: a dose-response study with n-3 fatty acids. Am J Clin Nutr. 1999;70:331–337. [DOI] [PubMed] [Google Scholar]
- 21.Clandinin MT, Foxwell A, Goh YK, Layne K, Jumpsen JA: Omega-3 fatty acid intake results in a relationship between the fatty acid composition of LDL cholesterol ester and LDL cholesterol content in humans. Biochim Biophys Acta. 1997;1346:247–252. [DOI] [PubMed] [Google Scholar]
- 22.Conquer JA, Holub BJ: Supplementation with an algae source of docosahexaenoic acid increases (n-3) fatty acid status and alters selected risk factors for heart disease in vegetarian subjects. J Nutr. 1996;126:3032–3039. [DOI] [PubMed] [Google Scholar]
- 23.Marckmann P, Bladbjerg EM, Jespersen J: Dietary fish oil (4 g daily) and cardiovascular risk markers in healthy men. Arterioscler Thromb Vasc Biol. 1997;17:3384–3391. [DOI] [PubMed] [Google Scholar]
- 24.Misso NL, Thompson PJ: Fish Oil Supplementation Inhibits Platelet Aggregation and ATP Release Induced by Platelet-activating Factor and Other Agonists. Platelets. 1995;6:275–282. [DOI] [PubMed] [Google Scholar]
- 25.Cerbone AM, Cirillo F, Coppola A, Risè P, Stragliotto E, Galli C, Giordano M, Tremoli E, Di Minno G: Persistent impairment of platelet aggregation following cessation of a short-course dietary supplementation of moderate amounts of N-3 fatty acid ethyl esters. Thromb Haemost. 1999;82:128–133. [PubMed] [Google Scholar]
- 26.American Heart Association Nutrition Committee, Lichtenstein AH, Appel LJ, Brands M, Carnethon M, Daniels S, Franch HA, Franklin B, Kris-Etherton P, Harris WS, Howard B, Karanja N, Lefevre M, Rudel L, Sacks F, Van Horn L, Winston M, Wylie-Rosett J: Diet and lifestyle recommendations revision 2006: a scientific statement from the American Heart Association Nutrition Committee. Circulation. 2006;114:82–96. [DOI] [PubMed] [Google Scholar]
- 27.He K, Song Y, Daviglus ML, Liu K, Van Horn L, Dyer AR, Greenland P: Accumulated evidence on fish consumption and coronary heart disease mortality: a meta-analysis of cohort studies. Circulation. 2004;109:2705–2711. [DOI] [PubMed] [Google Scholar]
- 28.Aung T, Halsey J, Kromhout D, Gerstein HC, Marchioli R, Tavazzi L, Geleijnse JM, Rauch B, Ness A, Galan P, Chew EY, Bosch J, Collins R, Lewington S, Armitage J, Clarke R, Omega-3 Treatment Trialists’ Collaboration: Associations of omega-3 fatty acid supplement use with cardiovascular disease risks: meta-analysis of 10 trials involving 77 917 individuals. JAMA Cardiol. 2018;3:225–234. [DOI] [PMC free article] [PubMed] [Google Scholar]
- 29.Shearer GC, Savinova OV, Harris WS: Fish oil -- how does it reduce plasma triglycerides? Biochim Biophys Acta. 2012;1821:843–851. [DOI] [PMC free article] [PubMed] [Google Scholar]
- 30.Bhatt DL, Steg PG, Miller M, Brinton EA, Jacobson TA, Ketchum SB, Doyle RT Jr, Juliano RA, Jiao L, Granowitz C, Tardif JC, Ballantyne CM, REDUCE-IT Investigators: Cardiovascular Risk Reduction with Icosapent Ethyl for Hypertriglyceridemia. N Engl J Med. 2019;380:11–22. [DOI] [PubMed] [Google Scholar]
- 31.Leslie MA, Cohen D, Liddle DM, Robinson LE, Ma D: A review of the effect of omega-3 polyunsaturated fatty acids on blood triacylglycerol levels in normolipidemic and borderline hyperlipidemic individuals. Lipids Health Dis. 2015;14:53. [DOI] [PMC free article] [PubMed] [Google Scholar]
- 32.Balk E, Chung M, Lichtenstein A, Chew P, Kupelnick B, Lawrence A, DeVine D, Lau J: Effects of omega-3 fatty acids on cardiovascular risk factors and intermediate markers of cardiovascular disease. Evid Rep Technol Assess (Summ). 2004;93:1–6. [PMC free article] [PubMed] [Google Scholar]
- 33.Yanai H, Katsuyama H, Hamasaki H, Abe S, Tada N, Sako A: Effects of Dietary Fat Intake on HDL Metabolism. J Clin Med Res. 2015;7:145–149. [DOI] [PMC free article] [PubMed] [Google Scholar]
- 34.Rosenson RS, Brewer HB Jr, Davidson WS, Fayad ZA, Fuster V, Goldstein J, Hellerstein M, Jiang XC, Phillips MC, Rader DJ, Remaley AT, Rothblat GH, Tall AR, Yvan-Charvet L: Cholesterol efflux and atheroprotection: advancing the concept of reverse cholesterol transport. Circulation. 2012;125:1905–1919. [DOI] [PMC free article] [PubMed] [Google Scholar]
- 35.Pizzini A, Lunger L, Demetz E, Hilbe R, Weiss G, Ebenbichler C, Tancevski I: The Role of Omega-3 Fatty Acids in Reverse Cholesterol Transport: A Review. Nutrients. 2017;9:pii: E1099. [DOI] [PMC free article] [PubMed] [Google Scholar]
- 36.Kothapalli D, Liu SL, Bae YH, Monslow J, Xu T, Hawthorne EA, Byfield FJ, Castagnino P, Rao S, Rader DJ, Puré E, Phillips MC, Lund-Katz S, Janmey PA, Assoian RK: Cardiovascular protection by ApoE and ApoE-HDL linked to suppression of ECM gene expression and arterial stiffening. Cell Rep. 2012;2:1259–12571. [DOI] [PMC free article] [PubMed] [Google Scholar]
- 37.Matsuura F, Wang N, Chen W, Jiang XC, Tall AR: HDL from CETP-deficient subjects shows enhanced ability to promote cholesterol efflux from macrophages in an apoE- and ABCG1-dependent pathway. J Clin Invest. 2006;116:1435–1442. [DOI] [PMC free article] [PubMed] [Google Scholar]
- 38.Mackey RH, Greenland P, Goff DC Jr, Lloyd-Jones D, Sibley CT, Mora S: High-density lipoprotein cholesterol and particle concentrations, carotid atherosclerosis, and coronary events: MESA (multi-ethnic study of atherosclerosis). J Am Coll Cardiol. 2012;60:508–516. [DOI] [PMC free article] [PubMed] [Google Scholar]
- 39.Navab M, Anantharamaiah GM, Reddy ST, Van Lenten BJ, Ansell BJ, Fogelman AM: Mechanisms of disease: proatherogenic HDL an evolving field. Nat Clin Pract Endocrinol Metab. 2006;2:504–511. [DOI] [PubMed] [Google Scholar]
- 40.Kontush A: HDL particle number and size as predictors of cardiovascular disease. Front Pharmacol. 2015;6:218. [DOI] [PMC free article] [PubMed] [Google Scholar]
- 41.Miller WG, Myers GL, Sakurabayashi I, Bachmann LM, Caudill SP, Dziekonski A, Edwards S, Kimberly MM, Korzun WJ, Leary ET, Nakajima K, Nakamura M, Nilsson G, Shamburek RD, Vetrovec GW, Warnick GR, Remaley AT. Seven direct methods for measuring HDL and LDL cholesterol compared with ultracentrifugation reference measurement procedures. Clin Chem. 2010;56:977–986. [DOI] [PMC free article] [PubMed] [Google Scholar]
- 42.Allaire J, Vors C, Tremblay AJ, Marin J, Charest A, Tchernof A, Couture P, Lamarche B: High-Dose DHA Has More Profound Effects on LDL-Related Features Than High-Dose EPA: The ComparED Study. J Clin Endocrinol Metab. 2018;103:2909–2917. [DOI] [PubMed] [Google Scholar]
- 43.Jacobson TA, Glickstein SB, Rowe JD, Soni PN: Effects of eicosapentaenoic acid and docosahexaenoic acid on low-density lipoprotein cholesterol and other lipids: a review. J Clin Lipidol. 2012;6:5–18. [DOI] [PubMed] [Google Scholar]
- 44.Sacks FM, Campos H: Low-density lipoprotein size and cardiovascular disease: a reappraisal. J Clin Endocrinol Metab. 2003;88:4525–4532. [DOI] [PubMed] [Google Scholar]
Associated Data
This section collects any data citations, data availability statements, or supplementary materials included in this article.