

Abstract
Computer-aided prediction of dementia status (e.g., clinical scores of cognitive tests) from brain MRI is of great clinical value, as it can help assess pathological stage and predict disease progression. Existing learning-based approaches typically preselect dementia-sensitive regions from the whole-brain MRI for feature extraction and prediction model construction, which might be sub-optimal due to potential heterogeneities between different steps. Also, based on anatomical prior knowledge (e.g., brain atlas) and time-consuming nonlinear registration, these preselected brain regions are usually the same across all subjects, ignoring their individual specificities in dementia progression. In this paper, we propose a multi-task weakly-supervised attention network (MWAN) to jointly predict multiple clinical scores from the baseline MRI data, by explicitly considering individual specificities of different subjects. Leveraging a fully-trainable dementia attention block, our MWAN method can automatically identify subject-specific discriminative locations from the whole-brain MRI for end-to-end feature learning and multi-task regression. We evaluated our MWAN method by cross-validation on two public datasets (i.e., ADNI-1 and ADNI-2). Experimental results demonstrate that the proposed method performs well in both the tasks of clinical score prediction and weakly-supervised discriminative localization in brain MR images.
1. Introduction
As the most common cause of dementia, Alzheimer’s disease (AD) is characterized by progressive and irreversible loss of intellectual skills [3]. In clinical practice, the dementia status can be comprehensively assessed by different cognitive tests, e.g., mini-mental state examination (MMSE), clinical dementia rating sum of boxes (CDRSB), and Alzheimer’s disease assessment scale cognitive subscale (ADAS-Cog). Clinical scores of these cognitive tests have been proven to be reliably correlated with disease progression [7]. Therefore, automatically predicting these clinical scores is of great clinical value, which helps evaluate the stage of dementia pathology and forecast the disease progression.
Structural magnetic resonance imaging (MRI) is widely used in computer-aided diagnosis (CAD) of AD and mild cognitive impairment (MCI), due to its sensitivity to brain atrophy caused by dementia [2]. While diverse CAD methods have been proposed to identify categorical labels (e.g., AD/MCI) [4,8], there is relatively fewer studies on clinical score prediction, considering that regressing continuous variables is practically more challenging [6,9]. Several machine learning and deep learning techniques have been applied for clinical score prediction using brain MR images. Machine learning methods usually predefine dementia-sensitive locations (e.g., according to anatomical prior knowledge [13]) from the whole-brain MRI, and then extract hand-crafted features to construct regression models. Deep learning methods, e.g., with convolutional neural networks (CNNs) [5], typically combine feature extraction and model construction, potentially yielding better results due to task-oriented feature learning. However, most of the existing learning-based models require preselecting dementia-sensitive locations in MRI, since it is very challenging to directly capture subtle structural changes from the whole-brain image. This precondition may hamper the performance and efficiency of computer-aided clinical score prediction, mainly because 1) the isolated selection of dementia-sensitive brain locations might not be well coordinated with the latter stages of feature learning and model construction, and 2) this procedure usually relies on time-consuming nonlinear registration in both training and test phases. Also, existing methods usually restrict all studied subjects to share exactly the same dementia-sensitive locations in brain MRIs, ignoring individual variations of different subjects in disease progression.
In this paper, we propose a multi-task weakly-supervised attention network (MWAN) to jointly predict multiple clinical scores from the baseline whole-brain MRI. Figure 1 shows a schematic diagram of our MWAN model, which consists of (1) a backbone fully convolutional network (FCN), (2) a trainable dementia attention block, and (3) an attention-aware multi-task regression block. Different from existing CAD methods for dementia diagnosis, our MWAN is an end-to-end and fully-trainable deep architecture. That is, in a task-oriented manner, our MWAN method can automatically identify subject-specific discriminative locations from the whole-brain image, and seamlessly learn high-level feature representations to construct multi-task regression models for clinical score prediction.
Fig. 1.

Illustration of our multi-task weakly supervised attention network (MWAN).
2. Materials and Method
2.1. Datasets and Image Pre-Processing
Two public datasets (i.e., ADNI-1 and ADNI-2 with 1, 396 subjects in total) downloaded from Alzheimer’s Disease Neuroimaging Initiative1 were studied in this paper. For the independent test, subjects that appear in both ADNI-1 and ADNI-2 were removed from ADNI-2. The baseline ADNI-1 dataset consists of 1.5T T1-weighted MR images acquired from 797 subjects, including 226 normal control (NC), 225 stable MCI (sMCI), 165 progressive MCI (pMCI), and 181 AD subjects. The baseline ADNI-2 dataset contains 3T T1-weighted MR images acquired from 599 subjects, including 185 NC, 234 sMCI, 37 pMCI, and 143 AD subjects. The definition of pMCI/sMCI is based on whether MCI would convert to AD within 36 months after baseline evaluation. Each subject has baseline clinical scores for three cognitive tests, i.e., CDRSB, ADAS-Cog, and MMSE.
All brain MR images were processed following a standard pipeline, including anterior commissure (AC)-posterior commissure (PC) correction, intensity correction, skull stripping, and cerebellum removing. An affine registration was performed to linearly align all MRI data onto a template to remove global linear difference, and also to resample all imaging data to have the same spatial resolution (i.e., 1 × 1 × 1 mm3). Finally, all linearly-aligned brain MR images were cropped to have the identical size of 144 × 184 × 152.
2.2. Multi-task Weakly-Supervised Attention Network
Backbone:
As shown in Fig. 1, we employ a fully convolutional network (FCN) as the backbone to generate relatively high-dimensional feature maps that model global information of the whole-brain MRI. The backbone FCN in our current implementation contains eight 3 × 3 × 3 convolutional (Conv) layers and three 2 × 2 × 2 Conv layers, all with zero padding, followed by batch normalization (BN) and rectified linear unit (ReLU) activation. The numbers of channels for Conv1 to Conv11 are 16, 16, 16, 32, 32, 32, 64, 64, 64, 128, and 128, respectively. The stride for the 3 × 3 × 3 kernels is set as 1, while the stride for the 2 × 2 × 2 kernels is set as 2 to downsample feature maps and increase receptive fields. As a plug-in unit, this basic backbone in our MWAN model can be easily replaced by any other FCN architectures (e.g., by including residual or dense blocks).
Weakly-Supervised Dementia Attention:
It is worth noting that different cognitive tests actually evaluate the dementia status from complementarily different views. In addition, the respective clinical scores are intrinsically correlated with four categorical labels of dementia (i.e., NC, sMCI, pMCI, or AD), considering that they point to semantically similar targets [9]. Therefore, leveraging the image-wise categorical labels as weakly-supervised guidance, a trainable attention block is designed in our MWAN to automatically identify discriminative brain locations that are strongly relevant to subject-specific dementia status.
To this end, as the input to our dementia attention block, feature maps generated by the backbone FCN are first squeezed across channels by using an 1 × 1 × 1 Conv layer. Denote the corresponding output as F = [F1, …, FM], where is the feature map (size: W × H × L) at the m-th channel and M = 64 is the number of channels. We then apply a global average pooling (GAP) layer on F to produce a holistic feature representation capturing the semantic information of the whole-brain MRI. The feature representation f is further mapped by another 1 × 1 × 1 Conv layer, followed by softmax normalization, onto the categorical label space (i.e., with C = 4 units). Inspired by [10,12], but operating distinctively in another fully-trainable way, we capitalize on the categorical label information to detect dementia-sensitive MRI locations. Specifically, in parallel with the mapping of f, we also apply an 1 × 1 × 1 Conv layer (with C channels) on F, where the convolutional operations on F and f share the same set of learnable weights w = [w1, … wC], with . Since the estimated score explicitly indicates the individual score for the c-th categorical label, we can expect that
| (1) |
which describes the spatially-varying contributions of different regions in quantifying the score for the c-th categorical label . After element-wisely normalizing A = [A1, …, AC] for each channel, we finally aggregate the attention maps for different categorical labels as
| (2) |
Considering that such an attention block is jointly trained with other parts in our proposed MWAN model, the resulting can highlight discriminative brain regions that are strongly relevant to subject-specific dementia status.
Attention-Aware Multi-task Regression:
With the subject-specific spatial attention map in (2), we further design a multi-task regression block to jointly predict multiple clinical scores (i.e., CDRSB, ADAS-Cog, and MMSE). To this end, feature maps generated by the backbone FCN are squeezed across channels via an 1 × 1 × 1 Conv layer with M = 64 channels, which are then element-wisely weighted by across channels to enhance the influence of features extracted from discriminative brain locations (i.e., with large weights in ). A GAP operation is then performed on the spatially-weighted feature maps to yield an attention-aware holistic feature representation describing the semantic information of the whole-brain MRI. Finally, for each clinical score (or regression task), two successive fully-connected (FC) layers, with 32 and 1 unit(s), respectively, are applied on the attention-aware feature representation to predict its value. Notably, as a flexible module, the classification task (e.g., differentiation between NC, sMCI, pMCI, and AD) could also be potentially included here to provide auxiliary guidance for clinical score regression.
End-to-End Localization and Prediction:
Let be a training set containing N samples, where Xn is the n-th subject, yn ∈ {1, …, C} is the categorical label, and denotes T types of clinical scores. Our MWAN model performs end-to-end discriminative localization and clinical score prediction from the whole-brain MRI. It jointly optimizes the learnable parameters for the backbone FCN, the dementia attention block, and the attention-aware multi-task regression block, denoted as Wfcn, Wloc, and Wreg, respectively. As shown in Fig. 1, the loss functions to this end is the combination of the loss for weakly-supervised discriminative localization (i.e., ) and the loss for multi-task regression (i.e., ). Specifically, is defined as
| (3) |
where 1 (·) is a binary indicator, and sc (Xn|Wfcn, Wloc) indicates the score for classifying Xn as the c-th category in terms of network parameters Wfcn and Wloc. Besides, is defined as
| (4) |
where denotes the predicted T clinical scores for Xn in terms of network parameters, Wfcn, Wloc and Wreg. We finally define , where α (empirically set as 0.01 in this work) is a parameter to balance the contributions of the two terms. Based on (3) and (4), it is worth noting that, both the localization and regression losses will be back-propagated to optimize the backbone FCN, while the regression loss will also be merged into the dementia attention block to assist its training.
Implementation:
Our MWAN model was implemented using Python based on Keras, trained with the Adam optimizer (mini-batch size: 2; dropout for Conv layers: 0.5). The input was the linearly-aligned MRI (size: 144 × 184 × 152), and our network was constructed for end-to-end prediction of T = 3 clinical scores (i.e., CDRSB, ADAS-Cog, and MMSE). At the training stage, four (C = 4) categorial labels (i.e., NC, sMCI, pMCI, and AD) are used for weakly-supervised dementia attention detection. The training set was augmented online by randomly re-scaling brain MRIs in a tiny range and flipping them in the axial plane.
3. Experiments
Experimental Setup:
We performed dataset-wise 2-fold cross-validation in the experiments. That is, we first trained a regression model on ADNI-1 and evaluated it on ADNI-2, and then trained another model on ADNI-2 and evaluated it on ADNI-1. As for the validation set at each iteration, we randomly selected 15% subjects from ADNI-1 and 10% subjects from ADNI-2, since ADNI-1 has more subjects than ADNI-2. The performance of score prediction was quantified by the correlation coefficient (CC) and the root mean square error (RMSE).
We compared our MWAN method with 3 conventional methods using hand-crafted features, including (1) voxel-based morphometry (VBM) [1], (2) ROI-based pattern analysis (ROI), and (3) anatomical landmark-based morphometry (LBM) [11], as well as a deep learning method, i.e., (4) deep multi-task multi-channel learning (DM2L) [5]. In VBM method, all brain MRIs were non-linearly aligned onto the anatomical automatic labeling (AAL) template, and then the voxel-wise gray matter (GM) tissue density was quantified as features. A feature selection operation using t-test was then performed to select informative features to train support vector regressors (SVRs) for clinical score prediction. In ROI method, the AAL template with 90 ROIs was non-linearly aligned onto each brain MRI. Then, the normalized GM volumes in the 90 ROIs were quantified as features to train SVRs for clinical score prediction. In LBM method, 50 anatomical landmarks [11] were used to locate 50 patches (size: 24 × 24 × 24) from each brain MRI. Then, morphological features were extracted from these patches to train SVRs for clinical score prediction. In DM2L method, the same set of patches used in LBM was used to construct a multi-task multi-branch CNN, where the identification of categorical labels was included as an auxiliary task to assist the prediction of clinical scores. Each patch was processed by a specific sub-network to learn patch-wise features, and then all patch-wise features were merged to learn higher-level feature for joint regression and classification.
To evaluate the contributions of two major components of our method (i.e., dementia attention and joint clinical score prediction), we compare MWAN with its two variants, called MTN and MWAN-S, respectively. In MTN, we removed the dementia block and trained the backbone FCN for joint clinical score prediction. In MWAN-S, we trained the weakly-supervised attention network to predict clinical scores independently. Note that three competing methods (i.e., VBM, ROI, and LBM) also construct individual SVRs to predict three types of clinical scores. To evaluate the effectiveness of the trainable dementia attention block in MWAN, we compared it with the offline method based on class activation map (CAM) [12]. Specifically, we built the CAM upon the backbone FCN to perform weakly-supervised discriminative localization after network training.
Prediction Results:
The experimental results obtained by seven methods trained on ADNI-1 and tested on ADNI-2 (or trained on ADNI-2 and tested on ADNI-1) are summarized in Table 1 (or Table 2). From these tables, we at least have the following four observations. First, deep learning methods (i.e., DM2L, MTN, MWAN-S, and MWAN) yield better results than conventional learning methods (i.e., VBM, ROI, and LBM) on both datasets, suggesting the effectiveness of task-oriented feature learning for regression model construction. Second, our MWAN and the state-of-the-art DM2L methods perform better than MTL (i.e., a variant of MWAN without automated dementia attention). This implies that, without preselecting (in DM2L) or automatically detecting (in our MWAN) discriminative brain regions, it is practically challenging to develop deep learning models with the whole-brain MRI for dementia diagnosis, considering that the early stage of dementia may only cause subtle structural changes. Third, MWAN consistently outperforms DM2L on both datasets, which implies that performing task-oriented discriminative localization in an end-to-end framework is desired in the task of clinical score prediction. Fourth, MWAN is superior to its variant MWAN-S, which suggest that jointly predicting multiple clinical scores could provide complementary information to further improve the performance.
Table 1.
Prediction results on ADNI-2 obtained by models trained on ADNI-1.
| Method | CDRSB | ADAS-Cog | MMSE | |||
|---|---|---|---|---|---|---|
| CC | RMSE | CC | RMSE | CC | RMSE | |
| VBM | 0.278 | 2.010 | 0.290 | 7.406 | 0.289 | 2.889 |
| ROI | 0.380 | 1.893 | 0.360 | 7.358 | 0.325 | 2.899 |
| LBM | 0.431 | 1.772 | 0.527 | 6.245 | 0.331 | 2.754 |
| DM2L | 0.533 | 1.666 | 0.565 | 6.200 | 0.567 | 2.373 |
| MTN | 0.447 | 1.685 | 0.539 | 6.308 | 0.458 | 2.595 |
| MWAN-S | 0.616 | 1.589 | 0.631 | 5.874 | 0.603 | 2.263 |
| MWAN (Ours) | 0.621 | 1.503 | 0.648 | 5.701 | 0.613 | 2.244 |
Table 2.
Prediction results on ADNI-1 obtained by models trained on ADNI-2.
| Method | CDRSB | ADAS-Cog | MMSE | |||
|---|---|---|---|---|---|---|
| CC | RMSE | CC | RMSE | CC | RMSE | |
| VBM | 0.197 | 1.851 | 0.146 | 6.382 | 0.208 | 2.685 |
| ROI | 0.190 | 2.024 | 0.205 | 6.507 | 0.211 | 2.710 |
| LBM | 0.417 | 1.922 | 0.512 | 5.835 | 0.435 | 2.664 |
| DM2L | 0.468 | 1.628 | 0.580 | 5.426 | 0.502 | 2.428 |
| MTN | 0.463 | 1.680 | 0.526 | 5.944 | 0.424 | 2.594 |
| MWAN-S | 0.512 | 1.639 | 0.556 | 5.593 | 0.488 | 2.503 |
| MWAN (Ours) | 0.564 | 1.569 | 0.611 | 5.525 | 0.532 | 2.414 |
Localization Results:
In Fig. 2, we show the attention maps predicted by the offline CAM and our end-to-end MWAN models for 4 AD subjects from ADNI-2, with models trained on ADNI-1. From Fig. 2, we can see that the attention maps generated by our MWAN method are relatively more precise than those generated by CAM. For example, MWAN clearly highlights the regions of hippocampus and amygdala, and the discriminative capacity of these brain regions for dementia diagnosis has been validated in previous studies. In contrast, the attention maps generated by CAM contain more noise. These results imply that learning the dementia attention block in an end-to-end framework can more precisely localize discriminative brain regions for clinical score prediction.
Fig. 2.

Attention maps predicted by CAM [12] (with the backbone FCN) and our MWAN method, respectively, for four different AD subjects from ADNI-2.
In Fig. 3, we show four subjects with different categorical labels (i.e., NC, sMCI, pMCI, and AD) and their corresponding attention maps generated by our MWAN method. From Fig. 3, we can see that the attention map for the NC subject nearly highlights all spatial locations with heat values (i.e., red color), which implies that there is no clear difference between these locations in identifying NC subjects (i.e., no abnormalities). Along the progression from NC to AD, we can observe that the heat values (i.e., red color) in the attention maps are gradually decreased (i.e., changed to blue) at most brain locations, while they are eventually accumulated at the hippocampal regions. These results suggest that the attention maps generated by our MWAN method could also provide additional information regarding the disease progression, by uncovering the potentially gradual atrophic process of the human brain due to dementia.
Fig. 3.
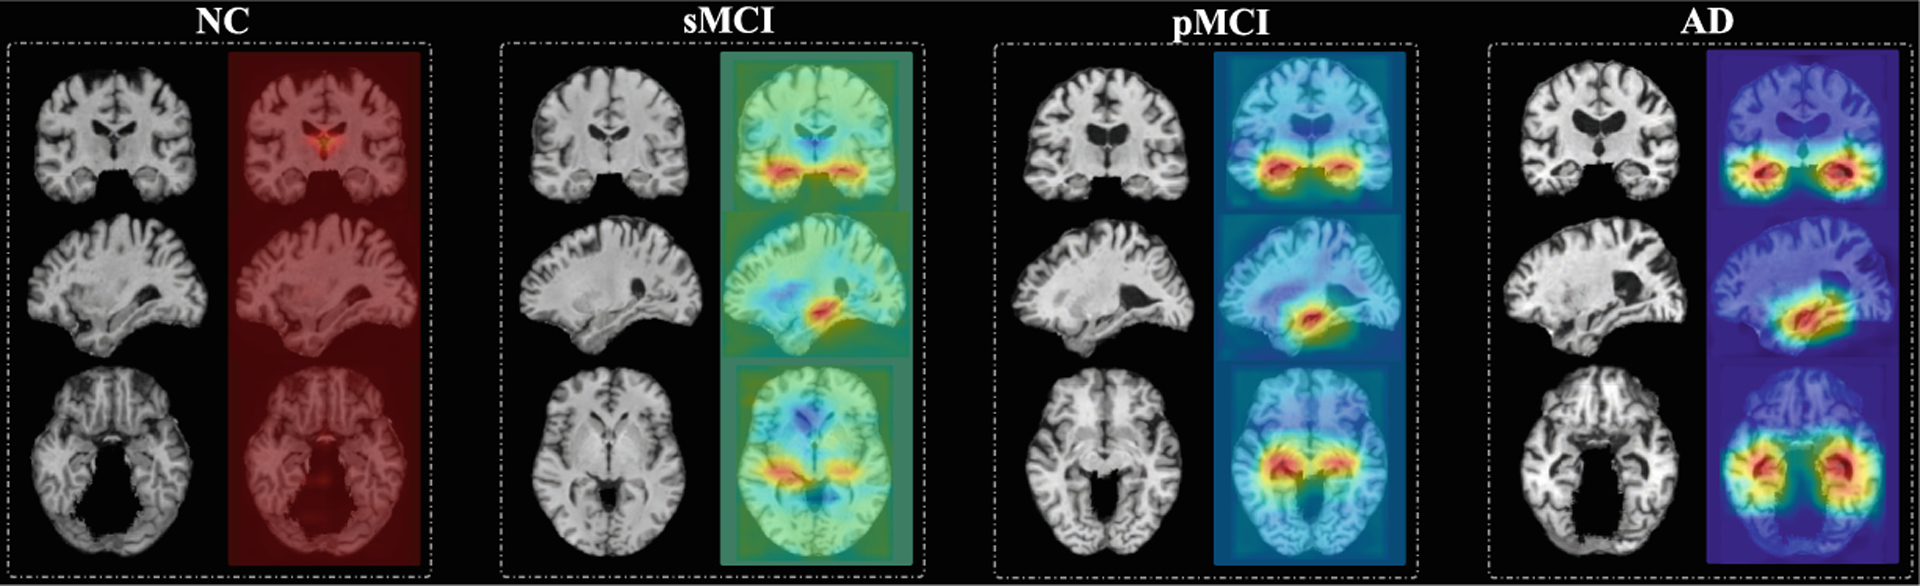
Attention maps produced by our MWAN for MRIs with four different categorical labels (i.e., NC, sMCI, pMCI, and AD) shown in three views, respectively.
4. Conclusion
In this paper, we have proposed a multi-task weakly-supervised attention network to automatically identify dementia-sensitive brain locations from the whole-brain MR images for end-to-end prediction of multiple clinical scores. Experimental results on two public datasets have demonstrated the effectiveness of our method in both automated discriminative localization and clinical score prediction. As the future work, we will extend our current model to jointly predict longitudinal clinical scores for dementia prognosis. In addition, considering that our current dementia attention block works on downsampled FCN feature maps, further improving it for discriminative localization at higher resolution could also be an interesting and promising direction.
Acknowledgements.
This work was supported in part by NIH grants (EB008374, AG041721, AG042599, and EB022880).
Footnotes
References
- 1.Baron J, et al. : In vivo mapping of gray matter loss with voxel-based morphometry in mild Alzheimer’s disease. NeuroImage 14(2), 298–309 (2001) [DOI] [PubMed] [Google Scholar]
- 2.Frisoni GB, et al. : The clinical use of structural MRI in Alzheimer disease. Nat. Rev. Neurol 6(2), 67 (2010) [DOI] [PMC free article] [PubMed] [Google Scholar]
- 3.Jagust W: Vulnerable neural systems and the borderland of brain aging and neurodegeneration. Neuron 77(2), 219–234 (2013) [DOI] [PMC free article] [PubMed] [Google Scholar]
- 4.Lian C, et al. : Hierarchical fully convolutional network for joint atrophy localization and Alzheimer’s disease diagnosis using structural MRI. IEEE Trans. Pattern Anal. Mach. Intell (2019, in press). 10.1109/TPAMI.2018.2889096 [DOI] [PMC free article] [PubMed] [Google Scholar]
- 5.Liu M, et al. : Joint classification and regression via deep multi-taskmulti-channel learning for Alzheimer’s disease diagnosis. IEEE Trans. Biomed. Eng 66, 1195–1206 (2018) [DOI] [PMC free article] [PubMed] [Google Scholar]
- 6.Liu M, et al. : Weakly supervised deep learning for brain disease prognosis using MRI and incomplete clinical scores. IEEE Trans. Cybern (2019, in press). 10.1109/TCYB.2019.2904186 [DOI] [PMC free article] [PubMed] [Google Scholar]
- 7.O’Bryant SE, et al. : Staging dementia using clinical dementia rating scale sum of boxes scores: a Texas Alzheimer’s research consortium study. Arch. Neurol 65(8), 1091–1095 (2008) [DOI] [PMC free article] [PubMed] [Google Scholar]
- 8.Rathore S, et al. : A review on neuroimaging-based classification studies and associated feature extraction methods for Alzheimer’s disease and its prodromal stages. NeuroImage 155, 530–548 (2017) [DOI] [PMC free article] [PubMed] [Google Scholar]
- 9.Sabuncu MR, et al. : Clinical prediction from structural brain MRI scans: a large-scale empirical study. Neuroinformatics 13(1), 31–46 (2015) [DOI] [PMC free article] [PubMed] [Google Scholar]
- 10.Yang J, et al. : Weakly supervised coupled networks for visual sentiment analysis. In: CVPR, pp. 7584–7592 (2018) [Google Scholar]
- 11.Zhang J, et al. : Detecting anatomical landmarks for fast Alzheimer’s disease diagnosis. IEEE Trans. Med. Imaging 35(12), 2524–2533 (2016) [DOI] [PMC free article] [PubMed] [Google Scholar]
- 12.Zhou B, et al. : Learning deep features for discriminative localization. In: CVPR, pp. 2921–2929. IEEE; (2016) [Google Scholar]
- 13.Zhou J, et al. : Modeling disease progression via multi-task learning. NeuroImage 78, 233–248 (2013) [DOI] [PubMed] [Google Scholar]