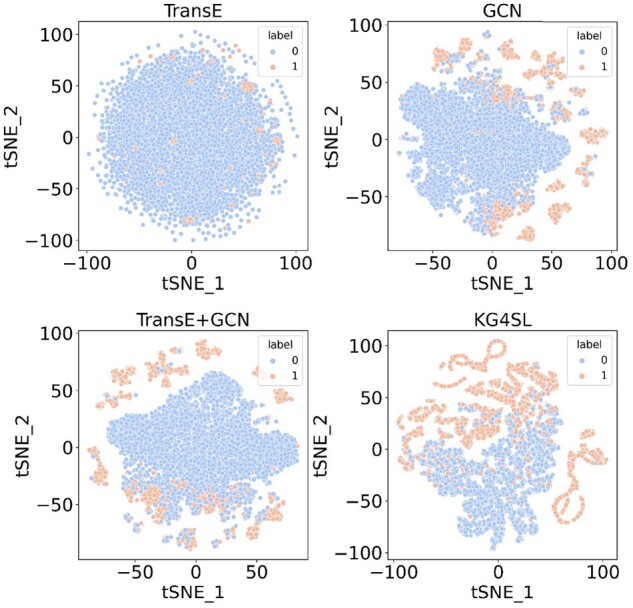
Fig. 4.

Visualization of SL interaction network. Link embeddings are generated by different models of gene–gene pairs in the SL matrix. Dot colors indicate whether there is an SL relationship between a pair of genes. TransE or GCN alone cannot distinguish the two types of links well as they only capture information from the KG or SL interaction, whereas KG4SL can distinguish the two link embeddings, demonstrating its ability to learn from both the SL network and the KG
