

Abstract
Ru nanoparticles (NPs) and single atoms (SAs)‐based materials have been investigated as alternative electrocatalysts to Pt/C for hydrogen evolution reaction (HER). Exploring the dominant role of atomic‐ and nano‐ruthenium as active sites in acidic and alkaline media is very necessary for optimizing the performance. Herein, an electrocatalyst containing both Ru SAs and NPs anchored on defective carbon (RuSA+NP/DC) has been synthesized via a Ru–alginate metal–organic supramolecules conversion method. RuSA+NP/DC exhibits low overpotentials of 16.6 and 18.8 mV at 10 mA cm−2 in acidic and alkaline electrolytes, respectively. Notably, its mass activities are dramatically improved, which are about 1.1 and 2.4 times those of Pt/C at an overpotential of 50 mV in acidic and alkaline media, respectively. Theoretical calculations reveal that Ru SAs own the most appropriate H* adsorption strength and thus, plays a dominant role for HER in acid electrolyte, while Ru NPs facilitate the dissociation of H2O that is the rate‐determining step in alkaline electrolyte, leading to a remarkable HER activity.
Keywords: electrocatalysts, hydrogen evolution reaction, metal–organic supramolecules, ruthenium, single atoms
Defective carbon anchored Ru single atoms (SAs) and nanoparticles (NPs) is prepared, and exhibits super hydrogen evolution reaction (HER) activity in both acidic and alkaline media. Theoretical calculations reveal that Ru SAs are inclined to adsorption of H* that is critical for acidic HER, and Ru NPs facilitate the dissociation of H2O that is the rate‐determining step in alkaline medium.

1. Introduction
The hydrogen evolution reaction (HER) is a fundamental electrochemical process occurring during water electrolysis, and the resulted hydrogen is most promising clean and renewable energy. However, its utilization is limited by its high overpotential and sluggish kinetics.[ 1 , 2 ] To date, precious metal Pt has been the most important component of HER electrocatalysts in both acidic and alkaline electrolytes. However, considering the high cost of Pt, exploring cost‐effective and highly active alternatives to the metal is urgent. Recently, Ru has drawn significant attention as a cost‐effective alternative to Pt, as the hydrogen bond strengths of both the metals are similar.[ 3 , 4 , 5 ] Many highly efficient and stable Ru‐based electrocatalysts have been reported for the HER, such as Ru nanoparticles (NPs) in nitrogenated holey C2N layers (Ru@C2N) and graphene nanoplatelets (Ru@GnP).[ 6 , 7 ] To further enhance atom utilization efficiency, single atom catalysts (SACs) were studied for the HER in both acid and alkaline media.[ 8 , 9 ] For instance,
Ru single atoms (SAs) dispersed on amorphous phosphorus nitride imide nanotubes have been found to exhibit excellent HER activity and stability in acidic media.[ 10 ] In acidic media, the HER mainly involves the adsorption of H* and generation and desorption of H2.[ 11 ] The strength of H* adsorption determines the HER catalytic activity. However, the mechanism is significantly different in an alkaline medium. Before the adsorption of H*, an initial step of H2O dissociation (H2O + e− → H* + OH−) is required to break the H—OH bond, which would then generate H*.[ 12 ] The high energy barrier for H2O dissociation retards the HER kinetics in alkaline media by two or three orders of magnitude compared to that in acidic media, and this determines the overall reaction rate. Although isolated atoms can adsorb H* moderately, it may be insufficient for H2O dissociation. This, in turn, hinders the generation of H*, thus lowering the alkaline HER kinetics.[ 13 , 14 ] Although some Ru SACs with good alkaline HER activities have been reported, these catalysts usually contain considerable amounts of NPs.[ 15 , 16 , 17 ] Previous studies have shown that NPs may be more active for alkaline HER.[ 7 , 14 , 18 , 19 ] In this regard, an electrocatalyst comprising both SAs and NPs is expected to reduce the metal usage and at the same time, ensure super catalytic activities in both acidic and alkaline media. Recently, Kim and Tiwari et al. implanted Ru SAs and nitrided‐Ru NPs on N‐doped‐graphitic matrix, and superior HER performances compared to commercial Pt/C catalysts were observed in both acidic and alkaline media,[ 20 ] and the adsorption of H* is emphasized for the reaction mechanism.
Sodium alginate is a cheap ocean‐sourced polysaccharide extracted from abundant brown alga and is rich in hydrophilic groups such as —OH and —COO—.[ 21 ] Sodium alginate can coordinate with multivalent metal ions (such as Co2+, Ni2+, and Ru3+) to form a unique “egg‐box” structured metal–organic supramolecule (MOSs), as described in Figure 1a.[ 22 , 23 ] Such a three dimensional (3D) architecture allows an efficient dispersion and immobilization of the metal ions in the framework. Importantly, the “egg‐box” structure of MOSs are adjustable, such that metal ions can be partially exchanged with other cations (such as H+ and Zn2+),[ 24 , 25 ] thereby serving as fences to expand the spatial distance between the target metal ions. This, in turn, could effectively prevent metal agglomeration. As evident from our previous studies,[ 26 , 27 ] this feature allows the controllable synthesis of metal (SAs and NPs)/carbon nanocomposites through carbonization of MOSs by tuning the ratios of the metal ions in the “egg‐box.” Moreover, for an electrocatalyst including Ru SAs and NPs, it is very important to distinguish the role of Ru SAs and NPs for the HER in both acid and alkaline media.
Figure 1.
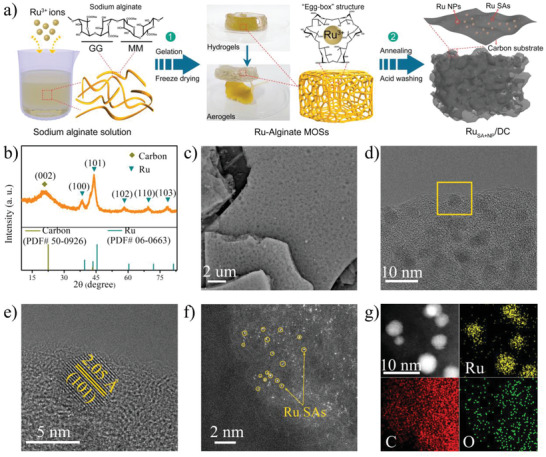
a) Schematic diagram of the synthetic route. b) XRD pattern, c) SEM image, d) TEM, e) HRTEM image, f) HAADF‐STEM image, and g) EDS mapping images of the synthesized RuSA+NP/DC electrocatalyst.
In this study, we synthesized a Ru‐based electrocatalyst containing both SAs and NPs anchored on defective carbon (RuSA+NP/DC) by simply carbonizing Ru–alginate MOSs. The synthesized RuSA+NP/DC electrocatalyst exhibits ultralow η 10 of 16.6 and 18.8 mV in acidic and alkaline media, respectively, comparable or even surpassing those of the commercial Pt/C electrocatalysts (16.5 and 32.2 mV, respectively) and most of the recently reported electrocatalysts. Notably, it exhibits remarkably high mass activities that are about 1.1 and 2.4 times that of 20 wt% Pt/C electrocatalysts at an overpotential of 50 mV in acidic and alkaline media, respectively. Theoretical calculations reveal that although isolated Ru atoms on defective carbon (DC) possess optimal H* binding strength, exhibiting remarkable acidic HER activity, they cannot efficiently dissociate H2O molecules, thus leading to sluggish kinetics in alkaline electrolytes. On the other hand, Ru NPs on DC can efficiently dissociate H2O to H*, thus increasing the alkaline HER activity remarkably.
2. Result and Discussion
Schematic diagram of the synthetic route is shown in Figure 1a. First, Ru–alginate MOSs hydrogels were obtained by a simple self‐assembly method using sodium alginate and ruthenium chloride as precursors, which further transformed into Ru–alginate MOS aerogels upon freeze drying.[ 28 , 29 ] The RuSA+NP/DC composite was prepared by annealing Ru–alginate MOSs aerogels under Ar atmosphere at 1000 °C for 1.5 h. More details can be found in the Experimental Section of Supporting Information. X‐ray diffraction (XRD) pattern of RuSA+NP/DC clearly confirms the conversion of Ru3+ ions to metallic Ru (Figure 1b and Figure S1, Supporting Information). The broad peak from 22° to 25° is attributed to the carbon generated from the carbonization of alginate macromolecules. The other diffraction peaks at 38.4°, 44.0°, 58.3°, 69.4°, and 78.4° correspond to the (100), (101), (102), (110), and (103) planes, respectively, of Ru NPs (JCPDS 06–663). Field emission‐scanning electron microscopy (FESEM) image shows that RuSA+NP/DC has a 3D foam board‐like structure with abundant pores on both surface and the interior (Figure 1c). This is attributed to the release of CO2 upon the decomposition of alginate during annealing.[ 30 ] The porous structure exposes more active sites and provides large contact areas with the electrolyte. Transmission electron microscopy (TEM) images show that Ru NPs with a diameter of 2–5 nm is almost homogeneously distributed on the carbon substrate (Figure 1d and Figure S2, Supporting Information), consistent with the EDS analysis (Figures S3 and S4, Supporting Information). The selected‐area electron diffraction pattern can be well‐indexed to the (100), (101), (101), (110), (102), (103), and (200) planes of hexagonal Ru (Figure S5a, Supporting Information), respectively. In addition, two set of lattice fringes with interplanar spacings of 2.05 and 2.34 Å are observed in the high‐resolution TEM image (Figure 1e and Figure S5b, Supporting Information). These can be ascribed to the (101) and (100) facets of hexagonal Ru, respectively, in agreement with the XRD analysis. To investigate the Ru SAs in RuSA+NP/DC, high‐angle annular dark field scanning transmission electron microscopy (HAADF‐STEM) images were captured. The large number of bright spots circled in yellow denotes the Ru SAs, which are atomically dispersed in the carbon matrix (Figure 1f). The defect carbon was identified from the Raman spectrum. All these analyses confirm the successful synthesis of RuSA+NP/DC. Furthermore, RuSA/DC was also prepared using the same method by decreasing the concentration of Ru3+. As shown in Figure S6, Supporting Information, no signals corresponding to Ru NPs were detected in the XRD pattern and TEM images, and rich bright dots corresponding to Ru SAs were observed in the HAADF‐STEM image, indicating the formation of RuSA/DC. EDS mappings of RuSA+NP/DC and RuSA/DC (Figure 1g and Figure S6f, Supporting Information) show that all the elements, including Ru, C, and O, are uniformly distributed over the entire sample, wherein O is derived from the carbon substrate carbonized from the alginate.
The surface area and pore size distributions of the samples were determined from the N2 adsorption–desorption isotherms (Figure 2a and Figure S7, Supporting Information). The combination of type I and type IV adsorption isotherms and H4 hysteresis loop, suggests that the RuSA+NP/DC catalyst has a highly porous structure with abundant macro‐, meso‐, and micro‐pores,[ 31 ] in agreement with the FESEM images. The Brunauer–Emmett–Teller surface areas of all the RuSA+NP/DC samples were in the range of 624.6–721.8 m2 g−1, and the corresponding Barret–Joyner–Halenda pore diameters were ∼17.5 and 40.3 Å, which is consistent with the adsorption–desorption isotherms. The high surface area and multimodal porous structure of RuSA+NP/DC expose more number of active sites and facilitate the mass transport, which are beneficial for the catalytic process.[ 32 ] The Raman spectra display two distinct peaks at about 1320 and 1600 cm−1 (Figure 2c and Figure S8, Supporting Information), corresponding to the characteristic D (defects or disordered carbon) and G bands (graphitic or ordered carbon), respectively, of the carbon matrix.[ 33 , 34 ] The high I D/I G ratio suggests that abundant intrinsic defects are generated on the carbon framework carbonized of MOSs, providing rich trapping sites for Ru SAs via strong interaction between the d band state of the metal atoms and 2π antibond state of the carbon atoms.[ 35 ]
Figure 2.

a) N2 adsorption–desorption isotherms, b) corresponding pore diameter distribution, and c) Raman spectrum of RuSA+NP/DC. d) High‐resolution XPS spectra of Ru 3d and C 1s for samples before and after the HER. e) Ru K‐edge XANES and f) FT‐EXAFS spectra of RuSA+NP/DC, metallic Ru, and RuO2. g) Ru K‐edge XANES spectra and h) FT‐EXAFS spectra of samples before and after the HER.
The structure and surface chemistry of the catalysts before and after the HER were first investigated by XRD and X‐ray photoelectron spectroscopy (XPS). The diffraction peaks corresponding to hexagonal Ru are clearly observed in the XRD patterns of the samples after the HER (Figure S9, Supporting Information), implying a perfect preservation of the Ru NPs and hence, an excellent structural stability of the catalyst. The XPS survey spectrum (Figure S10, Supporting Information) reveals the presence of Ru, C, and O in the samples. High‐resolution XPS spectra of Ru 3d and C 1s (Figure 2d) indicate a C—C peak at 284.6 eV and C—O peak at 285.8 eV in the C 1s spectrum;[ 36 ] additionally, two kinds of Ru species are resolved. The first peak of Ru 3d5/2 is located at ∼280.4 eV, corresponding to metallic Ru(0) (wine, Ru‐1). The second peak (orange, Ru‐2) is located at a relatively high energy, ∼281.1 eV, indicating a slightly positive‐charged Ru species, similar to Ru SAs observed previously.[ 10 , 37 ] This is consistent with the existence of both Ru NPs and Ru SAs in the catalyst, as evident from the TEM and HADDF‐STEM images. The NPs and SAs account for 68.6% and 31.4% of the total Ru content, respectively. After the catalysis, although the peak positions in the XPS spectra do not change, the peak proportions are different from those before the catalysis. After the HER in 0.5 m H2SO4, the relative content of Ru SA increased to 36.1%, whereas the relative content of metallic Ru(0) decreased to 63.9%. In comparison, after the HER in 1 m KOH, the proportion of metallic Ru(0) increased (69.4%), whereas that of Ru SAs decreased (30.6%). The metal NPs/SAs‐based electrocatalysts are generally suffered from the leaching or aggregation of active metal centers during the catalytic process. Due to the corrosiveness of acidic electrolyte, the Ru NPs are more likely to be leached during the catalytic process in 0.5 m H2SO4, diminishing the content of Ru NPs, thus leading to the increase of relative content of Ru SAs. Compared with 0.5 m H2SO4, the leaching of Ru NPs is alleviated in 1 m KOH, where the aggregation becomes dominant, giving rise to the increase of relative content of metallic Ru. These results are also demonstrated by content changes for Ru NPs and SAs before and after electrochemical test in 0.5 m H2SO4 and 1 m KOH (Table S1, Supporting Information).
To further investigate the chemical environment and electronic structures of the Ru species, X‐ray absorption near‐edge structure (XANES) and extended X‐ray absorption fine structure (EXAFS) spectroscopies were performed. Figure 2e shows the Ru K‐edge XANES spectra of RuSA+NP/DC, Ru foil, and RuO2. The spectrum of RuSA+NP/DC is very similar to that of the Ru foil but remarkably different from that of RuO2, demonstrating that metallic Ru is the dominant Ru species in RuSA+NP/DC. In addition, the peak intensity of the white line of RuSA+NP/DC is slightly higher than that of the Ru foil, indicating the slightly oxidized electronic structure of the Ru species due to the presence of Ru SAs. The Fourier transform (FT) of the EXAFS curves of RuSA+NP/DC, Ru foil, and RuO2 are depicted in Figure 2f. The obvious main peak centered at 2.4–2.6 Å in the spectrum of RuSA+NP/DC can be ascribed to the Ru–Ru interactions in the Ru NPs, which are similar to that in the Ru foil. Besides, a minor peak at 1.8–1.9 Å is also observed in the spectrum of RuSA+NP/DC, and this can be attributed to the backscattering between Ru SAs and light elements, such as the C and O elements in the material. As reflected by the spectrum of RuO2, the Ru—O path peak is located at about 1.55 Å, which is quite different from that of RuSA+NP/DC (1.8–1.9 Å), indicating that the minor peak is caused not by the backscattering between Ru and O, but by the backscattering between Ru and adjacent C. This is also in agreement with a previous report on atomically dispersed materials,[ 17 ] thereby demonstrating the formation of Ru SAs. According to the fitting results and detailed parameters (Figure S11 and Tables S2, Supporting Information), the coordination numbers of Ru—C are in the range of 3–4 for both samples before and after HER test, indicating that the structures of Ru SAs are RuC3 and RuC4 moieties. Therefore, Ru NPs and SAs coexist in the catalyst, which is consistent with the XRD, TEM, HAADF‐STEM, and XPS analyses. After the HER in 0.5 m H2SO4, the XANES curve was shifted toward high photon energy, indicating an increase in the content of Ru SAs with high valence state. On the other hand, in 1 m KOH, a small shift toward low photon energy was observed due to the increased Ru NPs content (Figure 2g). These results are in accordance with the above XPS analysis. The FT‐EXAFS spectra (Figure 2h) of all the samples before and after the HER had the same shape, without any change in the peak positions. This demonstrates their similar local atomic arrangements and excellent catalytic stability.[ 38 ]
The HER catalytic performances of the samples were investigated in both 0.5 m H2SO4 and 1 m KOH. Apparently, the alginate carbonized DC displays a poor HER activity (Figure S12a, Supporting Information) in 0.5 m H2SO4 (η 10 > 500 mV). When isolated Ru atoms were anchored on DC, the catalytic activity increased dramatically with increasing content of Ru atoms (Figure S12a, Supporting Information). Theoretically, the activity can be further improved by increasing the Ru content in RuSA/DC.[ 26 , 39 ] However, due to the large cohesive energy, Ru SAs easily aggregate into clusters/NPs, resulting in a low metal loading in RuSA/DC. Since we also need to prevent the aggregation, which is a huge challenge in the synthesis of SACs, the Ru content could not be increased further.[ 40 , 41 ] The lowest η 10 of RuSA/DC attained was 35.5 mV when the Ru content was 0.80 wt%, as measured by inductively coupled plasma (ICP). Notably, RuSA/DC exhibited superior HER activity compared to commercial Ru/C catalysts (46.9 mV), demonstrating the significant advantages of SAs in catalyzing the acidic HER. Besides Ru SAs, a further increase in the Ru content leads to the formation of Ru NPs, forming RuSA+NP/DC. The HER activity of RuSA+NP/DC is remarkably enhanced due to the considerable increase in the numbers of active sites. The best RuSA+NP/DC sample displays an ultralow η 10 of 16.6 mV in 0.5 m H2SO4 (Figure 3a and Figures S13–S15, Supporting Information), which is comparable to that of the commercial Pt/C catalyst (16.5 mV). The Ru content in this sample of RuSA+NP/DC was measured to be 11.8 wt% by ICP. Surprisingly, the acidic HER activity of RuSA+NP/DC outperforms most of the recently reported HER electrocatalysts (Figure 3f and Table S3, Supporting Information).
Figure 3.

HER polarization curves of RuSA+NP/DC, RuSA/DC, commercial Pt/C, and commercial Ru/C in a) 0.5 m H2SO4 and b) 1 m KOH. c) Comparison of mass activities of RuSA+NP/DC and commercial Pt/C at overpotentials of 10, 30, and 50 mV in 0.5 m H2SO4 and 1 m KOH. Stability test of RuSA+NP/DC and commercial Pt/C before and after 2000 cycles in d) 0.5 m H2SO4 and e) 1 m KOH. Comparison of η 10 values for RuSA+NP/DC, 20% commercial Pt/C and other recently reported HER electrocatalysts in f) acidic and g) alkaline media.
Similar to that in acidic media, the HER activity of RuSA/DC was superior to that of DC in 1 m KOH, and it improved with increasing Ru content due to the increased number of active sites (Figure S12b, Supporting Information). The best RuSA/DC sample exhibits a low η 10 of 51.4 mV. Unlike that in an acidic medium, the HER activity of RuSA/DC in 1 m KOH is inferior to that of the commercial Ru/C catalysts (43.9 mV), indicating that Ru SAs may be insufficient for the HER in alkaline media. With the formation of Ru NPs in the catalyst, the HER activity in the alkaline media was dramatically improved. Thus, Ru NPs may have a higher contribution compared to Ru SAs toward the HER activity in alkaline media. Figure 3b and Figures S16 and S17, Supporting Information, suggest that the best η 10 of RuSA+NP/DC is as low as 18.8 mV, which significantly outperforms that of the commercial Pt/C catalyst (32.2 mV). It is worth mentioning that this value is far beyond those of most of the other Pt or non‐Pt electrocatalysts recently reported (Figure 3g and Table S4, Supporting Information). Therefore, RuSA+NP/DC is an outstanding HER electrocatalyst in both acidic and alkaline media.
The HER kinetics were further investigated from the Tafel plots. Figures S13–S14b and S16–S17b, Supporting Information, depict that the smallest Tafel slopes, 28.7 and 35.8 mV dec−1, were obtained for RuSA+NP/DC in the acidic and alkaline media, respectively. These are lower than those of the commercial Pt/C catalyst (29.5 and 48.2 mV dec−1), indicating the fastest reaction kinetics of RuSA+NP/DC in the acidic and alkaline media.[ 42 ] The Tafel slopes suggest that RuSA+NP/DC follows the Volmer–Tafel mechanism in acidic media, with the Tafel reaction, H* + H* → H2, determining the overall reaction, whereas it follows the Volmer–Heyrovsky mechanism in alkaline media, with the Heyrovsky reaction, H2O + e − + H* → H2 + OH−, being the rate‐determining step.[ 11 , 12 ] To investigate the reaction mechanism, it is necessary to account for the effect of acidic and alkaline media. To quantify the intrinsic active surface area of the electrocatalysts, the electrochemically active surface area (ECSA) was measured by double layer capacitance (C dl) using a cyclic voltammetry method.[ 43 ] Obviously, the highest C dl values of 77.6 and 121.6 mF cm−2 were observed for RuSA+NP/DC in the acidic and alkaline media (Figures S18–S22, Supporting Information), respectively. These correspond to ECSAs of 2217.1 and 3040.0 cm2 in the acidic and alkaline media, which are about 8.7 and 3.3 times higher, respectively, than those of the commercial Pt/C catalyst. Moreover, the underpotential deposition method was used to quantitatively analyze the number of active sites of RuSA+NP/DC and commercial Pt/C (Figure S23, Supporting Information). After calculation, the active site density of RuSA+NP/DC is 1.13 × 10¹⁴ sites per cm2, whereas it is 9.94 × 10¹³ sites per cm2 for that of Pt/C, demonstrating that the RuSA+NP/DC possesses more active sites than Pt/C.
Mass activity is an important factor in determining the catalyst cost. Apparently, RuSA+NP/DC exhibits higher mass activities than Pt/C in both acidic and alkaline media (Figure S24, Supporting Information). Specifically, at overpotentials of 10, 30, and 50 mV, the mass activities of RuSA+NP/DC are 0.03, 0.28, and 0.53 A mgRu −1 in acidic media and 0.02, 0.16, and 0.31 A mgRu −1 in alkaline media (Figure 3c), respectively, which exceed those of Pt/C (0.02, 0.26, and 0.48 A mgPt −1 [acidic media] and 0.01, 0.06, and 0.13 A mgPt −1 [alkaline media], respectively). To assess the catalytic efficiency, the turnover frequency (TOF) of the catalyst was calculated by assuming that all the metal atoms in the catalyst are active sites participating in the HER.[ 35 ] The least TOF for RuSA+NP/DC at overpotentials of 10, 20, and 30 mV were estimated to be 0.02, 0.14, and 0.27 H2 s−1 in 0.5 m H2SO4 and 0.01, 0.10, and 0.17 H2 s−1 in 1 m KOH (Figure S25, Supporting Information), respectively. These TOFs surpass those of Pt/C (0.015, 0.11, and 0.25 H2 s−1 in 0.5 m H2SO4 and 0.01, 0.03, and 0.06 H2 s−1 in 1 m KOH, respectively). Thus, besides the high geometric activity, RuSA+NP/DC also shows desirable mass activity and catalytic efficiency, enhancing the material utilization efficiency during industrial upscaling.
To probe the catalytic stability, accelerated degradation tests were performed. Figure 3d shows that the polarization curve of Pt/C is negatively shifted after 2000 cycles in 0.5 m H2SO4, with 1.8 mV change in η 10. In contrast, RuSA+NP/DC exhibits a small negative shift of 0.4 mV. In 1 m KOH, a small negative shift of 0.7 mV in η 10 is observed for RuSA+NP/DC after 2000 cycles (Figure 3e), which is much smaller than that of the commercial Pt/C catalyst (4.2 mV). These results provide strong evidences of the remarkable stabilities of the RuSA+NP/DC catalyst in acidic and alkaline media, and this is also confirmed by the corresponding i‐t tests (Figure S26, Supporting Information). Therefore, considering the high mass activity, high stability, and low price of Ru, it can be safely concluded that RuSA+NP/DC has significant advantages over Pt/C in cost and catalytic performance.
To verify the actual application, a two‐electrode electrolyzer using RuSA+NP/DC and commercial RuO2 as the cathode and anode, respectively (RuSA+NP/DC‖RuO2), were assembled and tested in 1 m KOH. Figure S27a, Supporting Information, shows that RuSA+NP/DC‖RuO2 requires a low cell voltage of 1.86 V to achieve a high current density of 100 mA cm−2, which is much smaller than that required by Pt/C‖RuO2 (1.96 V). Remarkably, it delivers a current density of 200 mA cm−2 at a cell voltage of 2.15 V, satisfying the requirements of industrial water splitting.[ 44 ] Besides, RuSA+NP/DC‖RuO2 exhibits excellent catalytic stability for water splitting. Figure S27b, Supporting Information, shows that after continuously operating for 30 h, RuSA+NP/DC‖RuO2 retains 76.5% of the initial current even at a high current density of 100 mA cm−2, outperforming Pt/C‖RuO2 (71.2%). Thus, owing to the high activity and stability, RuSA+NP/DC is a promising alternative HER electrocatalyst to Pt/C catalysts for practical water electrolysis.
To gain further insights into the role of SA and NP in the HER activities in the acidic and alkaline media, density functional theory (DFT) calculations were performed. Based on the experimental analysis, two common types of defective graphene—single and double defect graphene (DC‐1 and DC‐2)—were employed as carbon substrates. Ru SA and Ru55 NP were separately anchored on DC‐1 and DC‐2, forming RuSA@DC‐1 (RuC3), RuSA@DC‐2 (RuC4), RuNP@DC‐1, and RuNP@DC‐2 models (Figure S28, Supporting Information). The Sabatier principle states that a good acidic HER electrocatalyst should bind the adsorbed H* moderately.[ 45 , 46 ] Thus, binding strength of the adsorbed H* species (ΔE H*) is first calculated. The volcano plot (Figure 4a) shows that RuNP@DC‐1, RuNP@DC‐2, and Ru (001) exhibit more negative ΔE H* values compared to Pt (111), indicating that H* binds more strongly to the surface of the Ru NPs than to the surface of Pt. This will hinder H2 desorption on the surface of the Ru NPs, leading to a relatively high overpotential for the HER (η HER). In comparison, ΔE H* is largely weakened on RuSA@DC‐1 and RuSA@DC‐2, alleviating the difficulties in desorption and thereby lowering η HER and taking them closer to the center of the volcano plot. Moreover, the Gibbs free energy of H* (ΔG H*) was calculated. A moderate ΔG H* close to 0 eV is desired for a super acidic HER electrocatalyst.[ 17 ] Figure S29, Supporting Information, shows that RuSA@DC‐1 exhibits the most desirable ΔG H* of 0.12 eV, which is slightly better than that of RuSA@DC‐2 (0.20 eV), and significantly more promising than that of RuNP@DC‐1 (−0.36 eV), RuNP@DC‐2 (−0.39 eV), and Pt (111) (−0.28 eV), consistent with the volcano plot. Therefore, theoretically, Ru SA can catalyze HER in acidic media more efficiently. For an alkaline medium, despite the moderate ΔG H*, a low H2O dissociation barrier is essential for a superior alkaline HER electrocatalyst. Figure 4b shows that the energy barrier for H2O dissociation of RuSA@DC‐1 and RuSA@DC‐2 are as high as 1.09 and 1.12 eV, respectively, suggesting that Ru SA is insufficient for dissociating the H—OH bond, which hinders the H* formation and leads to sluggish alkaline HER kinetics. In contrast, Ru (001), RuNP@DC‐1, and RuNP@DC‐2 prominently reduce the energy barrier to 0.77, 0.56, and 0.54 eV, respectively, indicating that Ru NP can efficiently dissociate H2O, thereby facilitating the alkaline HER. Therefore, compared to Ru SA, Ru NP contributes more to the HER activity in an alkaline electrolyte. For the NP‐based models, a stronger adsorption free energy of H2O (ΔE H2O*) leads to lower energy barrier of H2O dissociation, according to the linear Brønsted–Evans–Polanyi relationship (Figure 4c).[ 47 ] However, this rule is not applicable to the SA‐based models (RuSA@DC‐1 and RuSA@DC‐2) (Figures S30 and S31, Supporting Information) due to the steric hindrance effects,[ 48 , 49 ] demonstrating that the size and structure of the metal‐centered sites significantly affect the H2O adsorption and dissociation, resulting in different HER activities in the alkaline media. Consequently, the dominant roles of Ru SA and NPs in various media have been revealed from theoretical calculation combining experiments, particularly the water dissociation step has been taken into account, which distinguished from the previous literatures (Table S5, Supporting Information). Few‐atom clusters are bridge between SA and NP. Herein, to illustrate the contributions of Ru clusters, DFT calculations were performed on the model of four Ru atoms anchored defective carbon (Rucluster@DC‐1). As shown in Figure S32, Supporting Information, both the ΔG H* value and H2O dissociation barrier of Rucluster@DC‐1 is between RuSA@DC‐1 and RuNP@DC‐1, suggesting that the HER activity of Ru cluster is between Ru SA and Ru NP in both acidic and alkaline media.
Figure 4.

a) Volcano plot of theoretical η HER versus ΔE H*. b) Kinetic barrier of H2O dissociation for different models. c) Correlation between ΔE H2O* and energy barrier of H2O dissociation. d) Differential charge density distributions, e) PDOS, and f) COHP of active Ru atom for RuNP@DC‐1 and adsorbed H2O. g) Differential charge density distributions, h) PDOS, and i) COHP of active Pt atom for Pt (111) and adsorbed H2O. For differential charge density distributions, the green and red regions represent positive and negative charges, respectively.
To gain insights into the effect of inherent electronic properties of Pt and Ru on H2O dissociation, differential charge density distribution analysis, Bader charge analysis, and projected density of states (PDOS) were performed on H2O‐adsorbed RuNP@DC‐1 and H2O‐adsorbed Pt (111). From Figure 4d,g, it is obvious that for both RuNP@DC‐1 and Pt (111), charge is transferred from metal atoms to H2O molecules. Due to this charge transfer, the H—O bond of the adsorbed H2O is significantly elongated. Compared with Pt (111), more charge transfer occurs on RuSA@DC‐1 (0.15 |e|), and the adsorbed H2O molecule is more likely to dissociate owing to its longer H—O distance (0.983 Å). The PDOS (Figure 4e,h) depicts that the Pt 5d band center is located far from the Fermi level (−2.43), while the Ru 4d‐band center moves upward toward the Fermi level (−1.26). According to the d‐band center theory, this change will lower the occupancy of the antibonding state of the H2O‐adsorbed RuNP@DC‐1 during the hybridization of the O 2p orbital with Ru 4d orbital (as indicated by the blue arrow), thereby increasing ΔE H2O*. The integrated‐crystal orbital Hamilton population value of Ru—O for RuNP@DC‐1 is −1.55 (Figure 4f,i), which is much lower than that of Pt—O in Pt (111) (−0.93), further demonstrating the strong bonding between the active surface Ru and ligand O atoms. Consequently, compared with Pt, H2O is more easily adsorbed and dissociated to H* on the surface of the Ru NPs.
3. Conclusion
In conclusion, a Ru‐based electrocatalyst containing both Ru SAs and NPs anchored on DC was developed by simply annealing Ru–alginate MOSs. The RuSA+NP/DC catalyst exhibits superior HER activities in acidic and alkaline media, with ultralow η 10 of 16.6 and 18.8 mV, respectively. Notably, the mass activities of RuSA+NP/DC at the overpotential of 50 mV are ∼1.8 and 4.4 times those of Pt/C in acidic and alkaline media, respectively. DFT calculations reveal the different roles of Ru SA and NPs in various media. Ru SAs efficiently optimize ΔG H*, leading to an outstanding HER activity in acidic media, while Ru NPs largely lower the energy barrier for H2O dissociation, facilitating the HER in alkaline media. Although the number of active sites and the activity of individual sites between Ru SA and NPs are difficult to be distinguished, we can get an enlightenment from this work; the amount of Ru NPs and SAs can be tuned in various media so that we can obtained the best optimized HER catalysts that is our purpose in future.
Conflict of Interest
The authors declare no conflict of interest.
Supporting information
Supporting Information
Acknowledgements
L.Z., H.J., and Y.W. contributed equally to this work. This work was supported by Taishan Scholar Program of Shandong Province, China (ts201712045), Doctoral Found of QUST (0100229001), the China Postdoctoral Science Foundation (2019M662312), the Postdoctoral Innovation Project of Shandong Province, the Qingdao Postdoctoral Application Research Project, and the National Science Foundation of China (No. 51872115).
Zhang L., Jang H., Wang Y., Li Z., Zhang W., Kim M. G., Yang D., Liu S., Liu X., Cho J., Exploring the Dominant Role of Atomic‐ and Nano‐Ruthenium as Active Sites for Hydrogen Evolution Reaction in Both Acidic and Alkaline Media. Adv. Sci. 2021, 8, 2004516. 10.1002/advs.202004516
Contributor Information
Wei Zhang, Email: weizhang@jlu.edu.cn.
Shangguo Liu, Email: liusg@qust.edu.cn.
Xien Liu, Email: liuxien@qust.edu.cn.
Jaephil Cho, Email: jpcho@unist.ac.kr.
Data Availability Statement
Research data are not shared.
References
- 1. Bai S., Xiong Y., Chem. Commun. 2015, 51, 10261. [DOI] [PubMed] [Google Scholar]
- 2. Wu Z., Zhao Y., Jin W., Jia B., Wang J., Ma T., Adv. Funct. Mater. 2020, 31, 2009070. [Google Scholar]
- 3. Bae S.‐Y., Mahmood J., Jeon I.‐Y., Baek J.‐B., Nanoscale Horiz. 2020, 5, 43. [Google Scholar]
- 4. Li Y., Abbott J., Sun Y., Sun J., Du Y., Han X., Wu G., Xu P., Appl. Catal., B 2019, 258, 117952. [Google Scholar]
- 5. Su J., Yang Y., Xia G., Chen J., Jiang P., Chen Q., Nat. Commun. 2017, 8, 14969. [DOI] [PMC free article] [PubMed] [Google Scholar]
- 6. Pu Z., Amiinu I. S., Kou Z., Li W., Mu S., Angew. Chem., Int. Ed. 2017, 56, 11559. [DOI] [PubMed] [Google Scholar]
- 7. Li F., Han G. F., Noh H. J., Ahmad I., Jeon I. Y., Baek J. B., Adv. Mater. 2018, 30, 1803676. [DOI] [PubMed] [Google Scholar]
- 8. Strizhak P. E., Theor. Exp. Chem. 2013, 49, 2. [Google Scholar]
- 9. Ramalingam V., Varadhan P., Fu H. C., Kim H., Zhang D., Chen S., Song L., Ma D., Wang Y., Alshareef H. N., He J. H., Adv. Mater. 2019, 31, 1903841. [DOI] [PubMed] [Google Scholar]
- 10. Yang J., Chen B., Liu X., Liu W., Li Z., Dong J., Chen W., Yan W., Yao T., Duan X., Wu Y., Li Y., Angew. Chem., Int. Ed. 2018, 57, 9495. [DOI] [PubMed] [Google Scholar]
- 11. Morales‐Guio C. G., Stern L. A., Hu X., Chem. Soc. Rev. 2014, 43, 6555. [DOI] [PubMed] [Google Scholar]
- 12. Wang J., Xu F., Jin H., Chen Y., Wang Y., Adv. Mater. 2017, 29, 1605838. [DOI] [PubMed] [Google Scholar]
- 13. Liu D., Li X., Chen S., Yan H., Wang C., Wu C., Haleem Y. A., Duan S., Lu J., Ge B., Ajayan P. M., Luo Y., Jiang J., Song L., Nat. Energy 2019, 4, 512. [Google Scholar]
- 14. Mao J., He C. T., Pei J., Chen W., He D., He Y., Zhuang Z., Chen C., Peng Q., Wang D., Li Y., Nat. Commun. 2018, 9, 4958. [DOI] [PMC free article] [PubMed] [Google Scholar]
- 15. Chen C. H., Wu D., Li Z., Zhang R., Kuai C. G., Zhao X. R., Dong C. K., Qiao S. Z., Liu H., Du X. W., Adv. Energy Mater. 2019, 9, 1803913. [Google Scholar]
- 16. Lai W. H., Zhang L. F., Hua W. B., Indris S., Yan Z. C., Hu Z., Zhang B., Liu Y., Wang L., Liu M., Liu R., Wang Y. X., Wang J. Z., Hu Z., Liu H. K., Chou S. L., Dou S. X., Angew. Chem., Int. Ed. 2019, 58, 11868. [DOI] [PubMed] [Google Scholar]
- 17. Lu B., Guo L., Wu F., Peng Y., Lu J. E., Smart T. J., Wang N., Finfrock Y. Z., Morris D., Zhang P., Li N., Gao P., Ping Y., Chen S., Nat. Commun. 2019, 10, 631. [DOI] [PMC free article] [PubMed] [Google Scholar]
- 18. Yu J., Guo Y., She S., Miao S., Ni M., Zhou W., Liu M., Shao Z., Adv. Mater. 2018, 30, 1800047. [DOI] [PubMed] [Google Scholar]
- 19. Kweon D. H., Okyay M. S., Kim S. J., Jeon J. P., Noh H. J., Park N., Mahmood J., Baek J. B., Nat. Commun. 2020, 11, 1278. [DOI] [PMC free article] [PubMed] [Google Scholar]
- 20. Tiwari J. N., Harzandi A. M., Ha M., Sultan S., Myung C. W., Park H. J., Kim D. Y., Thangavel P., Singh A. N., Sharma P., Chandrasekaran S. S., Salehnia F., Jang J.‐W., Shin H. S., Lee Z., Kim K. S., Adv. Energy Mater. 2019, 9, 1900931. [Google Scholar]
- 21. Lee K. Y., Mooney D. J., Prog. Polym. Sci. 2012, 37, 106. [DOI] [PMC free article] [PubMed] [Google Scholar]
- 22. Li L., Fang Y., Vreeker R., Appelqvist I., Mendes E., Biomacromolecules 2007, 8, 464. [DOI] [PubMed] [Google Scholar]
- 23. Li D., Lv C., Liu L., Xia Y., She X., Guo S., Yang D., ACS Cent. Sci. 2015, 1, 261. [DOI] [PMC free article] [PubMed] [Google Scholar]
- 24. Zou Y., Yang X., Lv C., Liu T., Xia Y., Shang L., Waterhouse G. I. N., Yang D., Zhang T., Adv. Sci. 2017, 4, 1600262. [DOI] [PMC free article] [PubMed] [Google Scholar]
- 25. Gu Y., Chen S., Ren J., Jia Y. A., Chen C., Komarneni S., Yang D., Yao X., ACS Nano 2018, 12, 245. [DOI] [PubMed] [Google Scholar]
- 26. Zhang L., Liu T., Chen N., Jia Y., Cai R., Theis W., Yang X., Xia Y., Yang D., Yao X., J. Mater. Chem. A 2018, 6, 18417. [Google Scholar]
- 27. Zhang L., Yang X., Cai R., Chen C., Xia Y., Zhang H., Yang D., Yao X., Nanoscale 2019, 11, 826. [DOI] [PubMed] [Google Scholar]
- 28. Li H., Zhao X., Liu H., Chen S., Yang X., Lv C., Zhang H., She X., Yang D., Small 2018, 14, 1802824. [DOI] [PubMed] [Google Scholar]
- 29. Ma N., Jia Y., Yang X., She X., Zhang L., Peng Z., Yao X., Yang D., J. Mater. Chem. A 2016, 4, 6376. [Google Scholar]
- 30. Liu L., Yang X., Ma N., Liu H., Xia Y., Chen C., Yang D., Yao X., Small 2016, 12, 1295. [DOI] [PubMed] [Google Scholar]
- 31. Xu T., Li D., Chen S., Sun Y., Zhang H., Xia Y., Yang D., Chem. Eng. J. 2018, 345, 604. [Google Scholar]
- 32. Li D., Jia Y., Chang G., Chen J., Liu H., Wang J., Hu Y., Xia Y., Yang D., Yao X., Chem 2018, 4, 2345. [Google Scholar]
- 33. Pimenta M. A., Dresselhaus G., Dresselhaus M. S., Cancado L. G., Jorio A., Saito R., Phys. Chem. Chem. Phys. 2007, 9, 1276. [DOI] [PubMed] [Google Scholar]
- 34. Ganesan K., Ghosh S., Krishna N. G., Ilango S., Kamruddin M., Tyagi A. K., Phys. Chem. Chem. Phys. 2016, 18, 2216. [DOI] [PubMed] [Google Scholar]
- 35. Zhang L., Jia Y., Gao G., Yan X., Chen N., Chen J., Soo M. T., Wood B., Yang D., Du A., Yao X., Chem 2018, 4, 194. [Google Scholar]
- 36. Wang B., Wang X., Zou J., Yan Y., Xie S., Hu G., Li Y., Dong A., Nano Lett. 2017, 17, 2003. [DOI] [PubMed] [Google Scholar]
- 37. Wang J., Wei Z., Mao S., Li H., Wang Y., Energy Environ. Sci. 2018, 11, 800. [Google Scholar]
- 38. Sun Y., Zhang X., Mao B., Cao M., Chem. Commun. 2016, 52, 14266. [DOI] [PubMed] [Google Scholar]
- 39. Yang A. W. X. F., Qiao B., Li J., Liu J., Zhang T., Acc. Chem. Res. 2013, 46, 1740. [DOI] [PubMed] [Google Scholar]
- 40. Qin R., Liu P., Fu G., Zheng N., Small Methods 2018, 2, 1700286. [Google Scholar]
- 41. Qiao B., Wang A., Yang X., Allard L. F., Jiang Z., Cui Y., Liu J., Li J., Zhang T., Nat. Chem. 2011, 3, 634. [DOI] [PubMed] [Google Scholar]
- 42. Tilak C. P. C. B. V., J. Appl. Electrochem. 1993, 23, 631. [Google Scholar]
- 43. Zhang Y., Gao L., Hensen E. J. M., Hofmann J. P., ACS Energy Lett. 2018, 3, 1360. [DOI] [PMC free article] [PubMed] [Google Scholar]
- 44. Bhandari R., Trudewind C. A., Zapp P., J. Cleaner Prod. 2014, 85, 151. [Google Scholar]
- 45. Medford A. J., Vojvodic A., Hummelshøj J. S., Voss J., Abild‐Pedersen F., Studt F., Bligaard T., Nilsson A., Nørskov J. K., J. Catal. 2015, 328, 36. [Google Scholar]
- 46. Nørskov J. K., Bligaard T., Rossmeisl J., Christensen C. H., Nat. Chem. 2009, 1, 37. [DOI] [PubMed] [Google Scholar]
- 47. Michaelides A., Liu Z.‐P., Zhang C., Alavi A., King D. A., Hu P., J. Am. Chem. Soc. 2003, 125, 3704. [DOI] [PubMed] [Google Scholar]
- 48. Li L., Wang X., Guo H., Yao G., Yu H., Tian Z., Li B., Chen L., Small Methods 2019, 3, 1900337. [Google Scholar]
- 49. Ling C., Li Q., Du A., Wang J., ACS Appl. Mater. Interfaces 2018, 10, 36866. [DOI] [PubMed] [Google Scholar]
Associated Data
This section collects any data citations, data availability statements, or supplementary materials included in this article.
Supplementary Materials
Supporting Information
Data Availability Statement
Research data are not shared.